Abstract
Accurate measurement of porosity is crucial for comprehensive performance evaluation of thermal barrier coatings (TBCs) on aero-engine blades. In this study, a novel data-driven predictive method based on terahertz time-domain spectroscopy (THz-TDS) was proposed. By processing and extracting features from terahertz signals, multivariate parameters were composed to characterize the porosity. Principal component analysis, which enabled effective representation of the complex signal information, was introduced to downscale the dimensionality of the time-domain data. Additionally, the average power spectral density of the frequency spectrum and the extreme points of the first-order derivative of the phase spectrum were extracted. These extracted parameters collectively form a comprehensive set of multivariate parameters that accurately characterize porosity. Subsequently, the multivariate parameters were used as inputs to construct an extreme learning machine (ELM) model optimized by the sparrow search algorithm (SSA) for predicting porosity. Based on the experimental results, it was evident that the predictive accuracy of SSA-ELM was significantly higher than the basic ELM. Furthermore, the robustness of the model was evaluated through K-fold cross-validation and the final model regression coefficient was 0.92, which indicates excellent predictive performance of the data-driven model. By introducing the use of THz-TDS and employing advanced signal processing techniques, the data-driven model provided a novel and effective solution for the rapid and accurate detection of porosity in TBCs. The findings of this study offer valuable references for researchers and practitioners in the field of TBCs inspection, opening up new avenues for improving the overall assessment and performance evaluation of these coatings.
1. Introduction
The evolution of aviation engines is a significant benchmark for assessing a nation’s technological capabilities, where the quality of their hot section components stands as a key determinant of engine performance. As the thrust-to-weight ratios and inlet temperatures rise, there is an increasing demand for higher temperature resistance in engine blades [1]. Therefore, thermal barrier coatings (TBCs) have emerged as crucial protective materials, lowering the working temperatures of the blades and ensuring the protection of hot section components. TBCs offer outstanding insulation properties and corrosion resistance. A typical TBC structure comprises the following three essential components: a ceramic layer (or top coat, TC), a bond coat (BC), and a substrate. The ceramic layer, with a thickness ranging from 100 to 600 μm, is predominantly composed of yttria-stabilized zirconia (YSZ), known for its low thermal conductivity and high coefficient of expansion [2,3,4,5]. Acting as an intermediary layer between the ceramic layer and the substrate, the BC is typically made of nickel-based or cobalt-based alloys, ensuring strong adhesion. The substrate is commonly fabricated from high-temperature nickel-based alloy materials. Over the operational lifespan of the TBCs, the formation of thermally grown oxides (TGO) between the TC and the BC can influence the coating’s performance [6]. Moreover, an additional critical factor that affects the overall performance of TBCs is the presence of porosity. During the preparation of TBCs using atmospheric plasma spraying technology, various types of pores can form within the coating due to thermal stress-induced thermal expansion mismatch, particle collisions and deposition, and excessive spraying velocity, leading to incomplete powder melting [7]. The presence of these pores affects the thermal resistance, mechanical properties, and service life of the TBCs [8]. Additionally, pores can serve as stress concentration points, leading to cracking and delamination of the TBCs. Therefore, accurately assessing the porosity of the TBCs is crucial for analyzing their overall performance, optimizing design, and enhancing reliability [9]. The development of nondestructive testing technology is considered to be an effective way to solve the difficult problem of predicting the life of thermal barrier coatings in aero-engines. At present, these methods are widely employed in classroom teaching and practical teaching in colleges and universities. For example, Anhui Polytechnic University has carried out a lot of research.
Currently, the measurement and evaluation of porosity is an important research direction in the field [10]. Traditional methods for assessing TBCs often involve destructive techniques, such as scanning electron microscopy to observe the microstructure of the coatings [11,12]. These methods require sample preparation through grinding and polishing, which not only damages the samples but also introduces measurement errors. Hence, the application of non-destructive testing (NDT) techniques, such as microwave [13,14], ultrasonic [15,16], X-ray [17,18], and thermal infrared technology [19,20] is undoubtedly a better choice for evaluating TBCs [21]. However, these methods have certain limitations that prevent precise testing in a stable environment. In our daily teaching, these methods have been employed in classroom teaching or practice teaching, and have achieved good results. But there are still drawbacks, and a better approach could be chosen. Microwave detection, for example, is susceptible to external interference from temperature and electromagnetic waves. Ultrasonic detection typically requires coupling agents and can penetrate metal layers, resulting in signal overlap and making analysis challenging. X-ray detection involves high radiation levels, necessitating safety precautions for personnel. Thermal infrared technology often requires sample heating, and it may not provide satisfactory results for materials with low thermal emissivity. Therefore, there is a pressing need for a safer and more effective NDT technique to accurately assess TBCs.
In recent years, terahertz time-domain spectroscopy (THz-TDS) has attracted wide attention as a non-destructive, efficient, non-ionizing, and high-resolution testing technique. Terahertz waves, with frequencies ranging between infrared and microwave (0.1 THz–10 THz), possess unique characteristics. Terahertz can be used for nondestructive testing. Wang et al. [22] proposed the application of a THz-TDS system in the measurement of dual-band absorption performance to analyze the sensing characteristics of analytes with different refractive indexes or thicknesses. Fu et al. [23] proposed the use of a terahertz meta-sensor platform for quantitative analysis and classification of volatile organic compounds in liquid phase and soil. Terahertz waves can penetrate non-metallic materials and have the advantage of characterizing material properties at a microscopic scale, indicating their potential for detecting thermal barrier coatings [24,25]. Due to their broad wavelength range, terahertz technology can capture information about microscopic pores, making it highly sensitive to pore shape and distribution in TBCs. For example, Fukuchi et al. [26] proposed the use of terahertz waves for measuring a TBC’s thickness. Davit et al. [27] used THz-TDS to detect alumina ceramic coatings and determined a linear relationship between the relative permittivity and porosity of different porous samples. Watanabe et al. [28] studied THz-TDS and found high transmittance (at 0.5 THz), and that the dielectric constant was closely related to the porosity of the coatings. Li et al. [29] cleverly used neural network regression prediction combined with THz-TDS to measure a TBC’s thickness. Fan et al. [30,31] introduced THzResNet, a physics-inspired deep learning framework, and decomposed and analyzed terahertz signals to accurately characterize thermal barrier coatings. Zhong et al. [32,33] proposed a crack defect test method based on THz-TDS, and performed qualitative and quantitative evaluation by classifying and predicting signals through a generalized learning system. Zhang et al. [34] proposed an intelligent terahertz three-dimensional characterization system based on deep confrontation domain adaptation strategy, which conducts automatic positioning and imaging of hidden stripping defects in composite materials with high accuracy and resolution. Ren et al. [35] utilized THz-TDS imaging and image processing techniques to analyze the thickness variation of bonding interfaces in silicon-based adhesive structures under tensile load. Ye et al. [36,37,38] proposed the combination of terahertz technology with advanced signal processing methods and machine learning to characterize terahertz microfeatures, including crack monitoring and estimating porosity using a time-domain broadening ratio. Over the past four decades of reform and opening up, the development of China’s aero-engine technology also represents the improvement of China’s ability in independent innovation in the field of manufacturing. Meanwhile, the results of scientific research on aero-engines in colleges and universities can be used to enhance teaching. Therefore, continuing research on this topic is of great benefit to promoting the development of the aviation industry, improving the scientific research level of universities, and cultivating students’ independent innovation ability.
However, the measurement and analysis of porosity in TBCs still present challenges. The application of THz-TDS in measuring porosity is relatively poorly developed, and there is a lack of a reliable data-driven model that can establish an accurate correlation between THz-TDS data and porosity. Data-driven models analyze and extract valuable feature parameters from complex signal data, enabling predictions of target properties and performance.
In conclusion, this study addresses the challenges associated with the measurement and analysis of TBCs porosity by proposing a novel and data-driven method based on THz-TDS. The main objective of this research was to accurately predict the porosity of TBCs using THz-TDS and establish a reliable correlation between THz-TDS data and porosity. By processing and extracting features from terahertz data and employing an extreme learning machine (ELM) model optimized by the sparrow search algorithm (SSA), accurate porosity prediction was achieved. This method was characterized by its speed, non-destructiveness, and high precision, offering a new and effective approach for assessing the quality and predicting the performance of TBCs. Additionally, the performance of the model was validated through cross-validation, demonstrating its robustness and generalization capability. The combination of THz-TDS and the data-driven modeling approach offered several advantages, including speed, non-destructiveness, and high precision in assessing the quality and predicting the performance of TBCs.
This research holds significant theoretical and practical value for the detection and evaluation of TBCs on aero-engine blades. By integrating advanced signal processing techniques and machine learning, we have provided a new and effective approach for evaluating TBCs. Importantly, this study significantly advanced the application of THz-TDS in porosity measurement, as previous research in this field had been relatively limited.
2. Models and Methods
2.1. Preparation of Thermal Barrier Coating
Yttria-stabilized zirconia (YSZ) was selected as the material for the ceramic layer in the TBCs preparation experiments; this contains 8% yttria and 92% zirconia [39]. The ceramic powder was deposited on the carbon steel substrate by using air plasma spray (APS) equipment. During this process, various parameters were adjusted, including powder particle size, spraying distance, and spraying power, to obtain TBCs with different porosities. Figure 1 shows that the TBCs samples were prepared using powder particle sizes of 15–45 μm and 45–106 μm, spraying distances of 50 mm, 75 mm, 100 mm, and 150 mm, and spraying powers of 33 kW, 36 kW, and 38 kW. Figure 2a,b show the TBCs cross-sections characterized by scanning electron microscopy (SEM) and detected using ImageJ software, resulting in samples with porosities ranging from 6.22% to 22.11%.
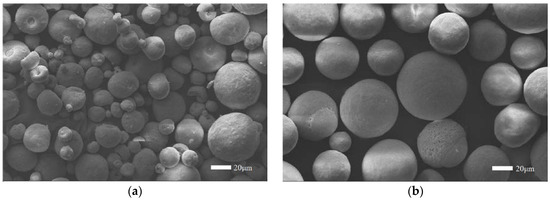
Figure 1.
Particle size of powder (a) 15–45 μm (b) 45–106 μm.
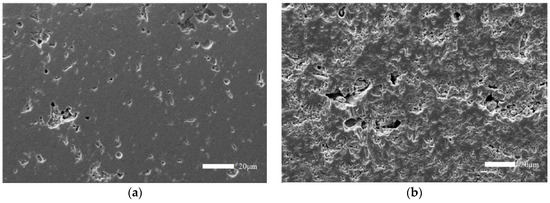
Figure 2.
SEM of different particle sizes (a) Fine particle size (b) Coarse particle size.
Using the refractive index measurement method proposed by Fukuchi et al. [26], TBCs with different porosities were inspected using terahertz technology. The complex form of the refractive index was calculated, with the real part representing the refractive index and the imaginary part representing the extinction coefficient. Refractive index and extinction coefficient values were obtained for 12 sets of samples with different porosities, and these values were utilized in the subsequent finite difference time-domain (FDTD) simulation research. As an important tool in scientific exploration and engineering experiment teaching, the FDTD method is usually employed to solve the simulation problem in the field of terahertz nondestructive testing.
2.2. FDTD Simulation
Several key assumptions were proposed and modified to ensure the accuracy and feasibility of the proposed data-driven model, assuming that the TBCs studied had a uniform structure and consistent material properties throughout the entire coating. While the exact composition of the actual TBCs might have exhibited slight variations, the model was simplified to enable simulation analysis and implementation, assuming a uniform coating. THz signals obtained through FDTD simulation were assumed to be stationary, while in reality, THz signals could be affected by extremely subtle disturbances such as noise. However, for the convenience of subsequent signal analysis, this small amount of noise was ignored, as it did not affect the establishment of the data-driven model.
Within the FDTD module, the porosity of the TBCs could be defined by setting the refractive index and extinction coefficient [40]. Additionally, we varied the thickness of the coating (150–300 μm with a step size of 30 μm) and surface roughness (including both the ceramic layer surface roughness and the interface roughness between the ceramic layer and substrate, ranging from 0.5–5 μm with a step size of 0.5 μm). After considering the effects of the refractive index, extinction coefficient, and other parameters, a total of 60 simulation models were established.
Next, 60 models were simulated using the FDTD software to obtain terahertz time-domain data. The parameters were set as shown in Table 1, with a terahertz frequency range of 0.3–1 THz and a simulation time of 70 ps.

Table 1.
FDTD simulation settings.
Due to the ability of terahertz waves to penetrate the ceramic layer but not the metal layer, reflection occurs at the interface between the TC and the BC. Figure 3 shows a schematic diagram of the propagation of terahertz waves in porous TBCs, where R represents the reflected wave on the surface of the TC, R1 represents the first echo of the terahertz wave propagating in the porous TC, and R2 represents the second echo. By receiving the echoes multiple times, terahertz signals with microstructural features corresponding to different porosity rates can be obtained. Figure 2 displays the terahertz time-domain waveforms corresponding to different porosity rates. Taking the 150 μm thickness as an example, with an increase in simulation time, the received echo signal gradually weakens, resulting in a smoothing of the waveform. The terahertz time-domain spectrum is shown in Figure 4.
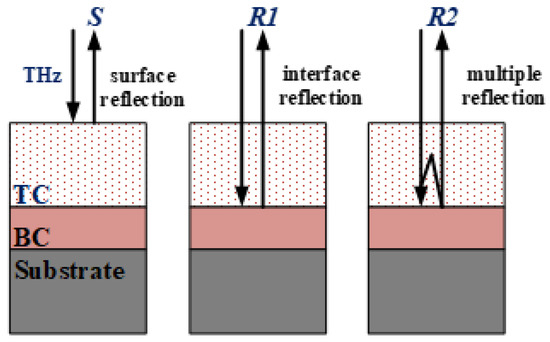
Figure 3.
Schematic diagram of THz propagation in TBCs.
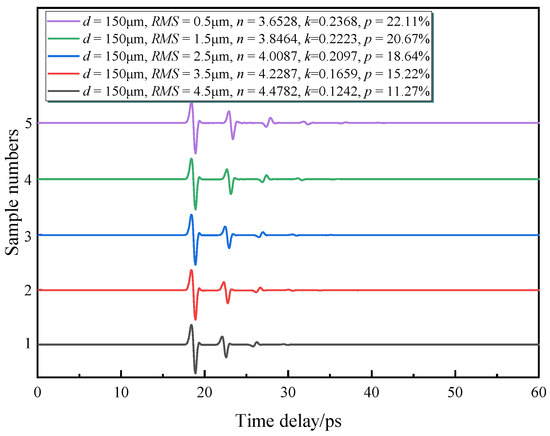
Figure 4.
Terahertz time-domain spectrum.
2.3. Terahertz Data Processing
2.3.1. Fourier Transform of THz Time Domain Data
During the processing of terahertz data, the first step was to perform a Fourier Transform (FT) on the terahertz time-domain signal to obtain the frequency spectrum and phase spectrum [41]. Fourier Transform is a method to convert a time domain signal to a frequency domain signal, which can decompose the time-domain signal into a superposition of sine and cosine waves of different frequencies. The terahertz time-domain signal contains information on different frequency components, which can be extracted by Fourier Transform to analyze the physical properties of the sample.
The fast Fourier Transform (FFT) is an efficient numerical method for calculating the frequency spectrum of discrete signals, specifically for computing the discrete Fourier Transform (DFT). By exploiting the properties of data symmetry and periodicity, the number of multiplications required in the discrete Fourier Transform (DFT) can be significantly reduced, leading to improved computational efficiency. Applying FFT can quickly convert the time-domain signal into its frequency and phase spectra.
The implementation process of FFT is as follows.
where k is the index of the frequency component, N is the total length of the signal, and i is a complex unit, is the sampling point value of the time domain signal sequence, and is the complex result of the frequency domain signal, representing the amplitude and phase information at the frequency k. The computation of the exponential term in the equations can be achieved by calculating a rotation factor and then performing iterative calculations.
The spectrum amplitude and phase spectrum are extracted by the following equations.
where is the absolute value, atan2 is a kind of inverse tangent function, and Re and Im are the real and imaginary parts of complex numbers, respectively.
Figure 5a shows the extracted frequency domain spectrum. Figure 5b shows the extracted phase spectrum.
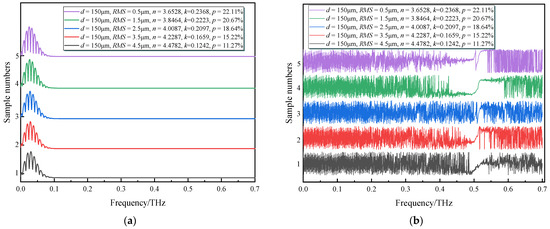
Figure 5.
Fast Fourier transform (a) frequency domain spectrum (b) phase spectrum.
2.3.2. Time Domain Data Extraction
Principal component analysis is a common dimensionality reduction method used to transform high-dimensional data into low-dimensional representations while preserving key information of the original data as much as possible [42]. PCA is an unsupervised learning method, which only reduces the dimension based on the statistical characteristics of the data, without relying on any category or label information. It maps the original data to a new space. Therefore, PCA can be applied to terahertz time-domain data processing to extract important features and reduce the high dimensionality of the time-domain data.
The detailed steps of principal component analysis are as follows. The terahertz time-domain data matrix is , with a total of N samples, and each sample contains data of M time points.
Subtract the mean value of each sample vector from the vector itself, compute the mean vector, and perform centering preprocessing.
where is the data vector of the ith sample. is the centralized data. is the mean of the vectors.
Calculate the covariance matrix .
where is the transpose of .
Eigenvalue decomposition of the covariance matrix.
where is a diagonal matrix, elements on the diagonal are eigenvalues, and is a matrix of eigenvectors.
Rank the eigenvalues from largest to smallest and select the first k principal components, namely the new k eigenvectors.
where is the new matrix formed for the first k eigenvectors.
By projecting each sample vector onto the k principal components, dimensionality reduction data represented in the new space can be obtained.
where, represents the projection result of the original matrix into the k-dimensional principal component space, also known as the matrix after dimensionality reduction.
2.3.3. Frequency Domain Data Extraction
Extracting average power spectral density (APSD) is a vital step in terahertz signal frequency analysis. In frequency domain data, various frequency components correspond to different amplitude and phase differences of terahertz signals. Amplitude can be used to analyze the amplitude of the signal at different frequencies, while the power spectral density represents the power distribution of the signal in different frequency ranges. The APSD is the average power spectral density of all signals in a certain frequency band.
Specifically, calculate the square of the frequency domain data module.
where is the frequency domain data, w is the frequency, and i is the energy or power occupied by the signal at each frequency.
Next, the frequency range is divided into several sub-frequency bands of equal width, and the average power spectral density of all samples within the frequency is calculated.
where is the APSD in the kth band, N is the number of samples, and is the spectral data of the ith sample in the kth band.
Lastly, the magnitude of APSD indicates the strength or energy distribution of terahertz signals in the frequency domain, facilitating subsequent spectral analysis.
2.3.4. Phase Spectrum Extraction
The phase information is given in the phase spectrum. However, in practice, the phase spectrum may exhibit discontinuity due to abrupt phase jumps as the frequency changes, which can affect the signal analysis. Phase unwrapping (PW) is a method used to address phase jumps and eliminate the discontinuities caused by the periodicity of 2π in the phase spectrum [43]. The unwrapping operation corrects the phase jumps, rendering the phase spectrum continuous and smooth, thereby recovering the original phase information.
The porosity of TBCs affected the transformation of the phase spectrum. The number of extremal points detected by the first derivative of the phase spectrum can quantitatively describe the frequency variation of terahertz signals. By performing a first-order derivative operation on the phase spectrum after unwrapping, we can extract the number of extremal points to characterize the porosity.
Specifically, phase unwrapping.
where L is the signal length, and are the unwrapped phase spectrum and the original phase spectrum, respectively. is the number of phase jumps at each moment.
Second, the first derivative calculation formula.
Finally, the number of extreme points is calculated to describe the frequency change of the signal
where, is the difference between the kth derivative value and the previous derivative value, and is the number of extreme points.
2.4. A Data-Driven Porosity Detection Model
2.4.1. Sparrow Search Algorithm
The sparrow search algorithm (SSA) is a new swarm intelligent optimization algorithm, which achieves optimal solution of the problem by simulating the collaboration and competition mechanism of sparrows in searching for food [44]. It exhibits strong optimization capabilities and fast convergence speed. The algorithm follows the following procedural steps.
Initialization of sparrow population.
where is the sparrow population. n is the number of sparrows and d is the dimension of independent parameters.
Sparrows encounter predators while foraging, update position.
where, is the value of the jth dimension of the ith sparrow, t is the number of iterations, and α is a random number between 0 and 1, Q is a random value, and L is a row vector with d dimension 1. Both R and ST are numbers between 0 and 1, where R is the warning value and ST is the safety threshold. When R > ST, predators are present and the sparrow enters a safe zone.
The intruders maintain constant surveillance on the searchers, always monitoring their activities. Whenever a searcher finds food, the intruders swiftly fly to the vicinity and engage in food snatching, ready to compete for the resources. In case of failure, the intruders fly off to other locations in search of food.
where, p denotes the best position of the searcher, whereas w represents the worst position. A is a row vector of dimension d consisting of elements 1 or −1, satisfying the condition . When i > n/2, the ith intruder fails in its attempt to compete and flies to an alternative location.
Ultimately, when the sparrows detect danger, the warning birds approach their companions, resulting in another round of position updates.
where is the step parameter, is the optimal position, is the current sparrow adaptation value, is the best adaptation value, and is the worst adaptation value. K is a random value, and is the minimum constant. If , the sparrow becomes aware of the danger and migrates towards the population center. When , the sparrow positioned at the center detects the danger and moves closer to other sparrows.
2.4.2. Extreme Learning Machine
An extreme learning machine (ELM) is a single-layer feedforward neural network that comprises an input layer, a hidden layer, and an output layer [45]. In contrast to traditional gradient algorithms, ELM utilizes random weights and biases in the input layer and solves for the output layer weights using the generalized inverse matrix. It demonstrates fast learning speed and strong generalization ability. Figure 6 shows the flow of ELM. The specific steps of ELM are as follows.
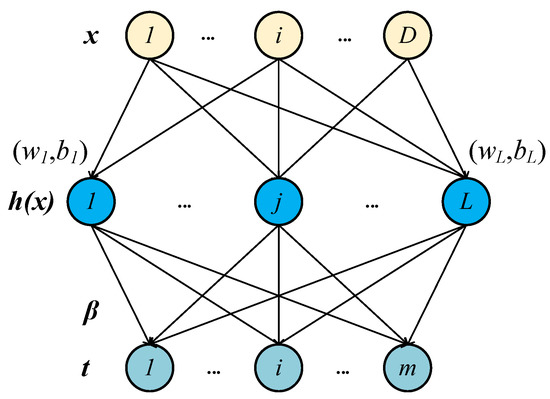
Figure 6.
Flow diagram of ELM.
Given the training set , is the input variable, is the output variable, set the number of nodes in the hidden layer as L, g(x) is the activation function, select Sigmoid function.
where, and are hidden layer node parameters, is the weight between the hidden layer and output layer.
Convert to matrix form.
where β is the weight vector matrix, T is the target matrix of training data, and H is the hidden layer output matrix.
The output weight matrix.
where, is the least squares solution, and is the generalized inverse matrix of H.
2.4.3. Extreme Learning Machine Optimized by Sparrow Search Algorithm
The primary objective of applying the sparrow search algorithm to optimize extreme learning machines is to find the optimal weights and thresholds [46]. This optimization aims to enhance the ability of the ELM model to accurately capture the mapping relationship between the input and output. Consequently, it facilitates the model in effectively learning the data features, thereby improving its prediction accuracy and generalization capability. This aspect is crucial in data-driven porosity prediction. Figure 7 shows the flow diagram of the SSA-ELM model.
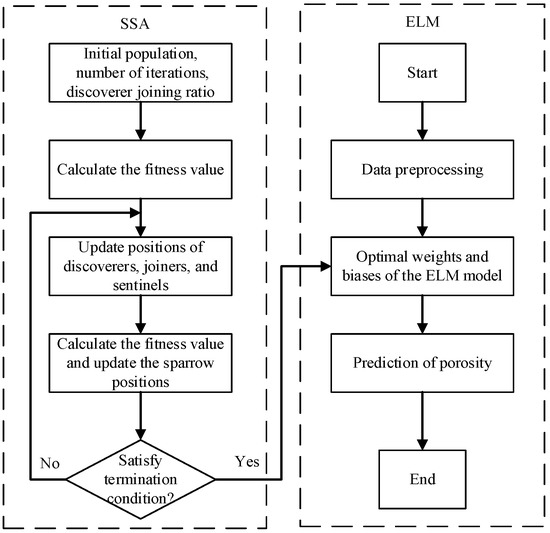
Figure 7.
Flow diagram of SSA-ELM model.
The main steps are as follows.
For the data-driven model of porosity prediction in THz detection of thermal barrier coatings, the input data are processed, including data dimensionality reduction and feature extraction.
Initialize the parameters of the sparrow search algorithm, such as population size, number of iterations, etc., and randomly initialize the weights and thresholds of the ELM.
Sparrow search process. For each iteration, calculate the fitness value, and then update the positions and velocities of the sparrows. Use this information to adjust the weights and thresholds of the ELM.
ELM regression prediction. Use the updated weights and thresholds for regression prediction to calculate the porosity.
In summary, the SSA can be employed to optimize the ELM for regression prediction tasks. This approach exhibits high efficiency and accuracy and holds considerable potential in data-driven model applications.
2.4.4. Cross-Validation Performance Evaluation
Upon completing the model optimization, testing and evaluation of the model are necessary. K-fold cross-validation is a commonly employed method for estimating the performance and generalization capability of machine learning models [47]. In K-fold cross-validation, the original dataset is divided into K equally sized subsets, where K−1 subsets are used for training and the remaining one subset is employed for validation. This process is iterated K times, with different validation subsets chosen each time, resulting in K independent evaluations of model performance. In this study, a 6-fold cross-validation was selected. The cross-validation flow diagram is shown in the Figure 8.
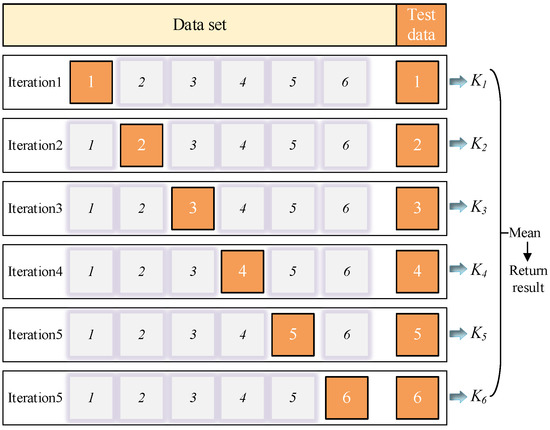
Figure 8.
Cross-validation flow diagram.
The following are the specific steps involved.
- Randomly divide the dataset into 6 equally sized subsets;
- For each iteration of cross-validation, choose one of the subsets as the validation set and utilize the remaining 5 subsets as the training set;
- Train the SSA-ELM model using the training set and then make predictions on the validation set to obtain the results;
- Calculate the errors using various evaluation metrics, such as root mean squared error (RMSE), mean absolute error (MAE), and mean absolute percentage error (MAPE)
- Repeat steps 2 to 4;
- Upon completing the 6-fold cross-validation, calculate the overall average as the final performance metric.
3. Results and Discussion
3.1. Terahertz Data Processing Results
Firstly, PCA (principal component analysis) was applied to process the terahertz time-domain data. Directly inputting the original 60 sets of high-dimensional data into the data-driven model led to low efficiency and accuracy. Through PCA processing, the terahertz time-domain data was successfully reduced from 2654 dimensions to 10 dimensions, while preserving the maximum amount of information from the original data. Reducing the redundancy of the data improves data processing efficiency and analysis accuracy.
As shown in Figure 9, the eigenvalues gradually decreased, while the cumulative contribution rate increased. Based on the ordering of the eigenvalues, the top 10 most significant principal components were selected, achieving a cumulative contribution rate of 95.6%. This indicated that they could be considered as new features after dimensionality reduction of the time-domain data.
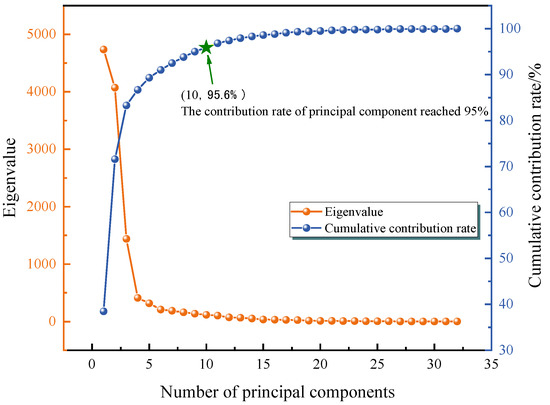
Figure 9.
Cumulative contribution rate.
Furthermore, the average power spectral density (APSD) in the frequency domain was calculated as a characteristic parameter to describe the porosity, as shown in Figure 10a, taking a thickness of 150 μm as an example, corresponding to a surface roughness of 0.5 μm and a porosity of 22.11%. TBCs with different porosities exhibited distinct energy distribution patterns at different frequencies. By analyzing these characteristic parameters, we could explore the correlation between terahertz signals and porosity, differentiate the characteristic differences among different porosities, and establish a predictive model. As shown in Figure 10b, the APSD extracted from the frequency spectrum showed a decreasing trend overall as porosity increased. With an increase in porosity, the number of pores and gaps in the TBCs medium also increased. This led to a longer propagation path for terahertz signals within the TBCs, making them more susceptible to scattering and absorption. Consequently, the energy of the terahertz signal attenuated, resulting in a decrease in the power of the signal in the frequency domain, and consequently, the average power spectral density decreased.
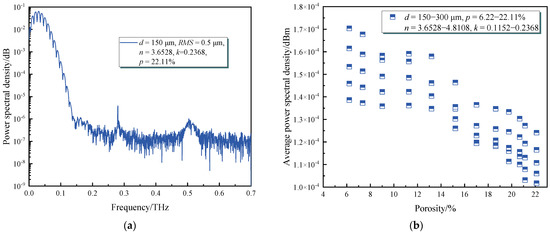
Figure 10.
Frequency domain data extraction results (a) Power spectral density (b) Extracted average power spectral density.
Lastly, the phase spectrum was unwrapped to remove phase jumps. As shown in Figure 11a, using the example of a thickness of 150 μm, the original phase spectrum was transformed into a smooth continuous phase curve, which more accurately reflected the phase variation of the terahertz signal at different frequencies. The unwrapped phase spectrum was used to calculate the number of extreme points of the first-order derivative, which could characterize the degree of phase variation for different porosities.
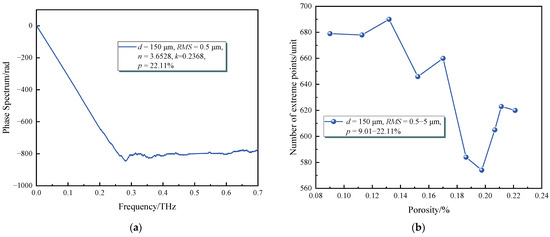
Figure 11.
Phase spectrum extraction results (a) Phase spectrum unwrapping (b) Extracted first derivative extremum point.
As shown in Figure 11b, as the porosity increases, the number of extreme points shows a decreasing trend. However, through the authors’ analysis of multiple datasets, it is indicated that porosity can cause scattering and attenuation of the signal during propagation, resulting in more complex and chaotic phase variations. This may result in more peaks and fluctuations in the phase spectrum. Therefore, the number of extreme points cannot be simply linearly related to porosity. Factors such as the resolution, sampling rate, and noise level of the phase spectrum need to be considered, which are beyond the scope of this paper and require further research by the authors.
However, in this study, extracting the changing feature parameters from the phase spectrum was of vital significance for predicting and analyzing the porosity of TBCs.
3.2. Porosity Measurement Results Based on the Data-Driven Model
In this study, the key component of the data-driven model incorporated SSA-ELM as a regression model. The processed terahertz signals served as inputs, while the output was the porosity, aiming to predict porosity through a data-driven model.
The terahertz time-domain data underwent PCA processing, reducing the data dimension from 60 × 2654 to 60 × 10, which significantly decreased the computational burden of the model. Extracting the APSD from the frequency spectrum and the number of extreme points of the first-order derivative in the phase spectrum can effectively represent the porosity. Subsequently, the three sets of data were combined into a new matrix, resulting in a model input matrix with dimensions of 60 × 12. Forty-two data sets were selected for training, while the remaining 18 sets were used for testing. As shown in Figure 12, the ELM optimized by SSA exhibited a remarkable improvement in prediction accuracy, with the predicted results closely aligning with the actual values. Conversely, the basic ELM yielded substantial prediction errors.
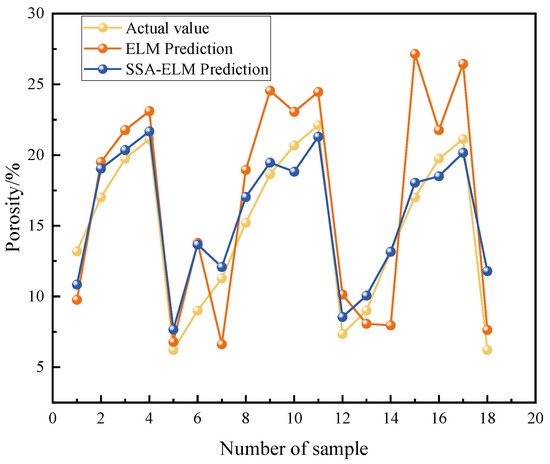
Figure 12.
Data-driven models predict results.
To further validate the accuracy and robustness of the proposed data-driven model, K-fold cross-validation was utilized. The dataset was divided into six subsets, with one subset reserved for testing and the remaining subsets used for training. Multiple iterations of cross-validation were performed to obtain performance metrics. The iteration shown in Figure 13 represents the progress of the 6-fold cross-validation, where the model training reached stability at iteration numbers of 174, 96, 57, 112, 120, and 60 for each fold. The corresponding comparison of predicted results for each fold is displayed in the Figure 14, revealing that the predictions of the SSA-ELM model were consistently closer to the true values, compared to the basic ELM model. Furthermore, as shown in Figure 15, the SSA-ELM model outperformed the basic ELM model in terms of RMSE, MAE, and MAPE for each fold. The regression coefficients of the SSA-ELM model were also closer to 1, indicating better prediction performance. Among them, the RMSE value of SSA-ELM was much smaller than that of ELM, and it was the same for the MAE value. For MAPE, the optimized model had a smaller error per fold than the original model. The regression coefficient of each fold reached about 0.8, but the regression coefficient of the model optimized by the sparrow search algorithm was above 0.9. Therefore, the prediction accuracy of the data-driven model was high, and the prediction effect was perfect.
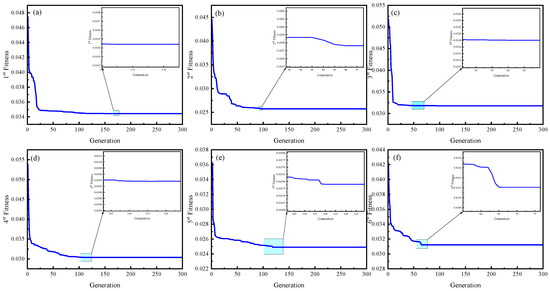
Figure 13.
Cross-validation iteration for each fold (a) First iteration (b) Second iteration (c) Third iteration (d) Fourth iteration (e) Fifth iteration (f) Sixth iteration.
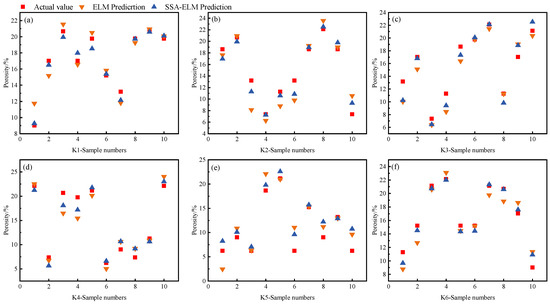
Figure 14.
Each fold cross-verifies the prediction (a) First fold predictions (b) Second fold predictions (c) Third fold predictions (d) Fourth fold predictions (e) Fifth fold predictions (f) Sixth fold predictions.
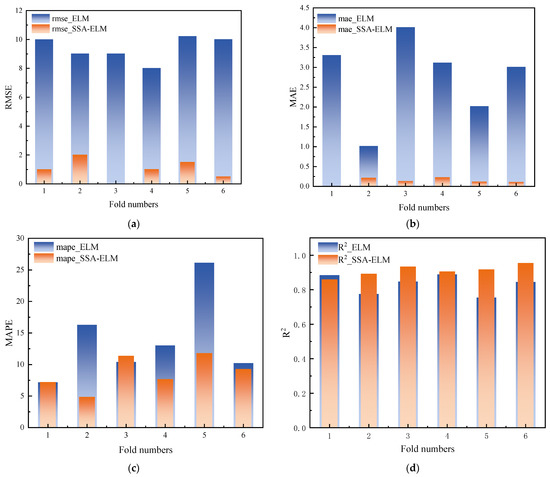
Figure 15.
Performance evaluation index of each fold (a) RMSE (b) MAE (c) MAPE (d) R2.
Through 6-fold cross-validation, as shown in Table 2, the average errors for each fold of the ELM model are as follows: RMSE is 9.8923, MAE is 3.0159, MAPE is 13.8746, and the regression coefficient is 0.83. On the other hand, the average errors for each fold of the SSA-ELM model are as follows: RMSE is 1.1462, MAE is 0.1499, MAPE is 7.0379, and the regression coefficient is 0.92. The final results demonstrate that the data-driven model achieved good performance in predicting the porosity. The cross-validation results were excellent, proving the robustness and generalization ability of the model. Therefore, the data-driven model is feasible for porosity measurement in the field.
Table 2.
The average value of the performance evaluation index.
The presented findings have established the effectiveness of employing data-driven techniques, including signal processing methods and the sparrow search algorithm-optimized extreme learning machine model, for predicting porosity in TBCs.
A non-destructive and efficient method was proposed based on THz-TDS to evaluate the TBCs’ porosities. By employing a data-driven porosity prediction model, the method allowed researchers to accurately assess the quality of the TBCs, optimize their design, and enhance their reliability.
Furthermore, the method facilitated the inspection and maintenance of TBCs in various industrial applications, particularly in the aerospace and gas turbine industries. By accurately assessing the porosity of TBCs using THz-TDS, potential defects and weaknesses may be identified early, enabling timely repairs or replacements. This could significantly improve the durability and service life of the TBCs, resulting in cost savings and improved operational efficiency.
Additionally, the data-driven modeling approach adopted in this study has created opportunities for further advancements in the field of TBCs detection and characterization. By integrating advanced signal processing techniques and machine learning algorithms, more sophisticated models could be developed that not only predict porosity but also provide insights into other key characteristics of TBCs, such as thermal conductivity, mechanical strength, and corrosion resistance. This could enhance the understanding and control of TBCs’ performance in various applications.
The methods based on THz-TDS and data-driven modeling have demonstrated significant application value in the evaluation of TBC porosity, optimization of the manufacturing processes, detection and maintenance of TBCs, and the development of TBCs characterization. The findings of this study may contribute to the development of more reliable and efficient TBCs, benefiting industries reliant on high-performance coatings to improve engine performance, energy efficiency, and reliability.
4. Conclusions
In this study, the data-driven model was a TBCs porosity prediction model based on THz-TDS. It utilized the extracted feature parameters from terahertz signals as inputs and predicted porosity as the output. The model was constructed using a sparrow search algorithm-optimized extreme learning machine (ELM), and its performance was evaluated through cross-validation.
The principal component analysis (PCA) method was employed to reduce the dimensionality of the time-domain data, preserving its essential features while reducing the computational complexity of the model. The APSD of the frequency spectrum and the number of extrema in the first-order derivative of the phase spectrum were selected as the feature parameters to characterize porosity. These parameters exhibit a decreasing trend in their overall variation as porosity increases. By optimizing the weights and thresholds of the ELM using the SSA, the prediction accuracy was significantly improved compared to the basic ELM. Thus, the SSA-ELM model can effectively predict porosity. Moreover, through 6-fold cross-validation, a regression coefficient of 0.92 was achieved, demonstrating the robustness and generalization ability of the data-driven model. This further validates the data-driven model’s capability for accurate and rapid prediction of porosity in thermal barrier coatings.
There are several potential avenues for future research to enhance and optimize the proposed data-driven model. One possibility is to incorporate more feature parameters or explore alternative optimization algorithms to improve the prediction performance. Additionally, expanding the size of the dataset would enhance the model’s generalization capabilities and enable validation in practical applications. Overall, this study presents an effective data-driven model that offers new insights and approaches for the rapid and accurate detection of porosity in thermal barrier coatings. Moreover, the data-driven method of combining experimental research and simulation calculation proposed in this study could provide excellent material for cultivating students’ comprehensive engineering problem-solving ability. The practical engineering application used in this study could be employed in classroom teaching or practical teaching to solve this kind of problem.
Author Contributions
Conceptualization, D.Y. and J.X.; Data curation, J.X.; Funding acquisition, D.Y. and J.P.; Investigation, D.Y., R.L. and J.X.; Methodology, R.L. and J.X.; Project administration, J.P.; Resources, J.P.; Software, R.L.; Supervision, D.Y.; Validation, R.L.; Visualization, D.Y.; Writing—original draft, D.Y. and R.L.; Writing—review and editing, R.L. and J.P. All authors have read and agreed to the published version of the manuscript.
Funding
This work is sponsored by the National Natural Science Foundation of China (52205547), Key Research and Development Projects in Anhui Province (2022a05020004, 202104a05020002), The Key Project of Anhui Province Quality Engineering Teaching and Research (2021scxy003), Open Research Fund of Anhui Key Laboratory of Detection Technology and Energy Saving Devices (JCKJ2022A08), Anhui Institute of Future Technology Enterprise Cooperation Project (2023qyhz04), Science and Technology Plan Project of Wuhu City (2022yf67, 2022jc48), and the National College Student Innovation and Entrepreneurship Training Program Project (202210363020).
Informed Consent Statement
Not applicable.
Data Availability Statement
Not applicable.
Conflicts of Interest
The authors declare no conflict of interest.
References
- Yang, P.; Yue, W.; Li, J.; Bin, G.; Li, C. Review of damage mechanism and protection of aero-engine blades based on impact properties. Eng. Fail. Anal. 2022, 140, 106570. [Google Scholar] [CrossRef]
- Wang, K.; Peng, H.; Guo, H.; Gong, S. Effect of sintering on thermal conductivity and thermal barrier effects of thermal barrier coatings. Chin. J. Aeronaut. 2012, 25, 811–816. [Google Scholar] [CrossRef]
- Praveen, K.; Shanmugavelayutham, G.; Rao, D.; Sivakumar, G. Thermal cycling performance assessment of double-layered lanthanum titanium aluminate thermal barrier coatings developed using plasma spheroidized powders. Surf. Coat. Technol. 2023, 465, 129588. [Google Scholar] [CrossRef]
- Wang, Z.; Wang, Z.; Zhang, T.; Guo, W.; Dai, H.; Ding, K. Reliability evaluation of thermal barrier coatings for engine combustion chambers based on Monte-Carlo simulation. Surf. Coat. Technol. 2022, 448, 128923. [Google Scholar] [CrossRef]
- Pushpak, B.; Avinava, R.; Soumyadeep, S.; Arkajit, G.; Gourab, S.; Asiful, S.; Ibrahim, A.; Manojit, G. Service life assessment of yttria stabilized zirconia (YSZ) based thermal barrier coating through wear behaviour. Heliyon 2023, 9, e16107. [Google Scholar]
- Hu, T.; Shen, S. Effects of TGO roughness on indentation response of thermal barrier coatings. CMC Comput. Mater. Con. 2010, 17, 41–57. [Google Scholar]
- Lee, D.; Lee, K.; Kim, T.; Kim, C. Hertzian stress analysis and characterization of thermal barrier coatings containing unidirectional vertical cracks. Ceram. Int. 2019, 45, 21348–21358. [Google Scholar] [CrossRef]
- Thakare, J.; Pandey, C.; Mahapatra, M.; Mulik, R. Thermal barrier coatings—A state of the art review. Met. Mater. Int. 2020, 27, 1947–1968. [Google Scholar] [CrossRef]
- Jana, J.; Ashutosh, T.; Steffen, B.; Frank, K.; Olivier, G.; Robert, V. Evaluation of major factors influencing the TBC topcoat formation in axial suspension plasma spraying (SPS). Int. J. Appl. Ceram. Technol. 2022, 20, 884–895. [Google Scholar]
- Esmaeil, P.; Amin, A.; Javad, R.; Sigaroodi, J.; Rasoul, M. Cooling channel blockage effect on TBC and substrate behavior in a gas turbine blade failure. Eng. Failure Anal. 2022, 141, 106682. [Google Scholar]
- Curry, N.; Markocsan, N.; Östergren, L.; Li, X.; Dorfman, M. Evaluation of the lifetime and thermal conductivity of dysprosia-stabilized thermal barrier coating systems. J. Therm. Spray Technol. 2013, 22, 864–872. [Google Scholar] [CrossRef]
- Nayebpashaee, N.; Seyedein, S.; Aboutalebi, M.; Sarpoolaky, H.; Hadavi, S. Finite element simulation of residual stress and failure mechanism in plasma sprayed thermal barrier coatings using actual microstructure as the representative volume. Surf. Coat. Technol. 2016, 291, 103–114. [Google Scholar] [CrossRef]
- Yang, Y.; He, C.; Wu, B. Non-destructive microwave evaluation of plasma sprayed TBCs porosity. NDT E Int. 2013, 59, 34–39. [Google Scholar] [CrossRef]
- Akbar, M.; Jawad, G.; Duff, C.; Sloan, R. Porosity evaluation of in-service thermal barrier coated turbine blades using a microwave nondestructive technique. NDT E Int. 2018, 93, 64–77. [Google Scholar] [CrossRef]
- Ma, Z.; Zhang, W.; Luo, Z.; Sun, X.; Li, Z.; Lin, L. Ultrasonic characterization of thermal barrier coatings porosity through BP neural network optimizing Gaussian process regression algorithm. Ultrasonics 2020, 100, 105981. [Google Scholar] [CrossRef] [PubMed]
- Ma, Z.; Zhao, Y.; Luo, Z.; Lin, L. Ultrasonic characterization of thermally grown oxide in thermal barrier coating by reflection coefficient amplitude spectrum. Ultrasonics 2014, 54, 1005–1009. [Google Scholar] [CrossRef]
- Reisemberger, D.; Frieda, S.; Gustavo, B.; Sebastião, R.; Carlos, D.; Larissa, R.; Watena, F.; Felipe, B. Characterization of a coating for radioprotection, by X-ray diffraction, scanning electron microscopy, and dispersive energy spectroscopy. Constr. Build. Mater. 2022, 321, 126326. [Google Scholar]
- Zhu, W.; Cai, X.; Yang, L.; Xia, J.; Zhou, Y.; Pi, Z. The evolution of pores in thermal barrier coatings under volcanic ash corrosion using X-ray computed tomography. Surf. Coat. Technol. 2018, 357, 372–378. [Google Scholar] [CrossRef]
- Bu, C.; Tang, Q.; Liu, Y.; Yu, F.; Mei, C.; Zhao, Y. Quantitative detection of thermal barrier coating thickness based on simulated annealing algorithm using pulsed infrared thermography technology. Appl. Therm. Eng. 2016, 99, 751–755. [Google Scholar] [CrossRef]
- Liu, Y.; Zhao, G.; Du, Y.; Zhang, Y. Thermal barrier coating debonding defects detection based on infrared thermal wave testing technology under linear frequency modulation heat excitation. Therm. Sci. 2019, 23, 1607–1613. [Google Scholar] [CrossRef]
- Tang, Q.; Gao, S.; Liu, Y.; Lu, Y.; Xu, P. Experimental research on YSZ TBC structure debonding defect detection using long-pulsed excitation of infrared thermal wave non-destructive testing. Therm. Sci. 2019, 23, 1313–1321. [Google Scholar] [CrossRef]
- Wang, D.; Xu, K.; Luo, S.; Cui, Y.; Zhang, L.; Cui, J. A high Q-factor dual-band terahertz metamaterial absorber and its sensing characteristics. Nanoscale 2023, 15, 3398–3407. [Google Scholar] [CrossRef] [PubMed]
- Fu, W.; Sun, L.; Cao, H.; Chen, L.; Zhou, M.; Shen, S.; Zhu, Y.; Zhuang, S. Qualitative and quantitative recognition of volatile organic compounds in their liquid phase based on terahertz microfluidic EIT meta-sensors. IEEE Sens. J. 2023, 3268167. [Google Scholar] [CrossRef]
- Unnikrishnakurup, S.; Dash, J.; Ray, S.; Pesala, B.; Balasubramaniam, K. Nondestructive evaluation of thermal barrier coating thickness degradation using pulsed IR thermography and THz-TDS measurements: A comparative study. NDT E Int. 2020, 116, 102367. [Google Scholar] [CrossRef]
- Siv, S.; Vijayan, V.; Kini, R. Non-destructive evaluation of coatings using terahertz reflection spectroscopy. J. Opt. 2022, 24, AC54EA. [Google Scholar]
- Fukuchi, T.; Fuse, N.; Okada, M.; Fujii, T.; Mizuno, M.; Fukunaga, K. Measurement of refractive index and thickness of topcoat of thermal barrier coating by reflection measurement of terahertz waves. Electron. Commun. Jpn. 2013, 96, 37–45. [Google Scholar] [CrossRef]
- Davit, H.; Maher, H.; Olivier, R.; Anthony, B.; Alexis, M.; Laurence, B.; Olivier, D.; Emmanuel, A. Non-destructive evaluation of ceramic porosity using terahertz time-domain spectroscopy. J. Eur. Ceram. Soc. 2022, 42, 525–533. [Google Scholar]
- Watanabe, M.; Kuroda, S.; Yamawaki, H.; Shiwa, H. Terahertz dielectric properties of plasma-sprayed thermal-barrier coatings. Surf. Coat. Technol. 2011, 205, 4620–4626. [Google Scholar] [CrossRef]
- Li, R.; Ye, D.; Xu, Z.; Yin, C.; Xu, H.; Zhou, H.; Yi, J.; Chen, Y.; Pan, J. Nondestructive evaluation of thermal barrier coatings thickness using terahertz Time-Domain spectroscopy combined with hybrid machine learning approaches. Coatings 2022, 12, 1875. [Google Scholar] [CrossRef]
- Sun, F.; Fan, M.; Cao, B.; Liu, L. THzResNet: A physics-inspired two-stream residual network for thermal barrier coating thickness measurement. IEEE Trans. Ind. Inform. 2022, 1–11. [Google Scholar] [CrossRef]
- Gong, B.; Cao, B.; Zhang, H.; Sun, F.; Fan, M. Terahertz based thickness measurement of thermal barrier coatings using hybrid machine learning. Nondestr. Test. Eval. 2023, 1–17. [Google Scholar] [CrossRef]
- Deng, Y.; Zhong, S.; Lin, J.; Zhang, Q.; Nsengiyumva, W.; Cheng, S.; Huang, Y.; Chen, Z. Thickness measurement of self-lubricating fabric liner of inner ring of sliding bearings using spectral-domain optical coherence tomography. Coatings 2023, 13, 708. [Google Scholar] [CrossRef]
- Huang, Y.; Huang, Y.; Zhong, S.; Zhuang, C.; Shi, T.; Zhang, Z.; Chen, Z.; Liu, X. Evaluation for crack defects of self-lubricating sliding bearings coating based on terahertz non-destructive testing. Coatings 2023, 13, 513. [Google Scholar] [CrossRef]
- Xu, Y.; Lian, G.; Zhou, H.; Hou, Y.; Zhang, L.; Yan, R.; Chen, X. Terahertz transfer characterization for composite delamination under variable conditions based on deep adversarial domain adaptation. Compos. Sci. Technol. 2023, 232, 109853. [Google Scholar] [CrossRef]
- Zhang, J.; Ren, J.; Li, L.; Gu, J.; Zhang, D.; Qi, C.; Xue, J. The elimination of the F-P effect in terahertz signals from a parameter-optimized decomposition. Infrared Phys. Technol. 2023, 128, 104459. [Google Scholar] [CrossRef]
- Ye, D.; Wang, W.; Zhou, H.; Huang, J.; Wu, W.; Gong, H.; Li, Z. In-situ evaluation of porosity in thermal barrier coatings based on the broadening of terahertz time-domain pulses: Simulation and experimental investigations. Opt. Express. 2019, 27, 28150–28165. [Google Scholar] [CrossRef]
- Ye, D.; Wang, W.; Zhou, H.; Li, Y.; Fang, H.; Huang, J.; Gong, H.; Li, Z. Quantitative determination of porosity in thermal barrier coatings using terahertz reflectance spectrum: Case study of atmospheric-plasma-sprayed YSZ coatings. IEEE Trans. Terahertz Sci. Technol. 2020, 10, 383–390. [Google Scholar] [CrossRef]
- Liu, L.; Yu, H.; Zheng, C.; Ye, D.; He, W.; Wang, S.; Li, J.; Wu, L.; Zhang, Y.; Xie, J.; et al. Nondestructive thickness measurement of thermal barrier coatings for turbine blades by terahertz time domain spectroscopy. Photonics 2023, 10, 105. [Google Scholar] [CrossRef]
- Wang, C.; Tian, H.; Guo, M.; Gao, J.; Cui, Y.; Liang, Y.; Tong, H.; Fang, Y.; Wen, X.; Wang, H. Microstructure and thermal shock resistance of AlBOw- and BNw-whisker-modified thermal barrier coatings. Ceram. Int. 2020, 46, 16372–16379. [Google Scholar]
- Blanchard, F.; Kadi, M.; Bousser, E.; Baloukas, B.; Azzi, M.; Klemberg-Sapieha, J.; Martinu, L. Effect of CMAS infiltration on the optical properties of thermal barrier coatings: Study of the mechanisms supported by FDTD simulations and ALD. Acta Mater. 2023, 249, 118830. [Google Scholar] [CrossRef]
- Bandla, A.; Hager, N., III; Tofighi, M.R. Ultra-broadband material spectroscopy from scattering parameters obtained from time domain measurements. J. Franklin Inst. 2016, 354, 8747–8757. [Google Scholar] [CrossRef]
- Burnett, A.; Fan, W.; Upadhya, P.; Cunningham, J.; Hargreaves, M.; Munshi, T.; Edwards, H.; Linfield, E.; Davies, A. Broadband terahertz time-domain spectroscopy of drugs-of-abuse and the use of principal component analysis. Analyst 2009, 134, 1658–1668. [Google Scholar] [CrossRef] [PubMed]
- Guo, Y.; Chen, X.; Zhang, T. Robust phase unwrapping algorithm based on least squares. Opt. Lasers. Eng. 2014, 63, 25–29. [Google Scholar] [CrossRef]
- Fan, Y.; Zhang, Y.; Guo, B.; Luo, X.; Peng, Q.; Jin, Z. A hybrid sparrow search algorithm of the hyperparameter optimization in deep learning. Mathematics 2022, 10, 3019. [Google Scholar] [CrossRef]
- Zhang, N.; Ding, S. Unsupervised and semi-supervised extreme learning machine with wavelet kernel for high dimensional data. Memet. Comput. 2017, 9, 129–139. [Google Scholar] [CrossRef]
- Jia, Y.; Su, Y.; Zhang, R.; Zhang, Z.; Lu, Y.; Shi, D.; Xu, C.; Huang, D. Optimization of an extreme learning machine model with the sparrow search algorithm to estimate spring maize evapotranspiration with film mulching in the semiarid regions of China. Comput. Electron. Agr. 2022, 201, 107298. [Google Scholar] [CrossRef]
- Wong, T.; Yeh, P. Reliable accuracy estimates from k-fold cross validation. IEEE Trans. Knowl. Data Eng. 2019, 32, 1586–1594. [Google Scholar] [CrossRef]
Disclaimer/Publisher’s Note: The statements, opinions and data contained in all publications are solely those of the individual author(s) and contributor(s) and not of MDPI and/or the editor(s). MDPI and/or the editor(s) disclaim responsibility for any injury to people or property resulting from any ideas, methods, instructions or products referred to in the content. |
© 2023 by the authors. Licensee MDPI, Basel, Switzerland. This article is an open access article distributed under the terms and conditions of the Creative Commons Attribution (CC BY) license (https://creativecommons.org/licenses/by/4.0/).