Article

Vapor Deposited Zeolitic Imidazolate Framework-8 Derived from Porous ZnO Thin Films

1
Institute of Solid State Physics, NAWI Graz, Graz University of Technology, 8010 Graz, Austria
2
Electronic Sensors, Silicon Austria Labs GmbH, 8010 Graz, Austria
*
Author to whom correspondence should be addressed.
Coatings 2023, 13(4), 718; https://doi.org/10.3390/coatings13040718
Submission received: 28 February 2023 / Revised: 24 March 2023 / Accepted: 28 March 2023 / Published: 31 March 2023
(This article belongs to the Special Issue Thin-Film Synthesis, Characterization and Properties)

Abstract

:
In recent years, the vapor deposition of zeolitic imidazolate framework-8 (ZIF-8) has gained high attraction due to its good scalability, conformality, and thickness control. The present study provides new fundamental insights regarding the vapor deposition of ZIF-8 from zinc oxide (ZnO). During synthesis, ZnO thin films with different percentages of open porosity (14.5%–24%) were subjected to a 2-methylimidazole vapor for different conversion times (20 min–24 h). For the first time, the impact of the porosity of ZnO thin films onto the converted ZIF-8 is investigated. Grazing incidence X-ray diffraction reveals randomly oriented crystallites of ZIF-8, which already appear after 20 min of conversion. The thickness, roughness, and average particle height of the ZIF-8 layers increase with the conversion time, reaching values up to (172 ± 20) nm, (29 ± 3) nm, and (113 ± 8) nm, respectively, for ZIF-8 obtained from ZnO with 14.5% open porosity. At long conversion times (i.e., 24 h), the results hint at greater precursor porosities resulting in lower thicknesses of ZIF-8, as the thickness, roughness, and average particle height for ZIF-8 obtained from 24%-porous ZnO show values of (132 ± 20) nm, (25 ± 3) nm and (80 ± 8) nm, respectively. Additionally, the potential of the ZIF-8 layers as a photocatalyst for the degradation of the organic dye methylene blue was studied. The ZIF-8 enhances the degradation by approximately 8% when compared to degradation without a photocatalyst.

1. Introduction

Zeolitic imidazolate framework-8 (ZIF-8) is a microporous material with the network formula of Zn(2-methylimidazole)2, or Zn(mIm)2 for short [1]. It exhibits a high Brunauer-Emmett-Teller (BET) surface area of about 2000 m2/g [2,3] and pores with a diameter of 1.16 nm, which are accessible via windows with a diameter of 0.34 nm in the interconnected six-membered rings [4]. ZIF-8 has been shown to be stable against ammonia from room temperature to 350 °C [5] and can maintain its porosity and long-range order up to ca. 2 GPa [6], demonstrating the high thermal, chemical, and mechanical stability of the material.
Up to date, ZIF-8 has been synthesized via a plethora of synthesis methods such as conventional solvothermal methods [7,8], ultrasound synthesis [9], a microwave-assisted method [10], mechano-synthesis [11], high pressure synthesis [12] and steam assisted conversion [13], to name a few.
In 2016, a two-step vapor deposition method (MOF-CVD) was proposed [14], which flaunts considerable advantages over traditional synthesis procedures of ZIF-8. It is a solvent-free, cheap, and environmentally friendly technique, producing no toxic waste. The initially proposed MOF-CVD method consisted of depositing a ZnO thin film via thermal atomic layer deposition and a subsequent conversion of this precursor to ZIF-8 by subjecting the thin film to a powder of the organic linker 2-methylimidazole at elevated temperatures [14]. Since then, the limits and possibilities of the method have been thoroughly investigated, further highlighting its flexibility and adaptability: Different ZnO morphologies have been employed for conversion, such as ZnO nanowire arrays [15] instead of non-porous thin films. Additionally, the impact of various deposition parameters has been inspected, such as the ZnO density and film thickness, the conversion time [16], or the presence of humidity [17]. The effect of different zinc containing precursors onto the resulting ZIF-8 layers has also been examined [17].
One factor that remains largely unexplored to this date is the porosity of the ZIF-8 precursor. So far, either the growth of ZIF-8 from non-porous ZnO [16,17,18] or the synthesis of porous ZnO through calcination of ZIF-8 [19,20] have been examined. In 2017, Kim et al. [21] explored the growth of ZIF-8 on the surface of macroporous ZnO nanostructures, creating ZIF-8/ZnO composite nanostructures with hierarchical porosity. The porous ZnO was synthesized via self-assembly of polymer beads with different diameters and subsequent pyrolysis to remove the polymeric template, resulting in three-dimensional ZnO nanostructures with average pore sizes of ~144 nm and in the range of microns. To the best of the authors’ knowledge, no study about the synthesis of ZIF-8 from porous ZnO thin films and the influence of their porosity onto the properties of the derived ZIF-8 exists.
Due to its advantageous properties, ZIF-8 serves as a desirable test subject for a wide portfolio of industrial uses [22,23,24,25,26]. One prominent application field for ZIF-8 is catalysis [27,28], including photocatalysis [29]. Owing to their high surface area and good stability, ZIFs are well suited to be employed as a photocatalyst in the catalytic degradation of organic pollutants. While studies on the photocatalytic performance of modified ZIF-8 [30] and of various ZIF-8 composites [31,32,33,34] can be readily found, only a few studies on the photocatalytic behavior of pure ZIF-8 exist [29].
In this contribution, ZIF-8 films were grown via a modified MOF-CVD procedure, in which porous ZnO thin films derived from molecular layer deposited (MLD) zincone were employed for conversion. Synthesis of porous ZnO through calcination of MLD zincone poses the advantage that the amount of open porosity can be controlled (e.g., via the MLD deposition temperature and the calcination temperature [35]).
The aim of the study was to assess whether the porosity of the ZnO film has an influence on the conversion process leading to ZIF-8. The obtained ZIF-8 layers were characterized with respect to their topographical, chemical, and crystallographic nature. In addition, their potential as photocatalysts for the degradation of organic dyes in aqueous systems was assessed with the model dye methylene blue. The performance of ZIF-8 was compared to that of porous and non-porous ZnO, as well as of ZIF-8 converted from nonporous ZnO.

2. Materials and Methods

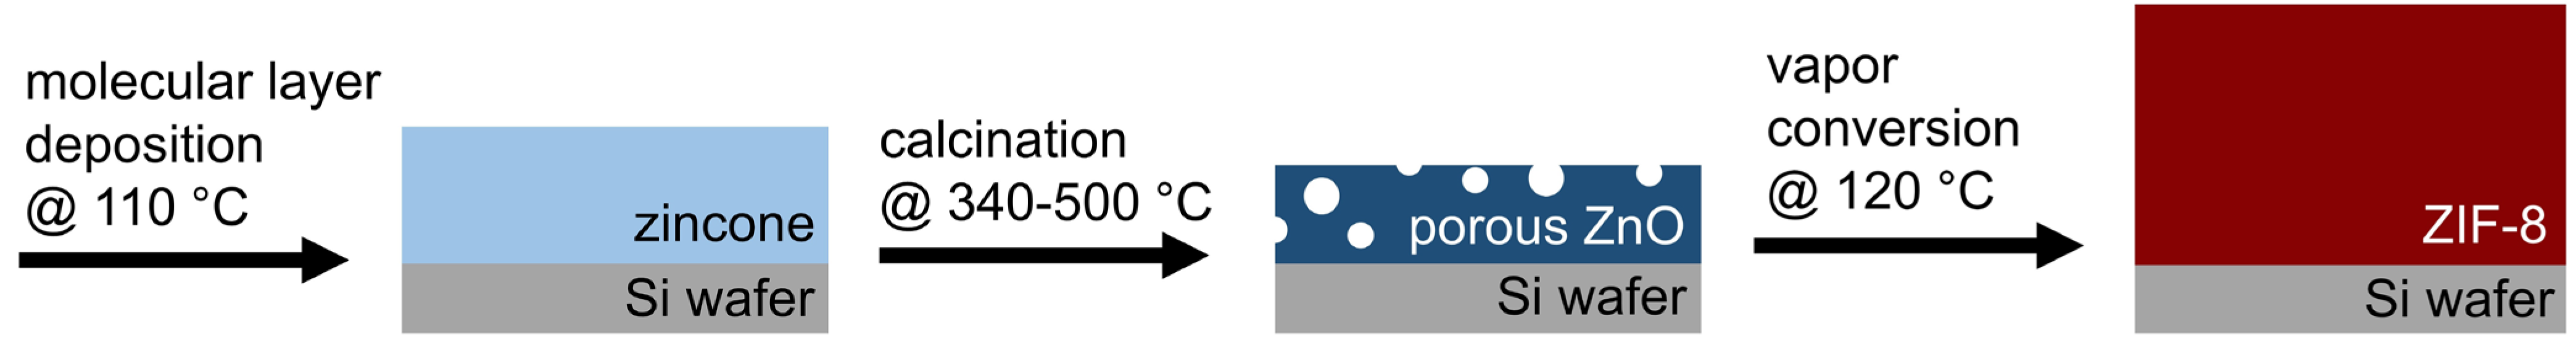
2.1. Sample Synthesis

All ZIF-8 samples were synthesized from porous ZnO thin films via the following three-step process (Figure 1).
First, zincone thin films were deposited on single side polished c-Si (100) substrates (Siegert Wafer, Aachen, Germany) with a size of 1.5 cm2 in a custom-built molecular layer deposition (MLD) reactor [35] for 300 cycles. A process temperature of (110 ± 2) °C was employed for the deposition of zincone.
Subsequently, the zincone layers were calcinated in air at 340 °C, 400 °C, and 500 °C with a heating rate of 3 °C/min using a programmable heating stage, which consisted of a heating plate (PZ20-3TD, Harry Gestigkeit GmbH, Düsseldorf, Germany) and a programmable controller (PR 53T, Harry Gestigkeit GmbH). The calcination process resulted in porous ZnO thin films, as the organic ligands of zincone were removed by the elevated temperature.
Finally, to obtain ZIF-8, the porous ZnO thin films were placed into a 250 mL Schlenk tube together with a glass boat containing 500 mg of 2-methylimidazole (HmIm) powder (Merck, 99%). The tube was closed and evacuated to ~10−1 mbar. The Schlenk tube was placed in a convection preheated oven (Heraeus T6) for different time periods (20 min, 1 h, 24 h) at 120 °C. Afterwards, the samples were removed from the oven while still hot and left to cool under a fume hood before taking the samples out of the Schlenk tube.
Additionally, for the photocatalytic tests, non-porous ZnO thin films were deposited via plasma-enhanced atomic layer deposition (PE-ALD) onto Si wafers (Siegert Wafer) with a size of 1.5 cm2 via PE-ALD in a custom-build direct plasma reactor [36]. Diethyl Zinc (DEZ, Dock/Chemicals) was used as the metal-organic precursor, oxygen plasma as the co-reactant and argon as the purging gas. A single deposition cycle consisted of the sequence (DEZ pulse/Ar purge/plasma exposure/Ar purge) with pulse times of (0.15/15/10/15) in seconds. During plasma exposure, oxygen pressure was kept at 200 μbar and the plasma power at 60 W. The substrate temperature was kept at 35 °C throughout the deposition.
Furthermore, ZIF-8 layers were derived from the PE-ALD ZnO within 24 h via the Schlenk tube conversion process described above.

2.2. Characterization Methods

The density of the porous ZnO thin films was determined on basis of the critical angle of total external reflection of X-rays measured by X-ray reflectivity (XRR) with a Panalytical Empyrean equipped with a copper tube (λ = 1.5418 Å). The primary side of the reflectometer was equipped with a 1/32° slit, a 10 mm beam mask, a multilayer mirror, and an automatic beam attenuator. On the secondary side, a receiving slit of 0.1 mm and a Soller slit of 0.02 rad were placed before the detector (Panalytical Pixel 3D) operated in point mode with three channels. XRR scans were performed in the 2θ region 0.024–4.00° with a step size of 0.008°. The fitting was performed using the software X’Pert Reflectivity (ver. 1.3) by PANalytical, also yielding values for the thickness and roughness of the ZnO thin films.
For the ZnO films used within the photocatalytic measurements, 2θ-scans were conducted with the same diffractometer utilized for the XRR measurements. The incidence angle was fixed to 0.2° while the detector angle was varied from 30° to 40°. A 1/32° divergence slit, a 10 mm mask and a 7.5 mm anti-scatter slit were used in the set-up. The integration time per measurement was set to 1000 s with a step size of 0.0131°. The detector was operated in the 1D mode. For the ZIF-8 layers, X-ray diffraction (XRD) spectra were recorded in a θ/θ-configuration employing a 1/8° divergence slit instead and varying the detector angle from 5° to 40°.
Fourier transform infrared spectroscopy (FTIR) measurements were conducted in transmission mode with a Michelson interferometer (Bruker IFS 66V) in the range of 700–4000 cm−1 and processed in the OPUS software (ver 4.2). The measurement environment was kept under vacuum to minimize light scattering. Reference measurements of a single side polished c-Si (100) substrates (Siegert Wafer) were performed for background subtraction.
The successful synthesis as well as the crystallographic state of ZIF-8 was assessed by grazing incidence X-ray diffraction (GIXD). The GIXD measurements were conducted at the beamline XRD1, Elettra, Trieste, Italy with an incident angle between 0.2° and 1.2° and a wavelength of 1.4 Å for the primary beam. Diffracted intensities were collected on a Pilatus 2M detector, and all data have been recalculated to (wavelength-independent) reciprocal space maps utilizing the in-house developed software package GIDVis (version 10-May-2019) [37]. Intensities are plotted in a pseudo-color representation as a function of the out-of-plane component (qz) and the in-plane component (qxy) of the scattering vector. For the sake of clarity and comparability, all intensity data were plotted in square root representation and are reported using the same color scales. Additionally, “line scans” were extracted from the measurements: this GIDVis function sums intensity values vertically and horizontally, divides them by the number of data points and plots them as a function of the absolute value of the scattering vector |q|.
Topographical information was gained via Atomic Force Microscopy (AFM). The measurements were performed in non-contact mode with a PPP-NCLR-10 cantilever (NanoWorld AG, Neuenburg, Switzerland) on a Nanosurf easyScan 2 instrument in ambient conditions. Data analysis was performed using the freely available software package Gwyddion (ver. 2.55) [38].
The thickness of the samples was assessed through an M-2000V spectroscopic ellipsometer (J.A. Woollam Co. Inc., λ = 370–1000 nm) at three different incident angles (65°, 70°, and 75°). The raw ellipsometry data were fitted using the CompleteEASE software (ver. 5.12, J.A. Woollam Co. Inc., Lincoln, NE, USA) in the whole measurement range employing a Cauchy model. The errors were estimated statistically over all measured samples with the exact same synthesis procedure.
Additional thickness measurements were carried out with an AlphaStep D-500 Profilometer (KLA-Tencor, Milpitas, CA, USA). Profilometry scanning parameters were set to a scan length of 0.5 mm, a speed of 0.05 mm/s, and a stylus force of 1 mg. The height values were obtained by scratching the sample to the substrate and measuring the step height from the substrate to the top of the layer. Due to the resolution limitations of the instrument, only ZIF-8 layers with a thickness > 100 nm (as determined from spectroscopic ellipsometry) were subjected to profilometry. Measurements were performed at three different spots on each sample to estimate a statistical error.

2.3. Photocatalytic Tests

Photocatalytic tests were performed on non-porous ZnO deposited via PE-ALD, porous ZnO derived from MLD zincone via calcination at 400 °C, ZIF-8 converted from the PE-ALD ZnO for 24 h, and ZIF-8 converted from the zincone-derived porous ZnO for 24 h. All samples were synthesized as detailed above (Section 2.1).
A 10−5 mol/L methylene blue (MB, Sigma Aldrich) solution was prepared with demineralized water as the solvent. Each investigated sample was placed in a separate glass beaker and submerged in 10 mL of this solution. The samples were irradiated with a UV lamp (Oriel Instruments, Arc lamp and power supply, Model: 68920) with the power set to 900 W for 3 h in total. During the experiments, the UV lamp was the only light source in the room; all tests were performed at room temperature in ambient air. To avoid evaporation of the MB solution, the lid of a petri dish was placed onto the beaker during irradiation.
At certain time intervals, the beaker was removed from under the lamp and 3 mL of the solution were moved to a quartz cuvette of 1 cm in optical path length and 3 mL in volume with a plastic syringe. Subsequently, the optical absorption spectra (UV-VIS Shimadzu 1800, Shimadzu, Kyoto, Japan) of the MB solution inside the cuvette was measured in the wavelength region between 190 nm and 800 nm. All spectra were baseline corrected and divided by a reference spectrum of a quartz cuvette with demineralized water. Then, the solution was returned to the beaker with the sample inside and stirred before placing the sample back under the UV lamp.
Additionally, for each of the four investigated sample types, one extra sample was submerged into 10 mL of solution but kept in a dark environment and measured as a reference over the course of three hours.
The MB concentration was estimated by the absorbance at 664 nm.
The stability of the samples was controlled with spectroscopic ellipsometry (SE) and XRD, as detailed in Section 2.2.

3. Results and Discussion

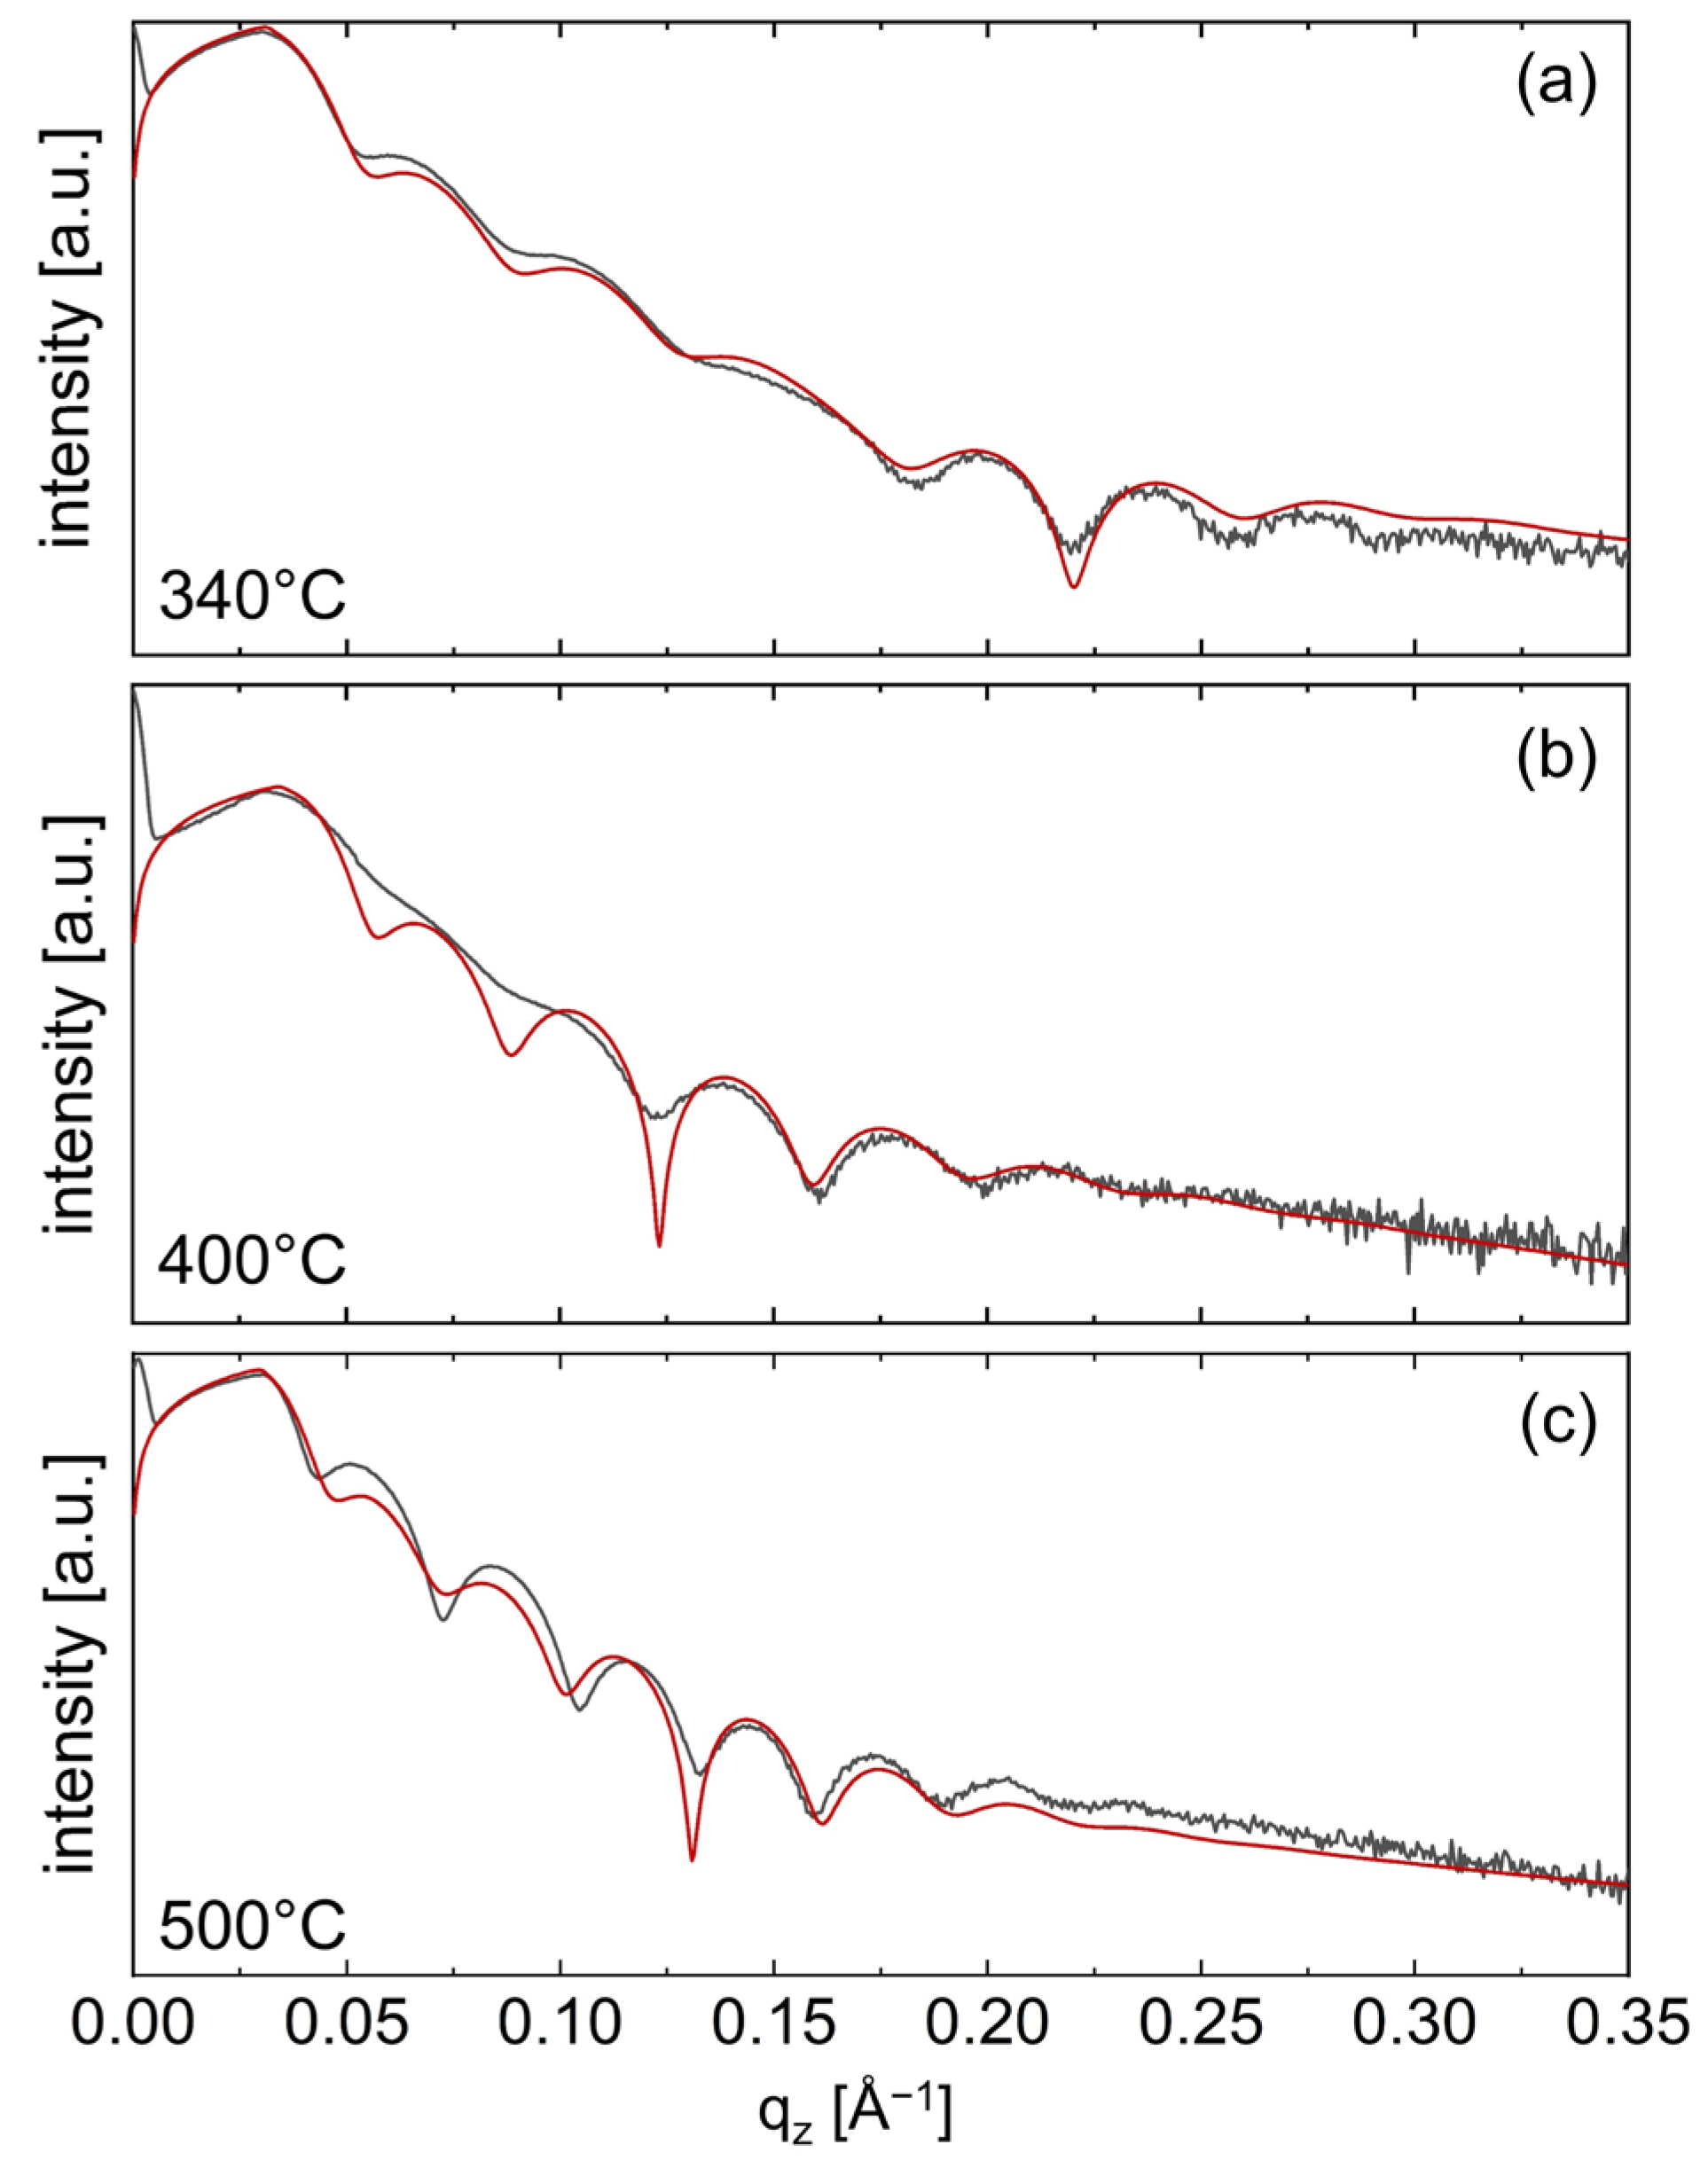
3.1. Investigation of Porous ZnO

Calcination of the molecular layer deposited zincone layers resulted in porous ZnO thin films with a varying degree of open porosity, depending on the calcination temperature. Specifically, open porosities of 14.5%, 16%, and 24% were obtained after calcination at 340 °C, 400 °C, and 500 °C, respectively. Data concerning the open porosity, layer thickness, and crystallographic properties of the ZnO is reported in [35].
To investigate the density of the porous ZnO thin films, XRR measurements were performed (Figure 2). From the fitted data, the thickness of the thin films was determined to (15 ± 1) nm, (16 ± 2) nm, and (20 ± 2) nm for the ZnO with 14.5% (Figure 2a), 16% Figure 2b), and 24% (Figure 2c) of open pores, respectively. These values agree with the ZnO thicknesses determined via SE (Table S1). Additionally, in the same order, the mass density was found to be (3.5 ± 0.5) g/cm3, (4.2 ± 0.6) g/cm3, and (3.1 ± 0.5) g/cm3, overlapping with respect to their uncertainties. The mass densities determined for the porous ZnO are significantly lower than the literature value of 5.6 g/cm3 reported for bulk ZnO [39] and also lower than the 5.2 g/cm3 and 4.6 g/cm3 found for non-porous ZnO obtained via plasma-enhanced atomic layer deposition [16]. Additionally, via fitting the roughness of the investigated ZnO thin films was determined to (1.0 ± 0.2) nm for the 14.5%-porous ZnO, to (1.2 ± 0.2) nm for the 16%-porous ZnO, and to (1.4 ± 0.2) nm for the 24%-porous ZnO.

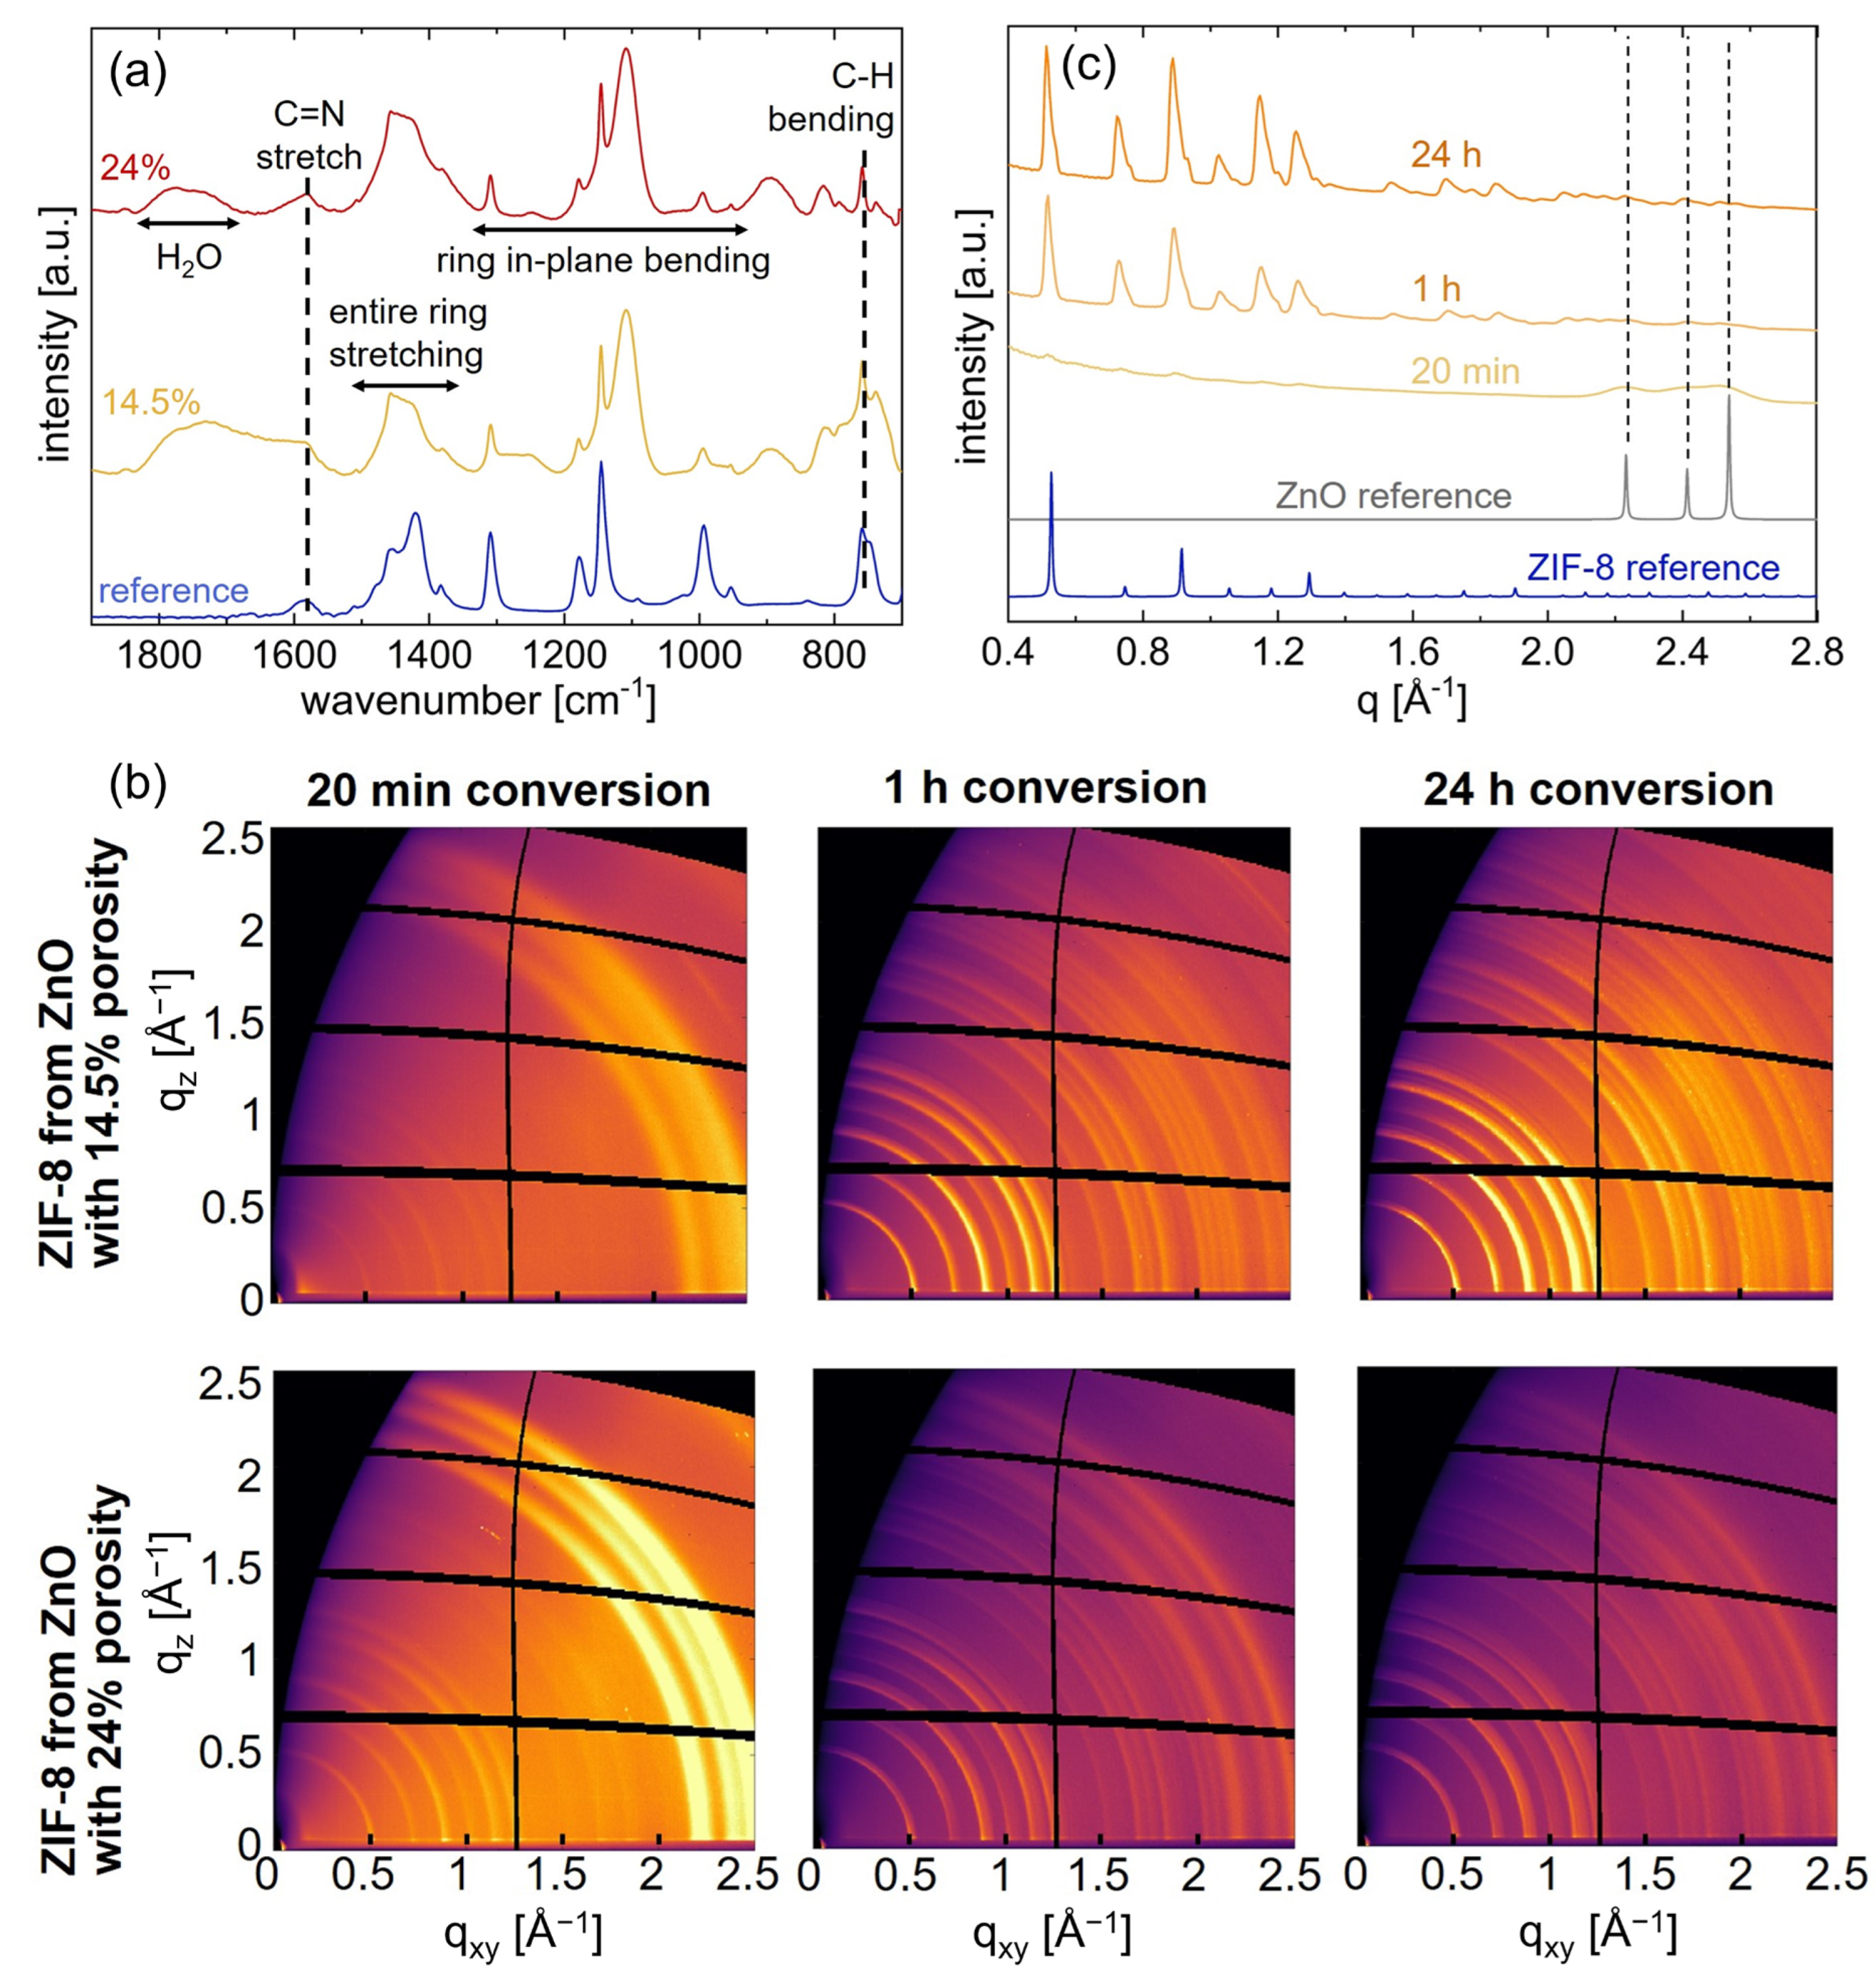
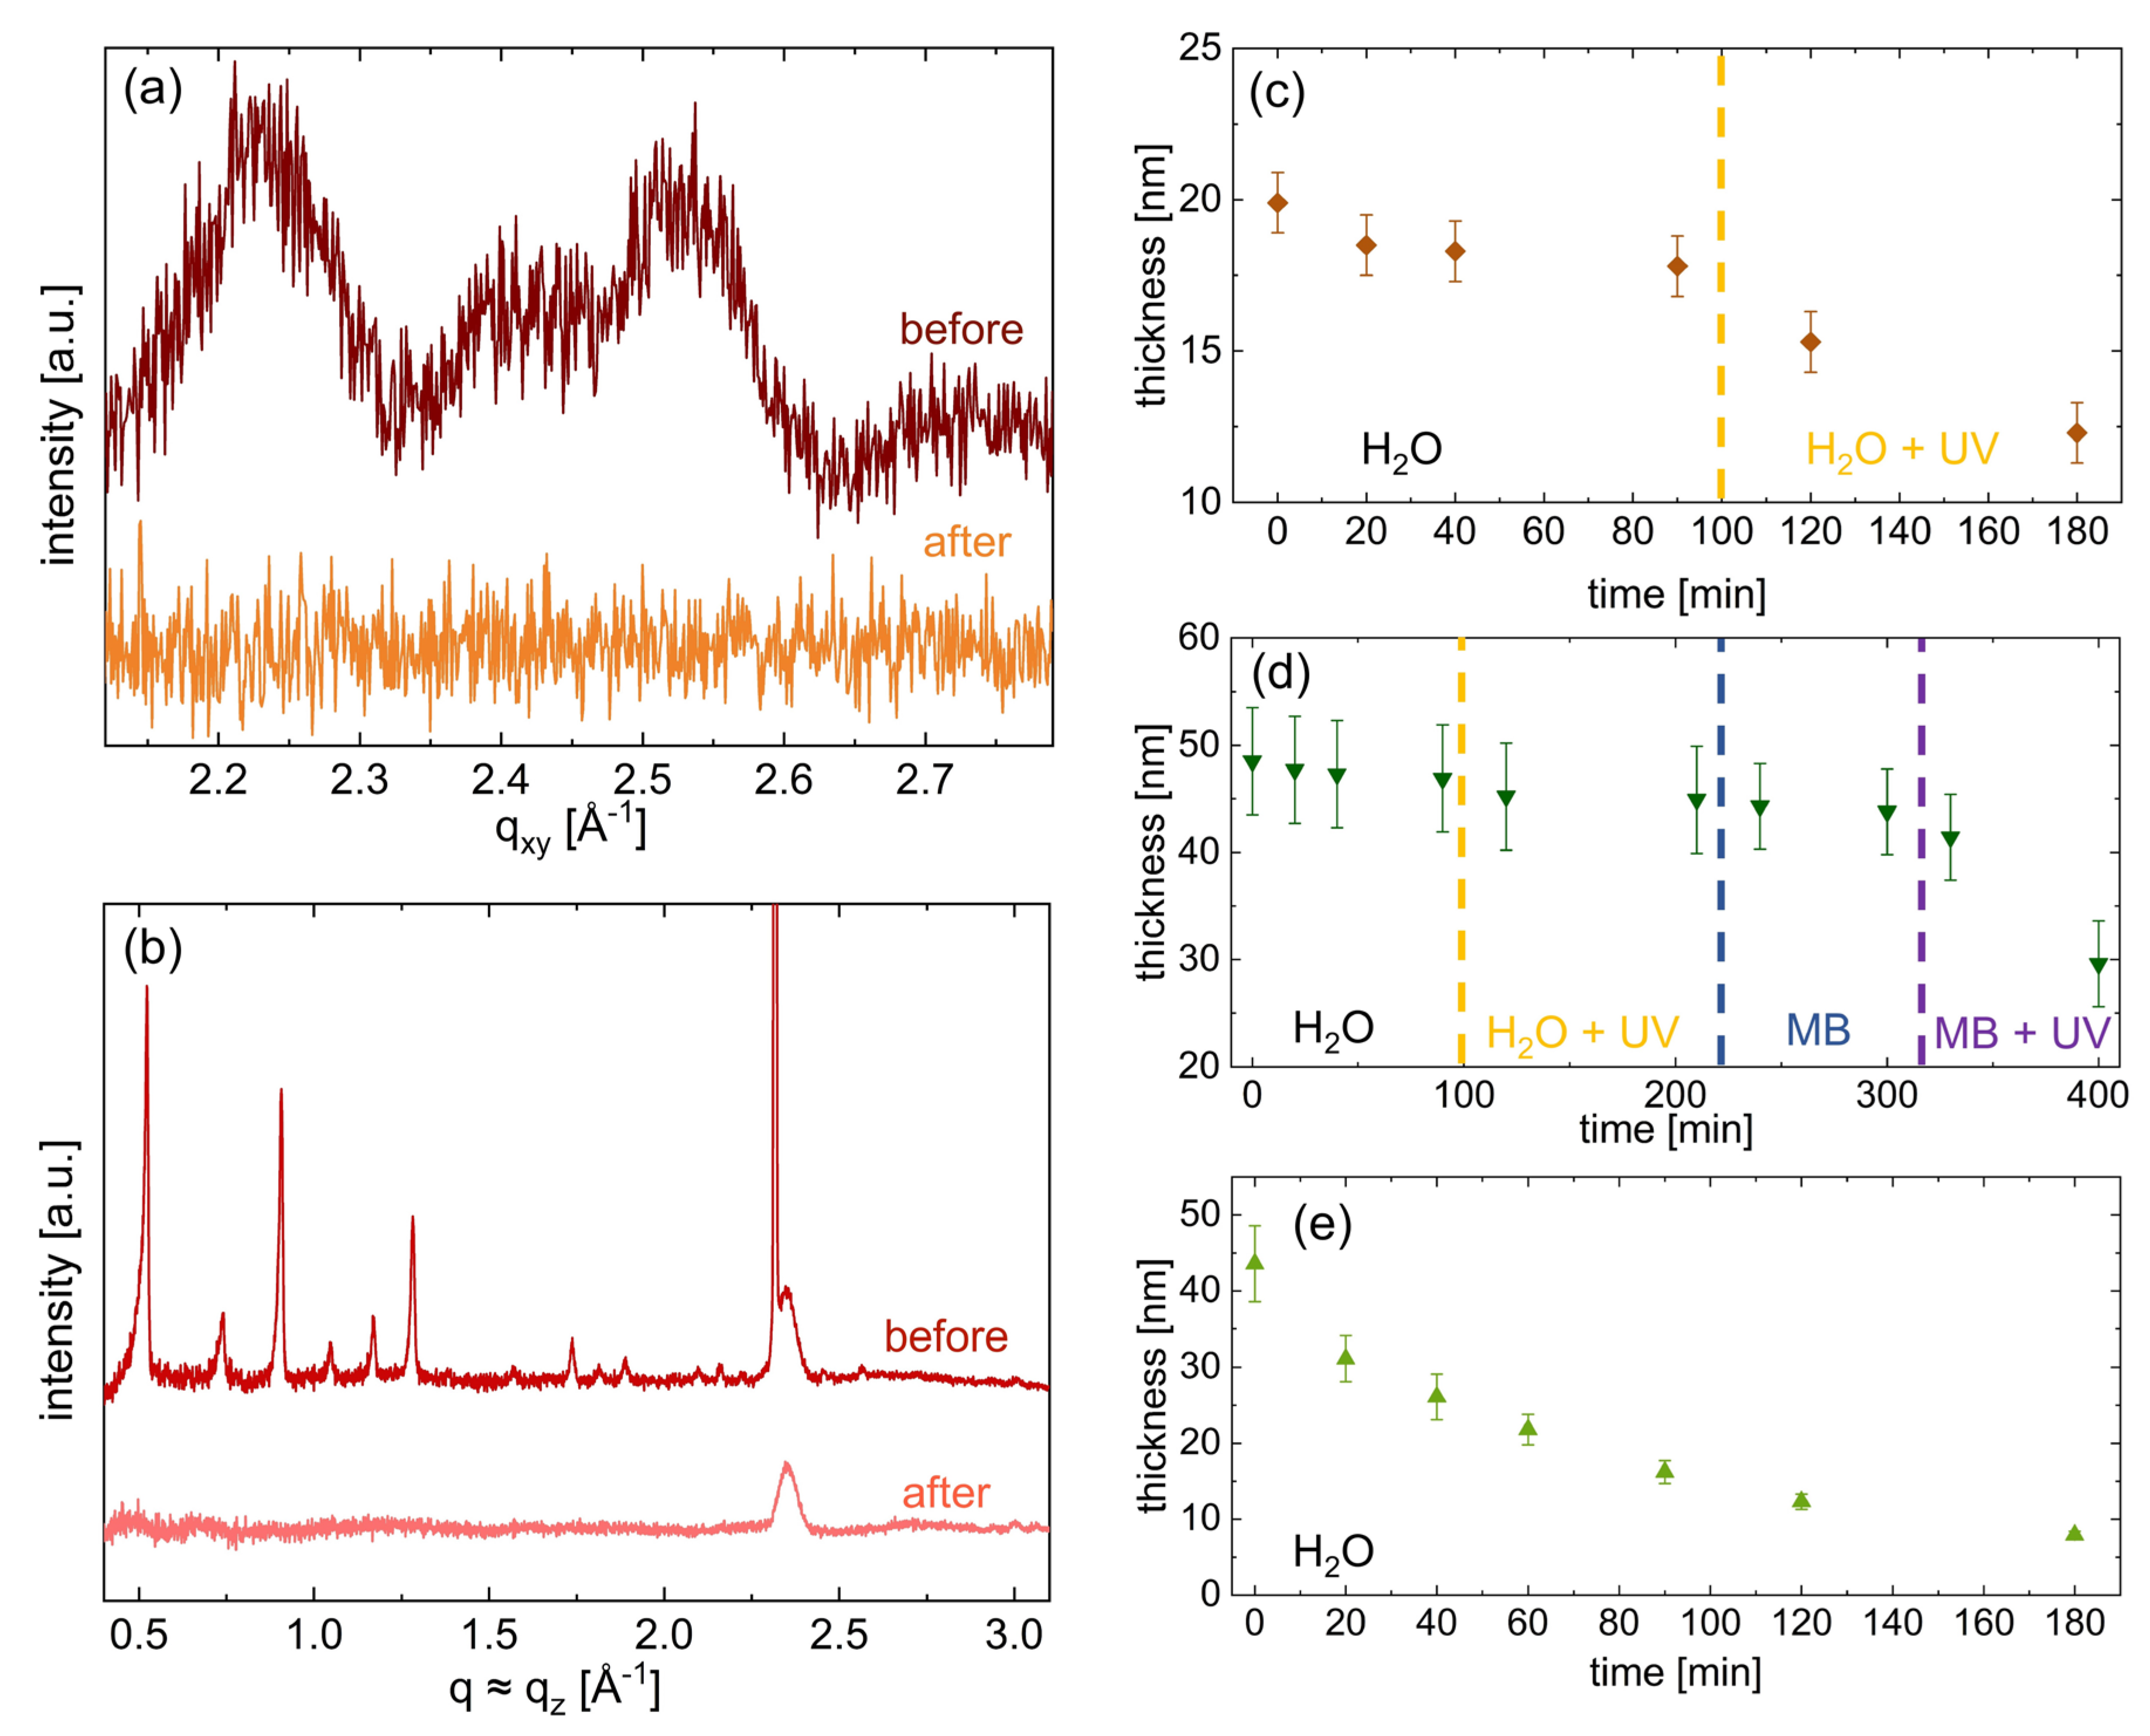
3.2. Chemical and Crystallographic Characterization of ZIF-8

The chemical fingerprint of the synthesized ZIF-8 layers was assessed through FT-IR measurements of the samples gained after 24 h of conversion from ZnO thin films with an open porosity of 14.5% and 24% (Figure 3a). While the complete assignment of the observed IR bands is difficult due to the complex nature of the ZIF-8 framework, most of the absorption bands are associated with the vibrations of the imidazole units and can therefore be described with respect to the origin of the bonds [40].
The spectra presented in Figure 3a exhibit the same peaks, which can be related to the chemical fingerprint of ZIF-8: the peak at 1580 cm−1 corresponds to the C=N stretch mode. Whereas the bands in the spectral region of 1500 cm−1 to 1350 cm−1 are associated with the entire ring stretching, the peaks observed between 1350–900 cm−1 belong to the in-plane bending of the ring. The peaks below 800 cm−1 result from the out-of-plane bending, with the peak at 760 cm−1 assigned to the aromatic sp2 C-H bending. Due to the limitations of the employed FT-IR apparatus, the Zn-N stretch mode expected at 421 cm−1 could not be observed [41,42].
Complementing the FT-IR measurements, successful synthesis of ZIF-8 was further confirmed with GIXD (Figure 3b,c and Figure S1). At short conversion times, three prominent Debye-Scherrer rings are observed at q > 2 Å−1, which can be assigned to ZnO. Additionally, Debye-Scherrer rings, which correspond to the polycrystalline structure of ZIF-8, are visible at lower values of q. The intensity of the rings belonging to the randomly oriented ZIF-8 crystallites increases with increasing conversion time while the rings associated with ZnO diminish. This trend is observed for all synthesized ZIF-8 samples, regardless of the ZnO porosity amount. An exemplary indexation of the Debye Scherrer rings with the polycrystalline structure of ZIF-8 [43] can be found in Figure S1c.
A previous study has shown that low density ZnO thin films—as present in this study—can result in ZIF-8 layers with a preferred orientation [16]. However, this preferred orientation did not only derive from the ZnO density, but also on the ZnO thickness since a distinct (100) orientation of ZIF-8 was only achieved for samples converted from ZnO with a film thickness below 3 nm and a relatively low density of around 4.6 g/cm3. Thicker layers (~9 nm) resulted in a very broad (111) orientation with a spread around the preferred orientation of about 30°. Since the density of the porous ZnO utilized in the present study is even lower than the density of the ZnO of the cited study, it seems that the lack of a preferred orientation in the GIXD data presented here is due to the greater thickness of the employed ZnO, which is above 14 nm for all samples. It can be expected, that ultra-thin ZnO layers provide facilitated linker access during the conversion from ZnO to ZIF-8 compared to thicker layers (i.e., >10 nm). The mobility of the ZIF-8 particles from very thin precursor layers might also be increased, potentially enhancing the crystallization process and, thus, resulting in a preferred crystallographic orientation [16].
Other literature studies, which showed the synthesis of ZIF-8 via the MOF-CVD method, resulted as well in powder-like GIXD patterns, characteristic of random crystallite orientations [17,18,19,20,21,22,23,24,25,26,27,28,29,30,31,32,33,34,35,36,37,38,39,40,41,42,43,44]. This highlights that the growth process and crystal ripening of ZIF-8 grown via the MOF-CVD method are influenced by its precursor and conversion time.
Line scans, extracted from the GIXD measurements of ZIF-8 grown from ZnO with an open porosity of 14.5%, show the intensity as a function of the absolute value of the scattering vector |q| and are compared to reference powder spectra of ZnO [45] and ZIF-8 [43] (Figure 3c). The peaks assigned to ZIF-8 significantly increase in intensity between 20 min and 1 h of conversion time, mirroring the impression gained from the images in Figure 3b. Additionally, the measurements exhibit broad peaks just above and below q = 2.3 Å−1 for the sample converted for 20 min, which can be assigned to ZnO. The peaks decrease in size for increasing conversion times in accordance with the advancing conversion process. Nevertheless, a small residue of ZnO remains even after 24 h of conversion. The same trend is observable for the other samples (e.g., with 24% of open porosity) (Figure S1d). This finding corresponds to a previous study, which detected residual ZnO for ZIF-8 converted from a 15 nm ZnO thin film [14]. A possible explanation for the remaining ZnO is that the conversion process starts at the top of the ZnO thin film and that the vaporized linker cannot access all of the “buried” ZnO remaining underneath the already converted ZIF-8 layer if the employed ZnO thin film exceeds a certain thickness.
Figure 3. (a) Fourier transform infrared spectroscopy of ZIF-8 converted for 24 h from ZnO thin films with open porosities of 14.5% and 24% compared to data of a ZIF-8 powder reference. (b) Grazing incidence X-ray diffraction (GIXD) measurements of ZIF-8 grown from porous ZnO, with conversion times between 20 min to 24 h. (c) Line scans of grazing incidence X-ray diffraction (GIXD) measurements of ZIF-8 grown for 20 min to 24 h from ZnO with an open porosity of 14.5%. Powder reference patterns of ZnO and ZIF-8 are shown for comparison [43,45].
Coatings 13 00718 g003

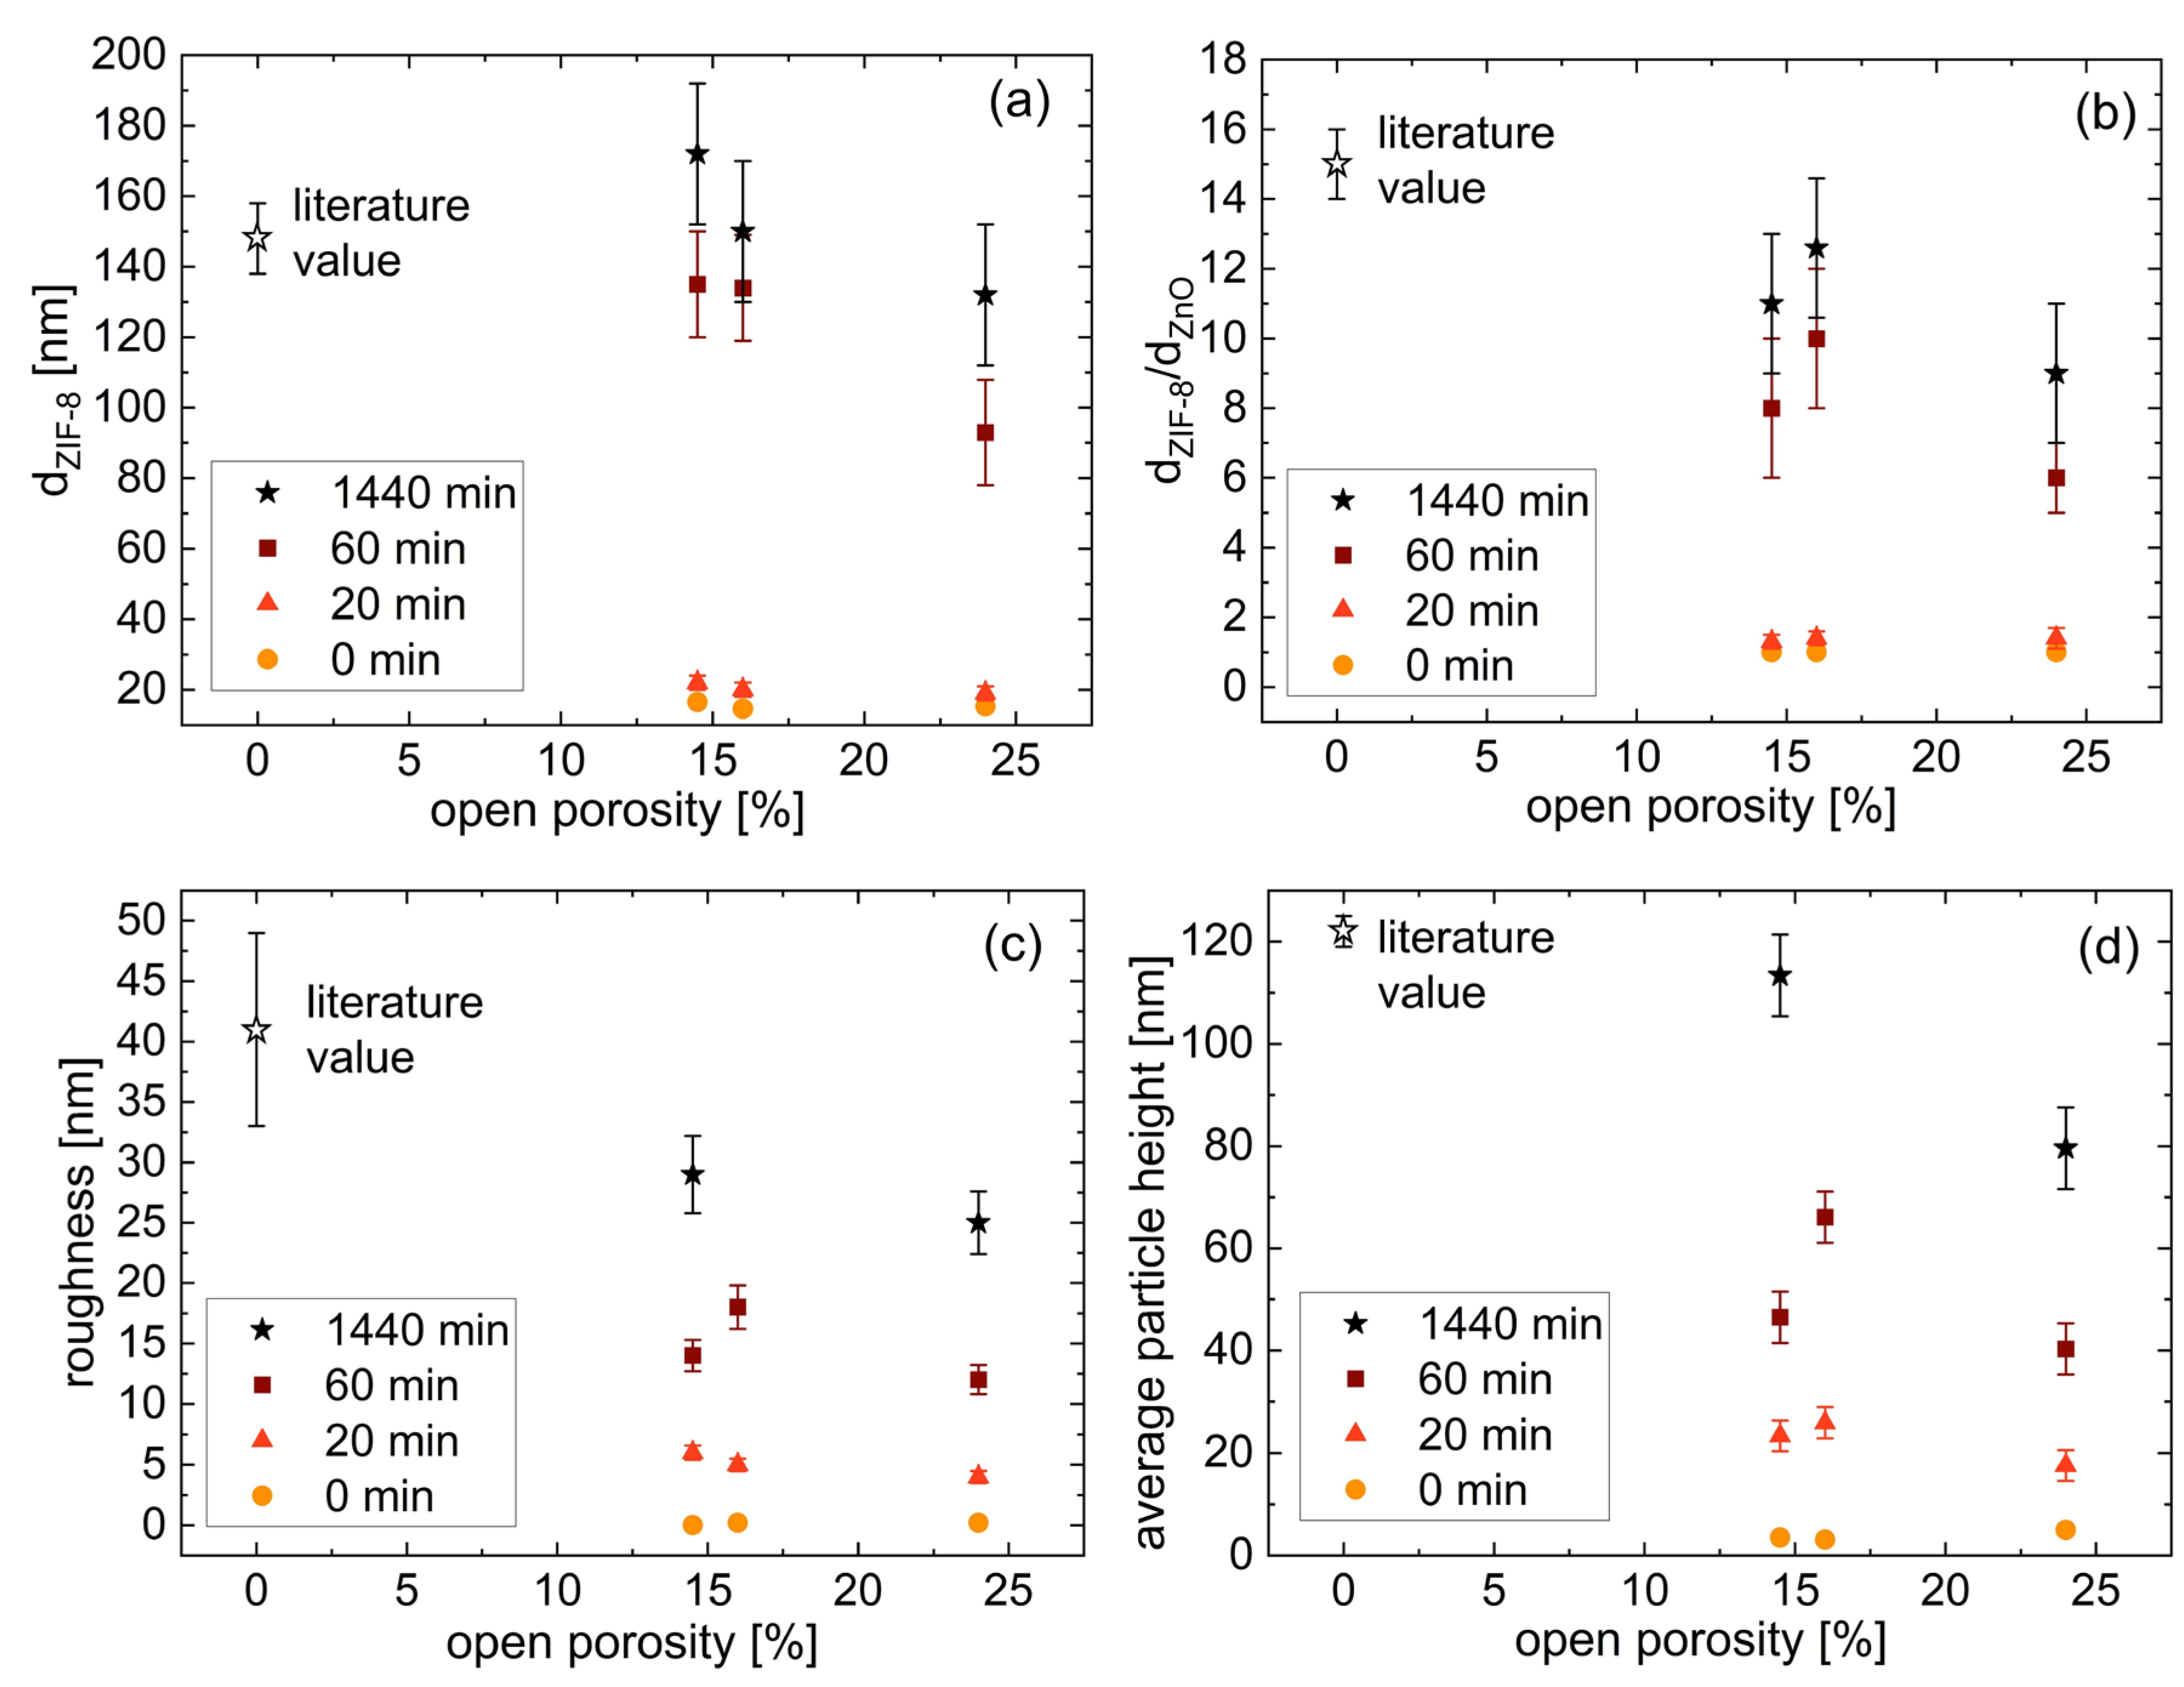
3.3. Growth and Topographical Development of ZIF-8

Spectroscopic ellipsometry (SE) measurements show that the thickness of the ZIF-8 layers synthesized from porous ZnO rises in accordance with the conversion time (Figure 4a). These findings corroborate with complementary profilometry measurements, as detailed in Table S1.
In addition to the overall layer thickness, the relative thickness increase of the samples at each investigated conversion time could also be determined (Figure 4b), resulting in a (11 ± 2)-fold, (13 ± 2)-fold, and (9 ± 2)-fold thickness increase for ZIF-8 from ZnO with open porosity values of 14.5%, 16%, and 24%, respectively, after conversion for 24 h. The majority of the thickness increase is already achieved within the first hour of conversion, reinforcing the assumption that the better part of the ZnO thin film has been converted to ZIF-8 after this time period, as indicated by the GIXD results (Figure 3b).
The thickness increase and overall thickness of ZIF-8 behave as expected: the thickness is clearly influenced by the conversion time, as previous studies have also reported [16,17,18,19,20,21,22,23,24,25,26,27,28,29,30,31,32,33,34,35,36,37,38,39,40,41,42,43,44]. In addition, a broad variation of thickness increases can be found in the literature for the vapor conversion of ZIF-8 from ZnO thin films, ranging from 8-fold [16] to about 17-fold [14] depending on the precursor, conversion time, linker vapor concentration, and reactor type. These literature findings suggest that the thickness increase heavily depends on an interplay between precursor thickness and density, with thinner and less dense ZnO layers generally resulting in a higher thickness increase [16]. Whereas the ZnO utilized here falls into the category “less dense” (<5 g/cm3), they also fall under the category of “thicker” layers (>10 nm), which blocks the linker vapor from accessing the bottom ZnO during the conversion process [16]. Apparently, this is not mitigated by the introduction of pores to the precursor. Thus, unreacted ZnO remains underneath a layer of converted ZIF-8 (Figure 3c), resulting in a less pronounced thickness increase than one might expect.
To assess the impact of the porosity of the ZnO onto the growth of ZIF-8, the obtained results are compared to literature values of ZIF-8 converted for 24 h from non-porous ZnO [16]. The non-porous ZnO was obtained via plasma-enhanced atomic layer deposition (PE-ALD) and exhibited a thickness of ~9.2 nm and a density of about 4.6 g/cm3. The absence of porosity in ZnO deposited via saturated PE-ALD processes has been demonstrated in a previous publication [46].
For long conversion times (i.e., 24 h), the results hint at a decrease in total thickness of ZIF-8 with increasing porosity (Figure 4a). The literature value that consists of ZIF-8 from non-porous ZnO, lies within the uncertainty of all other values. The ZIF-8 precursor used for the literature value was at least 5 nm thinner than the porous ZnO thin films employed in the present study, therefore providing less material that can be converted, which is likely the cause of the lower ZIF-8 thickness.
In addition, for the relative thickness increase during conversion (Figure 4b), the downward trend continues with respect to increasing ZnO porosity.
It is known that the conversion process significantly depends on many precursor properties (e.g., thickness, density, defect rate), thus complicating the observation of a clear trend about the effect of the open porosity of the ZnO thin films onto the overall thickness and thickness increase of ZIF-8. One possible explanation for the observed behavior could be that the amount of synthesized ZIF-8 simply depends on the amount of available precursor: as the introduction of pores reduces the amount of available ZnO, less ZIF-8 results from the conversion process.
Information about the development of the root mean square (RMS) roughness (Figure 4c), the mean particle height (Figure 4d), and the topography (Figure S2) of the synthesized ZIF-8 layers for different conversion times was obtained via AFM. As the ZIF-8 sample obtained from 16%-porous ZnO after 24 h of conversion detached itself from the substrate during the photocatalytic measurements (see Section 3.4), no AFM results could be obtained from that sample.
The RMS roughness, as well as the average particle height, grow in tandem with the conversion time and rise significantly between 1 h and 24 h of conversion for ZIF-8 obtained from ZnO with 14.5% and 24% open porosity. For the 14.5%-ZnO, the roughness increases from (14 ± 1) nm to (29 ± 3) nm and the average particle height from (46 ± 5) nm to (113 ± 8) nm for conversion times between 1 h and 24 h. For the 24%-ZnO, the roughness increases from (12 ± 1) nm to (25 ± 3) nm and the average particle height from (40 ± 5) nm to (80 ± 8) nm for the same employed conversion times. The increase in roughness and average particle heights even after relatively long conversion times has been previously observed and attributed to crystal ripening effects [16].
The AFM results of the ZIF-8 synthesized from porous ZnO were again compared to literature values of the same ZIF-8 sample derived from non-porous ZnO that was already used above for comparison of the SE thickness values. At long conversion times of 24 h, the RMS roughness and the average particle height of ZIF-8 decrease with increasing precursor porosity, continuing the trend observed for the SE results (Figure 4a,b).

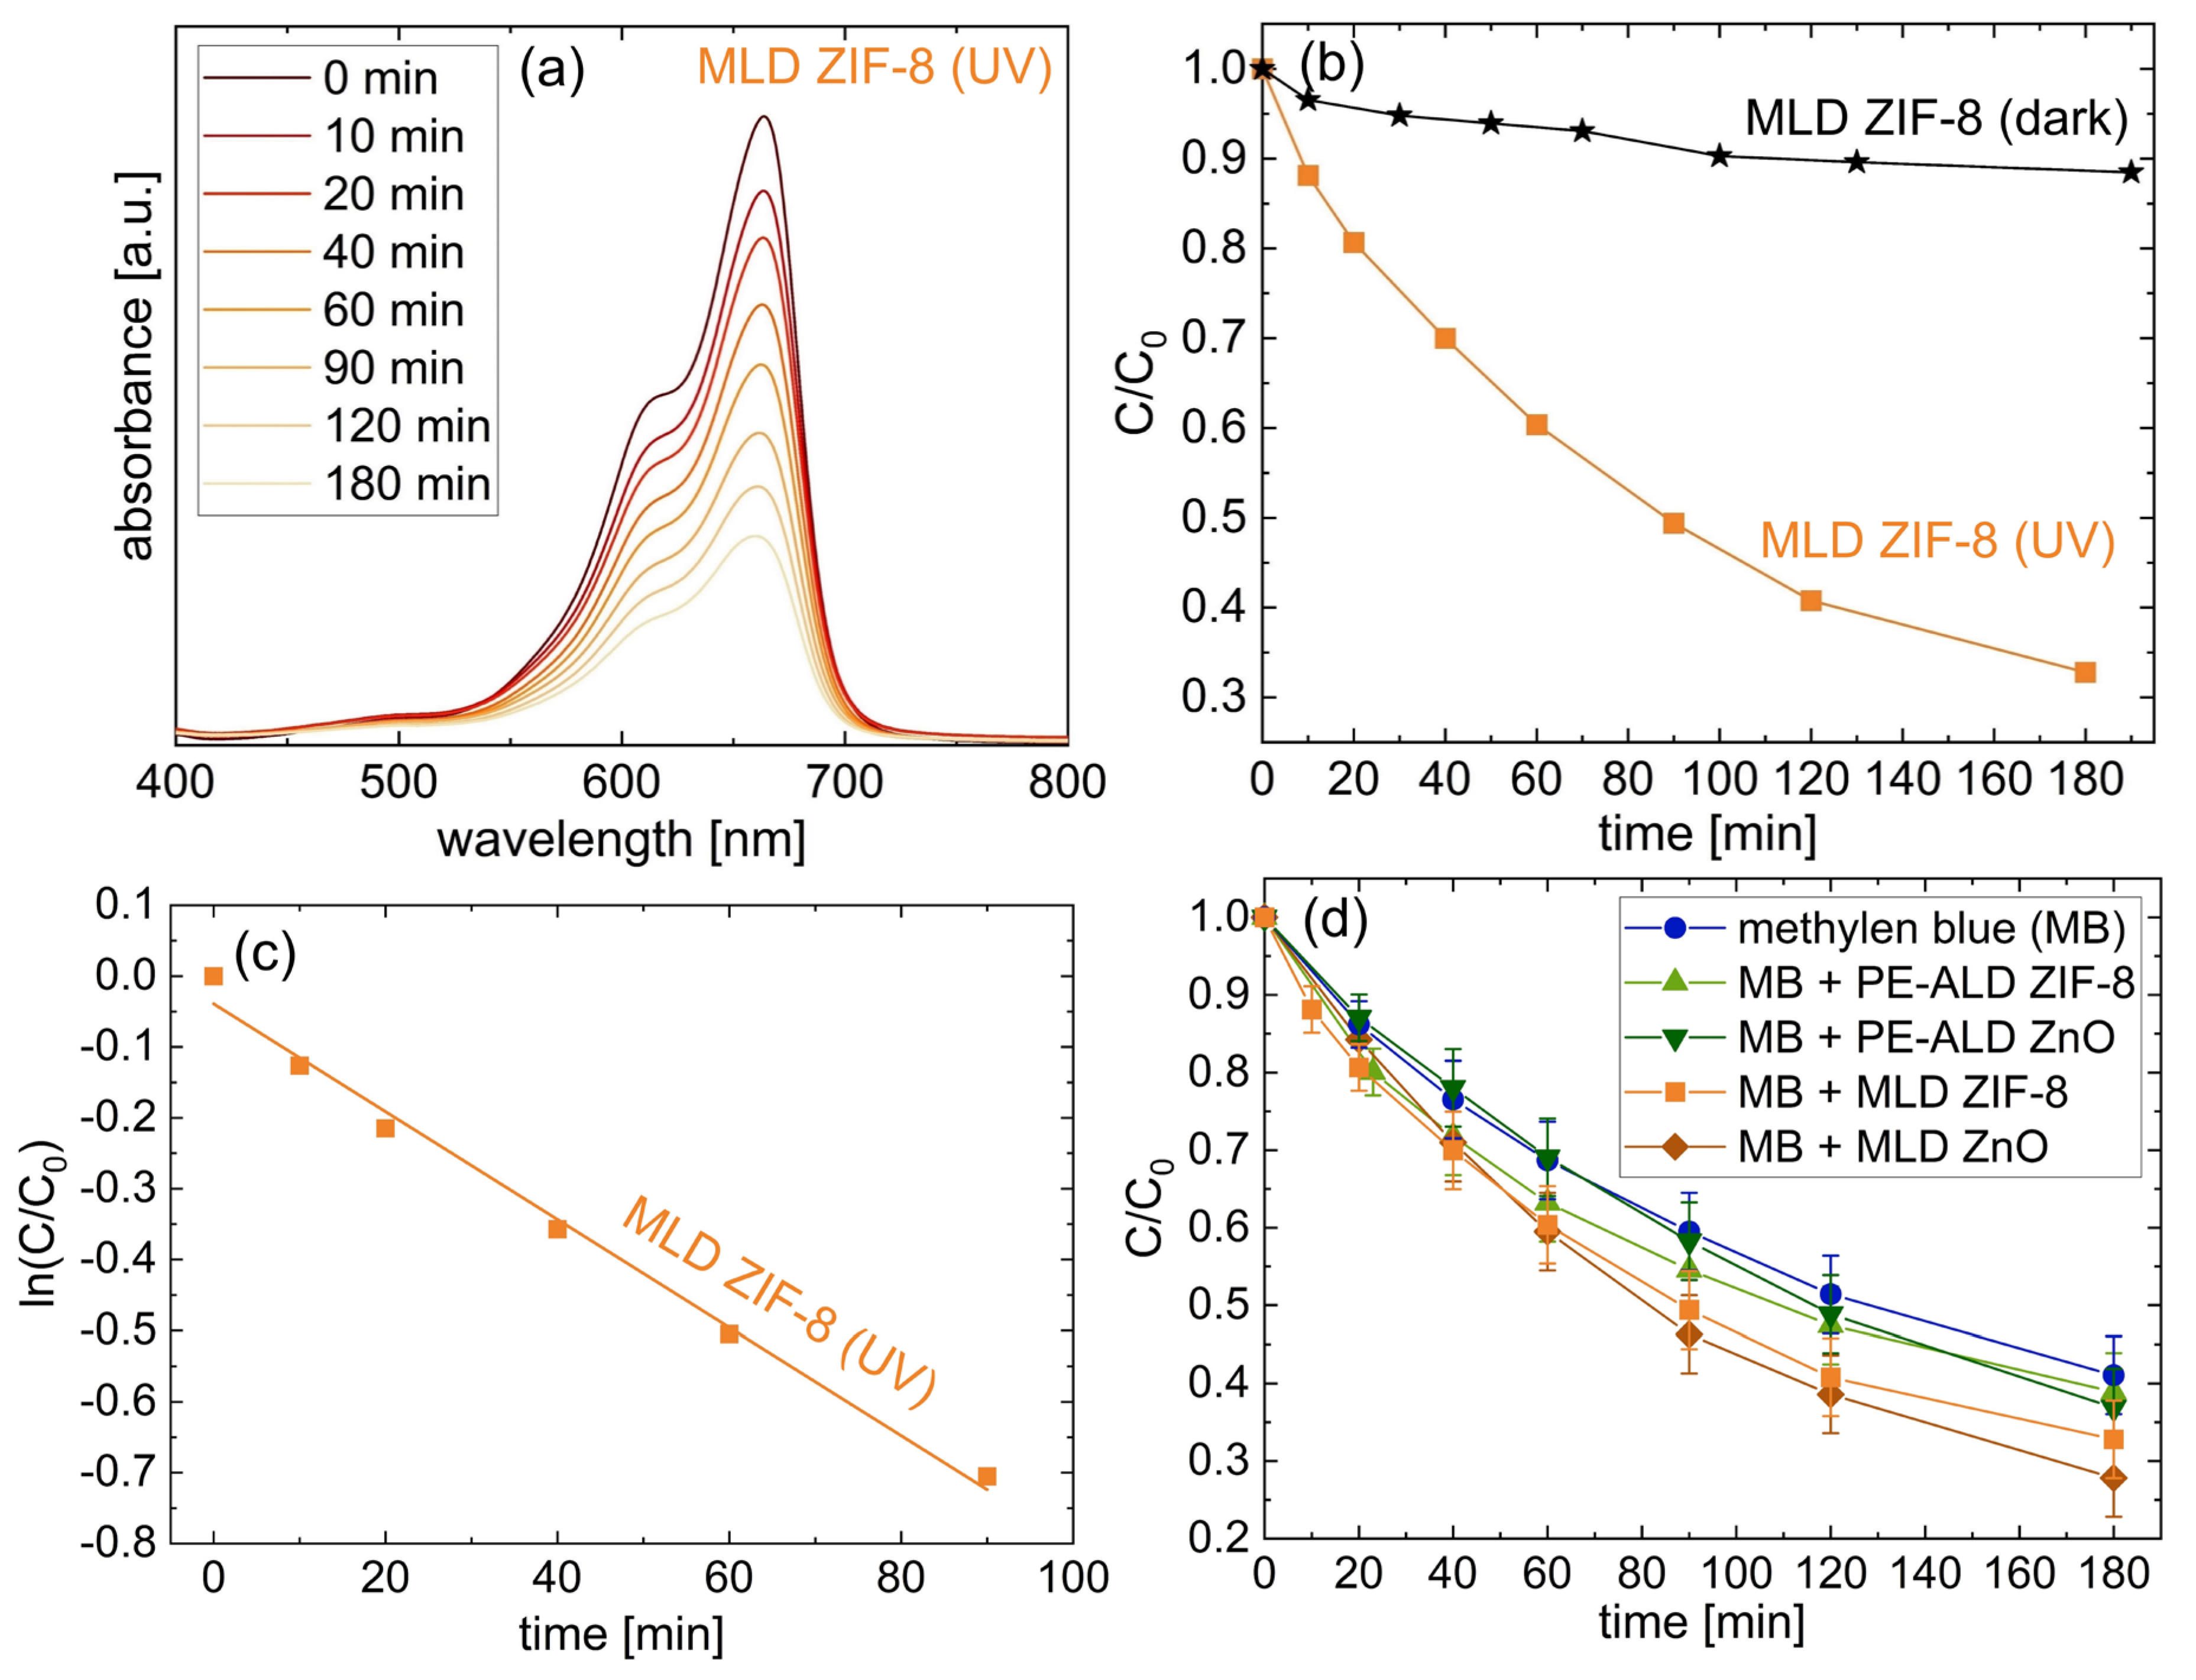
3.4. Photocatalytic Tests

To evaluate the efficiency of ZIF-8 converted from porous ZnO (“MLD ZIF-8”) as a photocatalyst, the photocatalytic degradation of methylene blue (MB) was assessed under the presence of a ZIF-8 sample obtained from 16%-porous ZnO after 24 h of conversion (Figure 5). ZIF-8 obtained from 16%-porous ZnO was chosen as the “middle ground” with respect to all investigated ZnO porosity values. It is assumed, that this choice provides the most sensible demonstration of the general photocatalytic behavior of the ZIF-8 layers synthesized within this study. As depicted in Figure 5a, the absorption peak of the MB solution subjected to UV-light in the presence of the MLD ZIF-8 sample diminishes over time, indicating the successful degradation of MB. The corresponding concentration change of the MB solution is illustrated in Figure 5b. An additional beaker containing MB solution and a MLD ZIF-8 sample was kept in a dark environment. Whereas the solution from the illuminated beaker lost ~70% of its initial concentration in the course of 3 h, the beaker kept in the dark only lost ~10%, showcasing that the significant degradation of the illuminated sample is due to the UV-irradiation (Figure 5b).
The photodegradation of MB in presence of the MLD ZIF-8 photocatalyst follows a pseudo-first-order kinetics model with a coefficient of determination r2 = 0.992, as shown by the linear plot of ln(C/C0) vs reaction time in Figure 5c. The pseudo-first-order rate constant for the photocatalytic degradation of MB in MLD ZIF-8 was determined to be 0.8 × 10⁻² min−1.
Furthermore, the photocatalytic performance of MLD ZIF-8 was compared to three other sample types, namely ZnO thin films with an open porosity of 16% (“MLD ZnO”), non-porous ZnO thin films deposited via PE-ALD (“PE-ALD ZnO”), and ZIF-8 layers synthesized therefrom (“PE-ALD ZIF-8”). Additional information about the properties of these samples can be found in the supporting information (Figure S3). Furthermore, the photodegradation of the MB solution without the presence of a catalyst was investigated. The results, depicted in Figure 5d, show that all four employed sample types enhance the photocatalytic degradation of MB compared to the degradation of the MB solution without the presence of a photocatalyst. Of all investigated materials, the MLD ZIF-8 and the MLD ZnO exhibit the greatest effect onto the photodegradation of the MB solution. Whereas after three hours of UV irradiation, (59 ± 5)% of MB have been degraded without a photocatalyst, the presence of MLD ZIF-8 or MLD ZnO results in a degradation of (67 ± 5)% and (72 ± 5)%, respectively.
This behavior can be explained by the principle behind the photocatalytic effect: it is widely recognized that hydroxyl radicals (•OH) are the crucial active species during the photocatalytic process. While irradiating pure water with UV light results in the formation of hydroxyl radicals [47], the presence of photocatalysts, such as ZnO or ZIF-8, can enhance this effect through generation of •OH and •O2 on the surface of the catalyst, and corresponding reaction mechanisms have been previously proposed [29,30,31,32,33,34,35,36,37,38,39,40,41,42,43,44,45,46,47,48]. These proposed reaction mechanisms are discussed in more detail in the supporting information (Figure S4 and corresponding text).
A previous investigation of the degradation of MB has detected its colorless reduced form, namely leuco-methylene blue (LMB), as an additional indicator for the successful degradation of MB, at ~246 nm [49]. Within the present study, an increase in LMB throughout the photocatalytic tests was not detected (Figure S5). This is probably due to the fact that the study was carried out in ambient air since LMB can switch back to the original blue MB through a hydrogenation/oxidation reaction mechanism when exposed to oxygen [49].
Even though the present catalysts enhance the photocatalytic effect, the extent of this enhancement appears weak when compared to other studies about the degradation of MB in presence of a powder like ZIF-8 powder [29]. However, this could be due to the relatively low amount of catalyst utilized in the experiments presented here. For a rough estimate, we can calculate the volume of the powder (e.g., the MLD ZIF-8) by the area of the substrate times the height of the layer (e.g., 1.5 cm × 1.5 cm × 150 nm). The bulk density of ZIF-8 is estimated by a value for commercially available ZIF-8 (0.35 g/cm3 [50]). Multiplying the density with the obtained volume of MLD ZIF-8 results in 0.012 mg, which were used during the experiment in 10 mL MB solution. In contrast, the cited literature study used 5 mg of ZIF-8 powder in their study for the same amount of solution with the same concentration. Even if we estimate the weight of our ZIF-8 layer conservatively by using the nominal crystal density of 0.95 g/cm3 [2] instead, the resulting estimate of 0.032 mg is still lower than the amount found in the literature by a factor of 102. It is remarkable that such a small amount of ZIF-8 results in an enhanced photocatalytic effect compared to the MB solution without a catalyst.
The stability of the samples employed in the photocatalytic tests was determined via XRD and SE (Figure 6). SE thickness measurements reveal that all utilized samples exhibit significant thickness losses during the photocatalytic measurements. The MLD ZnO retained about 12% of its original thickness and the MLD ZIF-8 about 3%. The PE-ALD ZnO preserved approximately 14% of its original thickness, and the PE-ALD ZIF-8 showed a remaining thickness of 9% after the photocatalytic measurements. The XRD data agrees with the findings of the SE measurements: for the MLD ZnO (Figure 6a) clear diffraction peaks can be seen, which are associated with the polycrystalline structure of ZnO, before employing the sample in the photocatalytic test. However, no peaks can be detected after the experiment. Similarly, XRD data of MLD ZIF-8 (Figure 6b) exhibits a diffraction pattern typical for the polycrystalline structure of ZIF-8 before the photocatalytic test, but after the experiment no crystallographic peak—except the one corresponding to the Si substrate—remains.
To determine what causes the thickness loss of the samples used in the photocatalytic tests, the employed sample types were subjected to different test environments, and their thickness was determined via SE after several time intervals (Figure 6c–e). The samples were first subjected to demineralized water in ambient conditions, then to demineralized water under UV-radiation. In a third step, the samples were subjected to the MB solution in ambient conditions, and lastly, they were placed under the UV lamp while submerged in the MB solution. This experiment revealed that the thickness loss is caused by different factors for the different sample types. The porous ZnO remained stable when submerged in purified water but exhibited significant thickness losses after being subjected to UV light (Figure 6c). The ZnO deposited via PE-ALD remained stable until it was submerged in MB solution and additionally subjected to UV light (Figure 6d). The ZIF-8—e.g., ZIF-8 obtained from PE-ALD ZnO (Figure 6e)—lost a significant amount of thickness after being submerged in water.
The dissolution of ZnO thin films when subjected to UV illumination has been examined previously [51] and is attributed to photo-generated holes on surface defect sites. Regarding ZIF-8, a previous study demonstrated the stability of ZIF-8 powder employed in photocatalytic tests by comparing XRD and FT-IR measurements of the fresh powder to the used one, and they detected no changes [29]. It is therefore hypothesized that the ZIF-8 retains its catalytical behavior after separation from the substrate.

4. Conclusions

The growth, as well as the crystallographic, topological, and photocatalytic properties of ZIF-8 layers derived from porous ZnO thin films, were investigated in order to assess the potential impact of the precursor porosity onto the conversion process.
For synthesis, first, MLD deposited “zincone”-layers were calcinated at 340 °C, 400 °C, and 500 °C to obtain ZnO thin films with different open porosities of 14.5%, 16%, and 24%, respectively. Subsequently, these porous ZnO thin films were subjected to a 2-methylimidazole vapor at 120 °C for different time periods ranging between 20 min and 24 h, resulting in continuous ZIF-8 layers.
The successful synthesis of ZIF-8 was confirmed with FT-IR and GIXD measurements. Furthermore, the GIXD measurements showed that the intensity of the ZIF-8 peaks increases over conversion time, indicating a progressing conversion process and thus agreeing with previous literature studies. In addition, the thickness, roughness, and average particle height of the ZIF-8 layers as determined via SE and AFM generally increase in tandem with the conversion time, reaching values up to (172 ± 20) nm, (29 ± 3) nm, and (113 ± 8) nm, respectively, for ZIF-8 obtained from ZnO, with an open porosity of 14.5%. After long conversion times (i.e., 24 h), the results hint at a more pronounced growth of ZIF-8 from less porous ZnO. One possible explanation for this behavior could be that the amount of synthesized ZIF-8 simply depends on the amount of available precursor: thus, the introduction of pores, which reduces the amount of available ZnO, would lead to less ZIF-8 after the conversion process.
Additionally, the potential of the MLD ZIF-8 thin films as photocatalysts for the degradation of MB was assessed and compared to MLD ZnO, PE-ALD ZnO, and PE-ALD ZIF-8. Of all investigated materials, the MLD ZIF-8 and the MLD ZnO show the greatest effect concerning the photodegradation of the MB, increasing the degradation from (59 ± 5)% without a photocatalyst, to (67 ± 5)% or (72 ± 5)%, respectively, after three hours of UV irradiation. Additional stability tests showed that the ZnO films are unstable when subjected to UV light, as are the ZIF-8 layers are when submerged in water. Nevertheless, it is thought that the ZIF-8 retains its photocatalytic activity after separation from the substrate.

Supplementary Materials

The following supporting information can be downloaded at: https://www.mdpi.com/article/10.3390/coatings13040718/s1, Table S1: Thickness of porous ZnO thin films and thickness of ZIF-8 synthesized from the ZnO; Figure S1: Additional grazing X-Ray diffraction data of ZIF-8 converted from porous ZnO thin films; Figure S2: Atomic force microscopy images of ZIF-8 obtained after different conversion times from porous ZnO thin films; Figure S3: Investigation of the samples employed for photocatalytic tests with X-ray methods; Figure S4: A model of the photocatalytic reaction mechanism of methylene blue on ZIF-8; Figure S5: UV-vis absorption spectra of methylene blue solution in the presence of ZIF-8 under UV irradiation as in Figure 5a but with extended wavelength range.

Author Contributions

Conceptualization, K.U., R.R. and A.M.C.; investigation, M.K.; formal analysis, M.K.; data curation, M.K. and A.M.C.; writing—original draft preparation, M.K.; writing—review and editing, M.K., K.U., R.R. and A.M.C.; supervision, K.U., R.R. and A.M.C. All authors have read and agreed to the published version of the manuscript.

Funding

This work has received funding from the European Research Council (ERC) under the European Union’s Horizon 2020 research and innovation program (Grant Agreement No. 715403). M.K., R.R., and A.M.C. would like to thank the the Lead project LP-03 “Porous Materials@Work” of the Graz University of Technology for the partial financial support.

Institutional Review Board Statement

Not applicable.

Informed Consent Statement

Not applicable.

Data Availability Statement

The data presented in this study are available on request from the corresponding author.

Acknowledgments

The authors thank the synchrotron ELETTRA, Trieste, Italy for the allocation of beamtime at the beamline XRD1 and especially the on-site beamtime scientist Luisa Barba, as well as the beamtime organizer Martin Kaltenegger. Also, the provision of the atomic layer deposited ZnO by Lisanne Demelius is gratefully acknowledged. Open Access Funding by the Graz University of Technology.

Conflicts of Interest

The authors declare no conflict of interest. The funders had no role in the design of the study; in the collection, analyses, or interpretation of data; in the writing of the manuscript; or in the decision to publish the results.

References

  1. Stassin, T.; Stassen, I.; Wauteraert, N.; Cruz, A.J.; Kräuter, M.; Coclite, A.M.; De Vos, D.; Ameloot, R. Solvent-Free Powder Synthesis and Thin Film Chemical Vapor Deposition of a Zinc Bipyridyl-Triazolate Framework. Eur. J. Inorg. Chem. 2020, 2020, 71–74. [Google Scholar] [CrossRef] [Green Version]
  2. Gadipelli, S.; Travis, W.; Zhou, W.; Guo, Z. A thermally derived and optimized structure from ZIF-8 with giant enhancement in CO2 uptake. Energy Environ. Sci. 2014, 7, 2232–2238. [Google Scholar] [CrossRef]
  3. Stassin, T.; Verbeke, R.; Cruz, A.J.; Rodríguez-Hermida, S.; Stassen, I.; Marreiros, J.; Krishtab, M.; Dickmann, M.; Egger, W.; Vankelecom, I.F.J.; et al. Porosimetry for Thin Films of Metal–Organic Frameworks: A Comparison of Positron Annihilation Lifetime Spectroscopy and Adsorption-Based Methods. Adv. Mater. 2021, 33, 2006993. [Google Scholar] [CrossRef]
  4. Zou, D.; Liu, D.; Zhang, J. From Zeolitic Imidazolate Framework-8 to Metal-Organic Frameworks (MOFs): Representative Substance for the General Study of Pioneering MOF Applications. Energy Environ. Mater. 2018, 1, 209–220. [Google Scholar] [CrossRef] [Green Version]
  5. Kajiwara, T.; Higuchi, M.; Watanabe, D.; Higashimura, H.; Yamada, T.; Kitagawa, H. A systematic study on the stability of porous coordination polymers against ammonia. Chem. Eur. J. 2014, 20, 15611–15617. [Google Scholar] [CrossRef]
  6. Su, Z.; Miao, Y.R.; Mao, S.M.; Zhang, G.H.; Dillon, S.; Miller, J.T.; Suslick, K.S. Compression-induced deformation of individual metal-organic framework microcrystals. J. Am. Chem. Soc. 2015, 137, 1750–1753. [Google Scholar] [CrossRef] [PubMed]
  7. Cravillon, J.; Schröder, C.A.; Bux, H.; Rothkirch, A.; Caro, J.; Wiebcke, M. Formate modulated solvothermal synthesis of ZIF-8 investigated using time-resolved in situ X-ray diffraction and scanning electron microscopy. CrystEngComm 2012, 14, 492–498. [Google Scholar] [CrossRef] [Green Version]
  8. Chen, Y.; Tang, S. Solvothermal synthesis of porous hydrangea-like zeolitic imidazole framework-8 (ZIF-8)crystals. J. Solid State Chem. 2019, 276, 68–74. [Google Scholar] [CrossRef]
  9. Seoane, B.; Zamaro, J.M.; Tellez, C.; Coronas, J. Sonocrystallization of zeolitic imidazolate frameworks (ZIF-7, ZIF-8, ZIF-11 and ZIF-20). CrystEngComm 2012, 14, 3103–3107. [Google Scholar] [CrossRef]
  10. Lee, Y.R.; Jang, M.S.; Cho, H.Y.; Kwon, H.J.; Kim, S.; Ahn, W.S. ZIF-8: A comparison of synthesis methods. Chem. Eng. J. 2015, 271, 276–280. [Google Scholar] [CrossRef]
  11. Tanaka, S.; Nagaoka, T.; Yasuyoshi, A.; Hasegawa, Y.; Denayer, J.F.M. Hierarchical Pore Development of ZIF-8 MOF by Simple Salt-Assisted Mechanosynthesis. Cryst. Growth Des. 2018, 18, 274–279. [Google Scholar] [CrossRef]
  12. Im, J.; Yim, N.; Kim, J.; Vogt, T.; Lee, Y. High-Pressure Chemistry of a Zeolitic Imidazolate Framework Compound in the Presence of Different Fluids. J. Am. Chem. Soc. 2016, 138, 11477–11480. [Google Scholar] [CrossRef] [PubMed]
  13. Shi, Q.; Chen, Z.; Song, Z.; Li, J.; Dong, J. Synthesis of ZIF-8 and ZIF-67 by Steam-Assisted Conversion and an Investigation of Their Tribological Behaviors. Angew. Chem. 2011, 123, 698–701. [Google Scholar] [CrossRef]
  14. Stassen, I.; Styles, M.; Grenci, G.; Van Gorp, H.; Vanderlinden, W.; De Feyter, S.; Falcaro, P.; De Vos, D.; Vereecken, P.; Ameloot, R. Chemical vapour deposition of zeolitic imidazolate framework thin films. Nat. Mater. 2016, 15, 304–310. [Google Scholar] [CrossRef] [PubMed] [Green Version]
  15. Tanaka, S.; Sakamoto, K.; Inada, H.; Kawata, M.; Takasaki, G.; Imawaka, K. Vapor-Phase Synthesis of ZIF-8 MOF Thick Film by Conversion of ZnO Nanorod Array. Langmuir 2018, 34, 7028–7033. [Google Scholar] [CrossRef]
  16. Kräuter, M.; Cruz, A.J.; Stassin, T.; Rodríguez-Hermida, S.; Ameloot, R.; Resel, R.; Coclite, A.M. Influence of Precursor Density and Conversion Time on the Orientation of Vapor-Deposited ZIF-8. Crystals 2022, 12, 217. [Google Scholar] [CrossRef]
  17. Cruz, A.J.; Arnauts, G.; Obst, M.; Kravchenko, D.E.; Vereecken, P.M.; De Feyter, S.; Stassen, I.; Hauffman, T.; Ameloot, R. Effect of different oxide and hybrid precursors on MOF-CVD of ZIF-8 films. Dalt. Trans. 2021, 50, 6784–6788. [Google Scholar] [CrossRef]
  18. Khaletskaya, K.; Turner, S.; Tu, M.; Wannapaiboon, S.; Schneemann, A.; Meyer, R.; Ludwig, A.; Van Tendeloo, G.; Fischer, R.A. Self-directed localization of ZIF-8 thin film formation by conversion of ZnO nanolayers. Adv. Funct. Mater. 2014, 24, 4804–4811. [Google Scholar] [CrossRef]
  19. Hu, Y.; Wu, H.; Yang, Y.; Lin, X.; Cheng, H.; Zhang, R.; Jiang, X.; Wang, J. ZIF-8 derived porous ZnO with grain boundaries for efficient CO2 electroreduction. J. Nanoparticle Res. 2021, 23, 133. [Google Scholar] [CrossRef]
  20. Yang, R.; Yan, X.; Li, Y.; Zhang, X.; Chen, J. Nitrogen-Doped Porous Carbon-ZnO Nanopolyhedra Derived from ZIF-8: New Materials for Photoelectrochemical Biosensors. ACS Appl. Mater. Interfaces 2017, 9, 42482–42491. [Google Scholar] [CrossRef]
  21. Kim, M.K.; Kim, D.; Seo, J.Y.; Buyukcakir, O.; Coskun, A. Nanostructured ZnO as a structural template for the growth of ZIF-8 with tunable hierarchical porosity for CO2 conversion. CrystEngComm 2017, 19, 4147–4151. [Google Scholar] [CrossRef]
  22. Pérez-Pellitero, J.; Amrouche, H.; Siperstein, F.R.; Pirngruber, G.; Nieto-Draghi, C.; Chaplais, G.; Simon-Masseron, A.; Bazer-Bachi, D.; Peralta, D.; Bats, N. Adsorption of CO2, CH4, and N2 on zeolitic imidazolate frameworks: Experiments and simulations. Chem. Eur. J. 2010, 16, 1560–1571. [Google Scholar] [CrossRef] [PubMed]
  23. Matatagui, D.; Sainz-Vidal, A.; Gràcia, I.; Figueras, E.; Cané, C.; Saniger, J.M. Chemoresistive gas sensor based on ZIF-8/ZIF-67 nanocrystals. Sens. Actuators B Chem. 2018, 274, 601–608. [Google Scholar] [CrossRef]
  24. Lai, Z. Development of ZIF-8 membranes: Opportunities and challenges for commercial applications. Curr. Opin. Chem. Eng. 2018, 20, 78–85. [Google Scholar] [CrossRef] [Green Version]
  25. Hoseinpour, V.; Shariatinia, Z. Applications of zeolitic imidazolate framework-8 (ZIF-8) in bone tissue engineering: A review. Tissue Cell 2021, 72, 101588. [Google Scholar] [CrossRef] [PubMed]
  26. Eslava, S.; Zhang, L.; Esconjauregui, S.; Yang, J.; Vanstreels, K.; Baklanov, M.R.; Saiz, E. Metal-organic framework ZIF-8 films as low-κ dielectrics in microelectronics. Chem. Mater. 2013, 25, 27–33. [Google Scholar] [CrossRef]
  27. Xue, W.; Zhou, Q.; Li, F.; Ondon, B.S. Zeolitic imidazolate framework-8 (ZIF-8) as robust catalyst for oxygen reduction reaction in microbial fuel cells. J. Power Sources 2019, 423, 9–17. [Google Scholar] [CrossRef]
  28. Abdelhamid, H.N. Zeolitic imidazolate frameworks (ZIF-8, ZIF-67, and ZIF-L) for hydrogen production. Appl. Organomet. Chem. 2021, 35, 25–29. [Google Scholar] [CrossRef]
  29. Jing, H.P.; Wang, C.C.; Zhang, Y.W.; Wang, P.; Li, R. Photocatalytic degradation of methylene blue in ZIF-8. RSC Adv. 2014, 4, 54454–54462. [Google Scholar] [CrossRef]
  30. Wang, T.; Wang, Y.; Sun, M.; Hanif, A.; Wu, H.; Gu, Q.; Ok, Y.S.; Tsang, D.C.W.; Li, J.; Yu, J.; et al. Thermally treated zeolitic imidazolate framework-8 (ZIF-8) for visible light photocatalytic degradation of gaseous formaldehyde. Chem. Sci. 2020, 11, 6670–6681. [Google Scholar] [CrossRef]
  31. Si, Y.H.; Li, Y.Y.; Xia, Y.; Shang, S.K.; Xiong, X.B.; Zeng, X.R.; Zhou, J. Fabrication of novel ZIF-8@BiVO4 composite with enhanced photocatalytic performance. Crystals 2018, 8, 432. [Google Scholar] [CrossRef] [Green Version]
  32. Abdelhameed, R.M.; Abu-Elghait, M.; El-Shahat, M. Hybrid three MOFs composites (ZIF-67@ZIF-8@MIL-125-NH2): Enhancement the biological and visible-light photocatalytic activity. J. Environ. Chem. Eng. 2020, 8, 104107. [Google Scholar] [CrossRef]
  33. Liu, Y.; Deng, L.; Sheng, J.; Tang, F.; Zeng, K.; Wang, L.; Liang, K.; Hu, H.; Liu, Y.N. Photostable core-shell CdS/ZIF-8 composite for enhanced photocatalytic reduction of CO2. Appl. Surf. Sci. 2019, 498, 143899. [Google Scholar] [CrossRef]
  34. Li, R.; Li, W.; Jin, C.; He, Q.; Wang, Y. Fabrication of ZIF-8@TiO2 micron composite via hydrothermal method with enhanced absorption and photocatalytic activities in tetracycline degradation. J. Alloy. Compd. 2020, 825, 154008. [Google Scholar] [CrossRef]
  35. Kräuter, M.; Abu Ali, T.; Stadlober, B.; Resel, R.; Unger, K.; Coclite, A.M. Tuning the Porosity of Piezoelectric Zinc Oxide Thin Films Obtained from Molecular Layer Deposited “Zincones”. Materials 2022, 15, 6786. [Google Scholar] [CrossRef] [PubMed]
  36. Abu Ali, T.; Schäffner, P.; Belegratis, M.; Schider, G.; Stadlober, B.; Coclite, A.M. Smart Core-Shell Nanostructures for Force, Humidity, and Temperature Multi-Stimuli Responsiveness. Adv. Mater. Technol. 2022, 7, 2200246. [Google Scholar] [CrossRef]
  37. Schrode, B.; Pachmajer, S.; Dohr, M.; Röthel, C.; Domke, J.; Fritz, T.; Resel, R.; Werzer, O. GIDVis: A comprehensive software tool for geometry-independent grazing-incidence X-ray diffraction data analysis and pole-figure calculations. J. Appl. Crystallogr. 2019, 52, 683–689. [Google Scholar] [CrossRef] [Green Version]
  38. Necas, D.; Klapetek, P. Gwyddion. Available online: http://gwyddion.net/ (accessed on 20 August 2021).
  39. Haynes, W.M. CRC Handbook of Chemistry and Physics, 92nd ed.; CRC Press: Boca Raton, FL, USA, 2011. [Google Scholar]
  40. Hu, Y.; Kazemian, H.; Rohani, S.; Huang, Y.; Song, Y. In situ high pressure study of ZIF-8 by FTIR spectroscopy. Chem. Commun. 2011, 47, 12694–12696. [Google Scholar] [CrossRef]
  41. Sharma, S.K.; Utpalla, P.; Bahadur, J.; Goutam, U.K.; Pujari, P.K. Micrometer scale pore-interconnectivity in nanoporous ZIF-8 films with Zn enriched surface terminations. Microporous Mesoporous Mater. 2020, 307, 110519. [Google Scholar] [CrossRef]
  42. Kaur, H.; Mohanta, G.C.; Gupta, V.; Kukkar, D.; Tyagi, S. Synthesis and characterization of ZIF-8 nanoparticles for controlled release of 6-mercaptopurine drug. J. Drug Deliv. Sci. Technol. 2017, 41, 106–112. [Google Scholar] [CrossRef]
  43. Karagiaridi, O.; Lalonde, M.B.; Bury, W.; Sarjeant, A.A.; Farha, O.K.; Hupp, J.T. Opening ZIF-8: A catalytically active zeolitic imidazolate framework of sodalite topology with unsubstituted linkers. J. Am. Chem. Soc. 2012, 134, 18790–18796. [Google Scholar] [CrossRef]
  44. Cruz, A.J.; Stassen, I.; Krishtab, M.; Marcoen, K.; Stassin, T.; Rodríguez-hermida, S.; Teyssandier, J.; Pletincx, S.; Verbeke, R.; Rubio-Giménez, V.; et al. An integrated cleanroom process for the vapor phase deposition of large-area zeolitic imidazolate framework thin films. Chem. Mater. 2019, 31, 9462–9471. [Google Scholar] [CrossRef]
  45. Abrahams, S.C.; Bernstein, J.L. Remeasurement of the structure of hexagonal ZnO. Acta Crystallogr. Sect. B Struct. Crystallogr. Cryst. Chem. 1969, 25, 1233–1236. [Google Scholar] [CrossRef]
  46. Perrotta, A.; Pilz, J.; Pachmajer, S.; Milella, A.; Coclite, A.M. On the transformation of “zincone”-like into porous ZnO thin films from sub-saturated plasma enhanced atomic layer deposition. Beilstein J. Nanotechnol. 2019, 10, 746–759. [Google Scholar] [CrossRef] [PubMed] [Green Version]
  47. Huang, H.; Leung, D.Y.C.; Kwong, P.C.W.; Xiong, J.; Zhang, L. Enhanced photocatalytic degradation of methylene blue under vacuum ultraviolet irradiation. Catal. Today 2013, 201, 189–194. [Google Scholar] [CrossRef]
  48. Jongnavakit, P.; Amornpitoksuk, P.; Suwanboon, S.; Ndiege, N. Preparation and photocatalytic activity of Cu-doped ZnO thin films prepared by the sol-gel method. Appl. Surf. Sci. 2012, 258, 8192–8198. [Google Scholar] [CrossRef]
  49. Pasichnyk, M.; Gaálová, J.; Minarik, P.; Václavíková, M.; Melnyk, I. Development of polyester filters with polymer nanocomposite active layer for effective dye filtration. Sci. Rep. 2022, 12, 973. [Google Scholar] [CrossRef]
  50. Basolite® Z1200-ZIF-8. Available online: https://www.sigmaaldrich.com/AT/de/product/aldrich/691348 (accessed on 25 May 2022).
  51. Han, J.; Qiu, W.; Gao, W. Potential dissolution and photo-dissolution of ZnO thin films. J. Hazard. Mater. 2010, 178, 115–122. [Google Scholar] [CrossRef]
Figure 1. Schematic of the 3-step sample preparation process.
Coatings 13 00718 g001
Figure 2. X-ray reflectivity measurements of ZnO thin films with (a) 14.5%, (b) 16%, and (c) 24% of open porosity. Red lines correspond to the employed fits.
Coatings 13 00718 g002
Figure 4. (a) Thickness as measured via spectroscopic ellipsometry, (b) thickness increase, (c) root mean square roughness, and (d) average particle height of ZIF-8 obtained after different conversion times from ZnO with open porosity values of 14.5%–24%. A literature value of ZIF-8 from non-porous ZnO is shown for comparison [16].
Coatings 13 00718 g004
Figure 5. (a) UV-vis absorption spectra, (b) concentration change, and (c) pseudo-first-order kinetics curve of a 10−5 mol/L methylene blue (MB) solution in the presence of ZIF-8 under UV irradiation or while kept in a dark environment over time. (d) Concentration change of the MB solution when subjected to UV light, either on its own or in the presence of ZIF-8 or ZnO. “MLD ZIF-8” refers to ZIF-8 converted from ZnO thin films with 16% open porosity. “PE-ALD ZIF-8” refers to ZIF-8 converted from non-porous ZnO thin films, which were deposited via plasma-enhanced atomic layer deposition.
Coatings 13 00718 g005
Figure 6. X-ray diffraction pattern of (a) porous ZnO obtained from a molecular layer deposited zincone and (b) of ZIF-8 converted from porous ZnO before and after photocatalytic tests. Thickness of (c) porous ZnO, (d) non-porous ZnO deposited via plasma-enhanced atomic layer deposition (PE-ALD), and (e) ZIF-8 obtained from PE-ALD ZnO after submersion in water (H2O) or in a 10−5 mol/L methylene blue (MB) solution, either under ambient conditions or under UV radiation.
Coatings 13 00718 g006
Disclaimer/Publisher’s Note: The statements, opinions and data contained in all publications are solely those of the individual author(s) and contributor(s) and not of MDPI and/or the editor(s). MDPI and/or the editor(s) disclaim responsibility for any injury to people or property resulting from any ideas, methods, instructions or products referred to in the content.

