Abstract
In this paper, we demonstrate the potential of the contactless surface photovoltage (SPV) method for fast and reliable control of GaAs-based solar cells directly on epitaxial heterostructures before metallization and photolithography processes. The magnitude of the SPV corresponds to the generated photovoltage in the photoactive region, which is related to the open circuit voltage of the cell. The focus of this investigation is the potential of dilute nitride compounds grown by low-temperature liquid-phase epitaxy (LPE) for application as intermediate cells in multijunction solar cells. First, SPV spectroscopy is used to determine the photosensitivity spectral range and bandgap of the grown dilute nitride compound layers. Further, the photovoltaic quality of the grown solar cell heterostructures is evaluated by comparing the magnitude of their SPV signals with that of a reference GaAs solar cell. A drastic reduction in the measured SPV is observed for nitrogen-containing solar cell structures, which correlates with the lowering of solar cell open-circuit voltage values measured under standard test conditions. Finally, solar cell structures based on nitrogen-free GaAsSb compounds with the same long-wavelength photosensitivity limit as GaAsSbN are grown by LPE. They show one order of magnitude higher SPV signal and, therefore, have a great potential for solar cell application.
1. Introduction
The development of novel advanced materials and structures is the key approach to creating new devices to meet the growing needs of the modern economy. Among them, high-efficiency solar cells play an important role in zero-carbon energy production. Different innovative concepts are used to increase the conversion efficiency of cells. Perovskite, Cd(Se, Te) thin-film, dye-sensitized, polymer, and organic solar cells have been intensively developed in recent years [1,2,3,4,5]. However, up to now, multijunction solar cells based on III-V heterostructures exhibit the highest efficiencies with a record value of 47.1% reported by NREL, USA, for 6-junction cells [6]. In multijunction solar cells, better spectrum utilization is obtained by stacking several solar cells, and they have the potential to further increase the conversion efficiency if suitable novel materials with unique properties for intermediate cells are found and grown in an appropriate quality.
Dilute III–V nitrides are a relatively new class of compound semiconductors whose fundamental properties are dramatically modified by replacing a relatively small fraction of host atoms with nitrogen. They provide a powerful tool for engineering the bandgap and lattice constant of III-V alloys and become a key candidate for application in multijunction solar cells [7,8,9,10,11,12,13]. However, epitaxial growth of dilute nitride compounds remains a great challenge because the incorporation efficiency of N into the growing crystal is low, and there is a high local strain near N atoms. In addition, nitrides and arsenides have large differences in lattice constants and electronegativity. These problems are responsible for the creation of N-related non-radiative centres and localized states in the bandgap, which in general result in poor optical quality of as-grown compounds [14]. Device performance has not reached expectations due to the low radiative efficiencies and short minority carrier diffusion lengths [15,16,17]. Therefore, it is important to improve the properties of dilute nitride compounds, which requires further investigations of their properties to provide feedback to the fabrication techniques.
In this study, the low-temperature liquid-phase epitaxy (LPE) method was used for dilute nitride growth since it provides structure planarity and makes it possible to obtain multilayer heterostructures for device applications. Additionally, crystallization at temperatures lower than 600 °C provides precise layer composition and thickness control, and overcomes the problems of microphase separation due to nitrogen incorporation during growth at higher temperatures [18]. However, theoretical calculations predict a large miscibility gap at these temperatures for Ga-rich compounds in the In-Ga-As-Sb system [19,20]. At the same time, there are no theoretical and experimental data for the case of adding nitrogen to this system in the LPE growth. To establish actual growth conditions of uniform and nearly-lattice-matched layers, many experiments were performed [21,22,23] from different initial epitaxy temperatures in the temperature range of 600–540 °C. Therefore, in the development of new solar cell materials, it is important to perform rapid reliable photovoltaic (PV) quality control of the epitaxial heterostructures.
Surface photovoltage (SPV) spectroscopy is a powerful, highly sensitive, non-destructive and contactless characterization technique that has been successfully used to study the electronic properties of many semiconductor bulk materials and multilayers [24,25,26,27,28,29]. As the SPV arises from the spatial separation of the photogenerated electrons and holes, the analysis of the results provides information on both light absorption properties and transport properties of charge carriers in the semiconductor sample [24,26]. In the metal–insulator–semiconductor (MIS) operation mode the SPV amplitude provides information on the optical absorption spectrum [24]. In particular, SPV spectroscopy has been used to assess the bandgap of various semiconductor materials including multilayered structures [30,31,32,33,34]. It has been shown that the SPV phase values are in the IVth (IInd) quadrant when photogenerated electrons (holes) move to the bulk and/or photogenerated holes (electrons) move to the surface [26,35]. Applying the combined analysis of the SPV amplitude and phase spectral behaviours reinforced by the vector model for the SPV signal [26,35], it is possible to obtain information about the energy band bending in the heterostructures and therefore about the direction of the photocarrier transport. SPV spectroscopy has rarely been used in the investigations of dilute nitride materials. For example, it has been applied to investigate the optical absorption [36] and the band offset [37] in InGaAsN/GaAs quantum wells and the E− and E+ transitions in GaAsN layers [38]. However, SPV investigations of quaternary GaAsSbN dilute nitride materials have not been reported.
In this work, we utilize the SPV-MIS method for the characterization of GaAs-based dilute nitride materials grown by LPE. First, we determine the increase in the long wavelength limit of the dilute nitride as compared to that of GaAs. Second, the method is used for photovoltaic quality control directly on the epitaxial solar cell heterostructures prior to the photolithography and metallization processes, by comparing the magnitude of the SPV signal from the dilute nitride cell structure with those of reference GaAs solar cells.
2. Materials and Methods
2.1. Samples
The experimental samples used in this work were grown on (100) n-type GaAs: Si (~1018 cm−3) substrates in a high-purity hydrogen flow employing a horizontal home made LPE reactor. Metals Ga, In, and/or Sb with low melting point and 6N purity were chosen as epitaxial growth solvents. Polycrystalline or small pieces of monocrystalline GaAs were used as sources of As, while GaN powder of 5N purity was used as a source of nitrogen. The following epitaxial layers and solar cell structures were grown.
2.1.1. Dilute Nitride Layers
GaAsN
Epitaxial GaAsN layers 0.5–1 μm thick were prepared from Ga-rich solution from different initial epitaxy temperatures varied in the range 600–550 °C at a cooling rate of 1 °C/min. The nitrogen content of 0.10–0.15% in the layers was determined from high-resolution X-ray diffraction (004) (Empyrean PANalytical B.V., Almelo, Holland) curves using Vegard’s rule. This low nitrogen incorporation efficiency in the layers at equilibrium conditions was due to the small solubility of nitrogen in the Ga-melt and the low nitrogen diffusion coefficient into the As-sub-lattice of the GaAsN compound.
InGaAsN
Epitaxial InGaAsN layers were deposited on the GaAs substrate from In-rich melt (90% In + 10% Ga) at temperatures lower than 580 °C [21]. The thickness of the layers was in the range of 1–3 µm depending on the initial epitaxy temperature and growth time. The In content in the InxGa1−xAs1−yNy layers, measured by energy dispersive X-ray (EDX) (Quantax 200, Bruker, Billerica, MA, USA) microanalysis was between 3.0 and 3.5%. The N content estimated from high-resolution X-ray diffraction (HRXRD) (Empyrean PANalytical B.V., Almelo, Holland) curves using Vegard’s law was about 0.3% for the most grown samples [22]. The lattice mismatch between epitaxial layer and substrate Δa/a0, determined from XRD spectra, was 0.16%, indicating good lattice matching [21,22].
GaAsSbN
Quaternary GaAsSbN layers were grown from 95 at. % Ga + 5 at. % Sb solution from initial temperatures in the range 575–555 °C. The epitaxial layers were grown from a 7 °C super-cooled solution at a cooling rate of 0.8 °C/min for about 20–30 min. The Sb content in the GaAsSbN of 6.8% was determined by EDX (Quantax 200, Bruker, Billerica, MA, USA) and confirmed by X-ray photoelectron spectroscopy (XPS) (AXIS Supra electron spectrometer, Kratos Analytical Ltd, a Shimadzu Group Company, Tokyo, Japan). The N-content in the layers determined by HRXRD was 0.1% [39].
2.1.2. Solar Cells Structures
Reference GaAs Solar Cell Structure
Double heterostructure (DH) p-AlGaAs/(p-n) GaAs/n-AlGaAs were grown by low-temperature LPE and used as a reference structure to evaluate the PV quality of the dilute nitride-based structures. A schematic cross-section of the structure is shown in Figure 1. The p-n junction in GaAs was sandwiched between two wide bandgap AlGaAs layers. The n-type AlGaAs buffer layer served as an effective potential barrier for the generated minority carriers in the photoactive region and improved the collection efficiency in the photoactive region, while an ultra-thin (window) wide bandgap p-AlGaAs layer was transparent for short-wavelength light and decreased the surface recombination on the front side of the solar cell. The structure was grown in a multiple-bin graphite boat from a very thin (500 µm) Ga melt. The initial epitaxy temperature was 650 °C and the p-n junction was formed at 550 °C. The wide bandgap p-AlGaAs window layer was deposited at 510 °C.
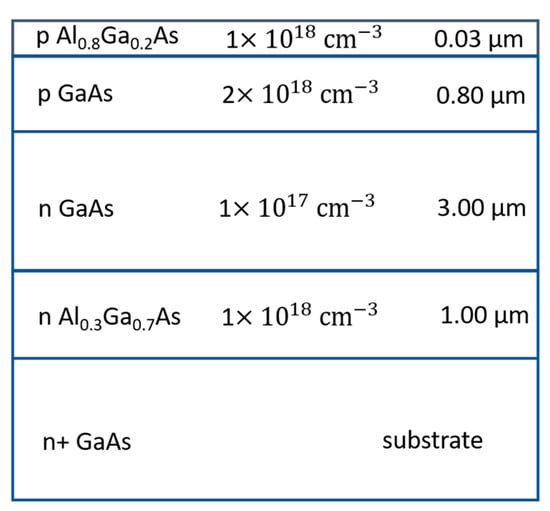
Figure 1.
Schematic of the cross-section of a GaAs solar cell p-n structure.
Solar cells (2.5 × 2.5 mm2 in size) with a circle illumination area of 3.14 mm2 based on the investigated structure were prepared at the Central Laboratory of Solar Energy and New Energy Sources (CLSENES) in Sofia, Bulgaria. Their photovoltaic parameters were measured using an automatic measuring system under standard test conditions AM1.5 [40]. The external quantum efficiency (EQE) in absolute units was evaluated by comparing the photocurrent magnitude of a calibrated reference cell (NASA Lewis Research Center) and the LPE-grown GaAs structure at monochromatic illumination [41].
To study the influence of nitrogen even at very-low (background doping) concentrations the same type of structure was prepared in the LPE reactor for dilute nitride compound growth.
GaAsSb(N) p-i-n Solar Cell Structures
A series of p-i-n structures p-AlGaAs—p-GaAs—i-GaAsSb(N)—n-GaAs were grown based on GaAsSb(N) layers compensated by Mg doping. The initial epitaxy temperature was 640 °C and GaAsSb(N) was grown in the temperature range of 558–550 °C. The GaAs capping and AlGaAs window layers were grown in the temperature range of 550–547 °C and 547–546 °C, respectively. Figure 2 shows the cross-section of such a p-i-n structure.
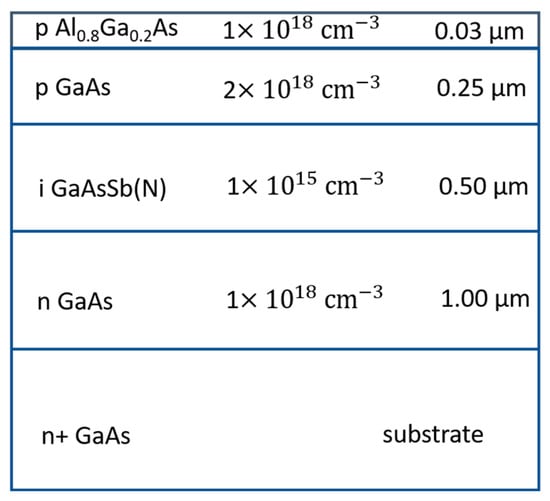
Figure 2.
Schematic of the cross-section of a GaAsSb(N) solar cell p-i-n structure.
Solar cell samples were processed into 3.5 × 3.5 mm2 photovoltaic mesa diodes comprising a 3 mm diameter optical window by applying standard mask lithography at Stephenson Institute for Renewable Energy, University of Liverpool, UK. J-V and EQE measurements were performed as described in [42].
2.2. Experimental Setup and Procedure
SPV spectral measurements were performed at room temperature in the MIS operation mode with chopped light. The sample was placed on a grounded copper platform. A mica sheet of 15 μm was used as an insulator between the sample and the transparent probe electrode. The illumination used a 100 W halogen tungsten lamp, a 0.22 m SPEX grating monochromator (600 g/mm), a filter to cut off the high-order diffraction, and an optical chopper (PTI OC4000, Horiba, Kyoto, Japan). During the scanning from 1150 to 800 nm, the photon flux density Φ was kept constant (of the order of 5 × 1013 cm−2s−1) at each wavelength with an accuracy of about 1% using the feedback provided by a spectrally flat Golay detector [26]. A few spectra were recorded in the range from 900 to 500 nm using a 1200 g/mm grating and photon flux density of about 1.7 × 1012 cm−2s−1. An SR830 Lock-in amplifier (Stanford Research System, Sunnyvale, CA, USA) was used to measure the amplitude and phase of the SPV signal. Undesired phase shifts, which may result from the electrical circuit and the optical chopper, were eliminated by applying the procedures described in [26,35]. This way, the SPV phase was correctly defined and measured relative to the excitation sequence.
3. Results and Discussion
SPV spectroscopy is often used to study the optical absorption spectrum and, in particular, to assess the bandgap of the investigated material [24]. Figure 3 shows the measured SPV amplitude spectrum of GaAs solar cell structure grown by LPE along with the spectrum of the external quantum efficiency of a GaAs solar cell without antireflection coating [41]. It is seen that they have nearly the same shape. The long wavelength limit is defined by the GaAs bandgap and the quality of the depletion region, while the short wavelength limit depends on the surface recombination and bandgap of the window layer. The magnitude of the SPV amplitude is related to the generated photovoltage in the photoactive region of the cell and correlates with the open-circuit voltage. A conversion efficiency of 19.5% and an open circuit voltage Voc = 0.92 V were measured for the fabricated cells [40].
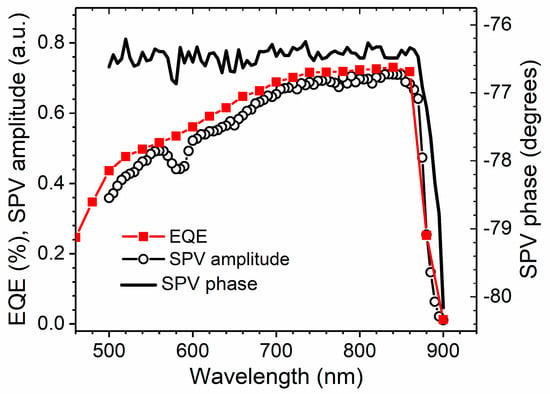
Figure 3.
External quantum efficiency (squares) and SPV amplitude (circles) spectra of a GaAs solar cell p-n structure. The SPV phase spectrum of the same structure is shown by a line. The dip in the SPV amplitude spectrum is an artefact due to the experimental setup.
Figure 3 also shows that the values of the SPV phase are in the IVth quadrant. This confirms that the signal was generated in the p-n structure where the energy band bending is upwards in the direction towards the surface [26,35]. The depletion region propagates mostly in the lower-doped side of the p-n junction.
Figure 4 presents the SPV spectra of GaAs and GaAs:N solar cell structures. A dramatic reduction in the SPV amplitude is observed for the cell, doped with nitrogen. This is due to the nitrogen-related defects in the layers that arise during epitaxial growth. The incorporation of N into the crystal lattice even at the doping level induces highly localized states that degrade the optoelectronic properties of the compound [43,44,45]. N atoms are mainly included in the As-sublattice, replacing As atoms; however, some other N configurations are known to exist such as N-As split interstitial; N-N split interstitial; and N-Si complexes [46,47]. These defects are found to act as efficient non-radiative recombination centres as they introduce bandgap levels. This affects carrier collection and recombination in the transport process and thus decreases solar cell performance. The open circuit voltage of these GaAs:N solar cells drops down to 0.4–0.45 V. The inset of Figure 4 shows the normalized spectra and allows for a comparison of the absorption edges in both cases. The absorption edge of GaAs:N occurs at a slightly lower energy, which is due to the bandgap reduction caused by nitrogen.
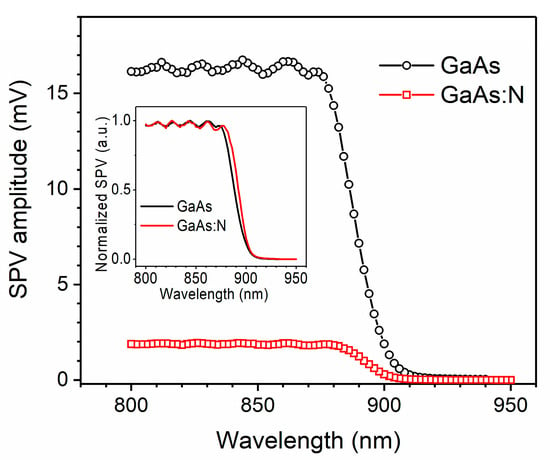
Figure 4.
SPV amplitude spectra of a GaAs (circles) and a GaAs:N (squares) solar cell p-n structures. The inset shows the same spectra normalized to unity.
Since the use of dilute nitride layers aims to extend the long wavelength limit of the solar cells, we performed SPV spectral measurements to assess the bandgap value of different dilute nitride materials and qualitatively evaluate their photovoltaic properties by comparison with the bandgap of pure GaAs. We are interested in the bandgap red shifts relative to GaAs.
Figure 5 presents normalized SPV amplitude spectra measured in layers of GaAsN, InGaAsN, and GaAsSbN. The spectra reveal steep signal steps associated with the optical absorption edges of the corresponding materials. For all dilute nitride layers, the absorption edge is red-shifted relative to GaAs. The bandgap values assessed from the Tauc plots are 1.39 eV (892 nm) for GaAsN, 1.33 eV (932 nm) for InGaAsN, and 1.19 eV (1042 nm) for GaAsSbN. To check whether the incorporation of nitrogen into the crystal lattice affects the bandgap values of dilute nitrides assessed by SPV, we measured the transmission spectra of a few GaAsN layers as reported in [48]. The absorption edges assessed from the transmission spectra are in line with the absorption edges found from the SPV spectra of the same samples using the Tauc plots. In all the cases represented in Figure 5, the presence of nitrogen decreases the bandgap relative to GaAs. However, in GaAsSbN the red shift is larger by 140 meV as compared to InGaAsN. This is due to the replacement of In with Sb. The incorporation of Sb into the As-sublattice pushes up the edge of the valence band [10,49,50], which further decreases the bandgap. For the GaAsSbN sample from Figure 5, the bandgap red shift relative to GaAs is 233 meV, which is the largest value obtained in our experiments. Therefore, we have used GaAsSbN material to develop solar cells for multi-junction solar cell applications.
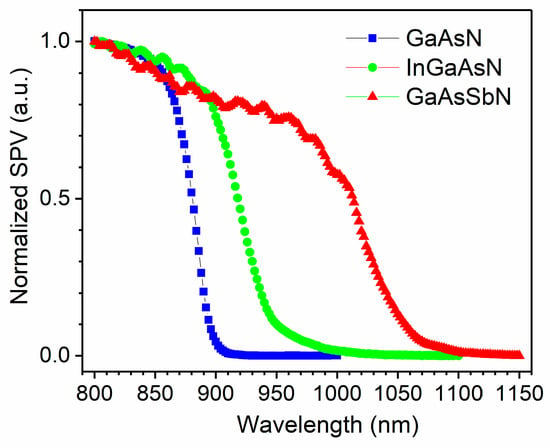
Figure 5.
SPV amplitude spectra of GaAsN, InGaAsN, and GaAsSbN layers.
Figure 6 shows the SPV amplitude spectrum of a p-i-n single-junction solar cell structure based on compensated GaAsSbN along with the EQE of the solar cell device. Both spectra reveal similar behaviour, namely two steps with comparable magnitudes—one in the range of 900–1000 nm, which is due to the absorption in the GaAsSbN layer, and another one for higher energies originating from the p-GaAs layer. The GaAsSbN layer was fully depleted considering its thickness and Hall carrier concentration (~1 × 1015 cm−3). Figure 6 also shows that the values of the SPV phase are close to zero in the IVth quadrant. This confirms that the built-in electric field in the p-i-n structure is directed toward the surface [26,35]. Therefore, the electrons photogenerated in the GaAsSbN layer are driven toward the substrate, while the holes are driven toward the surface, and in this way photovoltage is generated.
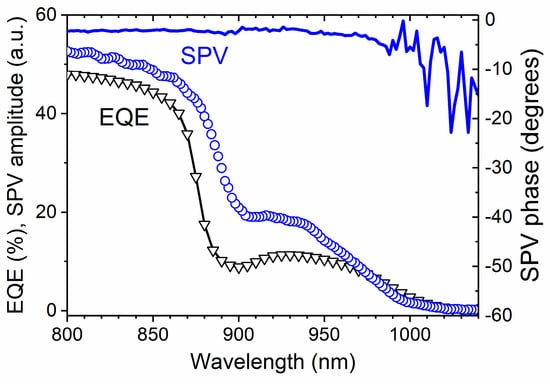
Figure 6.
SPV amplitude spectrum of a GaAsSbN solar cell p-i-n structure (circles) compared to the external quantum efficiency spectrum (triangles) of the solar cell device. The SPV phase of the p-i-n structure is presented with a line.
The external quantum efficiency is an important figure of merit of material quality for solar cell applications. Low minority carrier lifetimes and mobilities both appear to limit the carrier diffusion length, resulting in relatively low EQE observed in the range of 900–1000 nm in Figure 6.
The solar cells based on compensated GaAsSbN showed an efficiency of 4.15% and an open-circuit voltage Voc = 0.44 V [42]. The limiting factors of Voc are dominated by trap-assisted recombination in the depletion region (GaAsSbN) via N-induced traps. This trap-assisted recombination results also in a saturated dark current density of the order of 10−5 mA/cm2, which is about three orders of magnitude higher than the values typical for high-quality solar cells. The increase in dark current correlates with the decreased Voc values.
Figure 7 presents the SPV amplitude spectra of two solar cell structures—one is based on GaAsSbN and the other—on nitrogen-doped GaAs (GaAs:N). In the spectral range where GaAs absorbs, the SPV signal from the GaAsSbN structure is about two times weaker than that of the GaAs:N structure. This is due to the additional localized states induced by the incorporation of Sb into the crystal lattice, which increases carrier recombination velocity. On the other hand, the incorporation of antimony in the crystal lattice has extended the IR photosensitivity limit of the GaAsSbN structure, which results in the above-discussed step in the range of 900–1000 nm of the SPV spectrum.
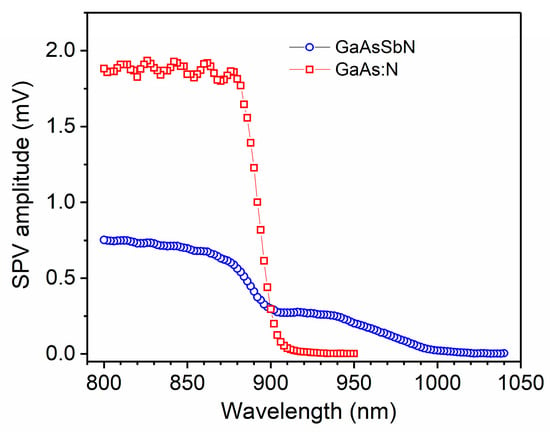
Figure 7.
SPV amplitude spectra of a GaAsSbN solar cell p-i-n structure (circles) and a GaAs:N p-n structure (squares).
To evaluate the influence of N and Sb on the PV quality of the solar cell structure we have grown and studied nitrogen-free GaAsSb layers with the same absorption edge as GaAsSbN. The growth technology and material properties are given in our previous paper [51]. Figure 8 presents the SPV amplitude spectra of GaAsSbN and GaAsSb p-i-n solar cell structures grown on GaAs substrates at nearly the same temperature regime. It is seen that they exhibit similar infrared (IR) photosensitivity limits; however, the SPV amplitude of the GaAsSb structure is higher than that of the GaAsSbN structure by a factor of 6 to 10 depending on the wavelength. The lower SPV signal coming from the GaAs layers in the GaAsSbN cell structure could be explained by the diffusion of N atoms into all layers during the LPE growth. The concentration of N-related recombination centres appears to degrade the PV quality of the junctions more than the effect of defects arising in GaAsSb from its interface with the GaAs substrate, which is of inferior structural quality than the GaAsSbN/GaAs interface.
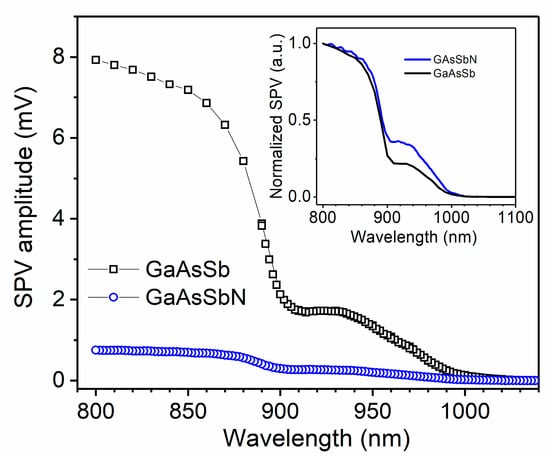
Figure 8.
SPV amplitude spectra of a GaAsSbN (circles) and a GaAsSb (squares) solar cell p-i-n structures. The inset shows the normalized spectra.
The inset in Figure 8 shows the normalized SPV spectra of GaAsSbN and GaAsSb solar cell structures. GaAsSbN exhibits enhanced relative photosensitivity in the IR region (900–980 nm). This is due to the N-related localized states near the conduction band minimum. Optical transitions from the valence band to these states followed by the thermal release of the electrons in the conduction band account for the enhanced SPV signal in this spectral range.
We have shown that the use of III–N–V semiconductors for high-efficiency solar cell applications is promising. These materials have required optical properties and crystal structure, which is nearly lattice matched to GaAs substrates. However, the solar cells’ performance is limited by minority-carrier transport properties.
Finally, we compare in Figure 9 the SPV spectra of nitrogen-free GaAs and GaAsSb solar cell structures. In the spectral range where GaAs absorbs (below 900 nm) the SPV signal from the GaAsSb structure is only two times lower than that of the GaAs structure. At the same time, its IR photosensitivity limit is extended up to 1000 nm. These results are very promising concerning the PV quality of the metamorphic GaAsSb structure.
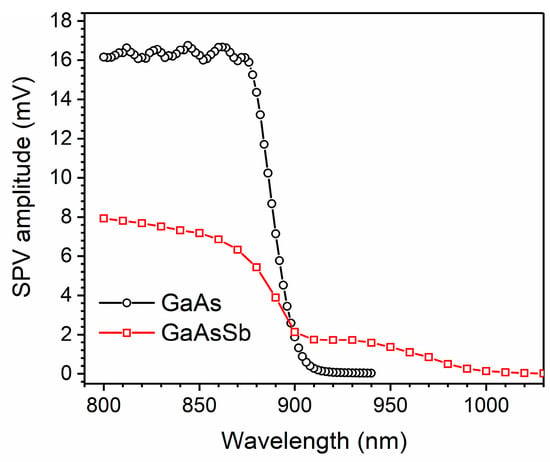
Figure 9.
SPV amplitude spectra of a GaAsSb p-i-n structure (squares) and a GaAs solar cell p-n structure (circles).
Therefore, GaAsSb material has important advantages for use in band engineering in multijunction solar cells. Nevertheless, localized states related to the Sb component exist in the material and lead to degradation of the PV properties. The degree of carrier localization in such states showed a linear relationship with increasing Sb content [52,53].
Further optimization of the growth process and structure design is needed to reduce carrier trapping and improve the photovoltaic quality of solar cell structures based on GaAsSb material.
4. Conclusions
SPV method was used for an express qualitative control in developing dilute nitride solar cells. The main advantage of this method is that measurements are performed directly on the epitaxial structure before time-consuming and expensive photolithography and metallization processes. Different GaAs-based dilute nitride compounds: GaAsN, InGaAsN, and GaAsSbN, were grown by low-temperature LPE. Their photosensitivity spectral range and bandgap values were determined by SPV spectroscopy. The SPV signal from dilute nitride solar cell structures was found to be more than one order of magnitude lower than that from a GaAs solar cell, which is due to the N-related point defects and clusters. This corresponds to the lowering of the open circuit voltage values from 0.9 to 0.92 V for GaAs solar cell structures to 0.4–0.44 V for nitrogen-containing structures. To avoid nitrogen-related localized states metamorphic GaAsSb solar cell structures with an IR photosensitivity limit of 1000 nm were developed. The SPV signal from these cell structures is only two times lower than that of the GaAs cell. Therefore, GaAsSb material has great potential for application in multijunction solar cell performance.
This study shows that the SPV method is suitable to be used as a quick and easy-to-perform characterization technique in the development of new solar cells as well as for in-line production process control to reduce production costs.
Author Contributions
Conceptualization, M.M.; methodology, M.M. and V.D.; validation, V.D. and M.M.; formal analysis, V.D.; investigation, V.D.; resources, M.M.; data curation, V.D.; writing—original draft preparation, M.M.; writing—review and editing, V.D.; visualization, V.D.; supervision, V.D.; project administration, V.D.; funding acquisition, V.D. All authors have read and agreed to the published version of the manuscript.
Funding
This study was funded by the European Regional Development Fund, grant number BG05M2OP001-1.001-0008 and the European Union-NextGenerationEU, project № BG-RRP-2.004-0008-C01.
Institutional Review Board Statement
Not applicable.
Informed Consent Statement
Not applicable.
Data Availability Statement
Data are contained within the article.
Acknowledgments
We thank P. Vitanov for measurements under standard AM1.5 test conditions of GaAs solar cells and A. Mumtaz for test measurements of GaAsSbN solar cells.
Conflicts of Interest
The authors declare no conflict of interest.
References
- Song, Z.; Watthage, S.C.; Phillips, A.B.; Heben, M.J. Pathways toward High-Performance Perovskite Solar Cells: Review of Recent Advances in Organo-Metal Halide Perovskites for Photovoltaic Applications. J. Photonics Energy 2016, 6, 022001. [Google Scholar] [CrossRef]
- Li, D.B.; Bista, S.S.; Awni, R.A.; Neupane, S.; Abudulimu, A.; Wang, X.; Subedi, K.K.; Jamarkattel, M.K.; Phillips, A.B.; Heben, M.J.; et al. 20%-Efficient Polycrystalline Cd(Se,Te) Thin-Film Solar Cells with Compositional Gradient near the Front Junction. Nat. Commun. 2022, 13, 7849. [Google Scholar] [CrossRef] [PubMed]
- Sharma, K.; Sharma, V.; Sharma, S.S. Dye-Sensitized Solar Cells: Fundamentals and Current Status. Nanoscale Res. Lett. 2018, 13, 381. [Google Scholar] [CrossRef] [PubMed]
- Fu, H.; Li, Y.; Yu, J.; Wu, Z.; Fan, Q.; Lin, F.; Woo, H.Y.; Gao, F.; Zhu, Z.; Jen, A.K.Y. High Efficiency (15.8%) All-Polymer Solar Cells Enabled by a Regioregular Narrow Bandgap Polymer Acceptor. J. Am. Chem. Soc. 2021, 143, 2665–2670. [Google Scholar] [CrossRef]
- Cui, Y.; Yao, H.; Hong, L.; Zhang, T.; Tang, Y.; Lin, B.; Xian, K.; Gao, B.; An, C.; Bi, P.; et al. Organic Photovoltaic Cell with 17% Efficiency and Superior Processability. Natl. Sci. Rev. 2020, 7, 1239–1246. [Google Scholar] [CrossRef]
- Geisz, J.F.; France, R.M.; Schulte, K.L.; Steiner, M.A.; Norman, A.G.; Guthrey, H.L.; Young, M.R.; Song, T.; Moriarty, T. Six-Junction III–V Solar Cells with 47.1% Conversion Efficiency under 143 Suns Concentration. Nat. Energy 2020, 5, 326–335. [Google Scholar] [CrossRef]
- Wiemer, M.; Sabnis, V.; Yuen, H. 43.5% Efficient Lattice Matched Solar Cells. In Proceedings of the SPIE 8108, High and Low Concentrator Systems for Solar Electric Applications VI, (19 September 2011); VanSant, K., Sherif, R.A., Eds.; SPIE: Bellingham, WA, USA, 2011; p. 810804. [Google Scholar]
- Aho, A.; Isoaho, R.; Raappana, M.; Aho, T.; Anttola, E.; Lyytikäinen, J.; Hietalahti, A.; Polojärvi, V.; Tukiainen, A.; Reuna, J.; et al. Wide Spectral Coverage (0.7–2.2 EV) Lattice-Matched Multijunction Solar Cells Based on AlGaInP, AlGaAs and GaInNAsSb Materials. Prog. Photovolt. Res. Appl. 2021, 29, 869–875. [Google Scholar] [CrossRef]
- Isoaho, R.; Aho, T.; Aho, A.; Tukiainen, A.; Reuna, J.; Raappana, M.; Guina, M. High Performance Low-Bandgap (0.8 EV) Single Junction GaInNAsSb Solar Cells Incorporating Au-Based Back Surface Reflectors. Sol. Energy Mater. Sol. Cells 2022, 234, 111413. [Google Scholar] [CrossRef]
- Braza, V.; Reyes, D.F.; Gonzalo, A.; Utrilla, A.D.; Ben, T.; Ulloa, J.M.; González, D. Sb and N Incorporation Interplay in GaAsSbN/GaAs Epilayers near Lattice-Matching Condition for 1.0–1.16-EV Photonic Applications. Nanoscale Res. Lett. 2017, 12, 356. [Google Scholar] [CrossRef]
- Miyashita, N.; He, Y.; Agui, T.; Juso, H.; Takamoto, T.; Okada, Y. Inverted Lattice-Matched Triple Junction Solar Cells with 1.0 EV GaInNAsSb Subcell by MOCVD/MBE Hybrid Growth. IEEE J. Photovolt. 2019, 9, 666–672. [Google Scholar] [CrossRef]
- Gonzalo, A.; Stanojević, L.; Fuertes Marrón, D.; Guzman, A.; Hierro, A.; Ulloa, J.M. 1 EV GaAsSbN–Based Solar Cells for Efficient Multi-Junction Design: Enhanced Solar Cell Performance upon Annealing. Sol. Energy 2021, 221, 307–313. [Google Scholar] [CrossRef]
- Dawidowski, W.; Ściana, B.; Bielak, K.; Mikolášek, M.; Drobný, J.; Serafińczuk, J.; Lombardero, I.; Radziewicz, D.; Kijaszek, W.; Kósa, A.; et al. Analysis of Current Transport Mechanism in AP-MOVPE Grown GaAsN p-i-n Solar Cell. Energies 2021, 14, 4651. [Google Scholar] [CrossRef]
- Kudrawiec, R.; Latkowska, M.; Baranowski, M.; Misiewicz, J.; Li, L.H.; Harmand, J.C. Photoreflectance, Photoluminescence, and Microphotoluminescence Study of Optical Transitions between Delocalized and Localized States in GaN0.02As0.98, Ga0.95In0.05N 0.02As0.98, and GaN0.02As0.90Sb0.08 Layers. Phys. Rev. B Condens. Matter Mater. Phys. 2013, 88, 125201. [Google Scholar] [CrossRef]
- Johnston, S.W.; Kurtz, S.R.; Friedman, D.J.; Ptak, A.J.; Ahrenkiel, R.K.; Crandall, R.S. Observed Trapping of Minority-Carrier Electrons in p-Type GaAsN during Deep-Level Transient Spectroscopy Measurement. Appl. Phys. Lett. 2005, 86, 072109. [Google Scholar] [CrossRef]
- Kurtz, S.R.; Klem, J.F.; Allerman, A.A.; Sieg, R.M.; Seager, C.H.; Jones, E.D. Minority Carrier Diffusion and Defects in InGaAsN Grown by Molecular Beam Epitaxy. Appl. Phys. Lett. 2002, 80, 1379–1381. [Google Scholar] [CrossRef]
- Khan, A.; Kurtz, S.R.; Prasad, S.; Johnston, S.W.; Gou, J. Correlation of Nitrogen Related Traps in InGaAsN with Solar Cell Properties. Appl. Phys. Lett. 2007, 90, 243509. [Google Scholar] [CrossRef]
- Shan, W.; Walukiewicz, W.; Yu, K.M.; Wu, J.; Ager, J.W.; Haller, E.E. New Developments in Dilute Nitride Semiconductor Research. In III-Nitride: Semiconductor Materials; Feng, Z.C., Ed.; Imperial College Press: London, UK, 2006; pp. 399–428. ISBN 978-1-86094-903-6. [Google Scholar]
- Stringfellow, G. Miscibility Gaps in Quaternary III/V Alloys. J. Cryst. Growth 1982, 58, 194–202. [Google Scholar] [CrossRef]
- Nakajima, K.; Osamura, K.; Yasuda, K.; Murakami, Y. The Pseudoquaternary Phase Diagram of the Ga-In-As-Sb System. J. Cryst. Growth 1977, 41, 87–92. [Google Scholar] [CrossRef]
- Milanova, M.; Donchev, V.; Kostov, K.L.; Alonso-Álvarez, D.; Valcheva, E.; Kirilov, K.; Asenova, I.; Ivanov, I.G.; Georgiev, S.; Ekins-Daukes, N. Experimental Study of the Effect of Local Atomic Ordering on the Energy Band Gap of Melt Grown InGaAsN Alloys. Semicond. Sci. Technol. 2017, 32, 085005. [Google Scholar] [CrossRef]
- Donchev, V.; Milanova, M.; Asenova, I.; Shtinkov, N.; Alonso-Álvarez, D.; Mellor, A.; Karmakov, Y.; Georgiev, S.; Ekins-Daukes, N. Effect of Sb in Thick InGaAsSbN Layers Grown by Liquid Phase Epitaxy. J. Cryst. Growth 2018, 483, 140–146. [Google Scholar] [CrossRef]
- Milanova, M.; Donchev, V.; Arnaudov, B.; Alonso-Álvarez, D.; Terziyska, P. GaAsSbN-Based p-i-n Heterostructures for Solar Cell Applications Grown by Liquid-Phase Epitaxy. J. Mater. Sci. Mater. Electron. 2020, 31, 2073–2080. [Google Scholar] [CrossRef]
- Kronik, L.; Shapira, Y. Surface Photovoltage Phenomena: Theory, Experiment, and Applications. Surf. Sci. Rep. 1999, 37, 1–206. [Google Scholar] [CrossRef]
- Schroder, D.K. Surface Voltage and Surface Photovoltage: History, Theory and Applications. Meas. Sci. Technol. 2001, 12, R16–R31. [Google Scholar] [CrossRef]
- Donchev, V. Surface Photovoltage Spectroscopy of Semiconductor Materials for Optoelectronic Applications. Mater. Res. Express 2019, 6, 103001. [Google Scholar] [CrossRef]
- Kronik, L.; Mishori, B.; Fefer, E.; Shapira, Y.; Riedl, W. Quality Control and Characterization of Cu(In,Ga)Se2-Based Thin-Film Solar Cells by Surface Photovoltage Spectroscopy. Sol. Energy Mater. Sol. Cells 1998, 51, 21–34. [Google Scholar] [CrossRef]
- Cavalcoli, D.; Fazio, M.A. Electronic Transitions in Low Dimensional Semiconductor Structures Measured by Surface Photovoltage Spectroscopy. Mater. Sci. Semicond. Process. 2019, 92, 28–38. [Google Scholar] [CrossRef]
- Wang, P.; Kurayama, S.; Fukuyama, A.; Akashi, Y.; Ikari, T. Investigation of Optical Absorption Spectra of GaAs/AlAs Multiple Quantum Wells Fabricated on a GaAs Substrate Using Surface Photovoltage and Piezoelectric Photothermal Techniques. Jpn. J. Appl. Phys. Part 1 Regul. Pap. Short Notes Rev. Pap. 2007, 46, 6857–6859. [Google Scholar] [CrossRef]
- Kronik, L.; Shapira, Y. Surface Photovoltage Spectroscopy of Semiconductor Structures: At the Crossroads of Physics, Chemistry and Electrical Engineering. Surf. Interface Anal. 2001, 31, 954–965. [Google Scholar] [CrossRef]
- Sharma, T.K.; Porwal, S.; Kumar, R.; Kumar, S. Absorption Edge Determination of Thick GaAs Wafers Using Surface Photovoltage Spectroscopy. Rev. Sci. Instrum. 2002, 73, 1835–1840. [Google Scholar] [CrossRef]
- González, Y.; Abelenda, A.; Sánchez, M. Surface Photovoltage Spectroscopy Characterization of AlGaAs/GaAs Laser Structures. J. Phys. Conf. Ser. 2017, 792, 012021. [Google Scholar] [CrossRef]
- Kumar, S.; Ganguli, T.; Bhattacharya, P.; Roy, U.N.; Chandvankar, S.S.; Arora, B.M. Surface Photovoltage Spectroscopy of N-n+ and p-n+ AlGaAs/GaAs Heterojunctions. Appl. Phys. Lett. 1998, 72, 3020–3022. [Google Scholar] [CrossRef]
- Yang, J.; Zidon, Y.; Shapira, Y. Alloy Composition and Electronic Structure of Cd1-xZnxTe by Surface Photovoltage Spectroscopy. J. Appl. Phys. 2002, 91, 703–707. [Google Scholar] [CrossRef]
- Donchev, V.; Kirilov, K.; Ivanov, T.; Germanova, K. Surface Photovoltage Phase Spectroscopy—A Handy Tool for Characterisation of Bulk Semiconductors and Nanostructures. Mater. Sci. Eng. B Solid-State Mater. Adv. Technol. 2006, 129, 186–192. [Google Scholar] [CrossRef]
- Bansal, B.; Kadir, A.; Bhattacharya, A.; Arora, B.M.; Bhat, R. Alloy Disorder Effects on the Room Temperature Optical Properties of GaInNAs Quantum Wells. Appl. Phys. Lett. 2006, 89, 032110. [Google Scholar] [CrossRef]
- Galluppi, M.; Geelhaar, L.; Riechert, H.; Hetterich, M.; Grau, A.; Birner, S.; Stolz, W. Bound-to-Bound and Bound-to-Free Transitions in Surface Photovoltage Spectra: Determination of the Band Offsets for InxGa1-xAs and InxGa1-xAs1-yNy Quantum Wells. Phys. Rev. B Condens. Matter Mater. Phys. 2005, 72, 155324. [Google Scholar] [CrossRef]
- Kudrawiec, R.; Sitarek, P.; Gladysiewicz, M.; Misiewicz, J.; He, Y.; Jin, Y.; Vardar, G.; Mintarov, A.M.; Merz, J.L.; Goldman, R.S.; et al. Surface Photovoltage and Modulation Spectroscopy of E− and E+ Transitions in GaNAs Layers. Thin Solid Films 2014, 567, 101–104. [Google Scholar] [CrossRef][Green Version]
- Milanova, M.; Donchev, V.; Kostov, K.L.; Alonso-Álvarez, D.; Terziyska, P.; Avdeev, G.; Valcheva, E.; Kirilov, K.; Georgiev, S. Study of GaAsSb:N Bulk Layers Grown by Liquid Phase Epitaxy for Solar Cells Applications. Mater. Res. Express 2019, 6, 075521. [Google Scholar] [CrossRef]
- Vitanov, P.; Milanova, M.; Goranova, E.; Dikov, C.; Ivanov, P.; Bakardjieva, V. Solar Cell Technology on the Base of III–V Heterostructures. J. Phys. Conf. Ser. 2010, 253, 012044. [Google Scholar] [CrossRef]
- Alexieva, Z.I.; Nenova, Z.S.; Bakardjieva, V.S.; Milanova, M.M.; Dikov, H.M. Antireflection Coatings for GaAs Solar Cell Applications. J. Phys. Conf. Ser 2010, 223, 12045. [Google Scholar] [CrossRef]
- Milanova, M.; Donchev, V.; Cheetham, K.J.; Cao, Z.; Sandall, I.; Piana, G.M.; Hutter, O.S.; Durose, K.; Mumtaz, A. Single-Junction Solar Cells Based on p-i-n GaAsSbN Heterostructures Grown by Liquid Phase Epitaxy. Sol. Energy 2020, 208, 659–664. [Google Scholar] [CrossRef]
- Zhang, S.B.; Wei, S.H. Nitrogen Solubility and Induced Defect Complexes in Epitaxial GaAs:N. Phys. Rev. Lett. 2001, 86, 1789–1792. [Google Scholar] [CrossRef] [PubMed]
- Krispin, P.; Gambin, V.; Harris, J.; Ploog, K. Nitrogen-Related Electron Traps in Ga(As,N) Layers (⩽3% N). J. Appl. Phys. 2003, 93, 6095–6099. [Google Scholar] [CrossRef]
- Kent, P.R.C.; Bellaiche, L.; Zunger, A. Pseudopotential Theory of Dilute III V Nitrides. Semicond. Sci. Technol. 2002, 17, 851–859. [Google Scholar] [CrossRef]
- Laukkanen, P.; Punkkinen, M.P.J.; Puustinen, J.; Levämäki, H.; Tuominen, M.; Schulte, K.; Dahl, J.; Lång, J.; Zhang, H.L.; Kuzmin, M.; et al. Formation and Destabilization of Ga Interstitials in GaAsN: Experiment and Theory. Phys. Rev. B Condens. Matter Mater. Phys. 2012, 86, 195205. [Google Scholar] [CrossRef]
- Chen, W.M.; Buyanova, I.A.; Tu, C.W.; Yonezu, H. Point Defects in Dilute Nitride III-N-As and III-N-P. Phys. B Condens. Matter 2006, 376–377, 545–551. [Google Scholar] [CrossRef]
- Milanova, M.; Donchev, V.; Georgiev, S.; Kirilov, K.; Terziyska, P. Effect of Growth Temperature on Nitrogen Incorporation into GaAsN during Liquid-Phase Epitaxy. J. Phys. Conf. Ser. 2022, 2240, 012047. [Google Scholar] [CrossRef]
- Alberi, K.; Wu, J.; Walukiewicz, W.; Yu, K.M.; Dubon, O.D.; Watkins, S.P.; Wang, C.X.; Liu, X.; Cho, Y.-J.; Furdyna, J. Valence-Band Anticrossing in Mismatched III-V Semiconductor Alloys. Phys. Rev. B 2007, 75, 45203. [Google Scholar] [CrossRef]
- Lin, K.I.; Lin, K.L.; Wang, B.W.; Lin, H.H.; Hwang, J.S. Double-Band Anticrossing in GaAsSbN Induced by Nitrogen and Antimony Incorporation. Appl. Phys. Express 2013, 6, 121202. [Google Scholar] [CrossRef]
- Donchev, V.; Milanova, M.; Kirilov, K.; Georgiev, S.; Kostov, K.L.; Piana, G.M.; Avdeev, G. Low-Temperature LPE Growth and Characterization of GaAsSb Layers for Photovoltaic Applications. J. Cryst. Growth 2021, 574, 126335. [Google Scholar] [CrossRef]
- Gao, X.; Wei, Z.; Zhao, F.; Yang, Y.; Chen, R.; Fang, X.; Tang, J.; Fang, D.; Wang, D.; Li, R.; et al. Investigation of Localized States in GaAsSb Epilayers Grown by Molecular Beam Epitaxy. Sci. Rep. 2016, 6, 29112. [Google Scholar] [CrossRef]
- Gao, X.; Wei, Z.; Fang, X.; Tang, J.; Fang, D.; Wang, D.; Chu, X.; Li, J.; Ma, X.; Wang, X.; et al. Effect of Rapid Thermal Annealing on the Optical Properties of GaAsSb Alloys. Opt. Mater. Express 2017, 7, 1971–1979. [Google Scholar] [CrossRef]
Disclaimer/Publisher’s Note: The statements, opinions and data contained in all publications are solely those of the individual author(s) and contributor(s) and not of MDPI and/or the editor(s). MDPI and/or the editor(s) disclaim responsibility for any injury to people or property resulting from any ideas, methods, instructions or products referred to in the content. |
© 2023 by the authors. Licensee MDPI, Basel, Switzerland. This article is an open access article distributed under the terms and conditions of the Creative Commons Attribution (CC BY) license (https://creativecommons.org/licenses/by/4.0/).