Article

Titanium Carbide Coating for Hafnium Hydride Neutron Control Rods: In Situ X-ray Diffraction Study

by
Dmitrii V. Sidelev
1,*,
Alexey V. Pirozhkov
1,
Denis D. Mishchenko
2 and
Maxim S. Syrtanov
1
1
School of Nuclear Science and Engineering, Tomsk Polytechnic University, 30 Lenina Av., 634050 Tomsk, Russia
2
Synchrotron Radiation Facility SKIF, Boreskov Institute of Catalysis SB RAS, Nikol’skiy Prospekt 1, 630559 Kol’tsovo, Russia
*
Author to whom correspondence should be addressed.
Coatings 2023, 13(12), 2053; https://doi.org/10.3390/coatings13122053
Submission received: 6 November 2023 / Revised: 30 November 2023 / Accepted: 4 December 2023 / Published: 7 December 2023
(This article belongs to the Special Issue Protective Composite Coatings: Implementation, Structure, Properties)

Abstract

:
This article considers the possibility of using a magnetron-deposited coating for the protection of hafnium hydrides at high temperatures as a material for neutron control rods. We describe the role of TiC coating in the high-temperature behavior of hafnium hydrides in a vacuum. A 1 µm thick TiC coating was deposited through magnetron sputtering on the outer surface of disk HfHx samples, and then in situ X-ray diffraction (XRD) measurements of both the uncoated and TiC-coated HfHx samples were performed using synchrotron radiation (at a wavelength of 1.64 Å) during linear heating, the isothermal stage (700 and 900 °C), and cooling to room temperature. Quadrupole mass spectrometry was used to identify the hydrogen release from the uncoated and TiC-coated hafnium hydride samples during their heating. We found the decomposition of the HfH1.7 phase to HfH1.5 and Hf and following hafnium oxidation after the significant decrease in hydrogen flow in the uncoated HfHx samples. The TiC coating can be used as a protective layer for HfHx under certain conditions (up to 700 °C); however, the fast hydrogen release can occur in the case of a coating failure. This study shows the temperature range for the possible application of TiC coatings for the protection of hafnium hydride from hydrogen release.

1. Introduction

Nowadays, boron carbide (B4C) is commonly applied as a material for neutron control rods in nuclear reactors [1,2,3]. B4C has a high neutron absorption cross-section in the fast energy spectrum; however, it also has a rather high cost, especially in the case of high enrichment by B10 isotopes. Moreover, B4C has a short lifetime due to a pellet-cladding mechanical interaction failure caused by helium production in a reaction of B10(n, α)Li7 [4,5]. Extending the resources used for control rods to new materials can result in reduced costs for their manufacturing and disposal [6]. Materials such as Eu2O3, dysprosium-based materials, and Hf and its compounds (e.g., HfB2 and HfHx) have been intensively investigated as candidates for neutron control rods [7,8,9]. Among these alternatives, hafnium-based materials are promising candidates due to two main advantages. Firstly, Hf and its isotopes have large cross-sections of thermal neutrons, while hydrogen in Hf-H materials can moderate fast neutrons to thermal ones [4]. More importantly, no helium production occurs during reactions between neutrons and Hf isotopes, so control rods made from Hf-based compounds can have a prolonged lifetime compared to used B4C.
Hafnium has been applied as a material for control and/or emergency rods in the USA, Russia, and Japan, and it has been used in some research nuclear reactors [7,8,9,10,11]. The combination of materials used for control and/or emergency rods has also been considered, where B4C was partially replaced by new materials. The application of hafnium hydride in a control rod for a large, fast reactor where a B4C control rod was originally employed was studied in ref. [9]. The possible use of control rods made from hafnium hydride in a large, sodium-cooled, fast breeder reactor was also investigated in [11]. Neutron absorbers based on HfH1.62 can be feasible in normal situations, but the material’s absorption ability is significantly reduced at high temperatures due to hydride decomposition and the following release of hydrogen [2]. However, a comprehensive study of the properties of Hf-based materials is required to realize a full substitution of B4C in control and emergency rods. Currently, data concerning Hf-H systems are limited in the literature. In 2021 [12], the high-temperature steam oxidation (up to 1400 °C) of metallic hafnium was studied to assess its potential application as an absorber material in light-water reactors. The heat capacity and thermal conductivity of hafnium hydride with various hydrogen contents (HfHx with x = 1.6–1.72) from room temperature to 673 K was examined in ref. [13]. Some electronic, mechanical, and thermal properties of Hf-H systems were examined and discussed in ref. [14]. Moreover, the number of phase transitions in Hf-H systems depends on hydrogen concentration. Hafnium has two allotropic forms: hexagonal close-packed (hcp) α-Hf and face-centered cubic (fcc) β-Hf [7]. HfHx has a tetragonal phase (ε-phase) in a range of 1.82 < x < 2.0 [8,12] followed by a gradual deformation into an fcc structure (δ-phase) at x equal 1.60 … 1.72. The tetragonal structure (deformed cubic δ′-phase) of HfHx is observed in a range of 1.48 < x < 1.60. While pure hafnium has an hcp structure, recently, the experimental determination of the H–Hf phase diagram using in situ neutron diffraction was performed in [15]. Hence, detailed measurements and the analysis of the high-temperature behavior of Hf-H systems are urgently needed. On the one hand, the crystal structure of HfHx and hydrogen desorption should be analyzed depending on normal operation and accidental temperatures. On the other hand, possibilities to reduce the hydrogen release from Hf-H materials at high temperatures also should be considered. In [6], aluminum diffusion coating was employed for stainless-steel cladding, with following oxidation, to drastically reduce the hydrogen transfer coefficient. However, it is more efficient to preserve the absorbing characteristics of an Hf-H sample by forming a barrier layer on its surface, preventing hydrogen release. One such approach is the deposition of a protective coating onto the surface of HfHx tablets to limit the hydrogen release from Hf-H at high temperatures. Carbide coatings can be more appropriate due to hydrogen impermeability, high melting point, and thermal expansion coefficients close to those of HfH1.66, up to 1000 °C [16]. Moreover, carbides do not interact with liquid sodium at the specified temperatures. At present, TiC coating is well studied, and it is widely applied as a protective material [16,17,18,19,20]. Titanium carbide is also characterized by high resistance to radiation damage that can be beneficial for using it as a protective coating for nuclear applications [21,22,23]. TiC has an fcc lattice with a parameter of 4.31 Å [24], while the HfHx system (x = 1.60 … 1.72) also has an fcc lattice with an interplanar distance of 4.68 Å. Moreover, TiC and HfH2 have similar linear expansion coefficients of 4.3 × 10⁻⁵ and 5.9 × 10⁻⁵ °C−1, respectively [25]. Based on the above description of the HfHx system, TiC was chosen as a candidate material for protective coating. Thus, the aim of this investigation was to determine the effect of TiC coating deposition on structural properties of HfHx samples and hydrogen release at high temperatures (up to 900 °C) under vacuum conditions. For this, the TiC coating was deposited on an outer surface of the HfHx samples and, then, in situ X-ray diffraction (XRD) measurements of the uncoated and TiC-coated HfHx samples during linear heating up to 900 °C were performed in a vacuum.

2. Experimental Details

2.1. Sample Preparation

Disk samples made from a hafnium hydride (HfHx) with a diameter of 10 mm and thickness of 1 mm were used in this study. Due to the commercial confidentiality, it is not possible to describe the technological processes of the production of the HfHx samples. The first series of the HfHx samples remained uncoated (in the as-received state) and no additional mechanical or heat treatment was applied. The second series of samples had the TiC coating, which was deposited using the closed-field dual magnetron sputtering system (MS) equipped with Ti (99.95%) and C (99.9%) targets. The distance from both targets to the samples was equal to 15 cm. Firstly, the samples were washed with isopropyl alcohol to remove any surface contamination, and then they were dried by air for 2 min. Subsequently, the samples were loaded in the vacuum chamber of the installation [26], which was next pumped using a turbomolecular pump TMP–403LS (Shimadzu, Kyoto, Japan) up to a base pressure of 2 × 10⁻³ Pa. The pre-heating of the vacuum chamber up to ~75 °C was necessarily used for decreasing a pressure water vapor. At the next stage, the HfHx disks were bombarded by 1.25 keV Ar+ ions for 10 min to clean their surfaces of any contamination. Argon with the high purity of 99.9999% was used as a work gas. The samples were planetary rotated during both the processes of ion bombardment and coating deposition. The diameter of the planetary-rotated carousel was equal to 380 mm. Before the coating deposition, a quartz thickness gauge (Micron-5, Izovac Ltd., Minsk, Belarus) was used for determining deposition rates of Ti and C separately using the same type of MS, but it was operated in the single sputtering mode. Based on the calculated deposition rates, the power densities were determined for Ti (QTi) and C (QC) targets sputtered by the dual configuration of the MS. The deposition conditions for the TiC coating are presented in Table 1.
Initially, the coating was deposited onto a Si (110) substrate for determining the thickness and elemental and phase composition of the obtained coating (the TiC phase), which was performed using an X-ray diffractometer XRD-7000S (Shimadzu, Kyoto, Japan) with CuKα1 radiation (40 kV, 30 mA) and scanning electron microscope Tescan Vega-3 (SEM, Brno, Czech) equipped with an energy dispersive X-ray (EDS) attachment (Figure 1). The PDF4+ database was used for determining the phase composition of the coating.
After the selection of the deposition mode, the TiC coating was deposited on the disk HfHx samples using two sequential depositions to ensure the coating on the entire surface of the samples.

2.2. In Situ XRD Diffraction of the HfHx Samples

The in situ XRD measurements were performed using synchrotron radiation at the station “Precision diffractometry II” at the Siberian Synchrotron and Terahertz Radiation Center of the Budker Institute of Nuclear Physics of the Siberian Branch of Russian Academy of Science (Novosibirsk, Russia). The samples were examined using a wavelength of 1.64 Å in a 2θ range of 30–65°. The experiments were conducted using two maximal temperatures of Tmax = 700 and 900 °C. Initially, the samples were loaded in a vacuum chamber HTK 2000N (Anton Paar, Graz, Austria), which was next pumped to 10−3 Pa using a turbomolecular pump Turbovac 90i/iX (Leybold GmbH, Cologne, Germany). Then, a 10 min pause was applied to determine the residual pressure in the chamber, after which the sample was linearly heated from room temperature (RT) to Tmax at a heating rate of 20 °C/min. Upon reaching Tmax, the samples were isothermally treated for 10 min, and then they were cooled to RT at a rate of 20 °C/min. The heating of the samples was performed using a Pt (99.9%) heater. To control the temperature, a Pt-Ro thermocouple was welded to the back side of the Pt heater. The accuracy of the temperature measurements was equal to ±3 °C. Diffraction patterns were recorded during the whole experiment.
To determine the phase composition of the samples, the reference intensity ratio method (RIR) was used according to ref. [27]:
W k = I k m a x R I R k i I i m a x / R I R i
where Wk—the mass fraction of the analyzed phase, (wt.%); Ikmax—the maximum value of the intensity of the analyzed phase, (arb.units); RIRk—the reference ratio of intensities of the analyzed phases. The PDF4+ database was used to determine the phase composition of the experimental samples.
A quadrupole mass spectrometer SRS UGA100 (Stanford Research Systems, Sunnyvale, CA, USA) was used for controlling the working atmosphere during the tests.

3. Results

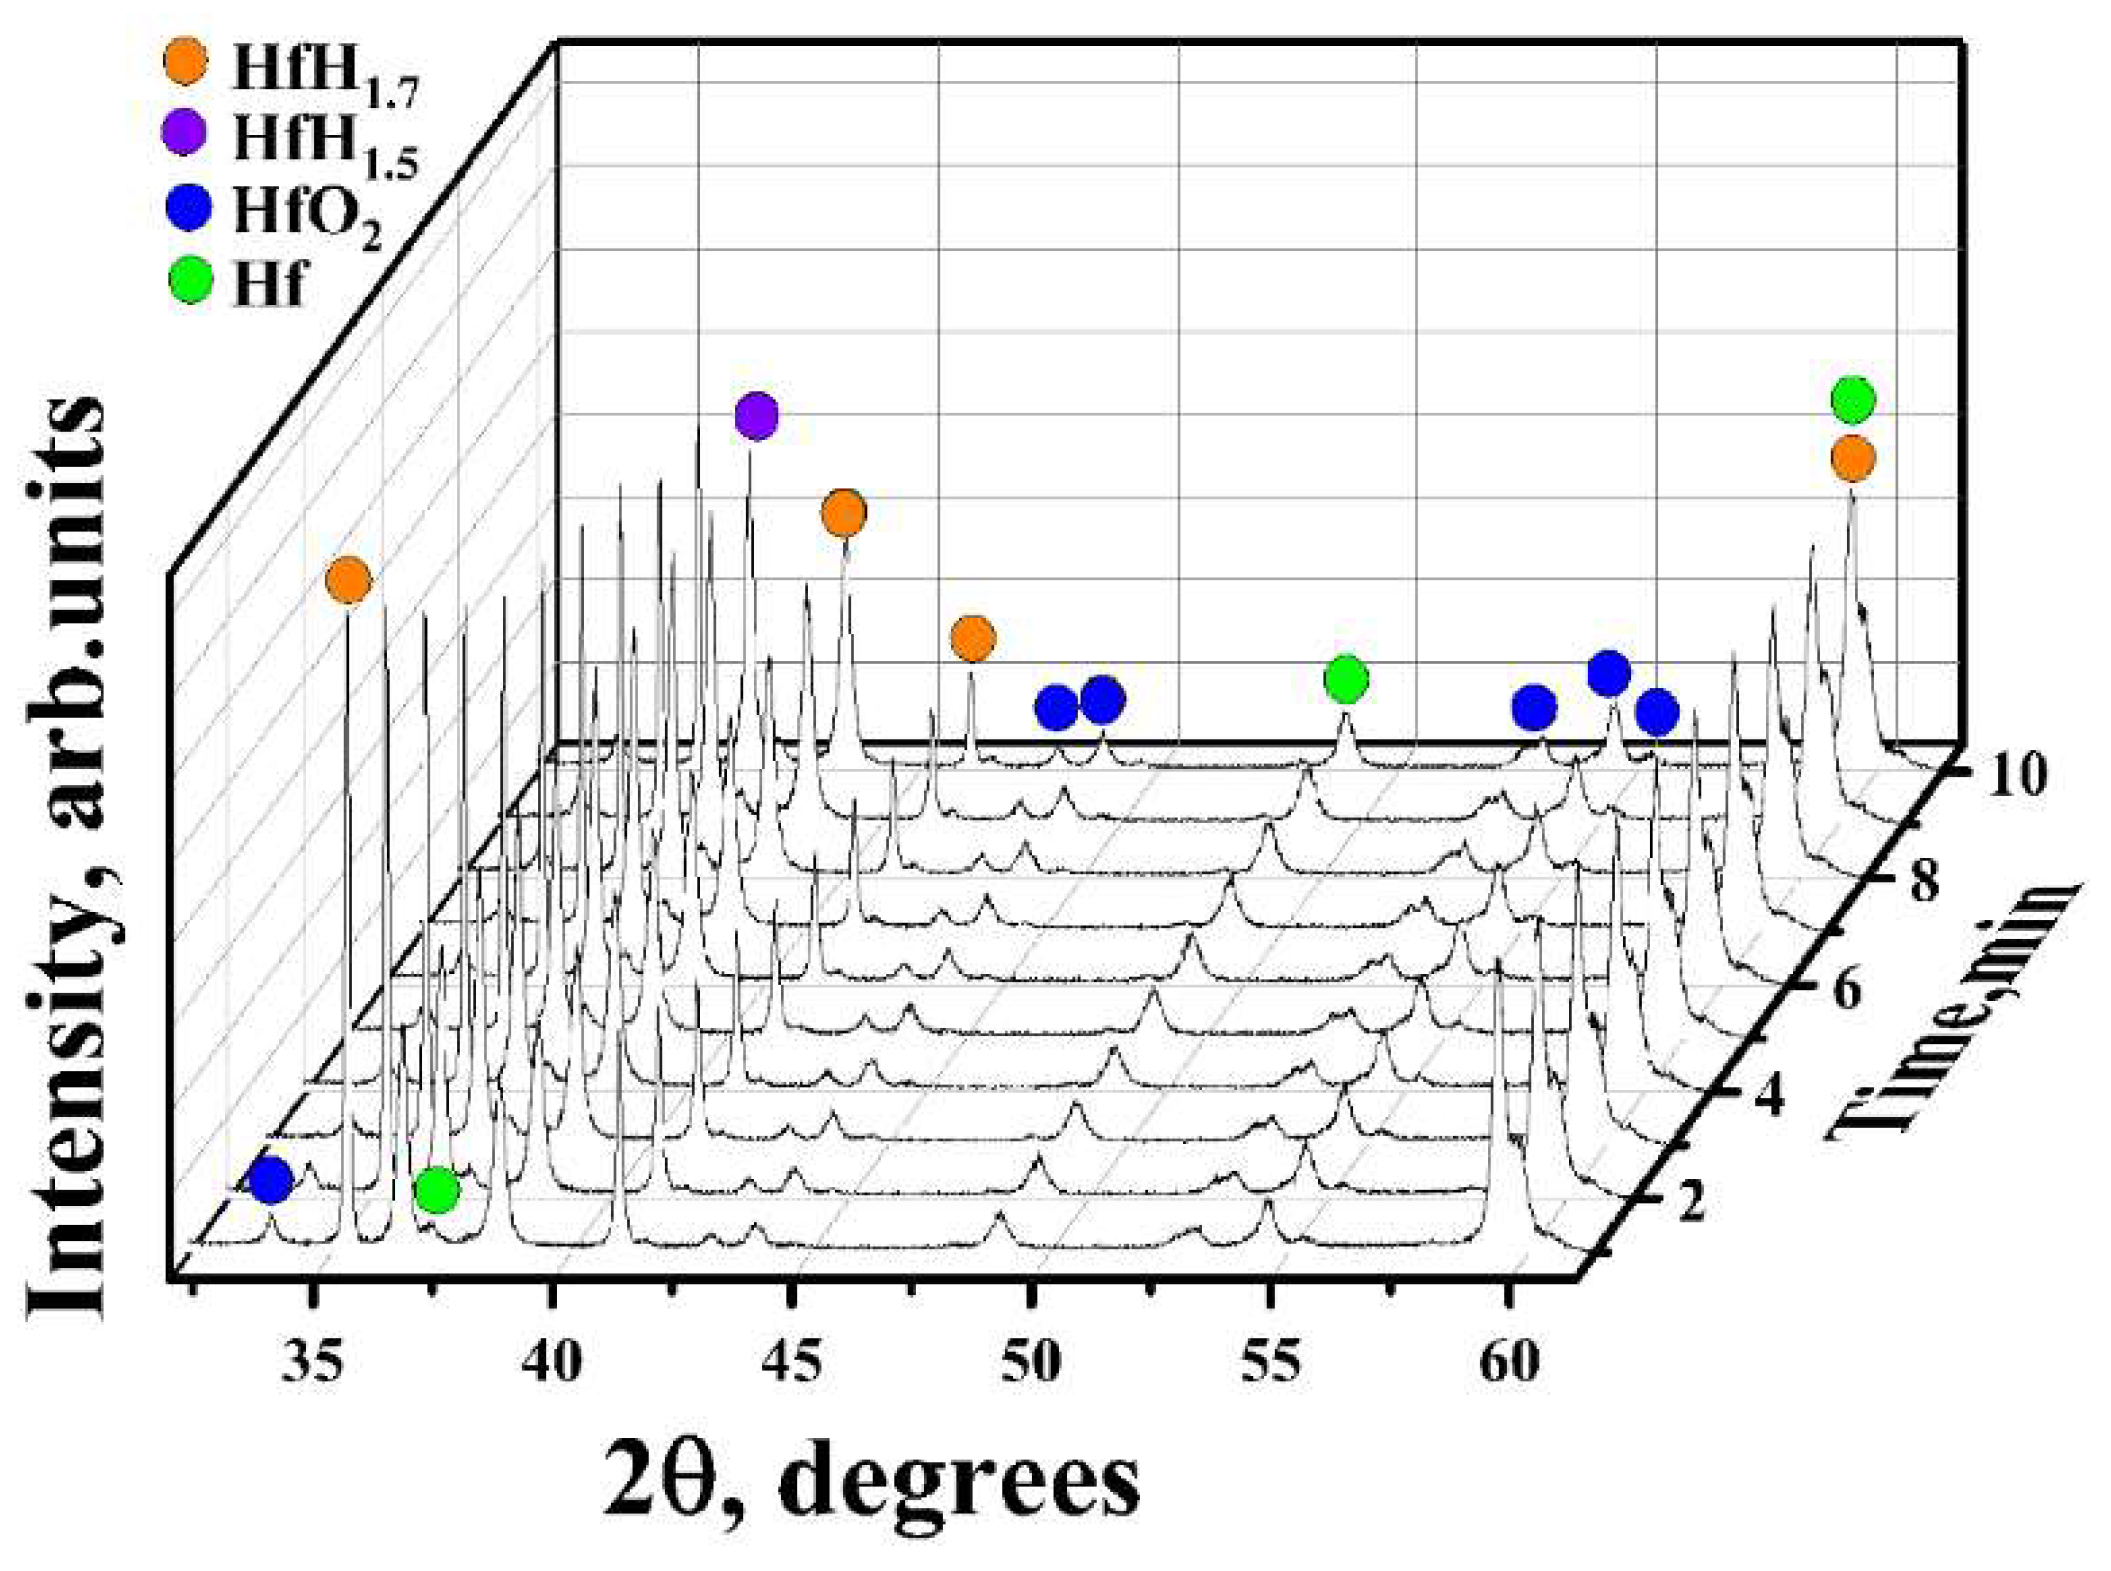
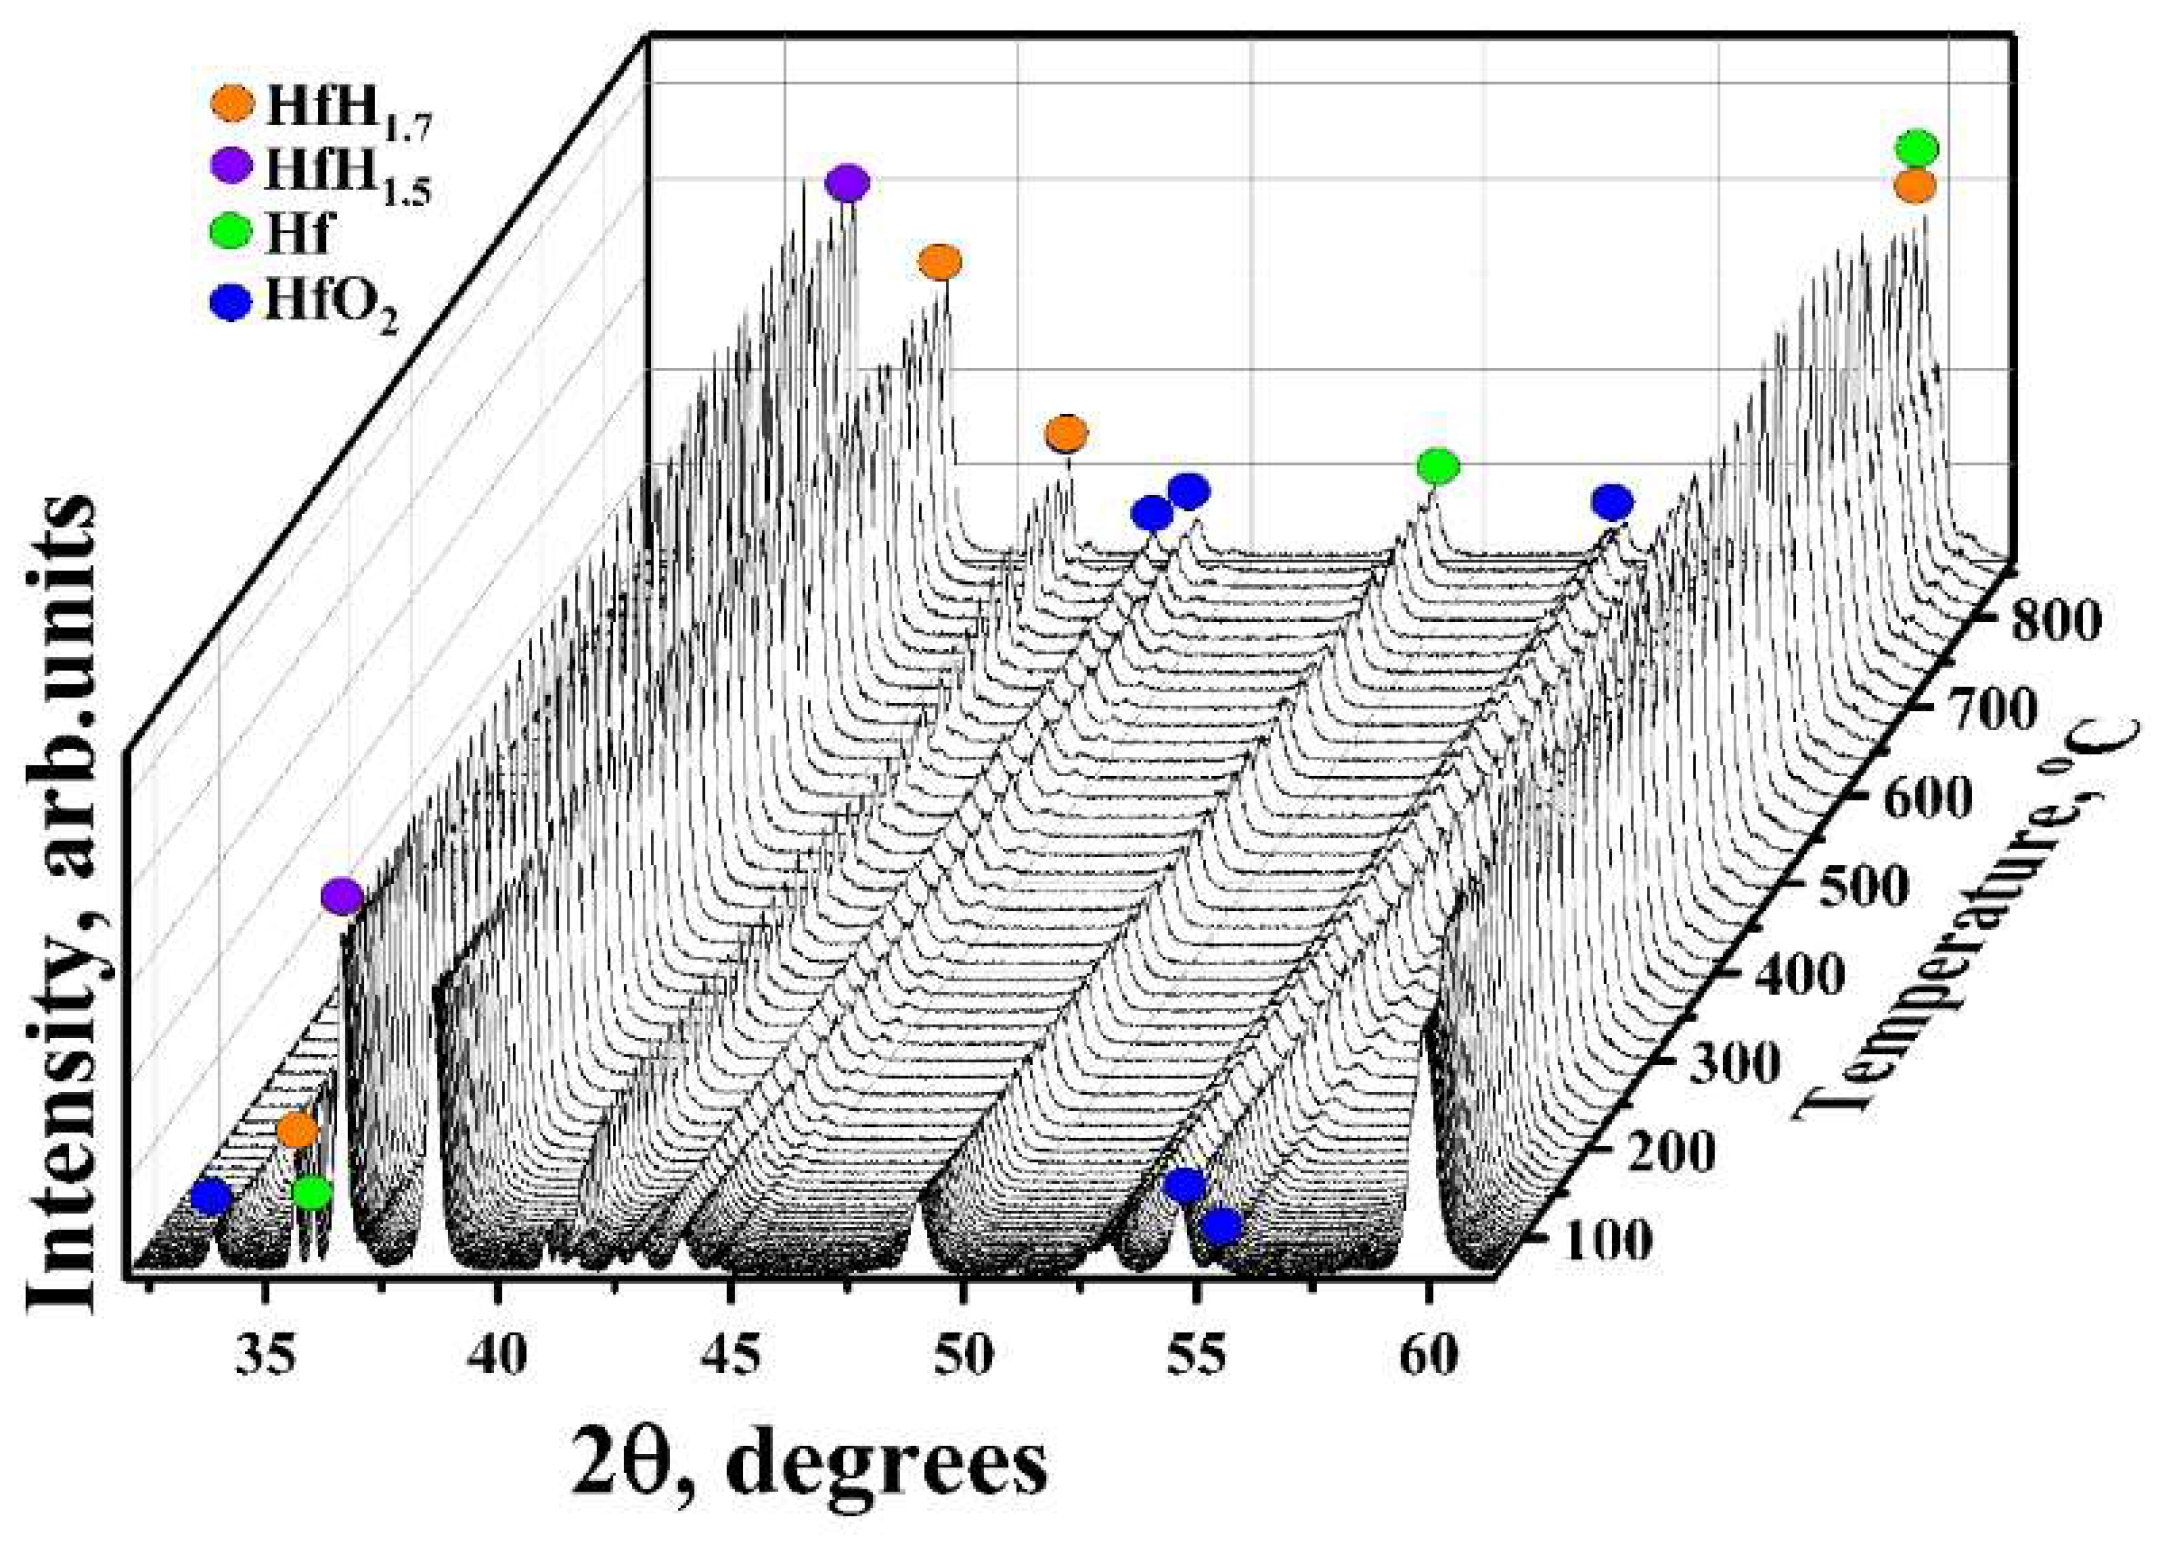
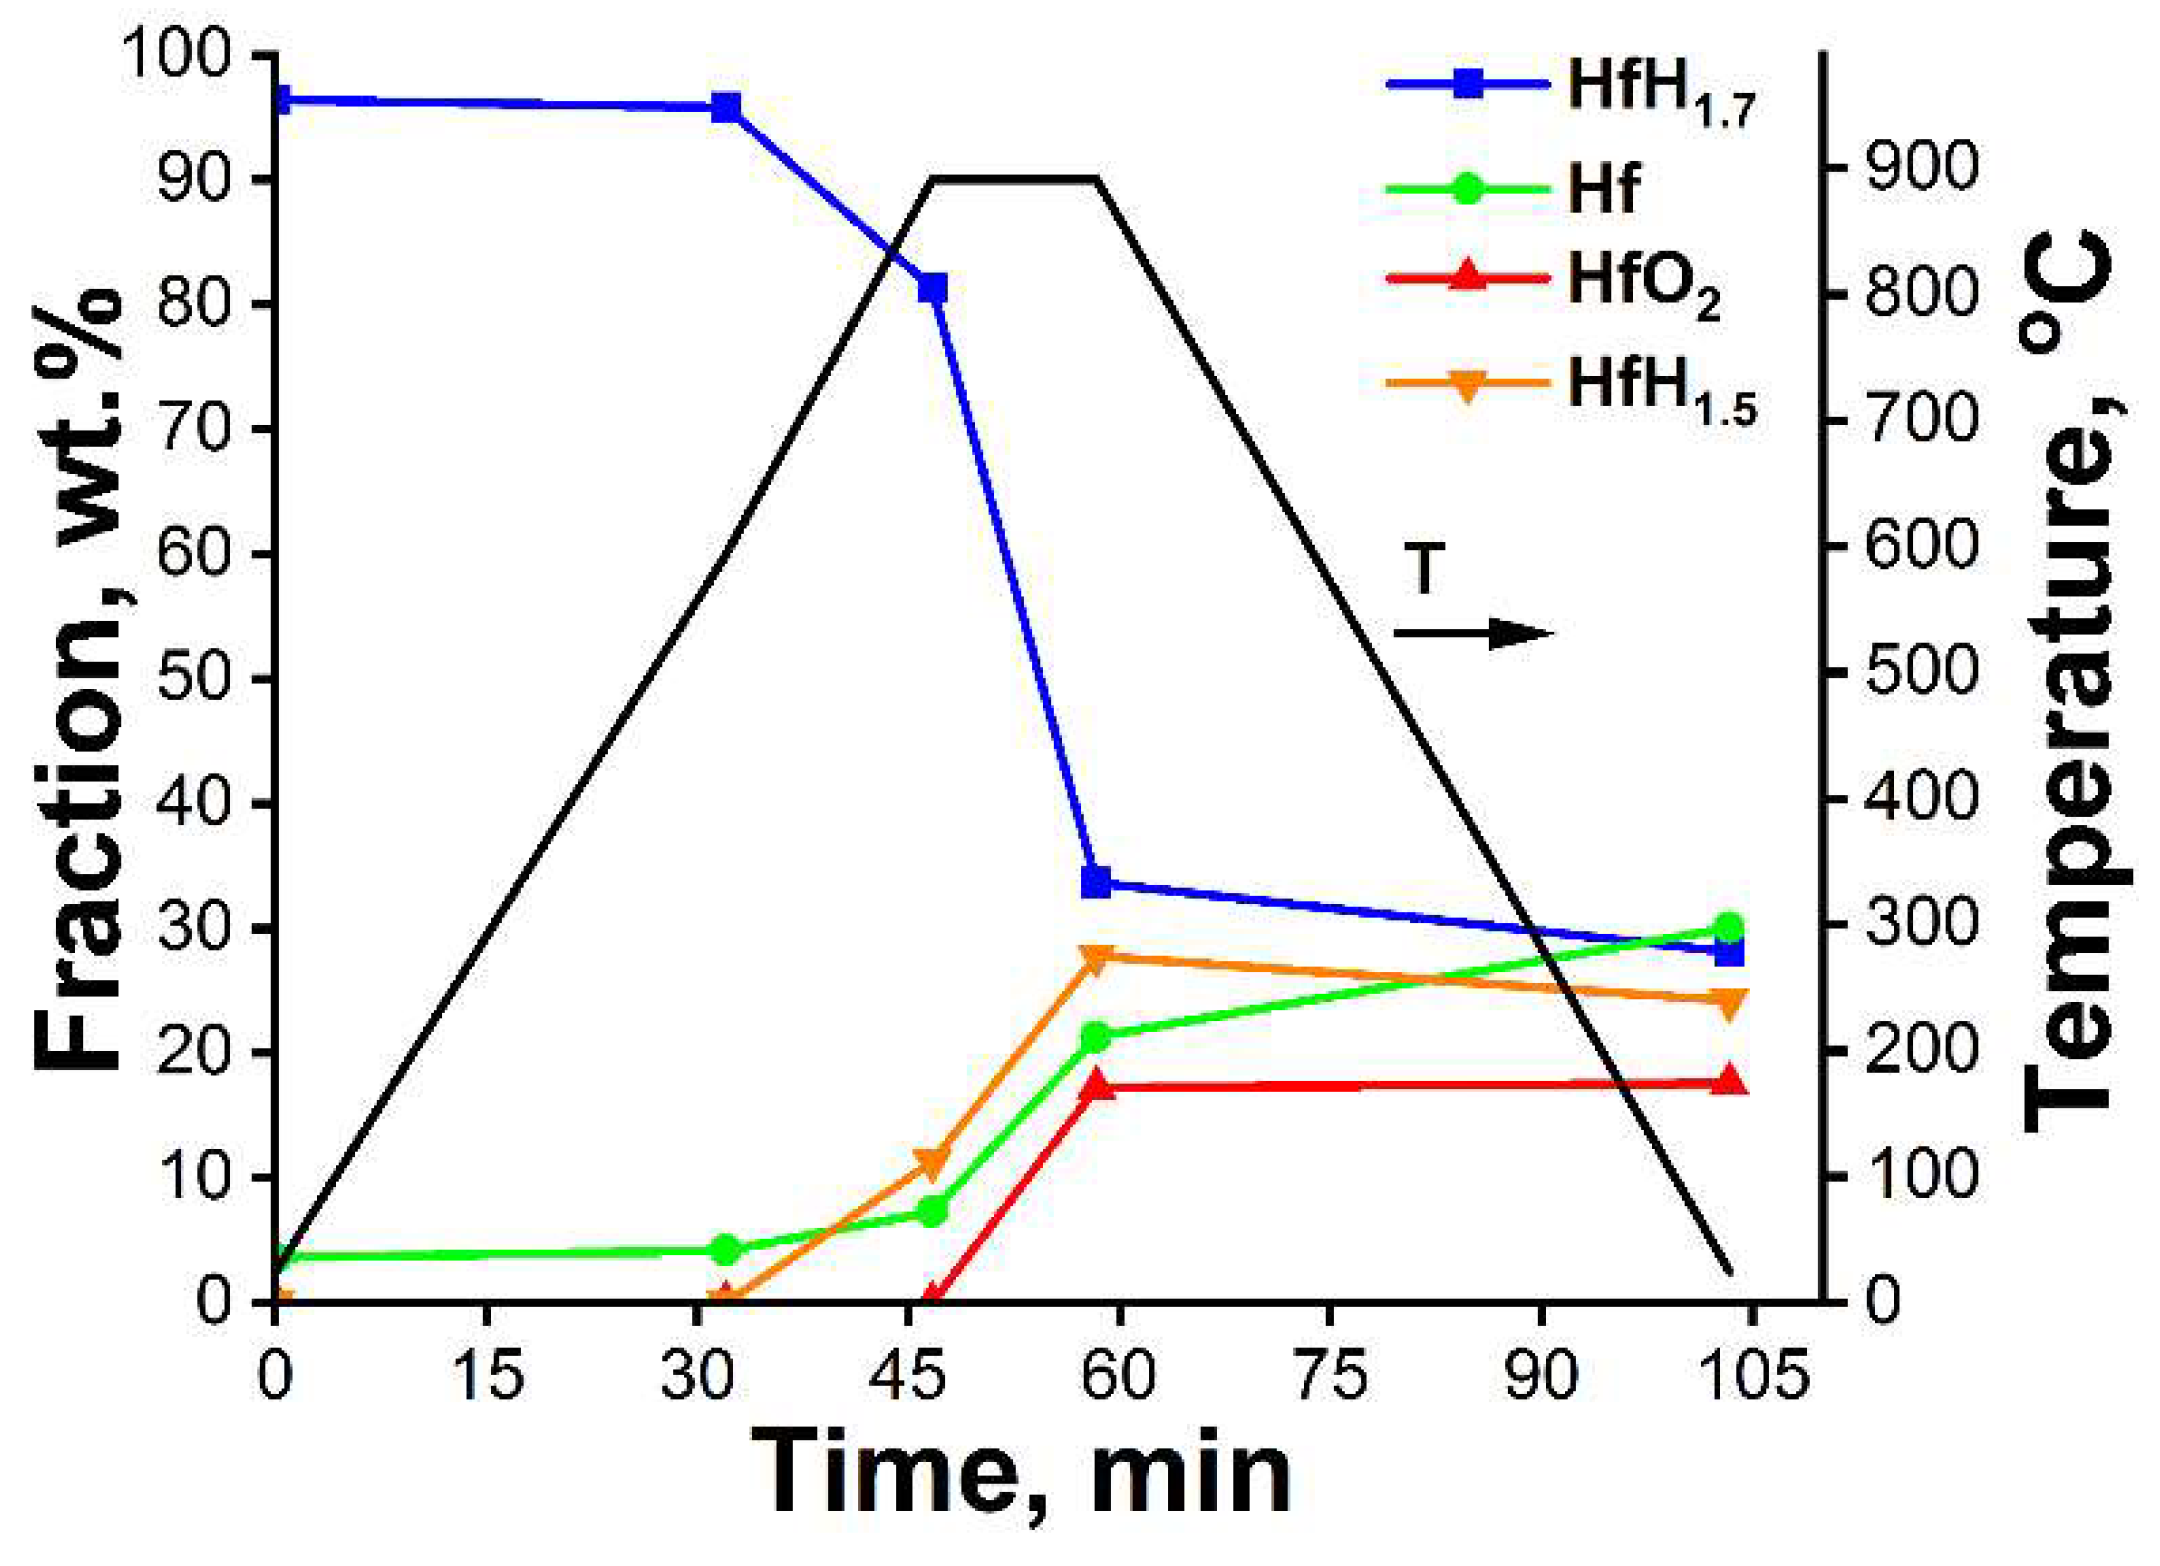
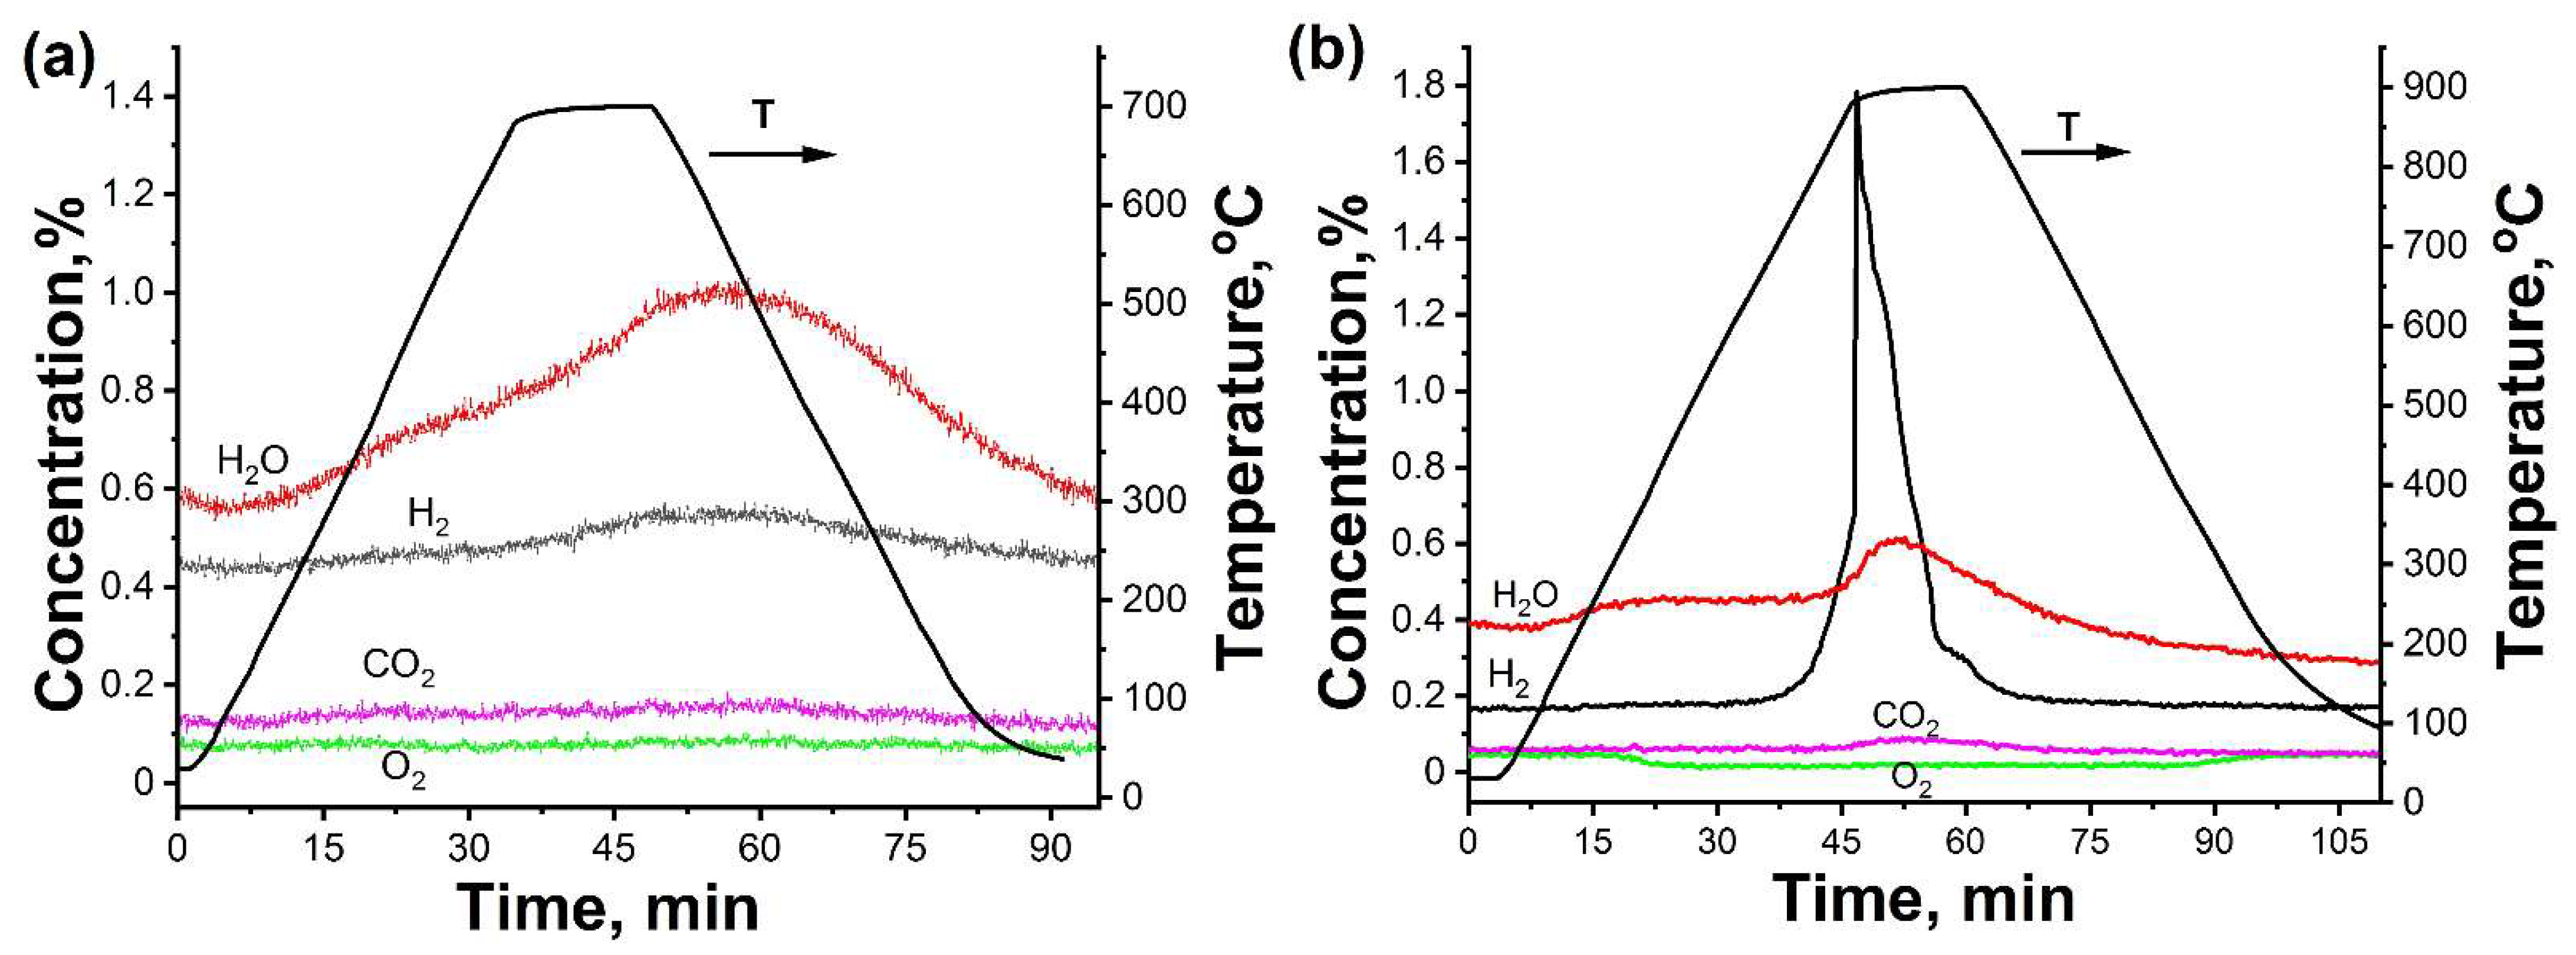
3.1. In Situ XRD Study of the Uncoated HfHx Sample

In situ XRD patterns of the uncoated HfHx sample are shown in Figure 2, Figure 3 and Figure 4. Initially (Figure 2), the uncoated HfHx sample had two phases: Hf and HfH1.7. Because the HfHx sample had low content of the metallic Hf phase in the initial state, its reflexes had low intensity (especially at ~50°), so it was difficult to track in a range of the low temperature. Up to 600 °C, only the Hf and hydride phases (HfH1.7) were present in the diffraction patterns. Then, the formation of the δ′-phase HfHx with the low hydrogen content (HfH1.5) was observed. The HfO2 phase appeared with the increase in temperature from 750 to 900 °C.
The XRD patterns of the uncoated HfHx sample were not changed during the isothermal treatment and cooling stage (Figure 3 and Figure 4). Only some shifts of the reflexes occurred due to a thermal reduction of crystal lattices of materials during the cooling stage. This sample had the Hf, HfO2, HfH1.5 and HfH1.7 phases in the case of the isothermal treatment at 900 °C and cooling stage from 900 to 30 °C.
Using the RIR method, the phase composition of the uncoated HfHx sample was calculated for the in situ XRD measurement with Tmax of 900 °C (Figure 5). Although the RIR method is quantitative, the calculation results should be analyzed, taking into account its accuracy, which is usually 2–3%. In each experiment, the concentration of the gases in the vacuum chamber was fixed using the quadrupole mass-spectrometer during the high-temperature tests at Tmax of 700 and 900 °C. These dependences are presented in Figure 6. The second axis (“Temperature”) is also added in Figure 5 and Figure 6 to better illustrate the results.
According to Figure 5, the fraction of the metallic Hf phase increased from 4 to 7 wt.%, when the uncoated HfHx sample was heated to 900 °C. At the same time, some decrease in the content of the HfH1.7 phase (15 wt.%) was found. Oppositely, the HfH1.5 phase appeared in this temperature range (11 wt.%). Figure 6b shows that the hydrogen signal was very low up to 700–720 °C, and then it smoothly rose. At the higher temperature (>720 °C) and during the isothermal stage (900 °C), a sharp increase in the content of the metallic hafnium, HfH1.5 and oxide phases was observed, while the concentration of the HfH1.7 phase noticeably decreased from 81 to 34 wt.%. Slight changes in the phase composition of the sample were observed during the cooling stage of the uncoated HfHx sample. Based on the recording of gas concentrations, the hydrogen signal abruptly increased and had its maximum at the beginning of the isothermal stage (900 °C).Then, the signal smoothly dropped to the background value at the end of this stage. It is important that the content of the hafnium oxide phase remained the same during the cooling stage and the hydrogen concentration did not noticeably change down to RT.
When the maximum temperature of the in situ XRD measurements was equal to 700 °C (Figure 6a), the increase in the hydrogen concentration was observed during the isothermal stage. The hydrogen signal had other shape in comparison with the previous one (Figure 6b), but it could have been caused by the lower value of the maximal temperature during the test.

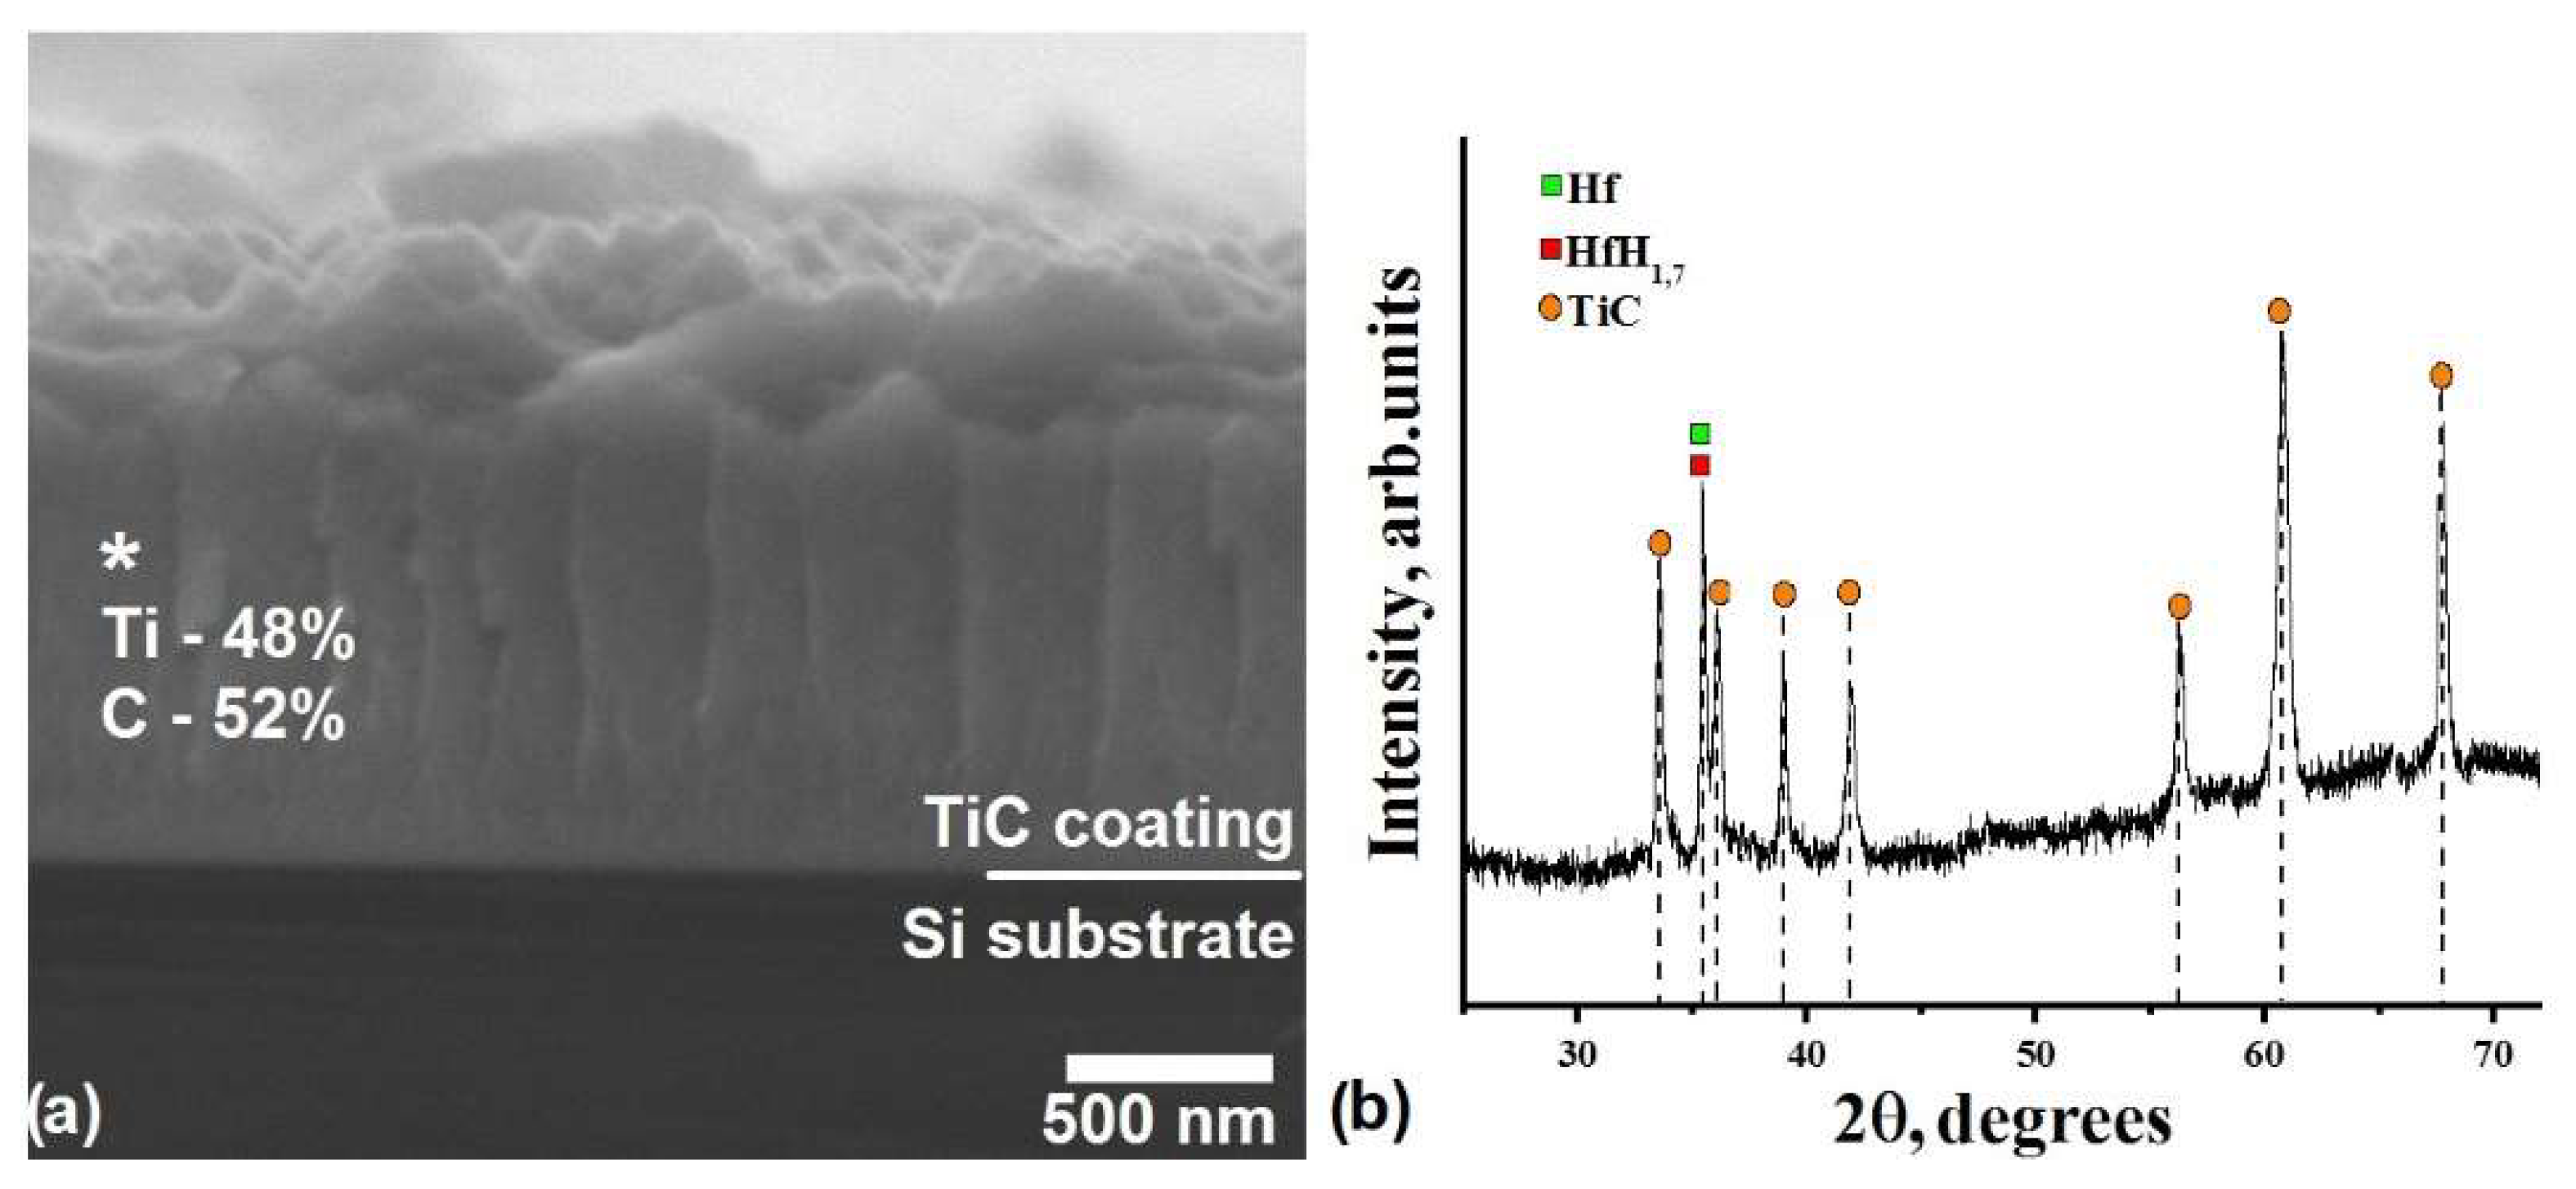
3.2. In Situ XRD Study of the TiC-Coated HfHx Sample

The in situ XRD patterns of the TiC-coated sample during linear heating in a vacuum were different from the data for the uncoated sample. The coated sample initially contained the Hf, HfH1.7 and TiC phases, and that did not change up to 800 °C (Figure 7). The TiO2 phase appeared at ~800 °C, corresponding to oxidation of the coating by residual gases in the vacuum chamber.
The XRD patterns of the TiC-coated sample during the isothermal stage (at 900 °C) are presented in Figure 8. The figure demonstrates that the HfH1.5 phase was formed at the starting period of the isothermal stage (~1 min), and then its intensity somewhat increased. At 2–3 min of the isothermal stage, the formation of the HfO2 phase was observed. Then, the phase composition of the TiC-coated sample did not change qualitatively (Figure 8 and Figure 9) during the isothermal and cooling stages of the test.
Similarly to the uncoated HfHx sample, the phase composition of the TiC-coated HfHx sample was also calculated for the in situ XRD measurements with Tmax of 900 °C (Figure 10) using the RIR method. The concentrations of gases in the vacuum chamber were recorded by the quadrupole mass-spectrometer during the in situ measurements at Tmax of 700 and 900 °C (Figure 11).
According to Figure 10, a significant increase in TiO2 content (to 19 wt.%) was observed during the heating stage of the in situ XRD test. At the same time (up to 800 °C), some reduction (16 wt.%) in the HfH1.7 content was observed. The measurements of the chamber atmosphere using the mass-spectrometer (Figure 11b) showed a stable signal for the hydrogen concentration, and then this signal increased somewhat during the heating stage. In the case of the isothermal stage, the fraction of the HfH1.7 phase was significantly reduced from 27 to 10 wt.%, while the content of the TiO2 phase increased (to 27 wt.%). According to the XRD measurements in the indicated temperature range, the metallic Hf and HfO2 phases were formed in the sample. Figure 11b shows the abrupt rise in the hydrogen signal that occurred at the beginning of the isothermal stage, and then it sharply decreased to the background value. However, the hydrogen signal had another shape in comparison with the data of the uncoated HfHx sample: two stages can be highlighted. The first stage was the sharp rise and drop of the signal that were observed through one half of the isothermal period. The second stage continued up to the end of the isothermal period; it was characterized by a slower drop in the signal value. Later, the hydrogen signal did not noticeably change. Also, the calculations of the phase composition of the TiC-coated HfHx sample did not show any significant changes.
Figure 11a shows that the hydrogen had a uniform signal during the in situ XRD measurement with the maximum temperature of 700 °C The hydrogen concentration increased at the end of the isothermal stage, and then it gradually decreased.

4. Discussion

The dependence of the structural properties of the Hf-H system on temperature is strongly important given the many possible applications in the nuclear industry [3,4,9]. The in situ XRD measurements of the uncoated HfHx during the linear heating up to 900 °C show that the HfH1.7 phase can decompose to the metallic Hf and HfH1.5 phases, followed by the hydrogen release that was observed even at 700–720 °C (Figure 5 and Figure 6). It agreed well with the Hf-H diagram [6,28], where the decomposition of the HfH1.7 phase to a mixture of the Hf and HfH1.7 phases was described. The in situ XRD test with a maximal temperature of 700 °C determined the behavior of the Hf-H system. Similar regularities were also observed for the 4th group elements of the transition metals (titanium and zirconium and their hydrides) in refs. [29,30].
When the hydrogen flow was decreased, the hafnium intensively oxidized, and the outer HfO2 layer could work as a barrier for the hydrogen release. On the other hand, the possible re-oxidation of the hafnium hydride into a dioxide (HfO2) could occur, as was found by XPS in [31]. However, as the HfO2 phase was detected in the sample only after the hydride decomposition, only low oxidation kinetics could be presumed under the given experimental conditions. Oxidation of the uncoated HfHx samples can be due to the presence of some residual oxygen in the atmosphere of the chamber and desorption of oxygen from the elements in the vacuum chamber during heating. The obtained results show that some surface treatment of the HfHx samples for their oxidation can be recommended for forming the protective scale, especially to decrease the hydrogen release.
The deposition of protective coatings also can be used to limit the hydrogen release from the Hf-H system. The TiC coating with a thickness of 1 µm was formed on full outer surface of the HfHx samples by a magnetron sputtering of Ti and C targets in Ar atmosphere. The decomposition of the HfH1.7 phase to the Hf and HfH1.5 phases was also found in the sample beneath the coating. However, the TiC coating can be applied as a hydrogen barrier up to 700 °C and slightly higher that is well observed in the mass-spectrometry measurements (Figure 11). The TiO2 phase was detected at 800 °C, before the intensive hydrogen release from the TiC-coated HfHx sample (at 900 °C). The oxidation of the TiC up to a depth of 0.1–1 µm can occur at very low partial pressures of O2 (10−4–2 × 10⁻² Pa), but it requires a high temperature (1500 °C) [32]. Considering the conditions in the present experiments (heating up to 900 °C), the TiC had parabolic oxidation kinetics, indicating formation of a protective scale [33] that can strongly limit inward oxygen diffusion. A more abrupt signal of hydrogen concentration was observed in the mass-spectrometry measurements compared to the data for the uncoated sample. Both of these indicated the limitation of the hydrogen flow from the sample using the TiC coating. It is important to point out that the hydrogen signal from the TiC-coated sample had a two-stage shape. This indicates several possible processes resulting in the hydrogen release, such as a coating failure and an outward diffusion of hydrogen. The change from the TiC phase to the TiO2 results in the high (55% [34]) expansion of the oxidized coating in a volume and can accelerate its failure. The hydrogen diffusivity in hafnium is rather high (6.9 × 10⁻³ cm2/s) [35], and activation energy barriers for the diffusion of hydrogen in the metallic hafnium and hydrides are the same [28]. So, the highest hydrogen flow from the sample occurred during the isothermal stage as the TiC coating failed. The coating failure can also lead to a free pathway of the residual oxygen to the HfHx sample, resulting in its oxidation and the growth of the protective scale (HfO2), which can limit the hydrogen release.
The higher temperature of the hydrogen release from the TiC-coated HfHx sample compared to the uncoated one is a beneficial point for the possible application of the protective coating for nuclear control rods. The oxidation of the TiC coating can cause its failure and should be additionally estimated under normal operation and accidental conditions. Based on the obtained results, the TiC coating can be recommended for use as a protective scale for hafnium hydrides to limit hydrogen release under certain conditions.

5. Conclusions

This study describes the possibility of using TiC coatings on HfHx samples to decrease hydrogen release at high temperatures. A TiC coating with a thickness of 1 µm was deposited onto the HfHx samples by magnetron sputtering. Then, in situ XRD measurements of the uncoated and TiC-coated HfHx samples were performed using synchrotron radiation with a wavelength of 1.64 Å up to two maximal temperatures of 700 and 900 °C to determine a role for the coating. The following conclusions were made.
(1)
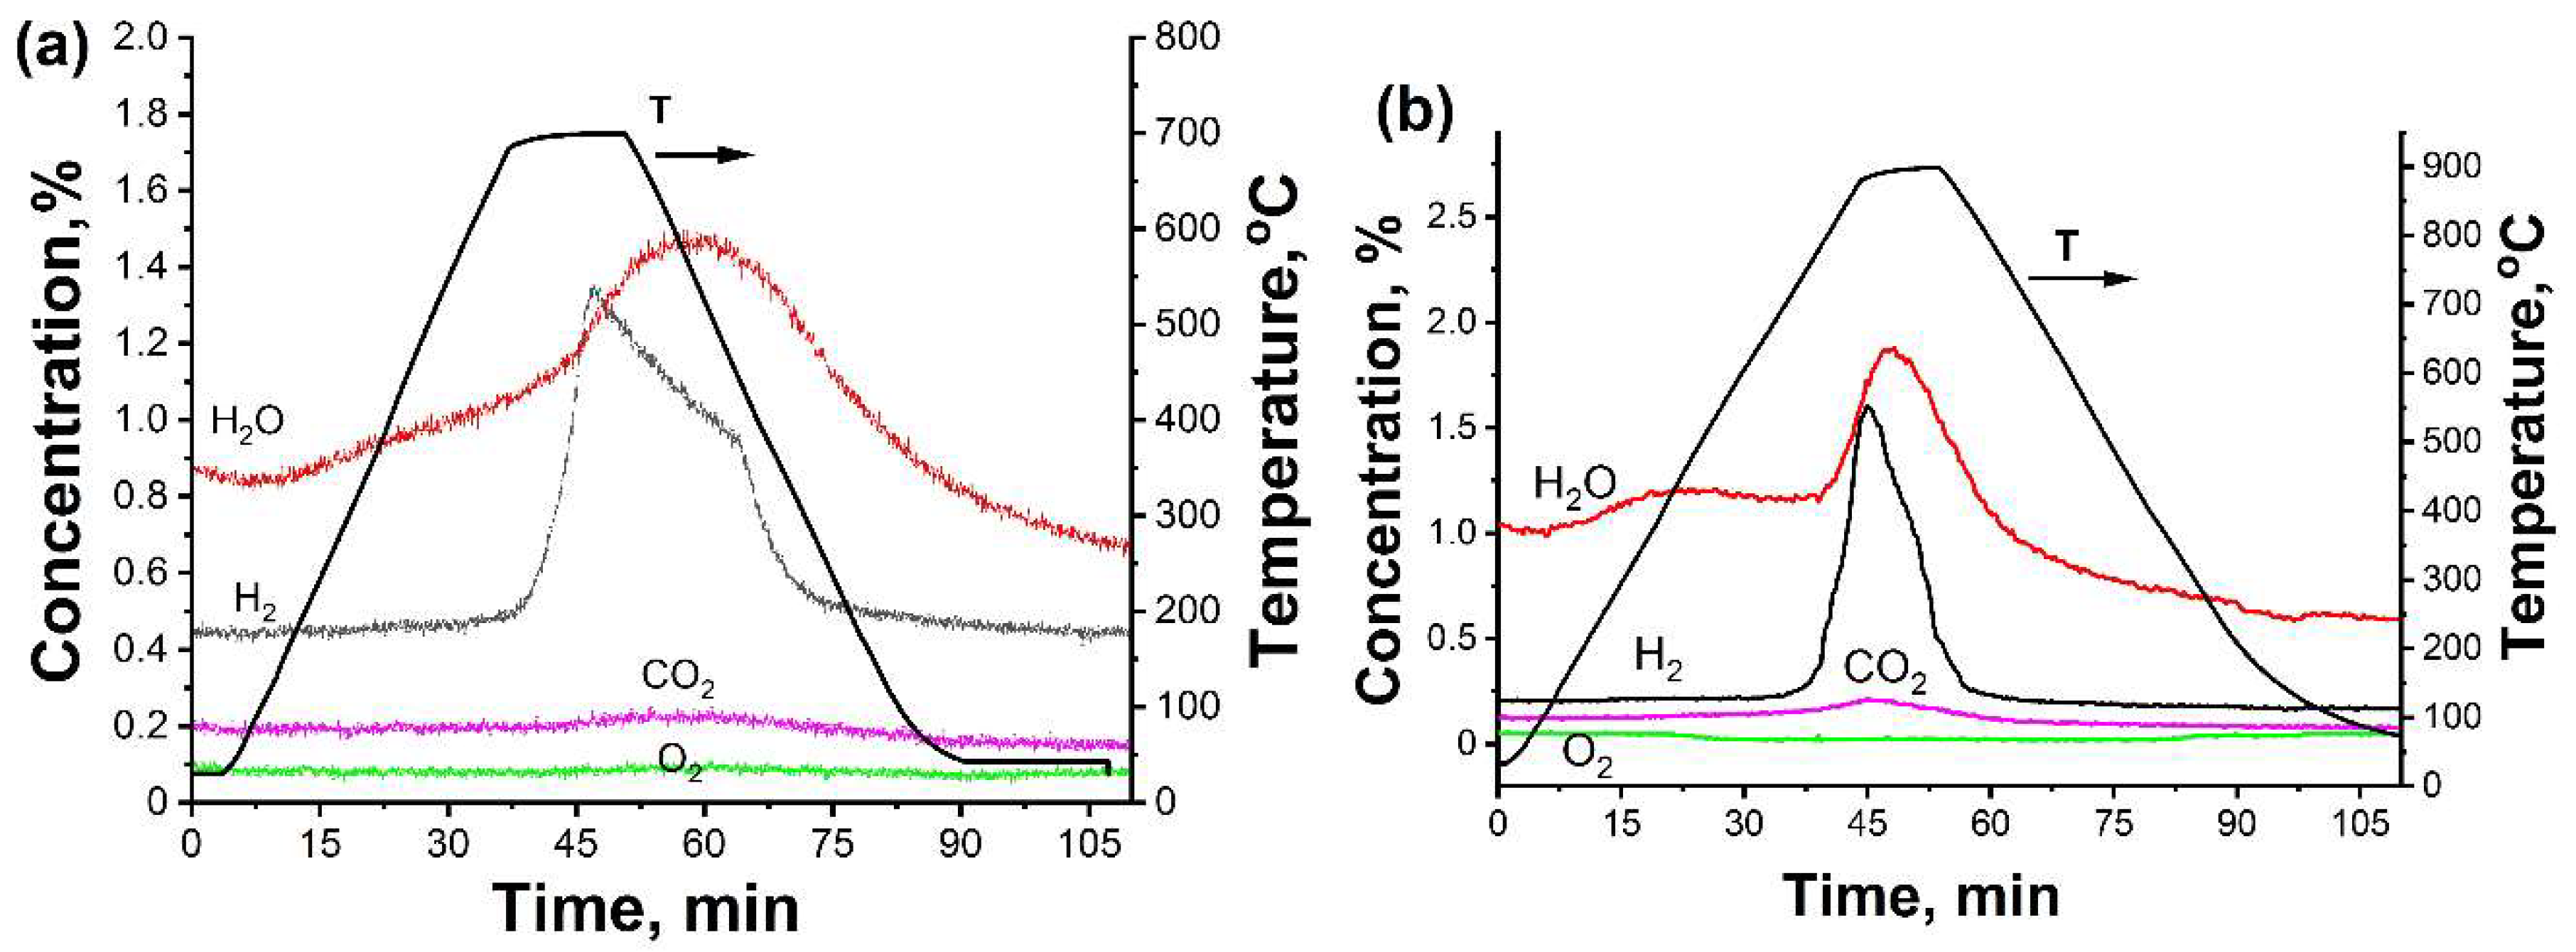
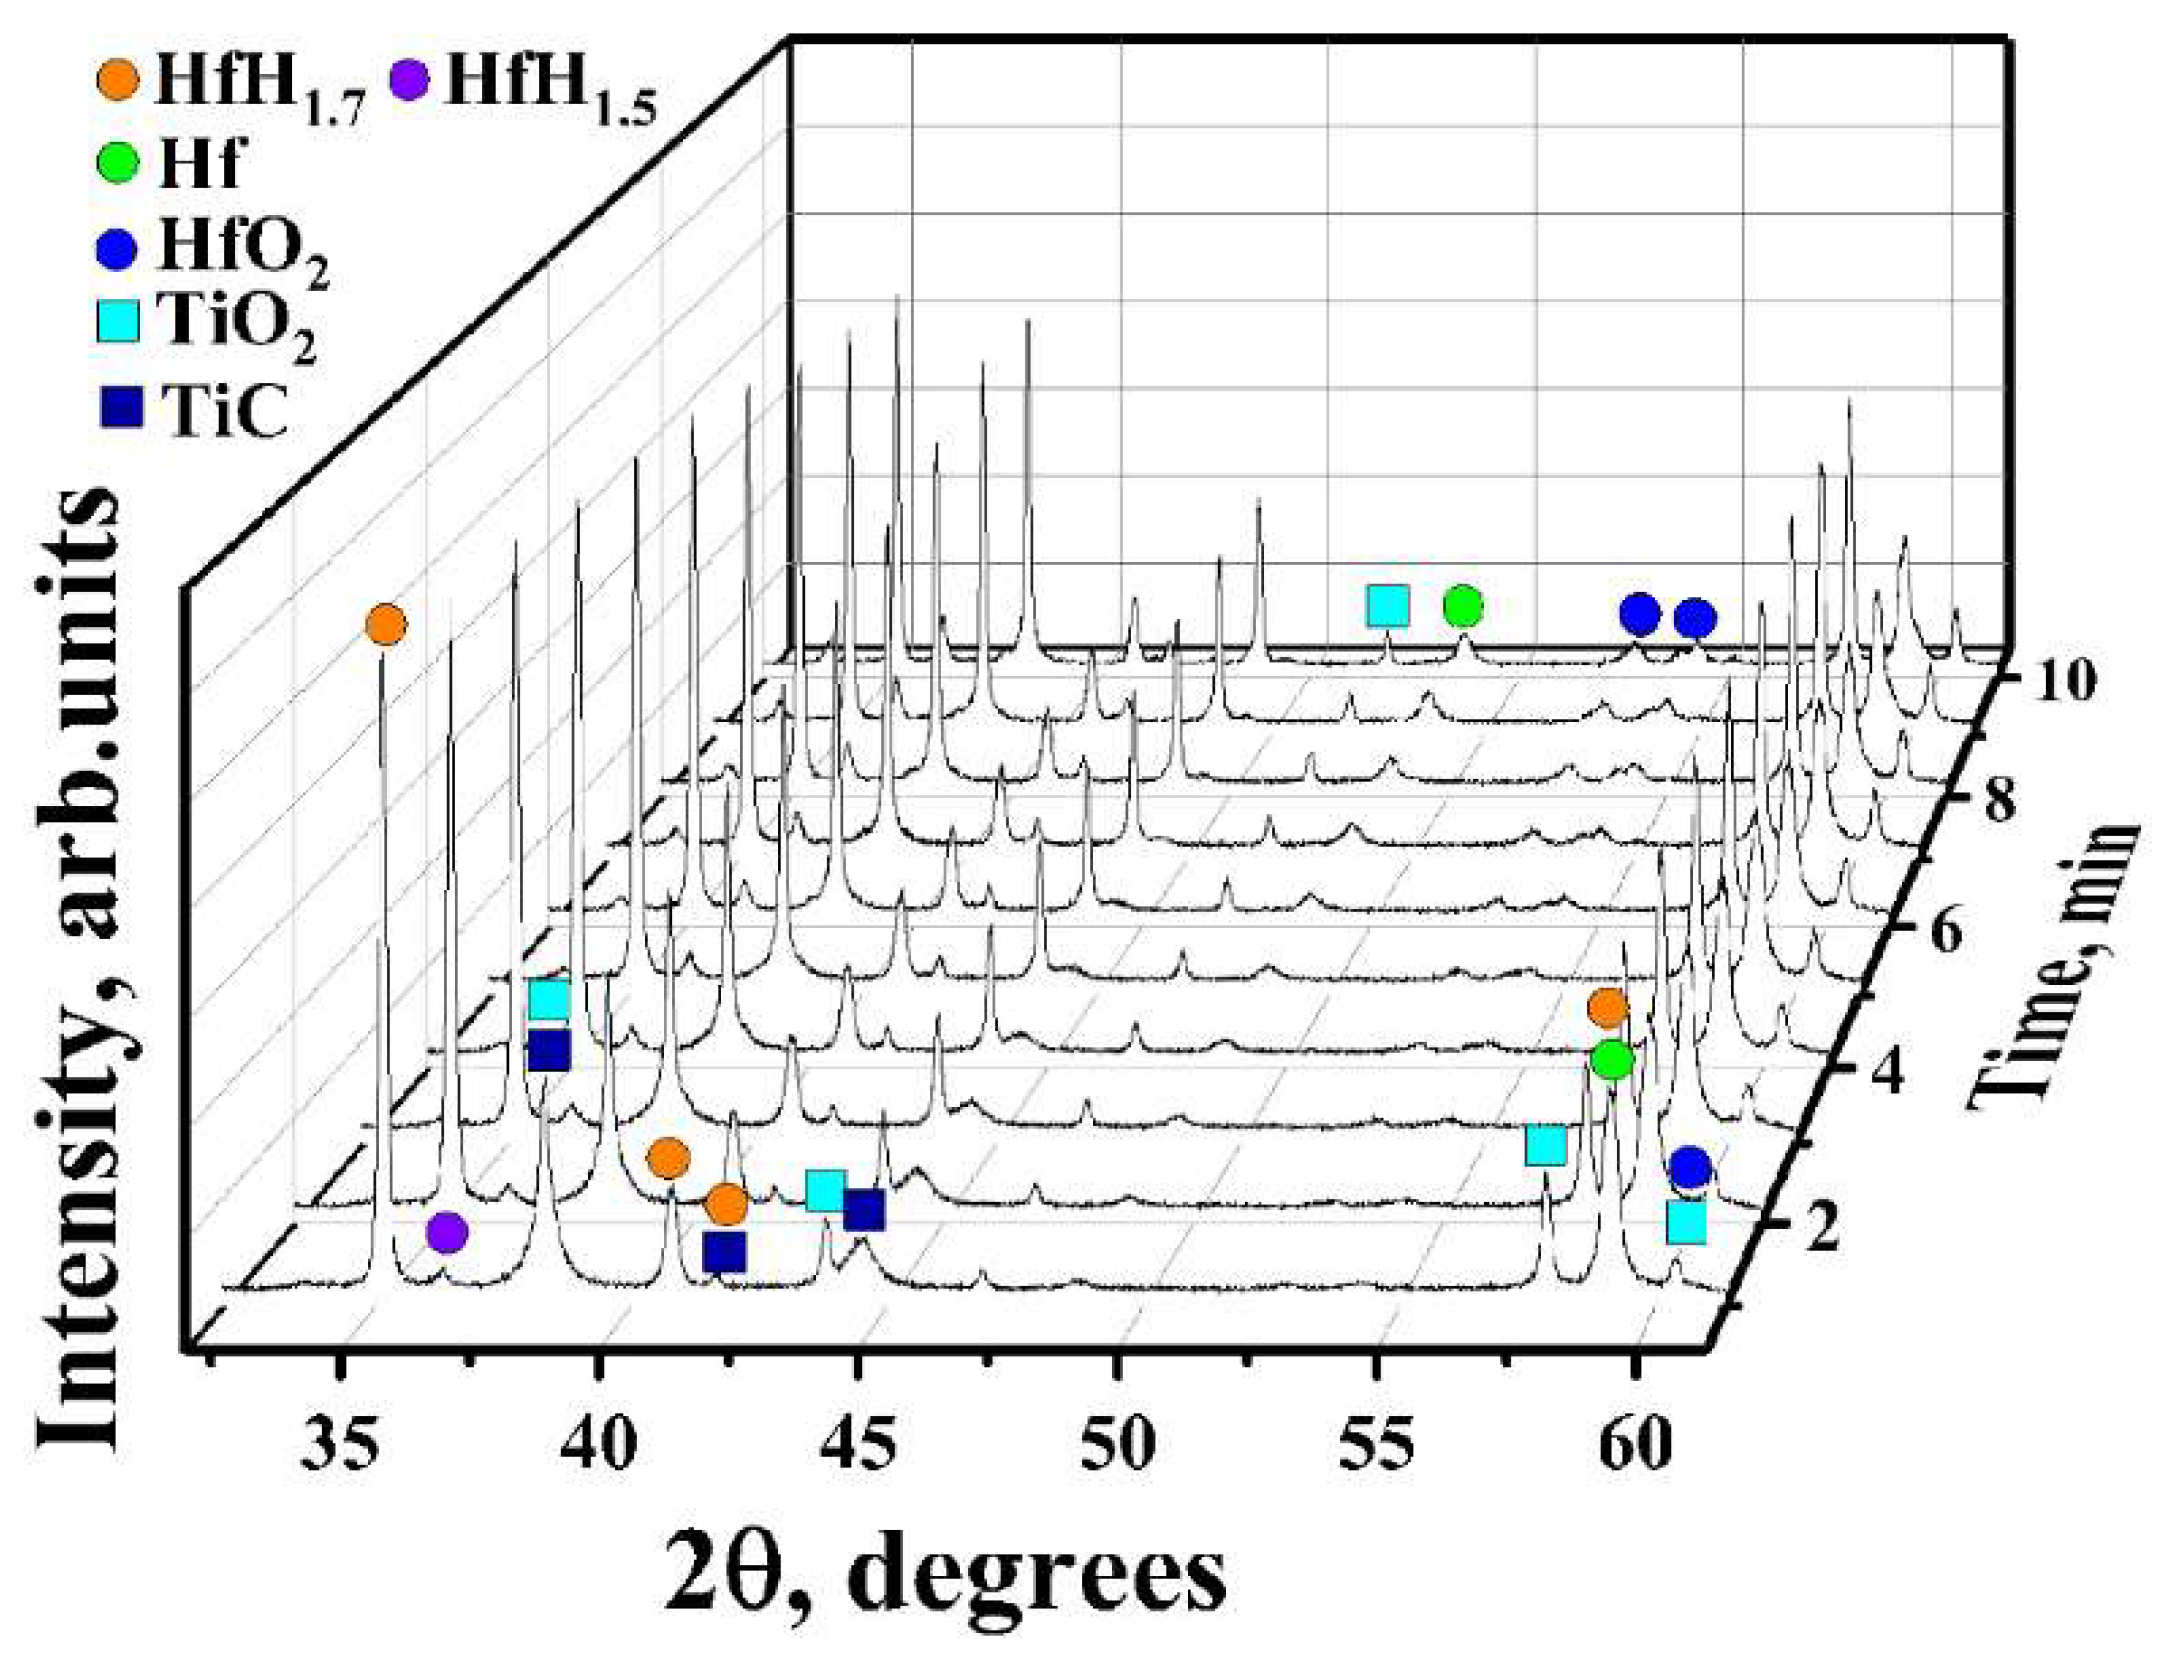
In the case of the uncoated HfHx sample, the HfH1.7 phase was decomposed to the HfH1.5 and Hf phases, followed by an intensive hydrogen release starting from 700 °C.
(2)
The formation of an outer HfO2 layer can limit hydrogen release from hafnium hydrides, but it was only observed after a significant decrease in hydrogen flow from the uncoated HfHx sample.
(3)
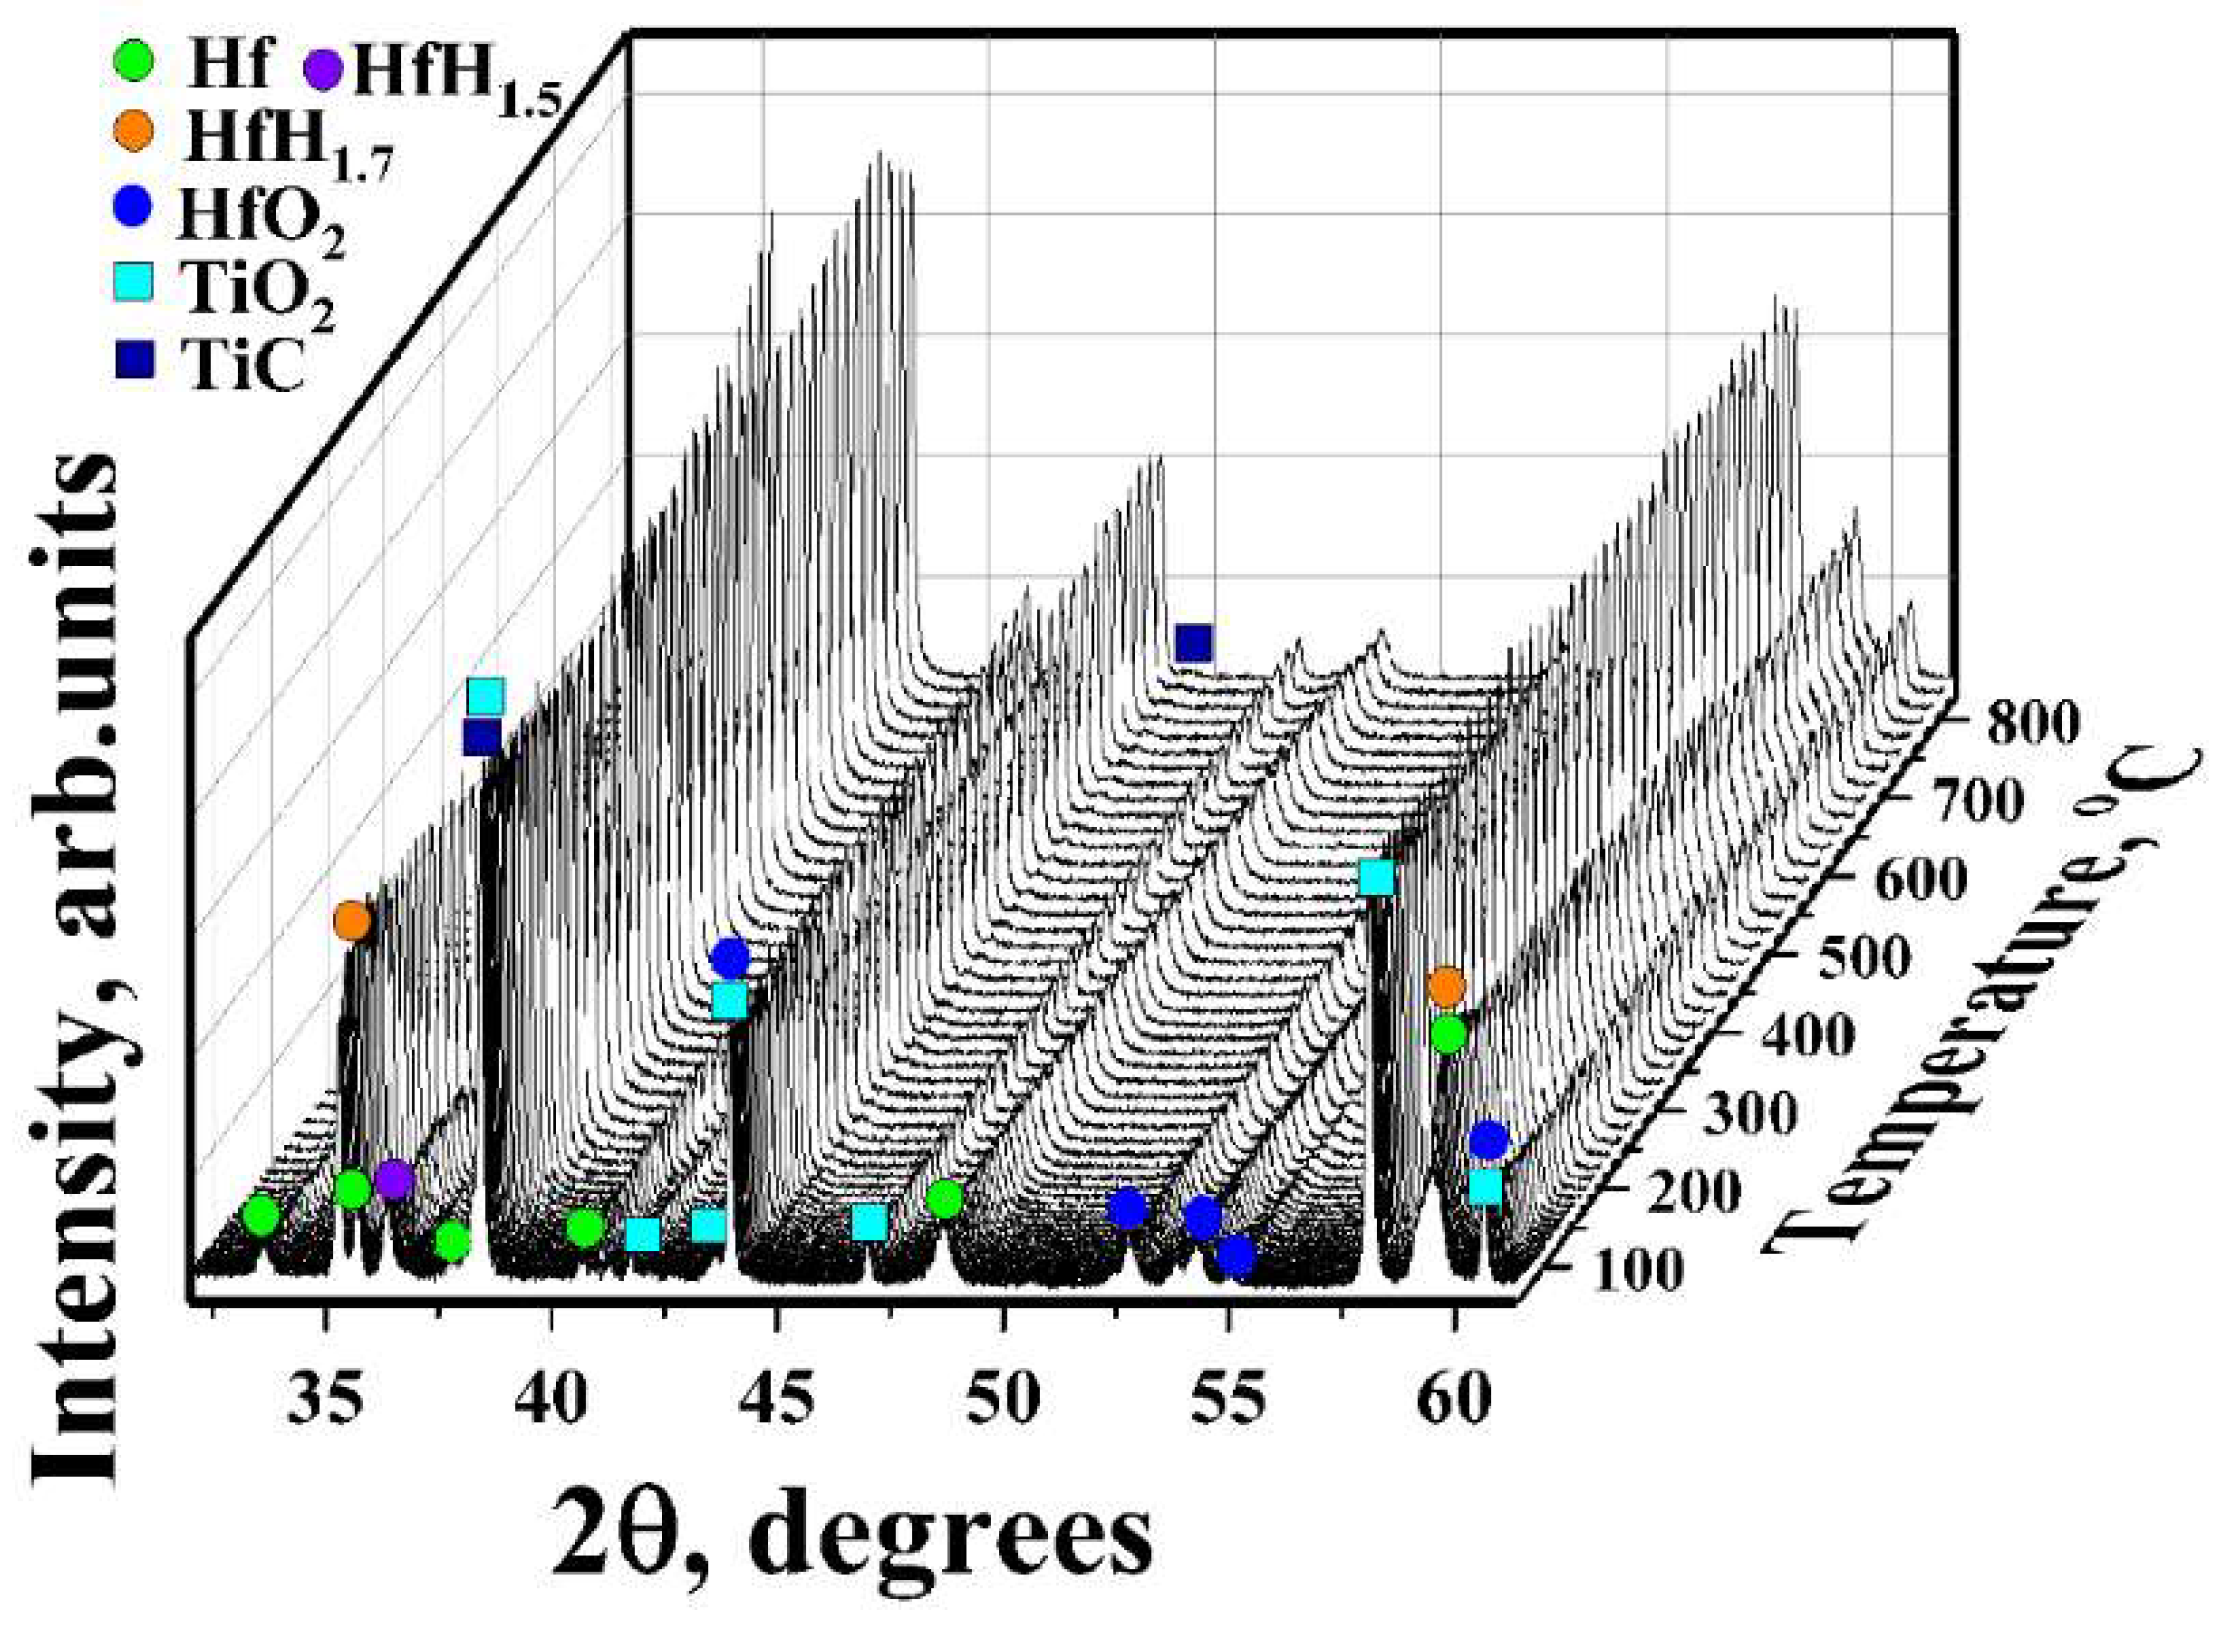
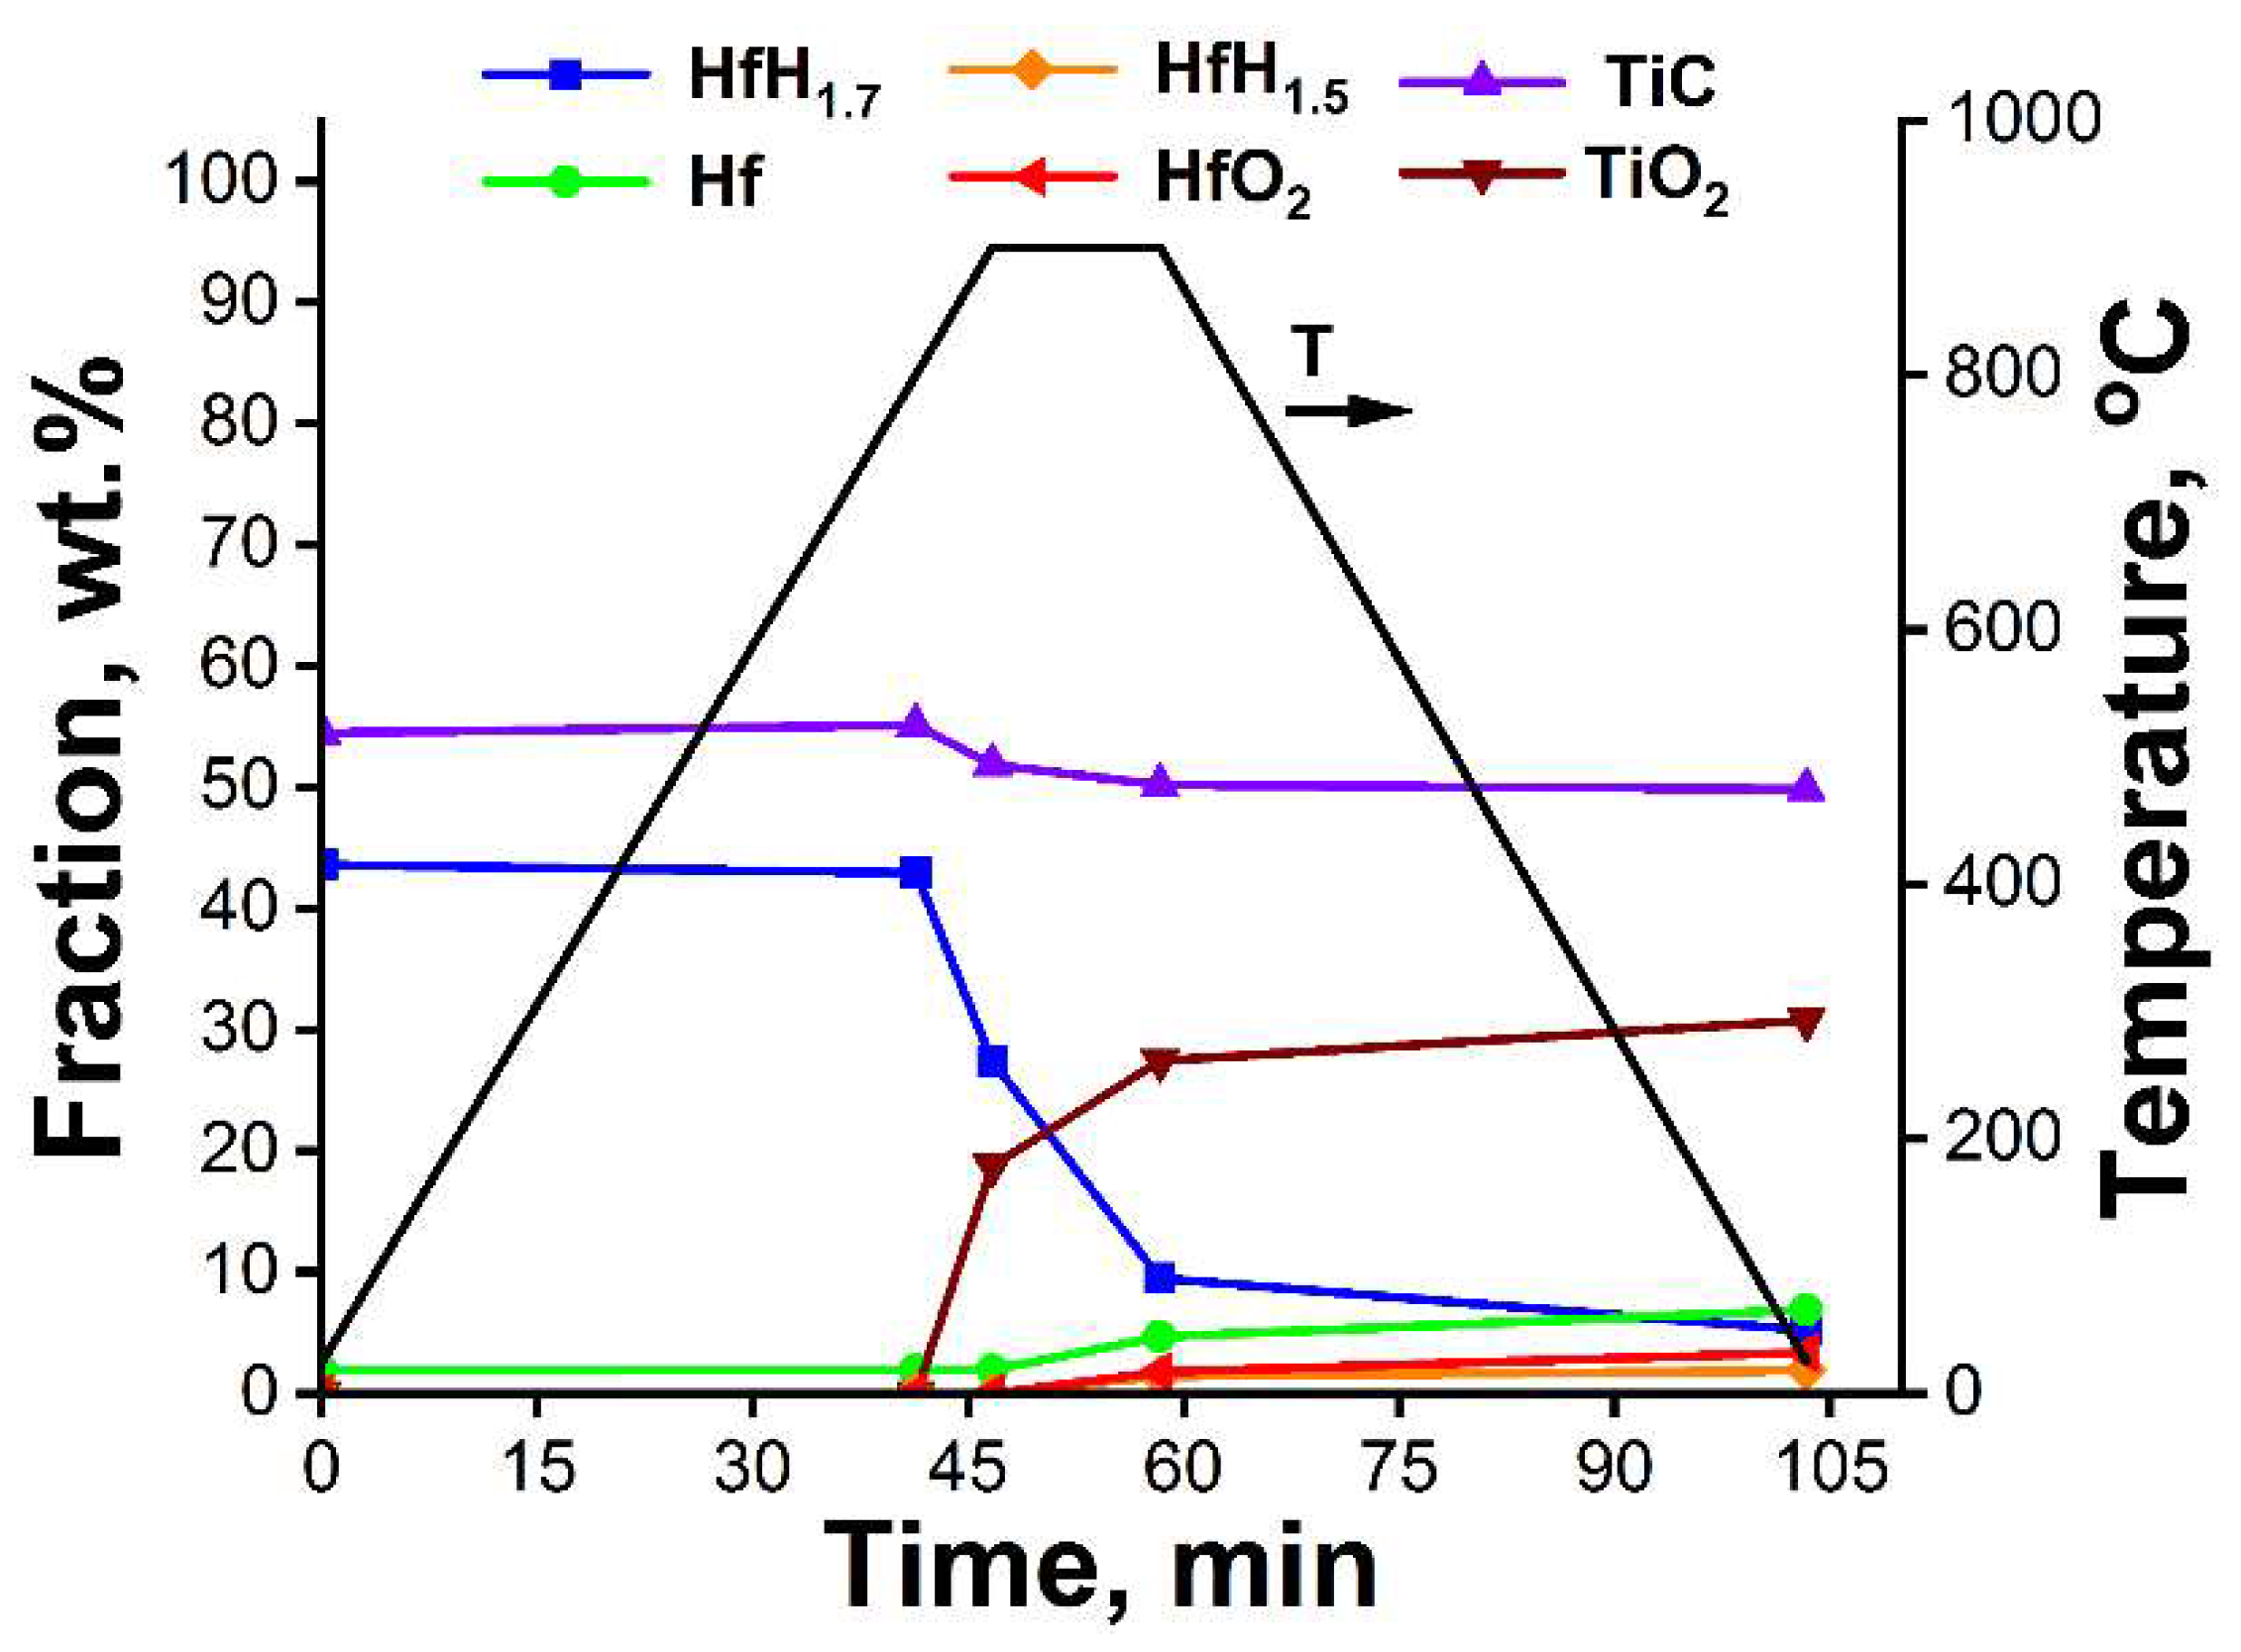
The TiC coating can be used as a protective layer for the HfHx sample at high temperatures (700 °C). However, this coating was partially oxidized into TiO2 at higher temperatures, and then, after some period, was not protective.
(4)
Due to the failure of the TiC coating, the fast hydrogen release from the TiC-coated HfHx samples was observed at 900 °C.

Author Contributions

Conceptualization, D.V.S. and M.S.S.; methodology, D.V.S. and M.S.S.; software, D.D.M.; formal analysis, A.V.P.; investigation, D.V.S., D.D.M. and M.S.S.; resources, D.D.M.; data curation, D.V.S.; writing—original draft preparation, D.V.S. and A.V.P.; writing—review and editing, D.V.S. and M.S.S.; visualization, A.V.P. and D.V.S.; supervision, D.V.S.; project administration, D.V.S. and M.S.S.; funding acquisition, D.V.S. and M.S.S. All authors have read and agreed to the published version of the manuscript.

Funding

The research was funded by Governmental Program Science (Project No. FSWW-2021-0017).

Institutional Review Board Statement

Not applicable.

Informed Consent Statement

Not applicable.

Data Availability Statement

Data are contained within the article.

Acknowledgments

The work was done at the shared research center SSTRC on the basis of the VEPP-4–VEPP-2000 complex at BINP SB RAS.

Conflicts of Interest

The authors declare no conflict of interest.

References

  1. Simeone, D.; Gosset, D.; Quirion, D.; Deschanels, X. Study of B4C microstructure evolution under neutron irradiation by X-ray diffraction profiles analysis. J. Nucl. Mater. 1999, 264, 295–308. [Google Scholar] [CrossRef]
  2. Guo, H.; Buiron, L.; Sciora, P.; Kooyman, T. Designs of control rods with strong absorption ability for small fast reactors. Nucl. Eng. Des. 2020, 368, 110799. [Google Scholar] [CrossRef]
  3. Risovany, V.D.; Zakharov, A.V. Next generation control rods for fast neutron nuclear reactors. J. Phys. Conf. Ser. 2020, 1475, 012019. [Google Scholar] [CrossRef]
  4. Konashi, K.; Iwasaki, T.; Terai, T.; Yamawaki, M.; Kurosaki, K.; Itoh, K. Development of advanced control rod of hafnium hydride for fast reactors. In Proceedings of the 2006 International Congress on Advances in Nuclear Power Plants, Reno, NV, USA, 4–8 June 2006; pp. 2213–2217. [Google Scholar]
  5. Copeland, G.L.; Donnelly, R.G.; Martin, W.R. Irradiation Behavior of Boron Carbide. Nucl. Technol. 1972, 16, 226–237. [Google Scholar] [CrossRef]
  6. Konashi, K.; Iwasaki, T.; Itoh, K.; Hirai, M.; Sato, J.; Kurosaki, K.; Suzuki, A.; Matsumura, Y.; Abe, S. Study on an innovative fast reactor utilizing hydride neutron absorber—Final report of phase I study. In Proceedings of the International Congress on Advances in Nuclear Power Plants 2010, ICAPP 2010, Anaheim, CA, USA, 8–12 June 2010; pp. 2098–2104. [Google Scholar]
  7. Risovaniy, V.D.; Zaharov, A.V.; Klochkov, E.P.; Varlashova, E.E.; Suslov, D.N.; Ponomarenko, A.B.; Scheglov, A.V. Dysprosium and hafnium base absorbers for advanced WWER control rods. In Proceedings of the Technical Committee Meeting, Control Assembly Materials for Water Reactors: Experience, Performance and Perspectives, Vienna, Austria, 12–15 October 1998; pp. 91–102. [Google Scholar]
  8. Shirayanagi, H.; Fukumoto, T.; Shiga, S. Advanced control rods for Japanese BWR Plants Proceedings, IAEA. In Proceedings of the Technical Committee Meeting on Advances in Control Rod Assembly Materials for Water Reactors, Vienna, Austria, 29 November–2 December 1993; p. 135. [Google Scholar]
  9. Iwasaki, T.; Konashi, K. Development of hydride absorber for fast reactor—Application of hafnium hydride to control rod of large fast reactor. J. Nucl. Sci. Technol. 2009, 46, 874–882. [Google Scholar] [CrossRef]
  10. Keller, H.; Shallenberger, J.; Hollein, D.; Hott, C. Development of hafnium and comparison with other pressurized water reactor control rod materials. Nucl. Technol. 1982, 59, 476–482. [Google Scholar] [CrossRef]
  11. Ikeda, K.; Moriwaki, H.; Ohkubo, Y.; Iwasaki, T.; Konashi, K. Application of hafnium hydride control rod to large sodium cooled fast breeder reactor. Nucl. Eng. Des. 2014, 278, 97–107. [Google Scholar] [CrossRef]
  12. Guilbert-Banti, S.; Viretto, A.; Barrachin, M.; Tanguy, C.; Steinbrück, M.; Stuckert, J. Hafnium oxidation at high temperature in steam. J. Nucl. Mater. 2021, 550, 152901. [Google Scholar] [CrossRef]
  13. Ito, M.; Kurosaki, K.; Muta, H.; Uno, M.; Konashi, K.; Yamanaka, S. Thermal conductivity of hafnium hydride. J. Nucl. Sci. Technol. 2009, 46, 814–818. [Google Scholar] [CrossRef]
  14. Wang, H.; Konashi, K. Investigation on electronic, mechanical and thermal properties of Hf–H system. J. Nucl. Mater. 2013, 443, 99–106. [Google Scholar] [CrossRef]
  15. Dottor, M.; Crivello, J.C.; Laversenne, L.; Joubert, J.M. Experimental determination of the H–Hf phase diagram using in situ neutron diffraction. J. Alloys Compd. 2023, 937, 168353. [Google Scholar] [CrossRef]
  16. Wetegrove, M.; Duarte, M.J.; Taube, K.; Rohloff, M.; Gopalan, H.; Scheu, C.; Dehm, G.; Kruth, A. Preventing Hydrogen Embrittlement: The Role of Barrier Coatings for the Hydrogen Economy. Hydrogen 2023, 4, 307–322. [Google Scholar] [CrossRef]
  17. Bai, H.; Kang, L.; Zhang, P.; Bai, J.; Liu, J.; Cao, B.; Xu, Y. TiC–Fe gradient coating with high hardness and interfacial adhesion strength on cast iron prepared by in-situ solid-phase diffusion method. Vacuum 2023, 215, 112336. [Google Scholar] [CrossRef]
  18. Das, A.K.; Kumar, R. Investigation on wear behaviour of TiC/Co/Y2O3 metal matrix composite coating developed on AZ91D Mg alloy by plasma transferred arc cladding process. Mater. Lett. 2024, 355, 135457. [Google Scholar] [CrossRef]
  19. Niu, F.; Bi, W.; Li, C.; Sun, X.; Ma, G.; Wu, D. TiC ceramic coating reinforced 304 stainless steel components fabricated by WAAM-LC integrated hybrid manufacturing. Surf. Coat. Technol. 2023, 465, 129635. [Google Scholar] [CrossRef]
  20. Razumov, N.; Masaylo, D.; Kovalev, M.; Volokitina, E.; Mazeeva, A.; Popovich, A. Structure and Wear Resistance of Composite TiC-NiMo Coating Produced by L-DED on Ti-6Al-4V Substrate. Metals 2023, 13, 1925. [Google Scholar] [CrossRef]
  21. Matsui, H.; Iseki, M. Fast neutron damage in TiC1−x. J. Nucl. Mater. 1988, 152, 14–20. [Google Scholar] [CrossRef]
  22. Matsui, H.; Guinan, M.W.; Iida, T.; Iseki, M. Fusion neutron irradiation of TiC. J. Nucl. Mater. 1985, 133–134, 718–721. [Google Scholar] [CrossRef]
  23. Popov, E.; Slavov, L.; Demir, E.; Abdurakhimov, B.A.; Doroshkevich, A.S.; Aliyev, O.A.; Jabarov, S.H.; Valizade, A.H.; Mauyey, B.; Horodek, P.; et al. Microstructural evolution of TiC nano powders under fast neutron irradiation: A multi-technique analysis. Vacuum 2023, 215, 112338. [Google Scholar] [CrossRef]
  24. Larhlimi, H.; Ghailane, A.; Makha, M.; Alami, J. Magnetron sputtered titanium carbide-based coatings: A review of science and technology. Vacuum 2022, 197, 110853. [Google Scholar] [CrossRef]
  25. Ito, M.; Kurosaki, K.; Muta, H.; Uno, M.; Konashi, K.; Yamanaka, S. Thermomechanical properties of hafnium hydride. J. Nucl. Sci. Technol. 2010, 47, 156–159. [Google Scholar] [CrossRef]
  26. Grudinin, V.A. Hot target magnetron sputtering enhanced by RF-ICP source: Microstructure and functional properties of CrNx coatings. Vacuum 2022, 200, 111020. [Google Scholar] [CrossRef]
  27. Zhou, X.; Liu, D.; Bu, H.; Deng, L.; Liu, H.; Yuan, P.; Du, P.; Song, H. XRD-based quantitative analysis of clay minerals using reference intensity ratios, mineral intensity factors, Rietveld, and full pattern summation methods: A critical review. Solid Earth Sci. 2018, 3, 16–29. [Google Scholar] [CrossRef]
  28. Mintz, M.H. Hafnium-hydrogen. Solid State Phenom. 1996, 49, 331–356. [Google Scholar] [CrossRef]
  29. Syrtanov, M.; Garanin, G.; Kashkarov, E.; Pushilina, N.; Kudiiarov, V.; Murashkina, T. Laboratory X-ray diffraction complex for in situ investigations of structural phase evolution of materials under gaseous atmosphere. Metals 2020, 10, 447. [Google Scholar] [CrossRef]
  30. Syrtanov, M.; Kudiiarov, V.; Kashkarov, E.; Shmakov, A.; Vinokurov, Z.; Babikhina, M.; Zolotarev, K.V. Application of synchrotron radiation for In Situ XRD investigation of zirconium hydrides formation at gas-phase hydrogenation. Phys. Procedia 2016, 84, 342–348. [Google Scholar] [CrossRef]
  31. Ohtsu, N.; Tsuchiya, B.; Oku, M.; Shikama, T.; Wagatsuma, K. X-ray photoelectron spectroscopic study on initial oxidation of hafnium hydride fractured in an ultra-high vacuum. Appl. Surf. Sci. 2007, 253, 6844–6847. [Google Scholar] [CrossRef]
  32. Gavarini, S.; Bes, R.; Millard-Pinard, N.; Cardinal, S.; Peaucelle, C.; Perrat-Mabilon, A.; Garnier, V.; Gaillard, C. A comparative study of TiN and TiC: Oxidation resistance and retention of xenon at high temperature and under degraded vacuum. J. Appl. Phys. 2011, 109, 014906. [Google Scholar] [CrossRef]
  33. Shimada, S.; Kozeki, M. Oxidation of TiC at low temperatures. J. Mater. Sci. 1992, 27, 1869–1875. [Google Scholar] [CrossRef]
  34. Cho, S.; Jo, I.; Kim, H.; Kwon, H.T.; Lee, S.K.; Lee, S.B. Effect of TiC addition on surface oxidation behavior of SKD11 tool steel composites. Appl. Surf. Sci. 2017, 415, 155–160. [Google Scholar] [CrossRef]
  35. Naito, S.; Yamamoto, M.; Hashino, T. Solubility and diffusivity of hydrogen and deuterium in alpha-hafnium at high temperatures. J. Phys. Condens. Matter 1990, 2, 1963. [Google Scholar] [CrossRef]
Figure 1. SEM image of cross-section microstructure of TiC coating on Si substrate (a) and X-ray diffraction pattern of the TiC coating on the HfHx sample (b). The sign (*) means the position of the EDS measurement.
Coatings 13 02053 g001
Figure 2. X-ray diffraction patterns of the uncoated HfHx sample during the heating stage (from 30 to 900 °C).
Coatings 13 02053 g002
Figure 3. X-ray diffraction patterns of the uncoated HfHx sample during the isothermal treatment at 900 °C.
Coatings 13 02053 g003
Figure 4. X-ray diffraction patterns of the uncoated HfHx sample during the cooling stage from 900 to 30 °C.
Coatings 13 02053 g004
Figure 5. The phase composition of the uncoated HfHx sample during the in situ XRD measurements with Tmax of 900 °C. The lines of fraction are drawn to show dependencies more clearly.
Coatings 13 02053 g005
Figure 6. Concentrations of gases in the vacuum chamber during the in situ XRD measurements with the uncoated HfHx sample and Tmax of (a) 700 and (b) 900 °C.
Coatings 13 02053 g006
Figure 7. X-ray diffraction patterns of the TiC-coated HfHx sample during the heating stage from 30 to 900 °C.
Coatings 13 02053 g007
Figure 8. X-ray diffraction patterns of the TiC-coated HfHx sample during the isothermal stage (at 900 °C).
Coatings 13 02053 g008
Figure 9. X-ray diffraction patterns of the TiC-coated HfHx sample during the cooling stage from 900 to 30 °C.
Coatings 13 02053 g009
Figure 10. The phase composition of the TiC-coated HfHx sample during the in situ XRD measurements with Tmax of 900 °C. The lines of fraction are drawn to show dependencies more clearly.
Coatings 13 02053 g010
Figure 11. Concentrations of gases in the vacuum chamber during the in situ XRD measurements with the TiC-coated HfHx sample and Tmax of (a) 700 and (b) 900 °C.
Coatings 13 02053 g011
Table 1. The deposition parameters for the TiC coating.
QTi, W/cm2QC, W/cm2t, hh, µmUb, Vjs, mA/cm2Tmax, °C
15.723.62.51.2 ± 0.1−5010253
Note: QTi—power density for Ti target sputtering; QC—power density for C target sputtering; t—deposition time; h—coating thickness; Ub—substrate bias potential; js—averaged ion current density on a substrate; Tmax—maximal substrate temperature.
Disclaimer/Publisher’s Note: The statements, opinions and data contained in all publications are solely those of the individual author(s) and contributor(s) and not of MDPI and/or the editor(s). MDPI and/or the editor(s) disclaim responsibility for any injury to people or property resulting from any ideas, methods, instructions or products referred to in the content.

