Abstract
Calibration is one of the most important factors affecting the measurement accuracy of X-ray energy/wavelength-dispersive spectrometers (EDS/WDSs). In this work, three Cu content reference materials used in AlCu films for X-ray EDS/WDS calibration are prepared using magnetron sputtering deposition. The Cu content standard values of the three reference materials are determined using an inductively coupled plasma optical emission spectrometer (ICP-OES) and the uncertainties of the reference materials are evaluated. The results show that the homogeneity and stability of the three Cu content reference materials used in AlCu films meet the requirements. The Cu content standard values of the three reference materials are 2.56%, 14.64%, and 49.46% (mass fraction), respectively. Their extended uncertainties are 0.14%, 0.42%, and 0.98% (k = 2), respectively. Using quantitative analysis, it was determined that the three developed reference materials meet the calibration requirements of X-ray EDS/WDS, thus guaranteeing the accuracy and consistency of the measurement results.
1. Introduction
Characteristic X-rays of the contained elements in a material sample can be obtained by bombarding the sample with a high-energy electron beam. The characteristic X-ray of each element has characteristic energy and characteristic wavelength. After the characteristic energy or wavelength of an element has been mapped into a spectrum, it is compared with the standard spectrum position of the element, and then the species of the element can be determined. The characteristic X-ray intensity of an element is proportional to the content of the element in the sample. The content of the element can be determined by comparing the characteristic X-ray intensity of the element with the theoretical intensity or the measured standard intensity of the pure sample of the element.
There are two kinds of spectral spreading methods for characteristic X-rays: X-ray energy dispersion spectroscopy, where the corresponding instrument is called an X-ray energy dispersion spectrometer, and X-ray wavelength dispersion spectrometry, where the corresponding instrument is called an X-ray wavelength dispersion spectrometer.
X-ray EDS is usually installed in a scanning electron microscope (SEM), transmission electron microscope (TEM), or electron probe micro-analyzer (EPMA). At the same time, X-ray WDS is mainly installed in an EPMA. X-ray EDS and WDS have extensive and important applications in materials, metallurgy, minerals, geology, biomedicine, energy, environment, and other fields [1,2,3,4]. There are three main kinds of factors affecting the accuracy of element content measurement using X-ray EDS/WDS. The first is the sample condition: the type and content of elements in the sample, the average atomic number of the sample, surface roughness, conductivity, etc. The second is the testing parameters: acceleration voltage, the diameter of the electron beam spot, the incident angle of the electron beam, the collection angle of the detector, collection time, etc. The third is the instrument calibration: quantitative calculation correction factor, standard value, and uncertainty of reference materials. The accuracy of the quantitative analysis results of X-ray EDS/WDS is closely related to reference materials and instrument calibration [5,6,7]. It is necessary to ensure that the equipment has been calibrated using element content reference materials before testing the element content of a sample.
At present, element content and energy resolution standard samples/reference materials for X-ray EDS/WDS calibration have been developed by some research institutions and commercial companies all over the world. However, they are far from meeting the calibration requirements of X-ray EDS/WDS. The element content reference materials for X-ray EDS/WDS calibration have always been the research focus of metrology institutions worldwide [8,9,10]. The National Institute of Standards and Technology (NIST) developed reference materials of Ti, Al, Nb, W, Zn, Cu, and Ni with high amounts of content. The standard values of these reference materials are mainly determined using spectroscopic and mass spectrometry. Their forms are mainly granular, needle-like, and rod-like. However, reference materials with these forms cannot be directly used for X-ray EDS/WDS calibration because the curved surface or a surface with a large roughness can change the measurement results of the element content. Therefore, it is necessary to process these reference materials with a focused ion beam or argon ion beam into flat samples with low roughness before they are used to calibrate X-ray EDS/WDS. However, the differences in element measurement results at different locations determined by X-ray EDS/WDS are great because these reference materials have coarse grains, significant component segregation, and poor element uniformity at the micro/nanoscale. Therefore, these reference materials are not the best for X-ray EDS/WDS calibration. The Bundesanstalt für Materialforschung und -prüfung (BAM) has developed some element content reference materials in the forms of solution and powder, which are suitable for calibrating spectroscopic and mass spectroscopic instruments. The BAM has also developed a characteristic energy reference material for calibrating the energy resolution and X-ray count ratio of X-ray EDS/WDS. Ted Pella Incorporation has developed some standard samples with planar block morphologies for X-ray EDS/WDS calibration. However, most of these standard samples are pure substance or pure phase. At the same time, reference materials with different contents of a single element are necessary for X-ray EDS/WDS calibration. In addition, the standard values of some standard samples have no uncertainties and their traceability is unclear. Currently, there are no element content reference materials for X-ray EDS/WDS calibration in China.
The composition measurement of the nano region in the range of a few nanometers to a few hundred nanometers is mainly implemented using X-ray EDS and an electron energy loss spectrometer (EELS) equipped with a transmission electron microscope (TEM) [11,12,13]. Reference materials used for the calibration of X-ray EDS and EELS of TEM must have the following characteristics: (1) their microstructures are stable and do not decompose under high-energy electron beam bombardment; (2) the homogeneity of element content in the reference material meets the requirements of being within the range of a few nanometers to several hundred nanometers. Developing this kind of reference material is very difficult and extremely rare worldwide.
With the fast development of increasing applications of X-ray EDS/WDS in metals, semiconductors, integrated circuits, biomedicine, and other fields, the accuracy requirement of element content measurement in these fields has become increasingly high. Currently, the number of X-ray EDS/WDS equipped in SEM and EPMA exceeds 5000 in China and is growing at a rate of more than 200 per year. As a result, the calibration demand for X-ray EDS/WDS is increasing rapidly. The development of accurate and reliable reference materials for X-ray EDS/WDS calibration can guarantee the accuracy of element content measurement of X-ray EDS/WDS and better support the application of these instruments.
2. Experiments
In this work, three AlCu films with different Cu contents were prepared using a single-cavity 1008C sputtering deposition system. AlCu alloy targets with nominal Cu contents of 2.5%, 14.5%, and 49.5% were ordered from a commercial company and were prepared via vacuum melting. The surface of the single-crystal silicon substrate was cleaned to remove contaminants. The cleaned silicon wafer was pre-cut using a chip-cutting machine to obtain tiny squares with a length and width of 3 mm. However, these small squares were still connected because their cutting depth was 60% of the wafer thickness.
After the background pressure of the sputtering deposition system was pumped to exceed 3 × 10⁻⁸ Torr, the targets were pre-sputtered for 30 min to remove the oxide layers on the target surface and ensure the purity and performance of the deposited AlCu films [14,15,16]. AlCu films were then deposited for 400 min at 5 mTorr sputtering pressure. The argon flux was set at 20 sccm and the sputter power was 800 W. The substrates were maintained at about 20 °C using cooling water during the deposition.
In addition to placing the pre-cut silicon wafer on the metal substrate plate of the magnetron sputtering system, several small stainless steel sheets coated with paraffin were glued to the metal substrate plate. After preparing the AlCu films, the stainless steel sheets were removed from the metal substrate plate and put into a clean plastic tube, which was then filled with acetone and soaked for 24 h. After the AlCu films and the stainless steel sheets were separated, the AlCu films were cleaned again with acetone and ethanol. Finally, the solvent in the plastic tube was poured out, and the AlCu films were put in an oven for drying. The preparation process of AlCu films is displayed in Figure 1.
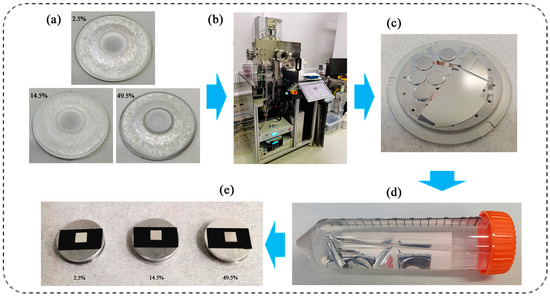
Figure 1.
Preparation process of AlCu films: (a) AlCu alloy targets; (b) sputtering deposition equipment; (c) AlCu films grown on substrates; (d) separated AlCu films; and (e) final Cu content reference materials for use in AlCu films.
The surface topography and roughness of AlCu films were measured using a Multimode 8-HR atomic force microscope (AFM) equipped with a Rtespa-150 cantilever. The surface morphology and cross-sectional thickness of AlCu films were observed using an Ultra 55 SEM. The homogeneity and stability of Cu content in the AlCu films were investigated using a JXA-8230 EPMA. The Cu contents of the AlCu films were determined using ICP-OES in eight independent laboratories.
3. Results and Discussion
3.1. Surface Analysis of Reference Material Candidates
The surface morphology and cross-sectional thickness of three AlCu films with nominal Cu contents of 2.5%, 14.5%, and 49.5% were observed using SEM. As shown in Figure 2, the surfaces of the three AlCu films are very clean and free of defects and impurities, and the grains are small and homogeneous. The grain diameters of the AlCu films with nominal Cu contents of 2.5%, 14.5%, and 49.5% are within the range of 80–400 nm, 80–500 nm, and 20–100 nm, respectively. Their thicknesses are, respectively, 3.8 μm, 4.7 μm, and 3.6 μm. The surface three-dimensional morphologies of the AlCu films within an area of 10 μm × 10 μm measured using AFM are shown in Figure 3. The calculated surface arithmetic mean roughnesses (Ra) of the three AlCu films are 17.6 nm, 9.86 nm, and 15.4 nm, respectively. The calculated surface root-mean-square roughnesses (Rq) are 24.9 nm, 12.1 nm, and 20.2 nm, respectively. The surface morphology and roughness of three AlCu films conform to the requirements of GB/T 4930-2021 [17].
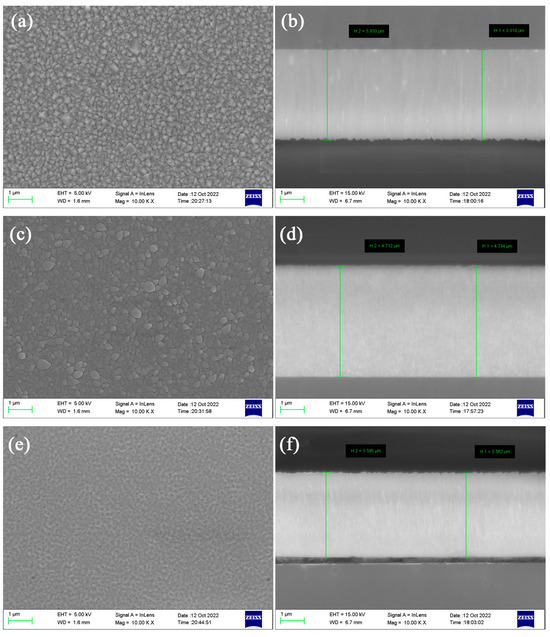
Figure 2.
SEM images of three AlCu films: (a,b) nominal 2.5%; (c,d) nominal 14.5%; and (e,f) nominal 49.5%.
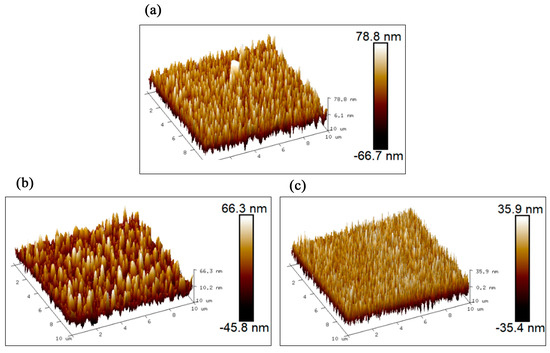
Figure 3.
AFM images of three AlCu films: (a) nominal 2.5%; (b) nominal 14.5%; and (c) nominal 49.5%.
3.2. Homogeneity Investigation of Reference Material Candidates
3.2.1. Macroscopic Homogeneity Investigation of the Cu Contents of AlCu Films
The macroscopic homogeneity of the Cu contents of the three AlCu films with nominal Cu contents of 2.5%, 14.5%, and 49.5% were investigated according to the guidance of JJF 1006-1994 [18]. Based on the degree of freedom (ν1, ν2) and the measured data, the actual distribution variable F can be calculated. Meanwhile, if the ν1, ν2 and the significance level α are given, the critical value of F (Fα) can be determined using the distribution table of F critical value. If F < Fα, there is no significant difference between measurement groups and within measurement groups, and the sample is homogeneous.
The macroscopic homogeneity of the Cu contents of AlCu films was investigated using the JXA-8230 EPMA. For each of the three AlCu films with nominal Cu contents of 2.5%, 14.5%, and 49.5%, m = 20 samples were randomly selected from 60 samples, and n = 3 measurement positions were chosen in the middle of each sample. The minimum distance between the three positions is 500 μm. The measuring position diagram of the macroscopic homogeneity investigation of Cu content is shown in Figure 4. The macroscopic homogeneity of the Cu contents of the three AlCu films was evaluated using the F-test method mentioned above. There are a lot of data on macroscopic homogeneity investigation; these data are provided in the Supplementary Materials. The uncertainties uh-mac introduced by the macroscopic homogeneity of the Cu contents of the three AlCu films with nominal values of 2.5%, 14.5%, and 49.5% are 0.021%, 0.054%, and 0.196%, respectively.
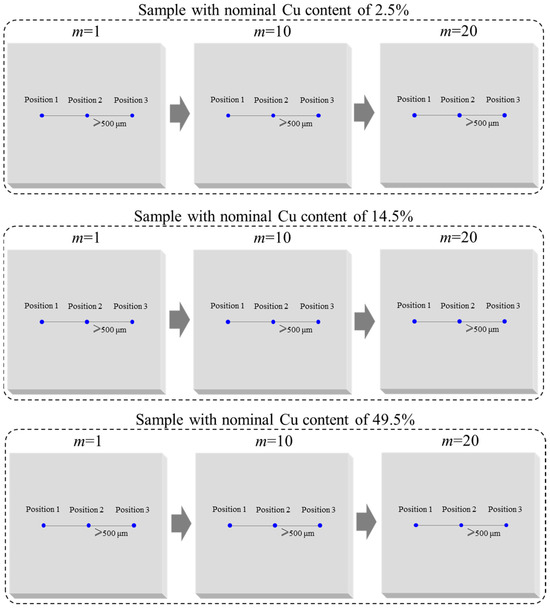
Figure 4.
Measuring scheme of macroscopic homogeneity of the Cu contents of AlCu films.
3.2.2. Microscopic Homogeneity Investigation of the Cu Contents of AlCu Films
The spatial resolution of EPMA for element analysis is related to the acceleration voltage, the sample density, and the diameter of the electron beam spot. The diameter of the electron beam spot of EPMA is 10~100 nm. The diameter of the X-ray excitation sphere of the electron beam in the AlCu films is 0.5–1 μm when the acceleration voltage is 15 kV. According to the guidance of GB/T 4930-2021, the measuring position diagram of the microscopic homogeneity investigation of Cu content was designed and is shown in Figure 5. Three horizontal positions and thirteen rows of positions are designed with intervals of approximately 500 nm. The microscopic homogeneity of the Cu contents of the three AlCu films was also evaluated based on the F-test method. The uncertainties uh-mic introduced by the microscopic homogeneity of the Cu contents of the three AlCu films with nominal values of 2.5%, 14.5%, and 49.5% are 0.005%, 0.026%, and 0.124%, respectively.
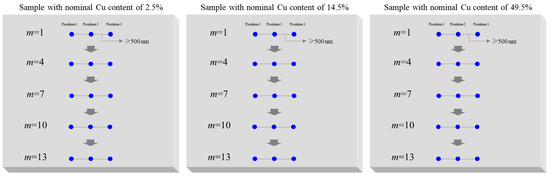
Figure 5.
Measuring scheme of microscopic homogeneity of the Cu contents of AlCu films.
3.3. Stability Investigation of Reference Material Candidates
3.3.1. Long-Term Stability Investigation of AlCu Films
The stability of reference material refers to the ability of the reference material to be preserved under certain environmental conditions and its characteristic quantity to remain unchanged for a certain period of time. Trend analysis is used to evaluate the stability of reference material in ISO Guide 35: 2006 [19]. A linear equation model is used to study the stability of the characteristic quantity, where b1 is the slope of the linear equation, s(b1) is the uncertainty of the slope, and t(0.95, n-2) is the t-distribution factor when the degree of freedom is n-2 and the confidence level p = 95%. Compare |b1| with t(0.95, n-2). If |b1| < t(0.95, n-2)·s(b1), the slope is not significant, and the characteristic quantity is stable. The equations used in the calculation process are detailed in ISO Guide 35: 2006.
Within one year, on 11 August 2021 (0-month interval), 9 November 2021 (3-month interval), 15 February 2022 (6-month interval), 13 May 2022 (9-month interval), and 10 August 2022 (12-month interval), EPMA was used to study the long-term stability of the Cu contents of AlCu films. Long-term stability of the Cu contents of the three AlCu films with nominal values of 2.5%, 14.5%, and 49.5% was investigated at a magnification of 2000, an acceleration voltage of 15 kV, and a working distance of 11 mm. Measurements were repeated three times for each sample at each time point. Long-term stability data are provided in the Supplementary Materials. The uncertainties us-l introduced by the long-term stability of the Cu contents of the AlCu films with nominal values of 2.5%, 14.5%, and 49.5% are 0.030%, 0.158%, and 0.250%, respectively. The Cu contents of the three AlCu films were determined to be stable within one year.
3.3.2. Short-Term Stability Investigation of AlCu Films
Short-term stability investigation is usually conducted at different temperatures to examine the effects of transport and environmental factors on the characteristic quantity of reference material. In this work, the reference material candidates are stored at room temperature and transported conventionally. Depending on the time required for the reference materials to be mailed to the customer, the short-term stability investigation takes 5–7 days. The maximum ambient temperature during the reference material mailing process does not exceed 50 °C, so the storage temperature of the samples during the short-term stability investigation is 50 °C. A sample was taken from each AlCu film and placed in an incubator at 50 °C. The sample was taken on day 1, day 3, and day 7, and the Cu contents in the middle of the sample were measured using EPMA. The Cu content measurement was repeated three times in the middle of the sample. The standard deviation of nine pieces of data was considered the uncertainty introduced by short-term stability. The short-term stability data are given in the Supplementary Materials. The uncertainties us-s introduced by the short-term stability of the Cu contents of the three AlCu films with nominal values of 2.5%, 14.5%, and 49.5% are 0.01%, 0.03%, and 0.09%, respectively.
3.4. Cu Content Determination of AlCu Films
3.4.1. Determination Method and Traceability
ICP-OES is an instrument used to determine the chemical composition of a substance based on the spectrum of atomic emission [20]. In China, the standard solution of Cu (GBW08615) has a Cu element concentration of 1000 μg/mL and an expanded uncertainty of 1 μg/mL (k = 2). The traceability of Cu contents of AlCu films is ensured using preparation, measurement methods, and measuring instruments that meet the requirements of metrological characteristics. First, a series of standard solutions with different Cu concentrations were prepared using GBW08615. ICP-OES was then used to measure standard solutions and a standard curve was obtained. The atomic emission spectrums of three AlCu films separated from the stainless steel sheets were obtained using ICP-OES and the Cu contents were calculated according to the standard curve. Figure 6 illustrates the traceability of the three Cu content reference materials used in AlCu films.
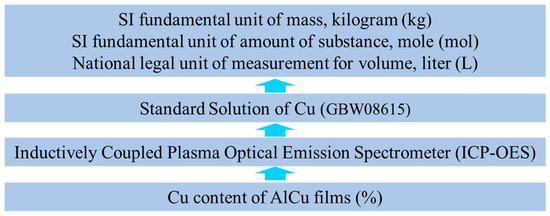
Figure 6.
Traceability of three Cu content reference materials used in AlCu films.
The weights of three AlCu films were, respectively, weighed using a 1/100,000 electronic balance. Their weights were 18.98 mg, 26.37 mg, and 31.00 mg, respectively. The AlCu films were then dissolved in hydrochloric and nitric acids and the beaker containing the solution was heated on a heating table to expel the nitrogen oxide gas. After the AlCu films were completely dissolved, the AlCu solution samples with initial Cu contents of 2.5% and 14.5% were diluted with deionized water to 500 mL in two volumetric flasks, and the AlCu solution sample with an initial Cu content of 49.5% was diluted with deionized water to 1000 mL in a volumetric flask. The diluted solutions were shaken to be measured. GBW08615 was used to prepare eight Cu standard solution samples with different concentrations; then, ICP-OES was used to test the eight solution samples, and thus the standard curve was obtained. ICP-OES was subsequently used to measure the Cu contents of the three AlCu solution samples and the measurement was repeated six times for each AlCu solution sample.
The ICP-OES measurement parameters of the Cu concentration standard solutions and that of three AlCu solutions are the same. The three AlCu solutions were measured in eight independent laboratories. The measurement results are shown in Table 1, Table 2 and Table 3.

Table 1.
ICP-OES results of AlCu film reference material with a nominal Cu content of 2.5%.
Table 2.
ICP-OES results of AlCu film reference material with a nominal Cu content of 14.5%.
Table 3.
ICP-OES results of AlCu film reference material with a nominal Cu content of 49.5%.
3.4.2. Uncertainty Evaluation of Cu Content Determination
- The mathematical model
- b.
- The main sources of uncertainties
(1) The uncertainty induced by the electronic balance (um)
The uncertainty of measuring the mass of AlCu film using a 1/100,000 electronic balance is derived from the indicating error and the maximum allowable deviation. The resolution of the 1/100,000 electronic balance is 0.01 mg and its half-width resolution is 0.005 mg. According to the uniform distribution calculation, the standard uncertainty introduced by the indicating error is um−1 = 0.005/ mg. The calibration certificate of the electronic balance shows that it has a maximum allowable deviation of 0.05 mg. According to the uniform distribution calculation, the standard uncertainty introduced by the maximum allowable deviation is um−2 = 0.05/ mg. Two uncertainty components are independent and unrelated. The standard uncertainty induced by the electronic balance is:
(2) The uncertainty induced by the dilution of the AlCu solution sample (uV-sample)
The calibration certificate of the volumetric flasks shows that the maximum allowable deviation of a 500 mL volumetric flask is ±0.25 mL, and the maximum allowable deviation of a 1000 mL volumetric flask is ±0.40 mL. According to the uniform distribution calculation, the standard uncertainties introduced by the dilution volume are uV − vf = 0.25/ mL and 40/mL for 500 mL and 1000 mL, respectively.
The volumetric flasks were calibrated at 20 °C, and the temperature variations within the laboratories were ±2 °C. The volume expansion of the liquid is significantly greater than the volume expansion of the volumetric flasks; therefore, only the volume change in the solution needs to be considered. The volume expansion coefficient of water is 2.1 × 10⁻⁴/°C; therefore, the volume change in a 500 mL aqueous solution is ±(500 × 2 × 2.1 × 10−4) mL = ±0.21 mL and the volume change in a 1000 mL aqueous solution is ±(1000 × 2 × 2.1 × 10−4) mL = ±0.42 mL. Assuming a uniform distribution of temperature change, the standard uncertainties introduced by the volume changes in aqueous solutions are uV-water = 0.21/mL and 0.42/mL for 500 mL and 1000 mL, respectively.
The uncertainty induced by the dilution of the AlCu solution sample is calculated by:
(3) The uncertainty induced by the calibration process of ICP-OES using GBW08615 (uCRM-cal)
The uncertainty introduced by the calibration process of ICP-OES using GBW08615 consists of the dilution of GBW08615 (uCRM-dilution) and the fitting of the standard curve (ucurve). Furthermore, the uncertainty introduced by the dilution of GBW08615 mainly consists of CRM, pipette, and the dilution volume of CRM.
GBW08615 has a Cu element concentration of 1000 μg/mL and an expanded uncertainty of 1 μg/mL (k = 2). The standard uncertainty introduced by GBW08615 is uCRM = (0.5 μg/mL)/(1000 μg/mL) = 0.05%.
The GBW08615 standard solutions of 0 mL, 0.02 mL, 0.05 mL, 0.10 mL, 0.20 mL, and 0.50 mL were, respectively, transferred to six 100 mL volumetric flasks using a 1 mL pipette. Subsequently, the GBW08615 standard solutions of 1 mL and 2 mL were, respectively, transferred to two 100 mL volumetric flasks using a 5 mL pipette. According to the verification certificate, the expanding uncertainty of both 1 mL and 5 mL pipettes is 0.01 mL (k = 2). Therefore, the standard uncertainties introduced by the 1 mL and 5 mL pipettes are upipette = 0.005/1 and 0.005/5, respectively. We take the larger value upipette = 0.005/1.
The sources of volume uncertainty of GBW08615, which is diluted in a 100 mL volumetric flask, include volumetric error, volumetric repeatability, and laboratory temperature fluctuation. Since method repeatability will be included in subsequent calculations, including the repeatability of 100 mL volume determination, it will not be considered here. The verification certificate shows that the maximum allowable error of a 100 mL volumetric flask is ±0.1 mL; therefore, the uncertainty introduced by the constant volume of a 100 mL volumetric flask is uV-CRM-error = 0.1/100 = 0.1%.
The 100 mL volumetric flasks were calibrated at 20 °C and the temperature variations within the laboratories were ±2 °C. The volume expansion coefficient of water is 2.1 × 10⁻⁴/°C, and the volume change in a 100 mL solution is ±(100 × 2 × 2.1 × 10−4) mL = ±0.042 mL. The volume uncertainty of a 100 mL water solution introduced by the temperature variation is uV-CRM-water = 0.042/100 = 0.042%. Therefore, the standard uncertainty (uV-CRM) introduced by the process of GBW08615 diluted in 100 mL water is calculated by
The standard uncertainty introduced by the dilution of GBW08615 is calculated by
According to GB/T 38145-2019 [21], a series of Cu element standard solutions with different concentrations were prepared and measured. The measured spectral intensity and concentration were fitted to obtain the linear regression equation of Y = bX + a and the linear correlation coefficient R2 was calculated. The standard uncertainty (ucurve) introduced by the standard curve is calculated by
In the equations, ucurve is the uncertainty introduced by the standard curve, SR is the standard deviation of the residual of the standard curve, p is the number of repeated measurements of the AlCu solution sample, n is the total number of measurements of the Cu standard solution, C0 is the measured Cu concentration of the AlCu solution sample, Ci is the Cu concentration of the Cu standard solution (i.e., Xi), is the average of the Cu standard solution, and Yi is the spectral intensity of the Cu standard solution. Based on the measured Cu concentration and spectral intensity of the Cu standard solutions, the uncertainties induced by the standard curves for AlCu solution measurement obtained in eight laboratories are shown in Table 4.
Table 4.
Uncertainties introduced by the standard curves of ICP-OES measurement for AlCu films in eight labs.
The uncertainty (uCRM-cal) induced by the calibration of ICP-OES using GBW08615 is given by
(4) The uncertainty (ur) induced by the measurement repeatability of Cu content in AlCu solutions
For the three AlCu solution samples, the measurements were independently repeated six times. The Cu element content and corresponding standard deviation results were obtained, as shown in Table 5, Table 6 and Table 7. The standard deviation represents the uncertainty (ur) introduced by the measurement repeatability of the Cu contents in the AlCu solutions.
Table 5.
Uncertainties of AlCu films with a nominal Cu content of 2.5%.
Table 6.
Uncertainties of AlCu films with a nominal Cu content of 14.5%.
Table 7.
Uncertainties of AlCu films with a nominal Cu content of 49.5%.
3.5. Uncertainty Evaluation and Result Expression
The uncertainty of the standard value determination of the reference material consists of the uncertainty introduced by the determination method and the uncertainties introduced by the sample homogeneity and stability. Furthermore, the uncertainty introduced by the determination method includes the uncertainty introduced by the measuring equipment and the uncertainty introduced by the measuring process.
In terms of uncertainty classification, the uncertainty of the standard value determination of reference material mainly includes type A, type B, homogeneity, and stability [22,23]. Type A refers to the statistical results of the measurement process; type B is the uncertainty other than type A, including the uncertainties introduced by the measuring equipment and the reference material. According to the source analysis and calculation of uncertainties in the previous chapters, uncertainties evaluated by type A, type B, homogeneity, and stability are classified and listed in Table 5, Table 6 and Table 7.
The Cu contents of AlCu films were determined by eight laboratories. The uncertainties introduced by repeatability in different laboratories are different, and the uncertainties introduced by standard curves in different laboratories are different. These two uncertainties are combined first. The calculation formula is
Eight laboratories jointly determined the Cu contents of the AlCu films. The average (u(r+curve)_average) of the eight combined uncertainties of the repeatability and the standard curve is calculated as follows:
u(r+curve)_average = (u(r+curve)_1 + … + u(r+curve)_8)/8
The calculation formula of the combined standard uncertainty (uc) of the three AlCu film reference materials is as follows, and the calculation results are shown in Table 5, Table 6 and Table 7.
If the confidence is 95% and the inclusion factor is k = 2, then the expanded uncertainty U is
U = k × uc
Table 8 provides the standard values and expanded uncertainties of the Cu contents of the three AlCu film reference materials.
Table 8.
Quantifications of Cu content of reference materials used in AlCu films.
4. Conclusions
Three Cu content reference materials used in AlCu films for X-ray EDS/WDS calibration were prepared using magnetron sputtering deposition. The Cu content standard values of the three reference materials were determined using ICP-OES in eight labs. The results showed that the homogeneity of the three Cu content reference materials used in AlCu films met the requirements. The reference materials were stable for up to one year under normal temperature storage. The Cu content standard values of the three reference materials were 2.56%, 14.64%, and 49.46%, respectively. Their extended uncertainties were, respectively, 0.14%, 0.42%, and 0.98% (k = 2). Using quantitative analysis, it was determined that the three developed reference materials meet the calibration requirements of X-ray EDS/WDS of SEM, EPMA, and TEM, thus guaranteeing the accuracy and consistency of the measurement results. The Cu content reference materials will be important in measuring element content in scientific research, production, and trade activities.
Supplementary Materials
The following supporting information can be downloaded at: https://www.mdpi.com/article/10.3390/coatings13101773/s1.
Author Contributions
X.L. (Xiao Li): writing—original draft. R.Z.: data curation, formal analysis. D.T.: data curation. L.C.: methodology. Y.Z.: project administration. X.L. (Xu Li): conceptualization, supervision. Y.L.: software, resources. Y.W.: investigation, conceptualization. All authors have read and agreed to the published version of the manuscript.
Funding
This research was funded by the Fundamental Research Funds for the Central Universities (FRF-TP-22-018A1) and the Youth Program of the National Natural Science Foundation of China (61904170).
Data Availability Statement
The raw/processed data required to reproduce these findings cannot be shared at this time as the data also form part of an ongoing study.
Conflicts of Interest
The authors declare that they have no known competing financial interests or personal relationships that could have appeared to influence the work reported in this paper.
Glossary
| X-ray | EDS/WDS X-ray energy/wavelength-dispersive spectrometer |
| ICP-OES | Inductively coupled plasma optical emission spectrometer |
| SEM | Scanning electron microscope |
| TEM | Transmission electron microscope |
| AFM | Atomic force microscope |
| EPMA | Electron probe micro-analyzer |
| EELS | Electron energy loss spectrometer |
| Ra | Surface arithmetic mean roughness |
| Rq | Surface root-mean-square roughness |
| ν1, ν2 | Degree of freedom |
| F | The actual distribution variable |
| uh-mac | The uncertainties introduced by the macroscopic homogeneity |
| b1 | The slope of the linear equation |
| s(b1) | The uncertainty of the slope |
| t(0.95, n-2) | The t-distribution factor |
| us-l | The uncertainty introduced by the long-term stability |
| us-s | The uncertainty introduced by the short-term stability |
| wCu | The Cu content of the AlCu film |
| C | The Cu concentration of the AlCu solution sample |
| V | The volume of the AlCu solution sample after dilution |
| m | The mass of the AlCu film |
| um | The uncertainty induced by the electronic balance |
| um-1 | The standard uncertainty introduced by the indicating error |
| um-2 | The standard uncertainty introduced by the maximum allowable deviation |
| um | The standard uncertainty induced by the electronic balance |
| uV-sample | The uncertainty induced by the dilution of the AlCu solution sample |
| uV-vf | The standard uncertainty introduced by the dilution volume |
| uV-water | The standard uncertainty introduced by the volume changes in aqueous solutions |
| uV-sample | The uncertainty induced by the dilution of the AlCu solution sample |
| uCRM-cal | The uncertainty induced by the calibration process of ICP-OES using GBW08615 |
| uCRM-dilution | The uncertainty introduced by the dilution of GBW08615 |
| ucurve | The uncertainty introduced by the fitting of the standard curve |
| uCRM | The standard uncertainty introduced by GBW08615 |
| upipette | The standard uncertainty introduced by the 1 mL and 5 mL pipettes |
| uV-CRM-error | The uncertainty introduced by the constant volume of a 100 mL volumetric flask |
| uV-CRM-water | The volume uncertainty of a 100 mL water solution introduced by the temperature variation |
| uV-CRM | The standard uncertainty introduced by the process of GBW08615 diluted in 100 mL of water |
| uCRM-dilution | The standard uncertainty introduced by the dilution of GBW08615 |
| R2 | The linear correlation coefficient |
| ucurve | The uncertainty introduced by the standard curve |
| SR | The standard deviation of the residual of the standard curve |
| p | The number of repeated measurements of the AlCu solution sample |
| n | The total number of measurements of the Cu standard solution |
| C0 | The measured Cu concentration of the AlCu solution sample |
| Ci | The Cu concentration of the Cu standard solution (i.e., Xi) |
| The average of the Cu standard solution | |
| Yi | The spectral intensity of the Cu standard solution |
| uCRM-cal | The uncertainty induced by the calibration of ICP-OES using GBW08615 |
| ur | The uncertainty induced by the measurement repeatability of Cu content in the AlCu solutions |
| u(r+curve)_average | The average of the eight combined uncertainties of the repeatability and the standard curve |
| uc | The combined standard uncertainty |
| U | The expanded uncertainty |
References
- Brodusch, N.; Zaghib, K.; Gauvin, R. Improvement of the energy resolution of energy dispersive spectrometers (EDS) using Richardson-Lucy deconvolution. Ultramicroscopy 2020, 209, 112886. [Google Scholar] [CrossRef] [PubMed]
- Hasemann, G. Experimental study of the liquidus surface in the V-rich portion of the V-Si-B system. J. Alloys Compd. 2020, 824, 153843. [Google Scholar] [CrossRef]
- Yang, C.-C.T.; Cho, H.J.; Wei, W.J. Quantitative characterization of various tetragonal zirconia polycrystals (TZPs). J. Eur. Ceram. Soc. 2002, 22, 199–207. [Google Scholar] [CrossRef]
- Ritchie, N.; Newbury, D.; Davis, J. EDS Measurements of X-ray Intensity at WDS Precision and Accuracy Using a Silicon Drift Detector. Microsc. Microanal. 2012, 18, 892–904. [Google Scholar] [CrossRef] [PubMed]
- Heather, L.; Paul, C. K-ratio Measurements by WDS and EDS for Instrument Maintenance, Calibration, and Accurate Quantification. Microsc. Microanal. 2020, 26, 752–754. [Google Scholar]
- Varambhia, A.; Jones, L.; London, A.; Ozkaya, D.; Nellist, P.D.; Lozano-Perez, S. Determining EDS and EELS partial cross-sections from multiple calibration standards to accurately quantify bi-metallic nanoparticles using STEM. Micron 2018, 113, 69–82. [Google Scholar] [CrossRef] [PubMed]
- Donovan, J.J.; Allaz, J.M.; Von Der Handt, A.; Seward, G.G.; Neill, O.; Goemann, K.; Chouinard, J.; Carpenter, P.K. Quantitative WDS compositional mapping using the electron microprobe. Am. Mineral. 2021, 106, 1717–1735. [Google Scholar] [CrossRef]
- Alvisi, M.; Blome, M.; Griepentrog, M.; Hodoroaba, V.D.; Karduck, P.; Mostert, M.; Nacucchi, M.; Procop, M.; Rohde, M.; Scholze, F.; et al. The Determination of the Efficiency of Energy Dispersive X-ray Spectrometers by a New Reference Material. Microsc. Microanal. 2006, 12, 406–415. [Google Scholar] [CrossRef] [PubMed]
- Hodoroaba, V.D.; Procop, M. A Method to Test the Performance of an Energy-Dispersive X-ray Spectrometer (EDS). Microsc. Microanal. 2014, 20, 1556–1564. [Google Scholar] [CrossRef] [PubMed]
- Pinard, P.T.; Protheroe, A.; Holland, J.; Burgess, S.; Statham, P.J. Development and validation of standardless and standards-based X-ray microanalysis. IOP Conf. Ser. Mater. Sci. Eng. 2020, 891, 012020. [Google Scholar] [CrossRef]
- Llovet, X.; Moy, A.; Pinard, P.T.; Fournelle, J.H. Electron probe microanalysis: A review of recent developments and applications in materials science and engineering. Prog. Mater. Sci. 2020, 116, 100673. [Google Scholar] [CrossRef]
- Cliff, G.; Lorimer, G.W. The quantitative analysis of thin specimens. J. Microsc. 2011, 103, 203–207. [Google Scholar] [CrossRef]
- Egerton, R.F. Electron energy-loss spectroscopy in the TEM. Rep. Prog. Phys. 2009, 72, 16502–16525. [Google Scholar] [CrossRef]
- Magnuson, M.; Hultman, L.; Hgberg, H. Review of transition-metal diboride thin films. Vacuum 2022, 196, 110567. [Google Scholar] [CrossRef]
- Zhong, Y.; Ni, Z.; Li, J.; Li, X.; Cao, W.; Wang, X.; Zhong, Q.; Xu, X.; Chen, J.; Liang, C. Influence mechanism of RF bias on microstructure and superconducting properties of sputtered niobium thin films. Vacuum 2023, 207, 111636. [Google Scholar] [CrossRef]
- Wang, L.; Zhong, Y.; Li, J.; Cao, W.; Zhong, Q.; Wang, X.; Li, X. Effect of residual gas on structural, electrical and mechanical properties of niobium films deposited by magnetron sputtering deposition. Mater. Res. Express 2018, 5, 046410. [Google Scholar] [CrossRef]
- GB/T 4930-2021; State Administration for Market Regulation. Microbeam Analysis—Electron Probe Microanalysis—Guidelines for the Specification of Certified Reference Materials (CRMs). Standards Press of China: Beijing, China, 2021.
- JJF 1006-1994; The State Bureau of Quality and Technical Supervision. Technical Norm of Primary Reference Material. Standards Press of China: Beijing, China, 1994.
- ISO Guide 35:2006; Reference Materials-General and Statistical Principles for Certification. ISO: Geneva, Switzerland, 2006.
- Morrison, C.; Sun, H.; Yao, Y.; Loomis, R.A.; Buhro, W.E. Methods for the ICP-OES Analysis of Semiconductor Materials. Chem. Mater. 2020, 32, 1760–1768. [Google Scholar] [CrossRef]
- GB/T 38145-2019; State Administration for Market Regulation. High Content Precious Metals Jewellery Alloys—Determination of Gold, Platinum and Palladium—Difference Method Using Inductively Coupled Plasma Optical Emission Spectroscopy. Standards Press of China: Beijing, China, 2019.
- JJF 1001-2011; General Administration of Quality Supervision, Inspection and Quarantine of the People’s Republic of China. General Terms in Metrology and Their Definitions. Standards Press of China: Beijing, China, 2011.
- JJF 1059.1-2012; General Administration of Quality Supervision, Inspection and Quarantine of the People’s Republic of China. Evaluation and Expression of Uncertainty in Measurement. Standards Press of China: Beijing, China, 2012.
Disclaimer/Publisher’s Note: The statements, opinions and data contained in all publications are solely those of the individual author(s) and contributor(s) and not of MDPI and/or the editor(s). MDPI and/or the editor(s) disclaim responsibility for any injury to people or property resulting from any ideas, methods, instructions or products referred to in the content. |
© 2023 by the authors. Licensee MDPI, Basel, Switzerland. This article is an open access article distributed under the terms and conditions of the Creative Commons Attribution (CC BY) license (https://creativecommons.org/licenses/by/4.0/).