Abstract
Wheel wear is one of the most critical factors affecting the vehicle performances and maintenance costs of railway vehicles. However, previous research has to ignore the initial wheel-rail profiles for the evolution of wheel wear. Therefore, this work investigates the relationship between the evolution of wheel wear corresponding to different initial wheel-rail profiles and vehicle dynamics, wheel-rail deterioration. Firstly, the evolution of wheel wear during a long service period is measured from two high-speed railway trains running on two different lines. Contact geometry, e.g., equivalent conicity and contact pair distribution, are extracted. After that, the influence of wheel wear on the vehicle dynamic performance is studied using a multi-body dynamic software. The calculated contact parameters, e.g., pressure, shear traction, and creepage, are used to analyze the distribution of rolling contact fatigue. Based on the experimental and simulation results, the initial wheel and rail profiles significantly affects the wheel wear pattern, the thin rim wheel has uniform wear, and other wheels occurs hollow wear. The hollow wear can lead to gradual deterioration of vehicle dynamics, which conversely aggravates the wheel reprofiling.
1. Introduction
The wheel-rail profile is crucial in defining how wheels and rails interact dynamically [1,2,3]. In practice, minor tread alterations may significantly alter the equivalent conicity and wheel-rail contact locations, altering the vehicle’s stability [4].
Wheel wear of the Chinese high-speed train is relatively complicated. The main characteristics of the wheel-rail inter-face can be summarized as follows: high operational speed (300–350 km/h), long operational distance (2300 km/day), ice, sand or another environment. In railway applications, wheel wear due to rail-wheel interactions is a critical issue. Increasing vehicle speeds and traffic volumes increase wheel wear, which reduces wheel re-profiling intervals and decreases vehicle performance dynamically [5,6].
Many scholars have studied wheel wear through field measurements, laboratory tests, and theoretical prediction. Numerous research on the influence of wheel-rail profiles on dynamic performance [7,8] and deterioration in wheel-rails [9,10] have been done. In laboratory tests, wear coefficients in various wheel-rail contact conditions were also estimated [11]. Ostash et al. and Andreiko et al. researched the new high-strength wheel steels with the best combination of high wear and fracture resistance [12,13]. Qi et al. [14] analyzed the abnormal vibration problem of carbody caused by the wheel rail profile through field tests. In many cases, the simulated wear distributions are successfully developed to forecast the development of the wheel profile [15,16,17,18]. Cui et al. [19] proposed a re-profiling threshold according to the wear forms for high-speed train’s wheels. Wang et al. [20] studied the wheel re-profiling interval for the CRH380B EMU according to the dynamic performance based on extensive field data set. An analysis of wheel-rail contact bandwidth and its impact on wheel tread wear was carried out by Gan et al. [21]. It can be found from these studies that most of the existing studies focus on the new wheel-rail profile in the literature, but the research on wheel wear pattern and wheel-rail interaction for different service lines is few. However, the difference in the shape of the worn wheels has a great impacts on vehicle dynamics of high-speed trains.
In this work, to analyze how wheel wear evolves and affects vehicle dynamics, wheel wear evolution, wheel-rail contact pairs distribution, and vehicle dynamics behavior are experimentally and numerically studied for high-speed trains. Section 2 demonstrates the wheel wear evolution (e.g., the changes in wheel profiles and depth of the worn shape) in one reprofiling cycles. In Section 3, wheel-rail interactions, such as the wheel-rail contact pairs distribution and equivalent conicity, are comparatively analyzed for the worn wheels. In Section 4, the effects of wheel wear on the dynamics behavior and wheel deterioration are investigated through a multi-body analysis of the vehicle. Finally, some conclusions are drawn.
2. The Evolution of Wheel Wear
From 2016, two high-speed lines in China, A and B, were tested for a long period of time to record wheel profiles. The curve distribution characteristics of these two lines are similar. The curve radius of the main line is basically greater than 55,000 m. Curves with a radius less than 2000 m are mostly located around stations or railroad hubs, accounting for less than 1%.
Table 1 illustrates the basic information of these two lines, including their length, climates, operation speed, track types, and operation modes. The following table summarizes the essential characteristics of these two railway lines, including climates, operating speeds et al.

Table 1.
Information about wheel-rail systems.
Wheel profiles are measured by the MiniProf instrument every 20,000 km or 50,000 km. The MiniProf systems are high-precision (0.01 mm), full-contact profile measuring tools for monitoring and analyzing the cross-sectional profiles of wheels. During a wheel re-profiling interval, the wheel is tested 10 times for Line A, and the wheel is tested 7 times for Line B.
Figure 1 depicts the connection between wheel wear and operating distance for all 64 wheels in 8 cars, including the maximum, minimum, median, abnormal, and quantiles of wear depth. According to the statistical results of two high-speed lines, the wheel wear gradually increases and presents an approximately linear relationship. Significantly, the error of wheel wear gradually increases with operation distance. In the Line A, the average wear rate is 0.05 mm/10,000 km, the maximum wear and the average wear are about 1.5 mm and 1.1 mm at 218,000 km, respectively.
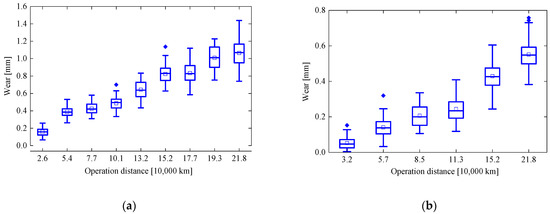
Figure 1.
Wheel wear in one re-profiling interval: (a) Line A; (b) Line B.
Similarly, in the Line B, the wheel wear rate is segmentally linear: the wheel wear rate is about 0.022 mm/10,000 km before 113,000 km, and it further increases to about 0.025 mm/10,000 km after 113,000 km. At 218,000 km, the maximum wear on a wheel is about 0.75 mm, and the average wear is about 0.55 mm.
The worn profiles of a wheel with Line A are shown in Figure 2a. As shown in Figure 2b, the firstly-measured wheel profile be the reference, the profiles tested after different operation distance is subtracted from the reference profile in the normal direction to obtain the wear distribution. The calculations demonstrate that when hollow wear begins in the wheel, the dominant wear concentrated on the lateral position between −20~30 mm. At lateral positions between −35 and −45 mm, flange wear occurs with a coordinate system defined at the nominal rolling radius. Noticeably, the flange wear has not been observed for Line A.
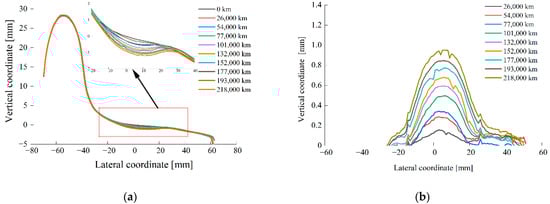
Figure 2.
Measured wheel profiles and wheel wear distribution of the Line A: (a) wheel profiles; (b) wheel wear distribution.
As shown in Figure 3, there is a slight change in the wheel rim. In addition, a lateral wear position of −35 to 50 mm with a broad wear range was stated for the ‘uniform wear’. As a result of the economic reprofiling strategy, initial flange wear is clearly visible.
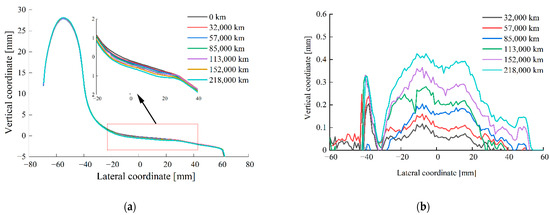
Figure 3.
Wheel profiles and wear distribution of the Line B: (a) wheel tread profiles; (b) wheel wear distribution.
3. Wheel-Rail Contact Geometry
The contact geometry is defined by gauge, rail cant, and profile of the wheel that contact with railhead. In China, it uses a gauge of 1435 mm, a cant of 1:40, a wheelback distance of 1353 mm, a wheel diameter of 860 mm. In addition, the evolution of equivalent conicity, wheel-rail contact pairs distribution for the two high-speed lines are compared.
3.1. Equivalent Conicity
The equivalent conicity is a key parameter and it relates to the dynamic performance and running stability of the vehicle. Even in the steep curve, a high level of comparable conicity permits good curving behavior without flange contact. However, this also reduces the essential speed, perhaps resulting in severe hunting instability. Low equivalent conicity, on the other hand, provides for steady vehicle operation at high speeds but leads to flange contact.
When the operation distance reaches the limit value, the wheel should be re-profiled to restore worn profiles to the original shapes. In order to prolong the wheelset life, one frequent method is economical re-profiling, which uses the smallest amount of material cut at each re-profiling operation. The vehicle management department has proposed different re-profiling strategies.
Figure 4 plots the initial wheel and rail profiles. Hence, in Figure 4a, the flange profile has 2 mm gaps for the wheel re-profiled. However, the two wheel profiles is coincide completely for the wheel tread section between the −20 and 40 mm. Exploring reasons for thin flange due to remove little material on turning lathes. To address wheels with severe flange wear, a variety of narrow flange profiles (changing flange thickness) can greatly extend the service lifetimes of high-speed wheels.
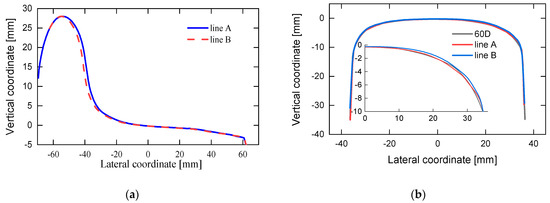
Figure 4.
Profiles of two railway lines’ wheels and rails: (a) re-profiling shapes and (b) rail profile.
The measured rail profiles of the two lines are identical to the 60D profile, as shown in Figure 4b. The rail profile of the Line B with a certain positive deviation slightly bugles at the working side gauge. The rail grinding profile by the grindstone, so the working accuracy is far less than turning lathes to restore the original tread profile. The rail grinding strategies adopted by different engineering departments is slightly different, resulting in slight manufacturing error between the measured profiles and the 60D.
Based on the UIC 519 standard, the equivalent conicity is determined here using the measured profiles [22]. The equivalent conicity of two lines after reprofiling the wheel are compared, as shown in Figure 5. Due to the thin flange of the Line B, the wheel-rail gap increases, the wheel enters the flange root, and the equivalent conicity begins to increase gradually when the wheelset lateral displacement reaches 10 mm.
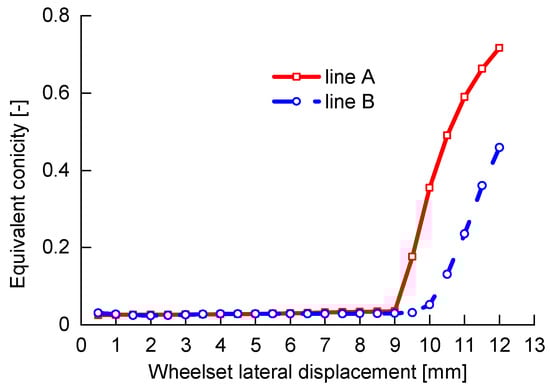
Figure 5.
Equivalent conicity curves.
Figure 6 depicts the connection between equivalent conicity and operation distance for all 64 wheels in eight cars of a single train. Figure 6a shows that the equivalent conicity of the Line A gradually rises monotonically, and the increasing rate of equivalent conicity is about 0.006/10,000 km. The average statistic conicity starts from 0.07 and ends at 0.19 in one re-profiling cycle. However, the equivalent conicity is relatively stable for the Line B at about 0.03 in a whole re-profiling cycle, as shown in Figure 6b. As the wide range of wheel tread wear, the equivalent conicity does not increase.
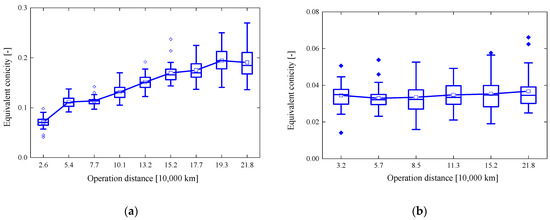
Figure 6.
Equivalent conicity revolution of different railway lines: (a) Line A; (b) Line B.
3.2. Wheel-Rail Contact Pairs Distribution
The wheel and rail profiles obtained on the field test every 50,000 km are used to compute the development of the wheel-rail contact pairings distribution. When the wheelset’s lateral displacement changes from −10 to 10 mm, the contact point is computed every 0.5 mm.
The evolution of contact point is illustrated in Figure 7. The wheel-rail contact point for a lateral displacement is shown by the thin line connecting the wheel to the rail, and the number above the wheel denotes the wheelset lateral displacement. Figure 7a depicts how the wheel-rail contact points are dispersed in the center tread after a wheel repair, but the flange contact will occur when the wheelset travels more than 8 mm from its original position. With the increasing of operating distance, wheel-rail contact points are mainly distributed in three areas: −10~0 mm, 2~8 mm, and 9~10 mm. The wheel-rail contact bandwidth gradually increases, and the contact point gradually draws closer to the rail shoulder. During this period, the equivalent conicity steadily rises, resulting in a reduction in the vehicle’s running stability and riding quality.
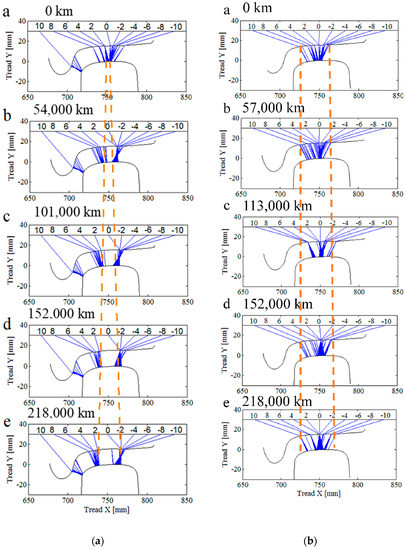
Figure 7.
Wheel-rail contact pairs distribution: (a) Line A (b) Line B.
Figure 7b illustrates the distribution of wheel-rail contact pairings always keeps the center wheel tread and rail head and the bandwidth of the wheel-rail contact has been somewhat improved.
4. Dynamics Analysis of Wheel Wear
With the goal of better understanding the impact of wheel wear, the numerical simulation was used to analyze the dynamics performance and wheel degradation of a high-speed vehicle.
4.1. Numerical Modeling
Following the analysis of wheel wear in various lines, the impact of wheel wear on vehicle dynamics is investigated further in this section of the paper. The commercial pro-gram Simpack creates a vehicle model based on characteristics taken from a high-speed train, as seen in Figure 8 and Table 2. Multi-body dynamics is used to create a vehicle model with two bogie subsystems that completely encompass nonlinear wheel-rail contact, and suspension parts. The carbody and frame, as well as the wheelsets, have six degrees of freedom, but the axle-box has just one degree of freedom, so the model has 46 degrees of freedom. Using the Kalker nonlinear creep and the Hertz contact theory, the creep force between the wheel and the rail is calculated. Hertz theory is used to solve the normal contact problem, and the creep force is estimated using the FASTSIM technique. The suggested friction coefficient between wheel and rail for running dynamics analysis is 0.4 (dry condition).
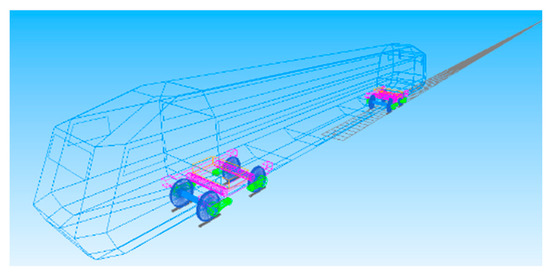
Figure 8.
The numerical model.
Table 2.
Critical parameters of high-speed train.
The track irregularity is also considered here, and it comes from the measured track irregularity data with a length of 5000 m, as shown in Figure 9.
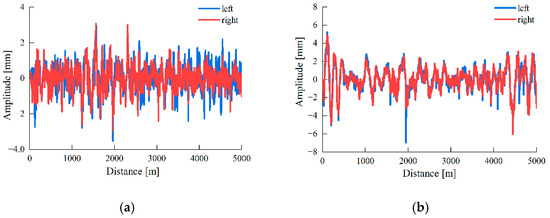
Figure 9.
Track irregularity: (a) Lateral, (b) Vertical.
4.2. Running Stability and Ride Quality
The vehicle stability and ride quality under wheel wear are initially assessed based on the measured wheel and rail profiles. Accelerations gathered from the carbody floor and the bogie frame above the wheelset are used to perform a dynamic assessment of lateral stability and ride comfort. This is known as the Sperling index is a commonly used for assessing the vehicle’s comfort, and is described as:
where A is the vibration acceleration’s amplitude in the frequency domain, f is the frequency, and F(f) is the frequency-weighted function. According to GB 5599-2019 [23], the limit value of ride comfort is set at 2.5 for the excellent level, 2.75 for the medium level, and 3.0 for the qualifying level.
The bogie lateral acceleration is filtered by bandpass filter 0.5–10 Hz, then a limit of 8 m/s2 defined in GB5599 was utilized to analyze bogie hunting. Filter parameters are set as follows: filter type is Butterworth, and window length is 500 m.
Figure 10 depicts the impact of wheel wear on bogie frame’s nonlinear critical speed, lateral stability, and lateral acceleration. To maintain the high-speed train’s stability, the maximum speed should be more than 350 km/h for the 250 km/h class high-speed railway, taking into account the 40% safety margin. Figure 10a shows that the maxi-mum speed of two lines is 450 km/h after wheels are re-profiled. The maximum speed for Line A steadily falls from 450 km/h to 370 km/h as the service distance increases, but it is still more than the running speed of 250 km/h. The non-linear critical speed fluctuates within 450 km/h with little change corresponding to the B line.
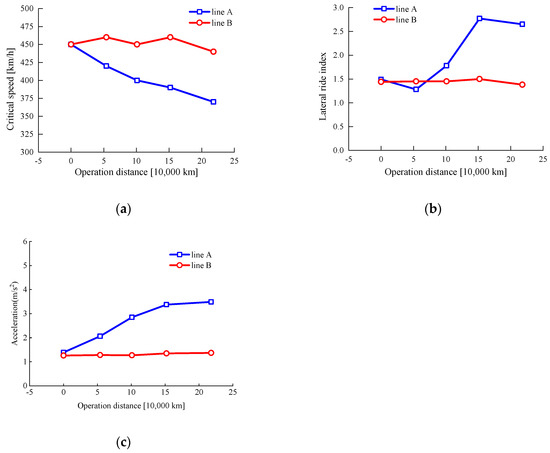
Figure 10.
Vehicle dynamics index. (a) critical speed; (b) lateral ride index and (c) carbody acceleration.
Figure 10b demonstrates that the lateral ride index stables at 1.5 at the beginning of the first 50,000 km, then it is more significant than 2.75 for 152,000 km, so the ride quality class decrease from “excellent” to “good”. However, the lateral ride index is retained at 1.5, keeping as “excellent” in the Line B.
By comparing the findings from the two groups in Figure 10c, the lateral acceleration (Peak-to-Peak) increases monotonically with the operating distance for line A, the acceleration goes from 1.38 m/s2 to 3.49 m/s2 in 218,000 km. Contrary, the lateral acceleration of bogie frame basically fluctuates between 1.2 m/s2 and 1.4 m/s2.
Time histories of the lateral acceleration are shown in Figure 11 and Figure 12 for Line A. In Figure 11a,b, the lateral acceleration increases gradually. When the operating distance is under 50,000 km, the maximum acceleration is 0.75 m/s2. However, when the operating distance reaches 100,000 km, the acceleration exceeds 1.0 m/s2, with a maximum value of 1.2 m/s2.
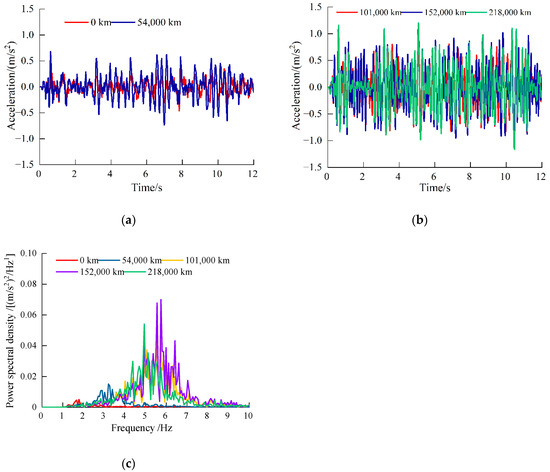
Figure 11.
Vibration on carbody ends for the Line A: (a) time-domain of the service distance less than 54,000 km; (b) time-domain of the service distance more than 101,000 km;(c) frequency domain.
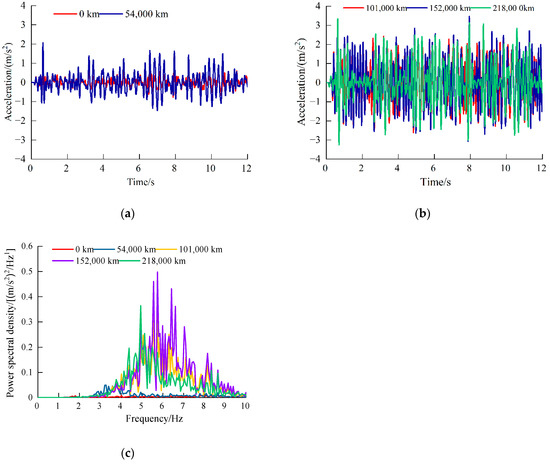
Figure 12.
Vibration on bogie frame ends for Line A: (a) service distance less than 54,000 km; (b) the service distance more than 101,000 km;(c) frequency domain.
The frequency spectra of carbody acceleration (FFT) are further shown in Figure 11c, it can be seen that the central frequency of carbody lateral acceleration is less than 2 Hz after wheel re-profiling. The core frequency rises to 3.5 Hz at 54,000 km and it rises to 5–6 Hz at 100,000 km or more.
Figure 12 illustrate the bogie frame’s lateral acceleration. This graph shows how the bogie frame’s lateral acceleration amplitude steadily grows as the operating distance increases. When the operation distance of the vehicle is less than 50,000 km, the maximum acceleration becomes 2 m/s2; when the operation distance is more than 100,000 km, the maximum acceleration reaches 4 m/s2. The frequency spectra of bogie frame vibration is shown in Figure 12c. After the maintenance of wheel, the central frequency of the carbody is more diminutive than 2 Hz, and it will increase to 3.5 Hz with an operation distance of 54,000 km. Similar to the carbody, the central frequency of the bogie frame also rises to 5–7 Hz with an operation distance of 100,000 km. Lesser low frequencies in the same plot relate to stiff motion of the carbody and hunting motion of the wheelset.
Line B, in contrast to Line A, exhibits a modest variation in the lateral acceleration as a result of the change in service distance. Figure 13 and Figure 14 illustrate the time histories and frequency spectra, respectively. The lateral vibration acceleration of the carbody has no noticeable change at different operation distance, where its maximum value is less than 0.5 m/s2. Moreover, the frequency domain characteristics of vibration are consistent, its central frequency keeps 1.7 Hz. The lateral acceleration also does not change significantly for the bogie frame, and the maximum value is less than 1 m/s2.
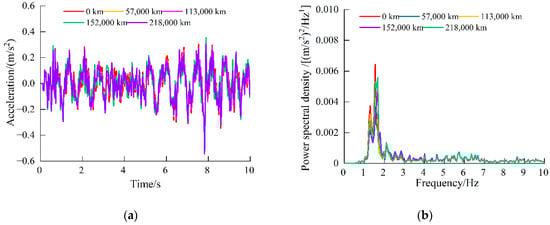
Figure 13.
Vibration on carbody ends for Line B: (a) time-domain and (b) frequency-domain.
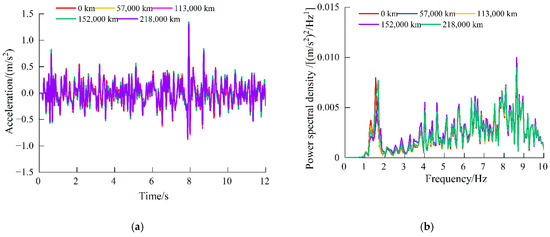
Figure 14.
Vibration on bogie frame ends for Line B: (a) time-domain and (b) frequency-domain.
4.3. Rolling Contack Fatigue
The fatigue-related damage caused by the recurrent action of a consequent creep force in addition to the ordinary contact forces occurring through the same region is referred to as rolling contact fatigue (RCF).
Based on the “Code for Design of High-Speed Railway” [24] and considering the actual curve parameters, two curves with different radii are chosen here to investigate the rolling contact fatigue under wheel wear in the curved track. The curve parameters are shown in Table 3.
Table 3.
Parameters of the curves.
It is proposed in this paper that an engineering model established by Ekberg et al. [25] be used to evaluate the potential RCF problems. The surface fatigue index FIsurf is used to anticipate the occurrence of surface fatigue flaws on a surface.
where μ is the traction coefficient, a, and b are the semiaxes of the contact patch, Fz is the normal force magnitude, and k is the yield stress in pure shear, which is 584 MPa in the high-speed railway. The contact patch traction coefficient, is defined as the quotient of the tangential and normal forces in the contact patchTraction coefficient is defined as the symbol of tangential and normal forces:
where Fx, Fy is the longitudinal, lateral creep forces, respectively. If the inequality , fatigue damage will occur.
The influence of RCF on vehicle dynamic performance is investigated here, where two different curve radius 1000 m and 600 m are chosen here, and the track irregularity is not considered in the calculation. The rolling contact fatigue index of the outer and inner rail for the guide wheel is shown in Figure 15. As shown in Figure 15a, the FIsurf is positive in the inner rail with a curve radius 1000 m, this may lead to the rolling contact fatigue cracks on wheel surface. This is caused by the fact that the lateral wheelset displacement on the curves is about 9 mm, and two contact points occur on the outer rail, where one of which occurs at the flange. Consequently, the FIsurf of the outer rail is larger. The normal force and contact area diminish to a considerable amount as wheel wear progresses, therefore the surface fatigue index rises. In addition, Figure 15b illustrates that the FIsurf of the radius 1000 m is negative, while the FIsurf of radius 600 m is positive. This indicates that the possibility of the wheel forming rolling contact fatigue crack on the curve with radius 600 m is slightly greater than that of the radius 1000 m. Furthermore, the FIsurf progressively rises with wheel wear, especially the running distance is greater than 152,000 km, the FIsurf changes from negative to positive, and the possibility of rolling contact fatigue crack increases under long-term action.
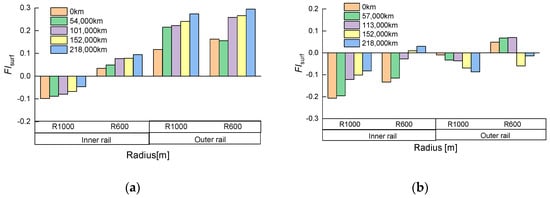
Figure 15.
Rolling contact fatigue index: (a) Line A; (b) Line B.
It could speed up the growth and occurrence of RCF on both the up and down slopes because the lateral slip. RCF may also be influenced by the worse geometry match at the hollow’s outer edges, which has a sharper contact geometry. Additionally, the FIsurf of the Line B is small, so the possibility of a fatigue crack is less.
In summary, it can be concluded that wheel-rail profiles have great influence on vehicle dynamic performance and rolling contact fatigue damage. Therefore, in order to obtain ideal vehicle dynamics performance, the wheel-rail profile can be optimized.
5. Conclusions
This article illustrates the progression of wheel wear on high-speed trains at 250 km/h on two railway lines. Experimental and numerical analysis were used to investigate the impacts of wheel wear and its influence on vehicle dynamics.
(1) The initial wheel-rail profiles significantly influence the wheel wear pattern, the thin rim wheel has uniform wear, and other wheels occurs hollow wear. With increasing running distance, the equivalent conicity of the hollow wear wheel increases, while the uniform wear wheel is stable in one re-profiling cycle.
(2) The hollow wear can lead to gradual deterioration of vehicle dynamics, which conversely aggravates the wheel reprofiling. However, for the uniform wear of the wheel, the vehicle dynamic behavior did not deteriorate significantly, particularly, the possibility of a rolling contact fatigue crack is also tiny.
(3) The nonlinear critical speed for Line A presents a trend of continuous decrease as the operation distance increases, while the Line B basically remains stable. The lateral ride index increased to a certain extent, and the ride quality decreased from “excellent” to “good” for the Line A, while the ride index has a slight change for the Line B.
(4) In the spectra of lateral bogie frame accelerations, at frequencies between 5 and 7 Hz, hollow wear increased the amplitudes significantly. Furthermore, it established that this frequency range was consistent with bogie hunting, hence verifying the reason of the anomaly warnings.
(5) At present, Chinese railway officials have selected a predetermined re-profiling period of 220,000 km. Therefore, for the uniform wear of the wheel, under certain monitoring conditions to prevent the occurrence of low equivalent conicity, the re-profiling cycle of high-speed wheels can be appropriately extended to prolong the fixed re-profiling interval and reduce the cost of operation and maintenance for the high-speed train.
Author Contributions
M.H.: methodology, funding acquisition, writing—original draft. B.C.: investigation, writing—review and editing. D.C.: methodology, software. All authors have read and agreed to the published version of the manuscript.
Funding
This research was funded by the China Railway (Grant nos. J2021J007) and China Academy of Railway Sciences (Grant nos. 2019YJ162).
Institutional Review Board Statement
Not applicable.
Informed Consent Statement
Not applicable.
Data Availability Statement
Not applicable.
Conflicts of Interest
The authors declare no conflict of interest.
References
- Seo, J.-W.; Hur, H.-M.; Kwon, S.-J. Effect of Mechanical Properties of Rail and Wheel on Wear and Rolling Contact Fatigue. Metals 2022, 12, 630. [Google Scholar] [CrossRef]
- Yang, X.; Tao, G.; Li, W.; Wen, Z. On the formation mechanism of high-order polygonal wear of metro train wheels: Experiment and simulation. Eng. Fail. Anal. 2021, 127, 105512. [Google Scholar] [CrossRef]
- Polach, O.; Nicklisch, D. Wheel/rail contact geometry parameters in regard to vehicle behaviour and their alteration with wear. Wear 2016, 366–367, 200–208. [Google Scholar] [CrossRef]
- Enblom, R. Deterioration mechanisms in the wheel–rail interface with focus on wear prediction: Aliterature review. Veh. Syst. Dyn. 2009, 47, 661–700. [Google Scholar] [CrossRef]
- Zhai, W.; Jin, X.; Wen, Z.; Zhao, X. Wear Problems of High-Speed Wheel Rail Systems Observations, Causes, and Counter-measures in China. Appl. Mech. Rev. 2020, 72, 1–23. [Google Scholar] [CrossRef]
- Shi, H.; Wang, J.; Wu, P.; Song, C.; Teng, W. Field measurements of the evolution of wheel wear and vehicle dynamics for high-speed trains. Veh. Syst. Dyn. 2017, 56, 1187–1206. [Google Scholar] [CrossRef]
- Zhu, A.; Yang, S.; Li, Q.; Yang, J.; Li, X.; Xie, Y. Simulation and measurement study of metro wheel wear based on the Archard model. Ind. Lubr. Tribol. 2019, 71, 284–294. [Google Scholar] [CrossRef]
- Kou, J.; Zhang, J.; Zhou, H.; Wang, C.; Sun, L. Effect of the worn status of wheel/rail profiles on wheel wear over curved tracks. J. Mech. Sci. Technol. 2021, 35, 945–954. [Google Scholar] [CrossRef]
- Wang, W.J.; Zhong, W.; Guo, J.; Liu, Q.Y.; Zhu, M.H.; Zhou, Z.R. Investigation on rolling contact fatigue and wear properties of railway rails. Proc. Inst. Mech. Eng. Part J J. Eng. Tribol. 2009, 223, 1033–1039. [Google Scholar] [CrossRef]
- Karttunen, K.; Kabo, E.; Ekberg, A. Numerical assessment of the influence of worn wheel tread geometry on rail and wheel deterioration. Wear 2014, 317, 77–91. [Google Scholar] [CrossRef]
- Ding, H.; He, C.; Ma, L.; Guo, J.; Liu, Q.; Wang, W. Wear mapping and transitions in wheel and rail materials under different contact pressure and sliding velocity conditions. Wear 2016, 352–353, 1–8. [Google Scholar] [CrossRef]
- Ostash, O.P.; Anofriev, V.H.; Andreiko, I.; Muradyan, L.A.; Kulyk, V. On the concept of selection of steels for high-strength railroad wheels. Mater. Sci. 2013, 48, 697–703. [Google Scholar] [CrossRef]
- Andreiko, I.; Kulyk, V.; Ostash, O.P. Resistance of steels of railroad wheels to corrosion-fatigue fracture. Mater. Sci. 2012, 47, 608–612. [Google Scholar] [CrossRef]
- Qi, Y.; Dai, H.; Song, C.; Qu, S. Shaking analysis of high-speed train’s carbody when cross lines. J. Mech. Sci. Technol. 2019, 33, 1055–1064. [Google Scholar] [CrossRef]
- Braghin, F.; Lewis, R.; Dwyer-Joyce, R.; Bruni, S. A mathematical model to predict railway wheel profile evolution due to wear. Wear 2006, 261, 1253–1264. [Google Scholar] [CrossRef]
- Dirks, B.; Enblom, R.; Berg, M. Prediction of wheel profile wear and crack growth—comparisons with measurements. Wear 2016, 366–367, 84–94. [Google Scholar] [CrossRef]
- Tao, G.-Q.; Du, X.; Zhang, H.-J.; Wen, Z.-F.; Jin, X.-S.; Cui, D.-B. Development and validation of a model for predicting wheel wear in high-speed trains. J. Zhejiang Univ.-Sci. A 2017, 18, 603–616. [Google Scholar] [CrossRef]
- Wang, Z.; Wang, R.; Crosbee, D.; Allen, P.; Ye, Y.; Zhang, W. Wheel wear analysis of motor and unpowered car of a high-speed train. Wear 2019, 444–445, 203136. [Google Scholar] [CrossRef]
- Cui, D.; Li, L.; Wang, H.; Wen, Z.; Xiong, J. High-speed EMU wheel re-profiling threshold for complex wear forms from dynamics viewpoint. Wear 2015, 338–339, 307–315. [Google Scholar] [CrossRef]
- Wang, J.; Song, C.; Wu, P.; Dai, H. Wheel re-profiling interval optimization based on dynamic behavior evolution for high speed trains. Wear 2016, 366–367, 316–324. [Google Scholar] [CrossRef]
- Gan, F.; Dai, H.; Gao, H.; Chi, M. Wheel–rail wear progression of high speed train with type S1002CN wheel treads. Wear 2015, 328–329, 569–581. [Google Scholar] [CrossRef]
- UIC Code519; Method for Determining the Equivalent Conicity, 1st ed. International Union of Railways: France, Paris, December 2004.
- GB/T 5599; Specification for Dynamic Performance Assessment and Testing Verification of Rolling Stock. Ministry of Railways of the People’s Republic of China: Beijing, China, 2019.
- TB 10621-2014; Code for Design of High Speed Railway. National Railway Administration of the People’s Republic of China: Beijing, China, 2015.
- Ekberg, A.; Kabo, E.; Andersson, H. An engineering model for prediction of rolling contact fatigue of railway wheels. Fatigue Fract. Eng. Mater. Struct. 2002, 25, 899–909. [Google Scholar] [CrossRef]
Publisher’s Note: MDPI stays neutral with regard to jurisdictional claims in published maps and institutional affiliations. |
© 2022 by the authors. Licensee MDPI, Basel, Switzerland. This article is an open access article distributed under the terms and conditions of the Creative Commons Attribution (CC BY) license (https://creativecommons.org/licenses/by/4.0/).