Abstract
A serious issue in the preparation of Al2O3 coatings by cathode plasma electrolytic deposition (CPED) is that the coatings have a porous structure, which is detrimental to their protective performance. Therefore, to address this problem, SiC nanoparticles are incorporated into the Al2O3 coating in this study. A series of Al2O3–SiC composite coatings are efficaciously prepared on the surface of 316L stainless steel by CPED. The microstructures, compositions and phase components of the composite coatings are characterized; the electrochemical corrosion resistance and tribological behavior are evaluated; and the mechanism of SiC nanoparticles in the coating formation process is discussed in detail. The results indicate that the Al2O3 coating prepared by CPED consists of α-Al2O3 and γ-Al2O3, and the former is the main crystalline phase. With the incorporation of SiC nanoparticles in the coating, the content of α-Al2O3 gradually decreases, almost disappearing, accompanied by an increase in γ-Al2O3 as the main crystalline phase. The incorporation of SiC nanoparticles significantly reduces the surface irregularity and roughness of Al2O3 coatings and remarkably improves the corrosion resistance and wear resistance of the Al2O3 coatings. The improvement in corrosion resistance and anti-wear properties can be explained by the fact that the SiC nanoparticles effectively weaken electrical breakdown and increase the compactness of the coatings.
1. Introduction
Plasma electrolysis technology is an advanced surface treatment method combining traditional electrolysis and atmospheric plasma technology [1,2]. Because the entire electrolysis process is carried out in a liquid-phase environment, the technology is neither limited by the shape of the substrate, nor does it require the substrate to be operated at high temperature, which is detrimental to the performance of the substrate itself [3]. With the advantages of high processing efficiency and easy operation, plasma electrolysis technology has become a research hotspot in the field of coating preparation. According to the connection of the workpiece to the cathode or anode of the power supply, the plasma electrolysis technology can be classified as cathodic plasma electrolysis (CPE) or anodic plasma electrolysis (APE) technology, respectively [4]. Anodic plasma electrolysis, commonly known as plasma electrolytic oxidation or micro-arc oxidation, has been used to synthesize ceramic coatings with strong wear resistance, corrosion resistance, biocompatibility, photocatalysis or electrical insulation on valve metals (aluminum, magnesium, titanium, etc.) or their alloys [5]. During the process of anodic plasma electrolysis, the substrates are directly involved in the plasma chemical reaction, and the coatings are usually formed by in situ oxidation of the substrates [6]. Thus, the components of coatings obtained by the APE method are mainly composed of oxides of the substrate material itself [7]. A concept closely related to APE is “valve metal”, which means that the current can only flow in one direction in the metal-oxide layer-electrolyte system [8]. The understanding is that the metal is used as the anode, and the oxide layer has a blocking effect on the current. When the electric field strength is high enough, electrical breakdown occurs, accompanied by plasma discharge. The oxide layer of non-valve metals cannot block the current, so plasma discharge cannot occur. Therefore, the APE method is usually applied for the valve metal or its alloy, often powerless for non-valve metals, such as ferrous metals [9].
In contrast to APE, CPE is free from the limitations of valve metals, and it is suitable for most conductive substrates. To date, CPE technology has been employed for surface cleaning, saturation layer preparation, nanostructure fabrication and coating preparation [4]. Lin et al. [10] utilized CPE technology to clean the surface of stainless steel 316. Belkin et al. [11] reviewed CPE methods that use carburizing, nitriding and nitrogen carburizing (plasma electrolytic saturation). Aliofkhazraei et al. [12] reviewed the characterization of nanostructured layers and the mechanism of CPE technology. Cathode plasma electrolytic deposition (CPED), the deposition of coatings by CPE technology, has potential applications in the field of coating preparation due to its advantages of fast growth, low cost, adjustable coating composition and ease of operation [13,14]. CPED technology has been used to prepare various coatings, such as ceramic coatings, metal coatings and diamond-like coatings, etc. The preparation of ceramic coatings, mainly oxide ceramics, is the most common use. For example, Wang et al. [15] fabricated Al2O3 coatings on NiTi alloys with the CPED method. Li et al. [16] deposited Pd-doped Y3Al5O12 thermal barrier coatings (TBCs) with CPED technology. Ji et al. [17] prepared CeO2 coating with the CPED method for corrosion protection of AZ31 magnesium alloy. Wang et al. [18] applied CPED technology to prepare diamond-like carbon (DLC) films on 316L stainless steel substrates, which exhibited good wear resistance. Lin et al. [4] deposited a nanosilver coating using the CPE technique for application on stainless steel surfaces to achieve hydrophobic properties.
Ceramic coatings synthesized by CPED usually exhibit uniform microstructure, strong adhesion, excellent high-temperature oxidation resistance, wear resistance, corrosion resistance and excellent biocompatibility [19,20]. Alumina (Al2O3) is one of the most widely used coatings in various applications, such as electronics, aerospace and aviation industries, owing to its high dielectric constant and good wear resistance. However, it was found that an Al2O3 coating prepared by CPED has a typical porous structure due to the severe plasma discharge during coating preparation, which reduces its applicability as a protective coating [21]. Therefore, it is of great significance to develop a simple and effective method to reduce the porosity Al2O3 coatings prepared by CPED.
Previous research showed that the introduction of noble metals [22,23], rare earth oxides [24,25] and modified particles [26] was conducive to improving the compactness and performance of Al2O3 coatings. Wang et al. [23] introduced Pt into an Al2O3 coating by adding H2PtCl6·6H2O into the electrolyte. Liu et al. [25] prepared ZrO2-doped Al2O3 coatings, where ZrO2 was derived from Zr(NO3)4 in the electrolyte. The introduction of noble metals and rare metal oxides usually requires chemical reactions in the CPED process to generate them, whereas the introduction of modified particles does not require chemical reactions, and the modified particles can be added directly to the electrolyte. As far as we know, the current researches on introducing modified particles for CPED are extremely limited. Although Liu et al. [26] studied the effect of SiC particles of different sizes on the microstructure and wear resistance of Al2O3 coatings and expounded the electrical behavior of the coating deposition process. In fact, the electrolyte of the ethanol system is more suitable for the CPED process due to the weaker plasma discharge in ethanol than in water. However, SiC nanoparticles have not been introduced into the electrolyte of an ethanol system, and the role of SiC in the coating formation process is not fully understood.
Based on the above background, in the present work, Al2O3–SiC composite coatings are prepared on the surface of 316L stainless steel by adding SiC nanoparticles into the electrolyte of an ethanol system via the CPED method. The effect of SiC content on phase component, microstructure, corrosion resistance and tribological properties of the coatings are systematically investigated. The related mechanism of SiC nanoparticles in electrical breakdown during the coating formation process is discussed. This study is expected to provide a new strategy for the preparation of high-performance oxide coatings at a low cost.
2. Materials and Methods
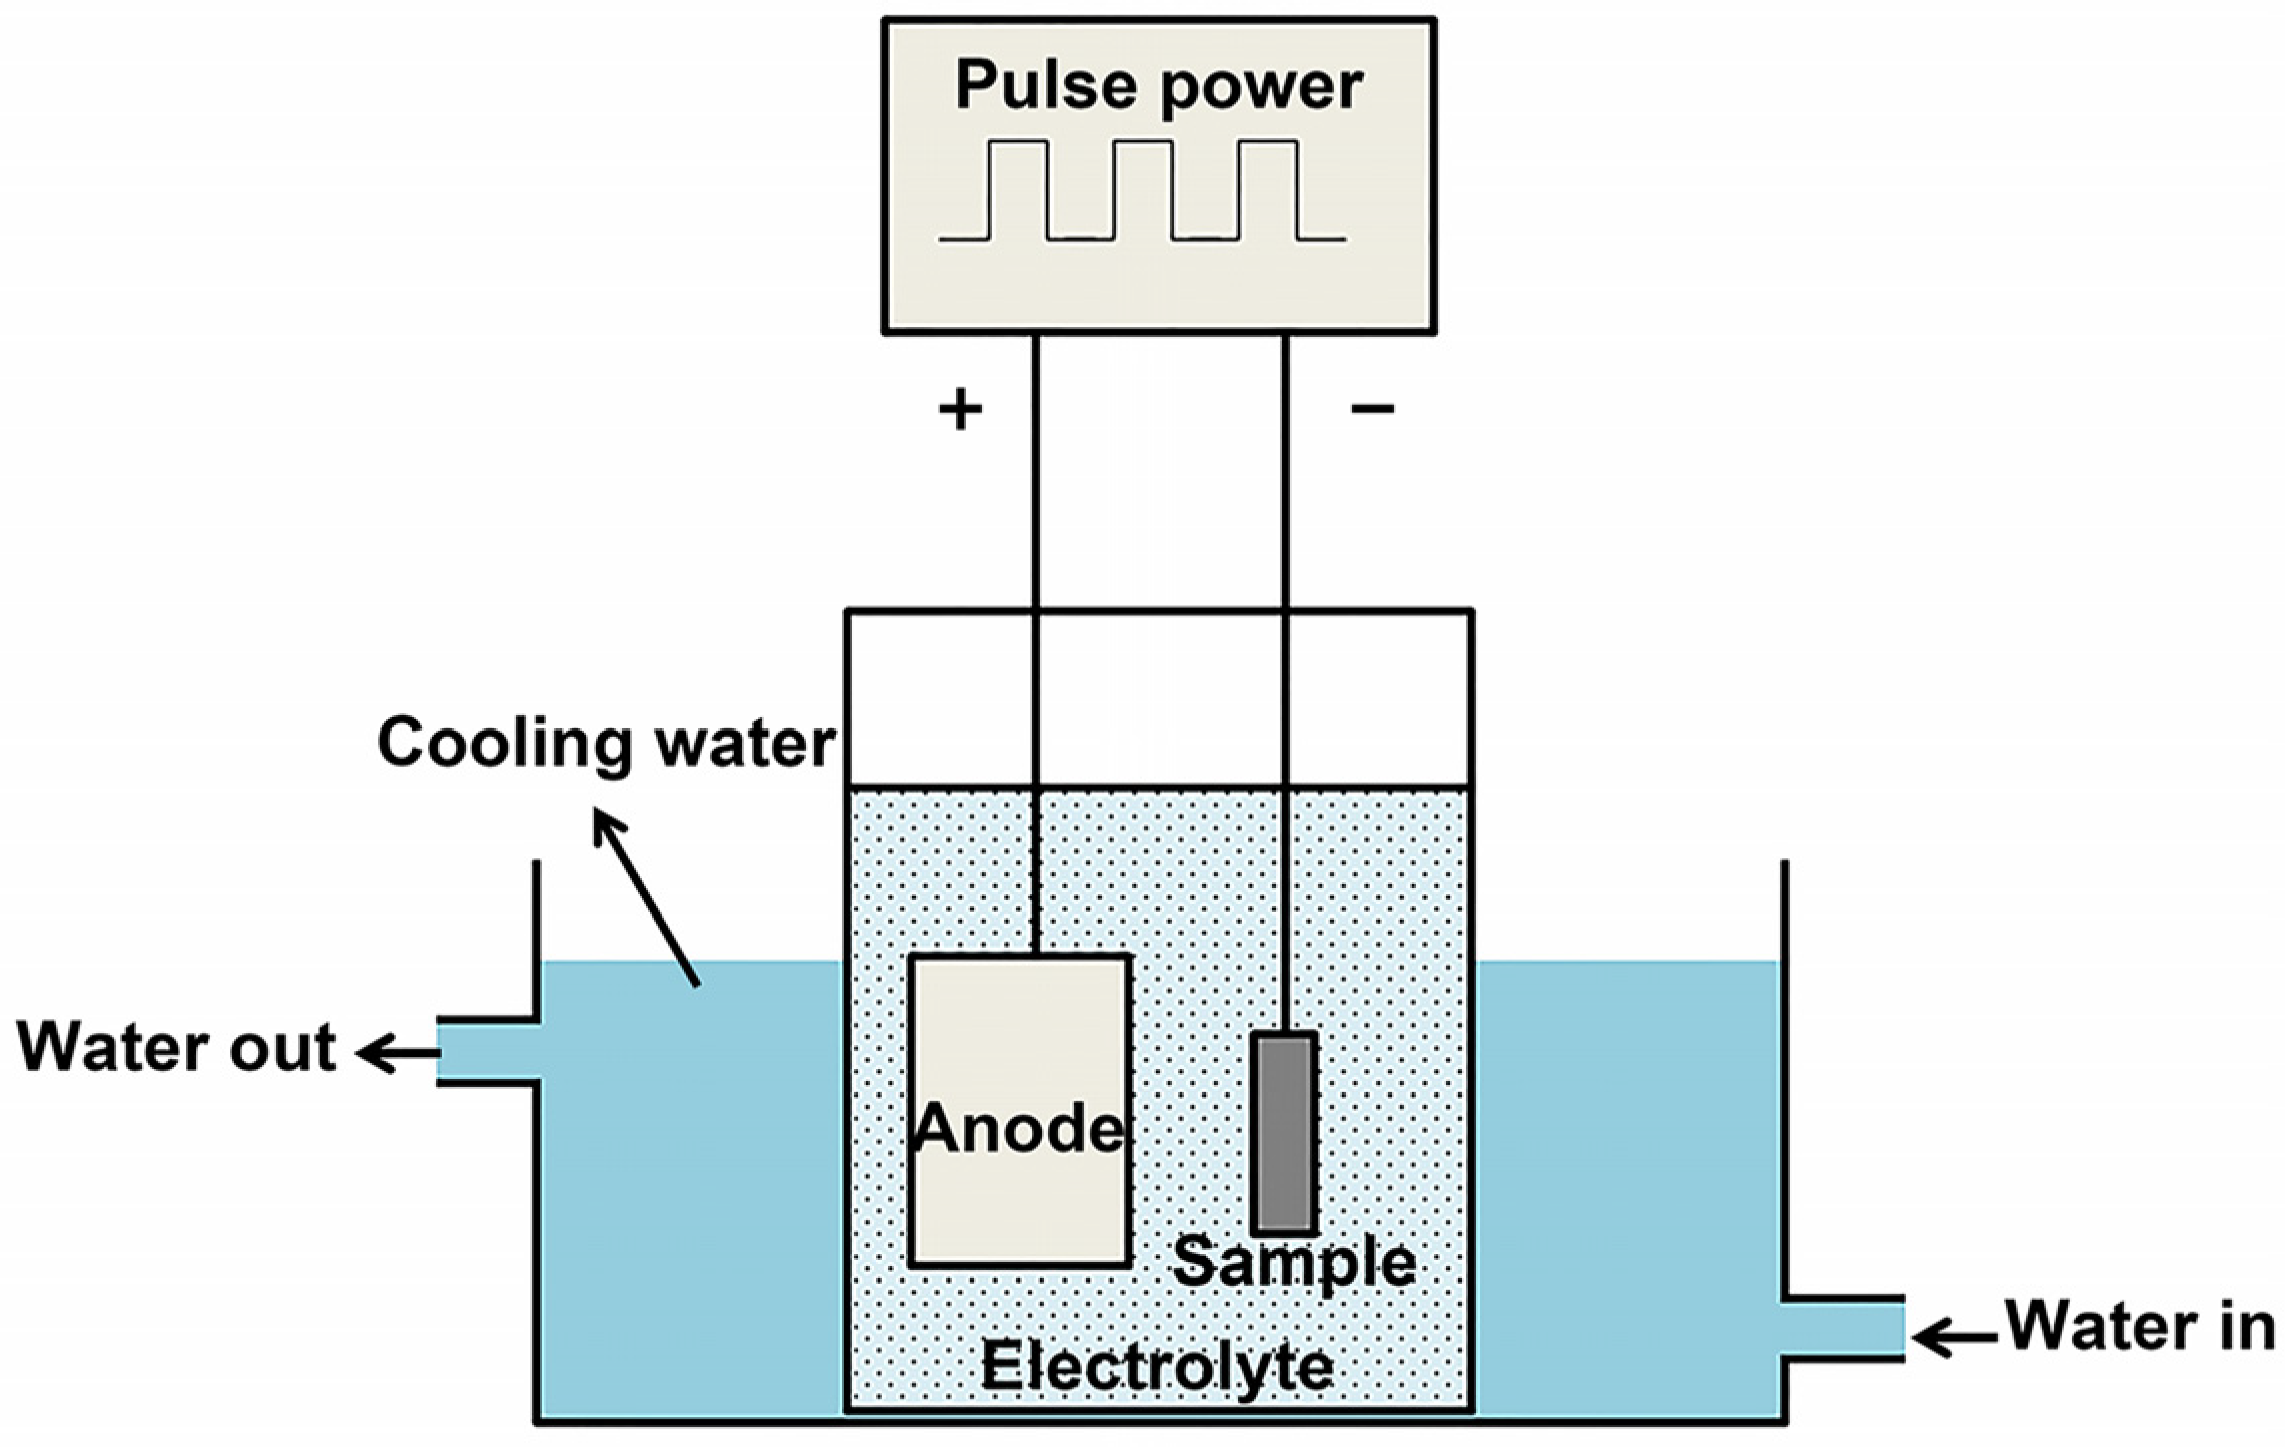
2.1. Coating Preparation
A disc-shaped piece of 316L stainless steel with dimensions of ϕ25 mm × 2 mm was utilized as the cathode, and its chemical composition is shown in Table 1. The 316L stainless steel was polished with 600# sandpaper and then ultrasonically cleaned with deionized water and absolute ethanol. A 200 mm × 100 mm × 10 mm graphite plate was used as the anode. The electrolyte system used for CPED was an anhydrous ethanol solution of aluminum nitrate, and its specific compositions are shown in Table 2. The average particle size of the SiC nanoparticles used in the experiment was approximately 40 nm.
Table 1.
Chemical compositions of 316L stainless steel (wt.%).
Table 2.
Electrolyte compositions.
A 30 kW single-pulse power supply (liquid-phase plasma 20, Nanjing Haorang Environmental Protection Technology Co., Ltd., Nanjing, China) was used in CPED with a stable voltage of 320 V. The pulse frequency was controlled at 750 Hz, with a duty ratio of 10% and a deposition time of 40 min. A water-circulating cooling system was used to control the temperature of the electrolyte during the experiment. The whole CPED experimental device is shown in Figure 1. The obtained samples were rinsed with sequential deionized water and anhydrous ethanol and dried in an oven.
Figure 1.
Schematic diagram of the CPED experimental device.
2.2. Microstructural Characterization
The phase components were detected by X-ray diffraction (XRD, Bruker D8 Advance, Bruker, Karlsruhe, Germany) using Cu Kα radiation over the 2θ scan range of 10°–90° with a step size of 0.02°. To further differentiate the phase components, Raman spectroscopy (Ram, inVia Qontor, Renishaw, Wotton-under-Edge, UK) and Fourier transform infrared spectroscopy (FTIR, Nicolet iS50, Thermo Fisher Scientific, Waltham, MA, USA) were used to characterize the samples. The surface and cross-sectional morphologies of the as-synthesized samples were characterized by scanning electron microscopy (SEM, SU3500, Hitachi, Tokyo, Japan), and the elemental distribution on the surface of the samples was analyzed by the accompanying energy dispersive spectroscopy (EDS, Oxford Instruments, Oxford, UK). The surface roughness (Sq) of the samples was evaluated by a white-light interference three-dimensional topography instrument (1000WLI, AEP Technology Company, Silicon Valley, CA, USA), and the final result was the average value of five repeated measurements. Here, Sq is represented by the root mean square height of each point in a defined region, which is equivalent to the standard deviation of the height.
2.3. Electrochemical Corrosion Test
The electrochemical corrosion properties of the samples were tested with an electrochemical workstation (CHI660E, Shanghai Chenhua Instrument Co., Ltd., Shanghai, China). Electrochemical tests included electrochemical impedance spectroscopy (EIS) and a potentiodynamic polarization test. The samples were used as working electrodes, with an area of 100 mm2, saturated calomel electrode as reference electrode and Pt mesh (20 mm × 20 mm) as the auxiliary electrode, and the corrosion medium was 3.5 wt.% NaCl solution. In order to stabilize the open-circuit potential (OCP) of the sample, it needs to be immersed in the solution for 30 min prior to the actual measurement. The EIS test was performed at the OCP, with a load disturbance signal of 10 mV AC amplitude in a frequency range of 10−2 Hz to 105 Hz. The equivalent circuit was obtained using Nyquist plots. During the potentiodynamic polarization test, the open-circuit potential of the sample to be tested was selected as the center, the scanning potential range was OCP ± 300 mV and the scanning speed was 1 mV/s. The corrosion potential (Ecorr), corrosion current density (icorr) and polarization resistance (Rp) of the sample were obtained from the potentiodynamic polarization curve. The corrosion rate (vcorr) can be calculated according to the corrosion current density (icorr) with the following formula [27]:
where A/z denotes the electrochemical equivalent (because Fe is the most abundant component in 316L stainless steel, only Fe is considered here: A(Fe) = 55.85 g/mol and z = 2), and ρ represents density (for Fe, ρ = 7.5 g/cm3).
2.4. Tribological Test
The tribological properties of samples were tested by a ball-on-disc friction and wear tester (HT-500, Lanzhou Zhongke Kaihua Technology Development Co., Ltd., Lanzhou, China). During the friction and wear test, the friction track radius was 2 mm, with a load of 2 N. An Si3N4 ball with a diameter of 4 mm was utilized as the counter-grinding pair. The wear-trace morphologies after the friction test were characterized by a color laser 3D microscope (VK-9700, Keynes, Osaka, Japan).
3. Results and Discussion
3.1. Phase Component and Microstructure of CPED Coating
Figure 2 exhibits the XRD patterns of the samples prepared by CPED in electrolytes without SiC nanoparticles and in electrolytes containing different concentrations of SiC nanoparticles. As seen from Figure 2a, no diffraction peaks of the substrate are detected in any sample, indicating that the coatings have a certain thickness and compactness, which cannot be penetrated by X-rays. The coating prepared in the electrolytes without SiC (sample S0) consists of α-Al2O3 and γ-Al2O3, in which α-Al2O3 is the main phase. The diffraction peaks of the coatings prepared in the SiC-containing electrolytes (samples S5, S10, S15 and S20) correspond to the composition of Al2O3 and SiC. As seen from Figure 2b, with the increased content of SiC nanoparticles in the electrolyte, the intensity of the α-Al2O3 diffraction peak gradually decreases, almost disappearing, whereas the diffraction peak of γ-Al2O3 gradually increases. The formation of α-Al2O3 requires a higher temperature than that required for γ-Al2O3. The phase transformation of Al2O3 was listed as follows [28]:
Figure 2.
XRD patterns of CPED coatings: (a) 10°~90°; (b) 30°~50°.
The change of phase components should be attributed to the incorporation of SiC nanoparticles, resulting in weaker plasma discharge during CPED and insufficient discharge energy to form α-Al2O3.
Figure 3 shows the Raman and FTIR spectra of samples S0, S5 and S20. Because Al2O3 has a strong fluorescence effect in the Raman spectroscopy test, which masks the characteristic peaks caused by vibration, the characteristic peaks of fluorescence are used for characterization. As shown in Figure 3a, the R line (double) produced at about 14,400 cm−1 is a typical characteristic peak of α-Al2O3 [29]. The intensity of the characteristic peak of S0 is the highest, that of S5 is weakened and that of S20 almost disappears. The results from Raman spectra are in agreement with those of XRD. No characteristics Raman peaks of γ-Al2O3 are not detected due to γ-Al2O3 having no Raman activity. According to the decrease in α-Al2O3 content, it can be speculated that γ-Al2O3 increases. Figure 3b presents the FTIR spectra of the samples. According to the SDBS database, the characteristic peaks located at 2925 cm−1, 2855 cm−1, 1469 cm−1 and 1378 cm−1 correspond to Al2O3. The characteristic peak at 3450 cm−1 [30] is caused by the stretching of the O-H bond. The characteristic peak at 812 cm−1 [31] in sample S20 originates from the fundamental vibrations of the Si and C in SiC, indicating the presence of SiC in the sample. The infrared spectral signal of SiC is very weak because SiC is a nanoscale particle with low content in the sample.
Figure 3.
Luminous spectra of CPED coatings: (a) Raman spectra; (b) FTIR spectra.
Figure 4 shows the SEM morphologies of all samples prepared, incorporating different SiC nanoparticles contents. As can be seen from Figure 4a, many pores and crater-like bulges are distributed on the surface of the Al2O3 coating (sample S0). These pores reach tens of microns in size, and the whole surface morphology appears particularly uneven. It should be noted that although there is a large number of pores on the surface of the coating, these pores are not through holes. By peeling off coating from the substrate, it is found that the contact region between the coating and the substrate had relatively high compactness, as shown in Figure 4b. After the introduction of SiC nanoparticles, the surface morphologies of all Al2O3–SiC composite coatings (sample S5, S10, S15 and S20) also possess a typical porous structure similar to that of the Al2O3 coating, as shown in Figure 4c–f. Interestingly, the size of the surface pores or bulges of the Al2O3–SiC composite coating decreases significantly with increasing SiC nanoparticle content, resulting in a relatively even and dense surface. However, with further increase in the concentration of SiC nanoparticles to 20 g/L, the porosity of the coating surface increases slightly, as shown in Figure 4f. The formation of these porous structures is related to the plasma discharge during CPED, which acts as the discharge channels due to the relatively low conductivity of Al2O3. Under the action of the energy of the plasma, the internal sediment ejects outward and cools rapidly in the electrolyte nearby, forming a crater-like structure [32]. The evolution of the Al2O3–SiC composite coating surface can be explained by the following reasons: the dynamic resistance of the electrolyte, which contained SiC nanoparticles, is higher than that of the electrolyte without SiC nanoparticles because it is a suspension. At a constant voltage, the plasma discharge of the Al2O3–SiC composite coating becomes weaker during CPED, and the size of the discharge channel is correspondingly smaller. However, when the content of SiC nanoparticles is too high (sample S20), the coating porosity also increases. This is because the SiC semiconductor possess good conductivity at high electric field strength, leading to an increase in the region of plasma discharge of the coating, thereby increasing the number of discharge channels.
Figure 4.
SEM morphologies of CPED coatings: (a) surface morphology of sample S0; (b) surface morphology of sample S0 in contact with the substrate; (c–f) surface morphologies of samples S5, S10, S15 and S20.
Figure 5 summarizes the surface roughness (Sq) of the Al2O3 coating (sample S0) and Al2O3–SiC composite coatings (samples S5, S10, S15 and S20). As shown in Figure 5, the surface of the Al2O3–SiC composite coatings is smoother than that of the Al2O3 coatings, although the power supply process parameters and deposition time for coating preparation are the same. When increasing the concentration of SiC nanoparticles in the CPED electrolyte from 0 to 15 g/L, the Sq value of the coating decreases from 23.607 ± 1.598 μm to 16.627 ± 0.219 μm. However, when the content of SiC nanoparticles is further increased to 20 g/L, the value of Sq slightly increases. The change in coatings roughness is consistent with the evolution of coatings surface morphologies (Figure 4c–f).
Figure 5.
Surface roughness of CPED coatings with different SiC additions: (a) S0; (b) S5; (c) S10; (d) S15; (e) S20.
Figure 6 shows the nanoscale surface morphology and corresponding element mappings of sample S20. The results show that the composite coating consists of Al, O, Si and C elements. The presence of Si elements indicates that the SiC nanoparticles added to the electrolyte are successfully introduced into the Al2O3 coating. More interestingly, it is clear from Figure 6a that there are many submicron-scale particles accumulated on the coating surface, and the distribution of Si elements indicates that these particles are SiC. This phenomenon suggests that when the concentration of SiC nanoparticles in the electrolyte is too high (20 g/L), SiC nanoparticles are difficult to uniformly disperse in the electrolyte. As a result, these SiC nanoparticles form aggregated submicron-sized particles on the coating surface during CPED. The results in Figure 6 also provide a good explanation for the slightly increased surface roughness of sample S20.
Figure 6.
SEM morphology and elemental mappings of sample S20: (a) nanoscale surface morphology of sample S20; (b–e) Al, O, Si and C mappings; (f) EDS spectrum of the whole area.
The cross-sectional morphologies of sample S0 and S15 coatings were characterized, as shown in Figure 7. It can be seen from Figure 7a that the Al2O3 coating (sample S0) is well bonded to 316L stainless steel substrate, and a large number of dendritic structures and pores are observed. The existence of dendritic structures leads to the loose coating. Notably, the coating near the substrate region still exhibits excellent compactness. Compared with the Al2O3 coating, the dendritic structure of the Al2O3–SiC composite coating (sample S15) is significantly smaller, and the dense layer near the substrate is thicker, as shown in Figure 7b. The average thickness of the two coatings is similar, both approximately 120 μm. Figure 7c shows a typical dendritic structure of the Al2O3 coating, on which pores of varying sizes can be observed. Figure 7d reveals the high magnification cross-sectional morphology of the composite coating, where the compactness is significantly improved compared with the Al2O3 coating, despite the existence of pores and cracks. The dendritic structures are the cross section of crater-like bulges on the coating surface. The uneven pores on the cross section are formed when some gases cannot escape in time during the cooling process of molten Al2O3 during CPED. Moreover, the size of dendritic structures decreased dramatically after the introduction of SiC nanoparticles, which depends on the altered electrical behavior of SiC nanoparticles during CPED.
Figure 7.
Cross-sectional SEM morphologies of CPED coatings: (a) cross section of sample S0; (b) cross section of sample S15; (c) high-magnification image of (a); (d) high-magnification image of (b).
3.2. Electrochemical Corrosion Behavior of CPED Coatings
Figure 8 exhibits the potentiodynamic polarization curves for the Al2O3 coating (sample S0) and the Al2O3–SiC composite coatings (sample S5, S10, S15 and S20). It can be seen from the figure that the corrosion potential of all composite coatings is more positive and the corrosion current density is lower compared with that of Al2O3 coatings, indicating that the incorporation of SiC nanoparticles gives the composite coatings superior corrosion resistance than that of Al2O3 coatings. The corrosion potential (Ecorr), corrosion current density (icorr), polarization resistance (Rp) and corrosion rate (vcorr) of all CPED coatings are presented in Table 3. The corrosion potential and corrosion current density of Al2O3 coating (sample S0) are −0.165 V and 1.716 × 10⁻⁶ A/cm2, respectively. Among all samples, sample S15 exhibits the lowest corrosion current density, with a corrosion potential of −0.039 V and a corrosion current density of 1.118 × 10⁻⁷ A/cm2. Sample S20 shows the most positive corrosion potential (representing the least corrosion tendency), with a corrosion potential of −0.035 V and a corrosion current density of 4.968 × 10⁻⁷ A/cm2. However, the corrosion current densities of all samples are on the order of 10−6 or 10−7, making it difficult to accurately assess the differences in corrosion resistance [27]. The polarization resistance values are calculated to further evaluate the corrosion resistance. The S15 is found to have the best corrosion resistance, with a polarization resistance of 139,600.9 Ω·cm2, which an order of magnitude higher than that of the other samples. The corrosion rate of S15 is 1.36 µm/year, which is the slowest among all samples. As discussed before, although there are many discharge holes on the surface of the coating, these holes do not penetrate the whole coating. Thus, the dense near-substrate area (Figure 7b) can act as a barrier between the corrosion environment and the substrate. The increase in corrosion resistance of the composite coating is due to the introduction of SiC nanoparticles, which leads to the improvement in coating compactness and thickening of the near-substrate dense layer.
Figure 8.
Potentiodynamic polarization curves of all samples.
Table 3.
Results of potentiodynamic polarization test in 3.5 wt.% NaCl solution.
Figure 9 shows the electrochemical impedance plots (Nyquist plots) of the Al2O3 coating (sample S0) and the Al2O3–SiC composite coatings (samples S5, S10, S15 and S20). The radius of capacitance loop characterizes the corrosion resistance of the sample. According to the Nyquist plots, all Al2O3–SiC composite coatings show a larger capacitance loop compared to Al2O3 coatings. Sample S15 exhibits the largest capacitance loop, indicating the best corrosion resistance property. The Nyquist plots were fitted with an equivalent circuit model by Z View software. In this model, Rs is the resistance of the NaCl solution, Rc represents the resistance of the coating and CPEc represents the capacitance of the coating [33]. The Rc value reflects the difficulty of charge transfer in the coating, which is related to the structure of the coating. The fitted R values are listed in Table 4. The Rc values of all Al2O3–SiC composite coatings are larger than that of Al2O3. This shows that the charge is more difficult to transfer after SiC nanoparticles are introduced into the coating because the coating becomes more dense.
Figure 9.
Nyquist plots of all samples.
Table 4.
R values obtained by fitting Nyquist plots with equivalent circuit.
3.3. Tribological Performance of CPED Coating
Figure 10 illustrates the friction coefficients of all coatings over time. It can be seen from Figure 10 that the general trend of the friction coefficient variation for all coatings is similar, first increasing rapidly to a peak, followed by a slow decline and becoming relatively stable. For the Al2O3 coating (sample S0), the initial friction coefficient is about 0.15, then suddenly fluctuates after 4 min and gradually increases to 0.5, finally resting at 0.4. The friction coefficient of the Al2O3 coating obviously fluctuates, and the friction coefficients of all composite coatings become relatively stable after incorporation of SiC nanoparticles. When 5 or 10 g/L SiC nanoparticles are added into the electrolyte, the friction coefficient of the composite coatings (samples S5 and S10) are basically the same as that of the Al2O3 coating, which is approximately 0.4. With a further increase in the concentration of SiC nanoparticles to 15 and 20 g/L, the friction coefficient of the composite coatings (samples S15 and S20) are significantly lower than that of Al2O3 coating. In particular, the friction coefficient of sample S15 is the smallest of all the coatings (approximately 0.3). The tribological behavior is related to the properties and surface roughness of the coating itself [34]. Because the main phase component of all samples is Al2O3, the tribological behavior of coatings is mainly related to surface roughness. After incorporating SiC nanoparticles, the surface of the coating becomes more compact and smoother, with decreased surface roughness, which effectively reduces the friction coefficient.
Figure 10.
Variations in the friction coefficients of different samples during wear tests.
Figure 11 exhibits the 3D morphologies of wear tracks and wear volume of all coatings. It can be seen from Figure 11a that the wear track of the Al2O3 coating (sample S0) is deep and wide, accompanied by a high wear volume, and abrasive particles can also be clearly observed. The calculated wear volume is 2.27 mm3. After incorporating SiC nanoparticles, both the depth and width of the wear track are significantly reduced, which indicates the superior wear resistance conferred by the composite coatings, as shown in Figure 11b–e. It can be seen from Figure 11f that the wear volume of all composite coatings is less than that of that of the Al2O3 coating. In particular, the coating with 15 g/L SiC nanoparticles (sample S15) has the lowest wear volume of 1.24 mm3, which is approximately 45% lower than that of the Al2O3 coating. The reduction in the wear volume of the composite coating is attributed to the improvement in the coating compactness due to the introduction of SiC nanoparticles. The above results amply demonstrate that the incorporation of SiC nanoparticles can improve the tribological properties of the coating, which not only reduces the friction coefficient of the coating but effectively decreases the wear volume under dry sliding conditions.
Figure 11.
3D morphologies and wear volume of CPED coatings: (a–e) wear tracks of samples S0, S5, S10, S15 and S20; (f) wear volume for coatings.
To investigate the wear mechanism of CPED coatings, the wear track morphologies of coatings (sample S0 and S20) and the wear schematic of the coatings are given in Figure 12. As shown in Figure 12a,b, the morphologies of the two wear tracks are similar. The wear track of the Al2O3 coating is wider than that of the composite coating. The details of the wear tracks can are presented in Figure 12c,d. A large number of abrasive particles are found in both wear tracks. Figure 12e illustrates the process of abrasive particle generation, which tend to fracture or spallation at the roots of crater-like bulges near the coating surface. The spallation of bulges results in a series of abrasive wear, which is the most prominent type of wear for CPED coatings.
Figure 12.
SEM morphologies of wear tracks of CPED coatings and schematic diagram of wear process: (a) wear tracks of sample S0; (b) wear tracks of sample S15; (c) high-magnification image of (a); (d) high-magnification image of (b); (e) schematic diagram of wear process of coating.
3.4. Mechanism Analysis of SiC Nanoparticles in CPED Process
The formation process of Al2O3 coatings prepared by CPED is shown in Figure 13. When the stainless steel substrate is immersed in the Al(NO3)3 solution as a cathode and high voltage is applied, many bubbles appear on the surface of the cathode and gradually cover the whole sample, as shown in Figure 13a. Based on the electrochemical reaction process, the cathode experiences a hydrogen evolution and oxygen absorption reaction, which result in the generation of OH−. The Al3+ in the electrolyte migrates to the cathode surface under the electric field and combines with OH− to form hydroxide. The following reactions occur [35,36]:
Figure 13.
Schematic diagram of the formation mechanism of CPED coatings: (a) the generation of bubbles and Al(OH)3; (b) the formation of gas sheath by accumulated bubbles; (c) plasma discharge in the gas sheath; (d) the formation of Al2O3 by calcining Al(OH)3.
As shown in Figure 13b,c, when the applied voltage is high enough, the cathode surface easily forms a gas sheath that consists of H2 and water vapor, and plasma discharge occurs in the gas sheath [16,37,38]. Faint sparks first appear at the edge of the stainless-steel substrate. After a few minutes, the number of sparks gradually increases, and the entire surface of the substrate is covered by jumping stray sparks. The high temperature in the spark discharge region causes several physical and chemical reactions [39]. Hence, as shown in Figure 13d, the Al(OH)3 produced by reaction (6) is calcined and dehydrated to form Al2O3 by the following reaction under the energy of plasma discharge [40]:
In addition, CPED is performed in electrolyte-containing SiC nanoparticles, which are readily dispersed in Al2O3 to form Al2O3–SiC ceramics, accompanied by reactions (3), (4), (5), (6) and (7).
The electrical breakdown behavior (exhibiting plasma discharge) after the formation of a continuous coating directly affects the microstructure of the coating, so it is necessary to analyze it. When continuous Al2O3 coating is generated on the cathode surface, a gas sheath-coating double-layer dielectric is formed [41]. According to the theory of dielectric physics, the gas sheath and coating constitute an equivalent series circuit, and under the cathodic overpotential (U), the electric field strength (E) has the following relationship with the dielectric constant (ε):
where Ec is the electric field strength of the coating, Eg is the electric field strength of the gas sheath, εc is the dielectric constant of the coating, εg is the dielectric constant of the gas sheath, dc is the thickness of the coating and dg is the thickness of the gas sheath. Then, Eg and Ec can be expressed as:
According to Equations (10) and (11), in a gas sheath-coating double-dielectric layer, the electric field strength (E) applied on each layer is inversely proportional to its own dielectric constant (ε). Because the Al2O3 coating is an insulator material, the dielectric constant of the gas sheath (εg) is significantly lower than that of the coating (εg), so the applied electric field strength of the gas sheath (Eg) is higher than that of the Al2O3 coating (Ec). The gas sheath is also much less resistant to electric field breakdown than the Al2O3 coating. Based on the above analysis, the electrical breakdown of the gas sheath precedes the electrical breakdown of the coating. With the electrical breakdown of the gas sheath, the applied voltage is mainly concentrated in the Al2O3 coating. Correspondingly, the electric field strength (Ec) of the Al2O3 coating increases dramatically, also causing electrical breakdown of the coating.
The degree of electrical breakdown of a coating depends on its own dielectric constant and thickness [29]. Previous studies showed that low dielectric constant coatings with a certain thickness had a weaker degree of electrical breakdown. For example, the electrical breakdown of ZrO2 or Cr2O3 coatings is weaker than that of Al2O3 coatings because the dielectric constant of ZrO2 or Cr2O3 coatings is much lower than that of Al2O3 coatings [42]. In our study, the dielectric constant of the Al2O3–SiC composite coating is smaller than that of the Al2O3 coating due to the introduction of the semiconductor SiC nanoparticles. Thus, the electrical breakdown of the Al2O3–SiC composite coating is weaker than that of the Al2O3 coating.
In order to further explain the role of SiC nanoparticles in the electrical breakdown process of the CPED coating, the electronic avalanche model was used in this study. Figure 14 depicts the electronic avalanche models of the Al2O3 coating and SiC–Al2O3 composite coating. As can be seen in Figure 14a, the free electrons in the coating collide with other atoms in the coating under the acceleration of the electric field to produce new electrons. In this process, the electrons follow the 2n law to increase, where n is the number of collisions. When these increasing electrons reach a large enough number, complete avalanche breakdown can occur, resulting in electrical discharge and formation of an electronic avalanche channel. As seen in Figure 14b, these dispersed SiC nanoparticles can absorb free electrons, and the electronic avalanche path is effectively suppressed. The current in the electrical breakdown process can be divided into ionic current and electronic current. The ionic current maintains the thickening of the film, and the electronic current causes the breakdown of the coating [43]. Because the electron current in the Al2O3–SiC composite coating is weaker than that in the Al2O3 coating, the degree of electrical breakdown in the composite coating is weaker. This also explains why Al2O3–SiC composite coating has a denser microstructure than the Al2O3 coating.
Figure 14.
Electronic avalanche model diagram: (a) Al2O3 coating; (b) Al2O3–SiC composite coating.
4. Conclusions
In the present work, a series of Al2O3–SiC composite coatings were prepared on the surface of 316L stainless steel by cathode plasma electrolytic deposition (CPED) method using Al(NO3)3 anhydrous ethanol solution with SiC nanoparticles as electrolyte. The effects of SiC nanoparticles addition on the phase component, microstructure, corrosion resistance and wear resistance of the coatings were systematically studied. The following conclusions can be drawn:
- (1)
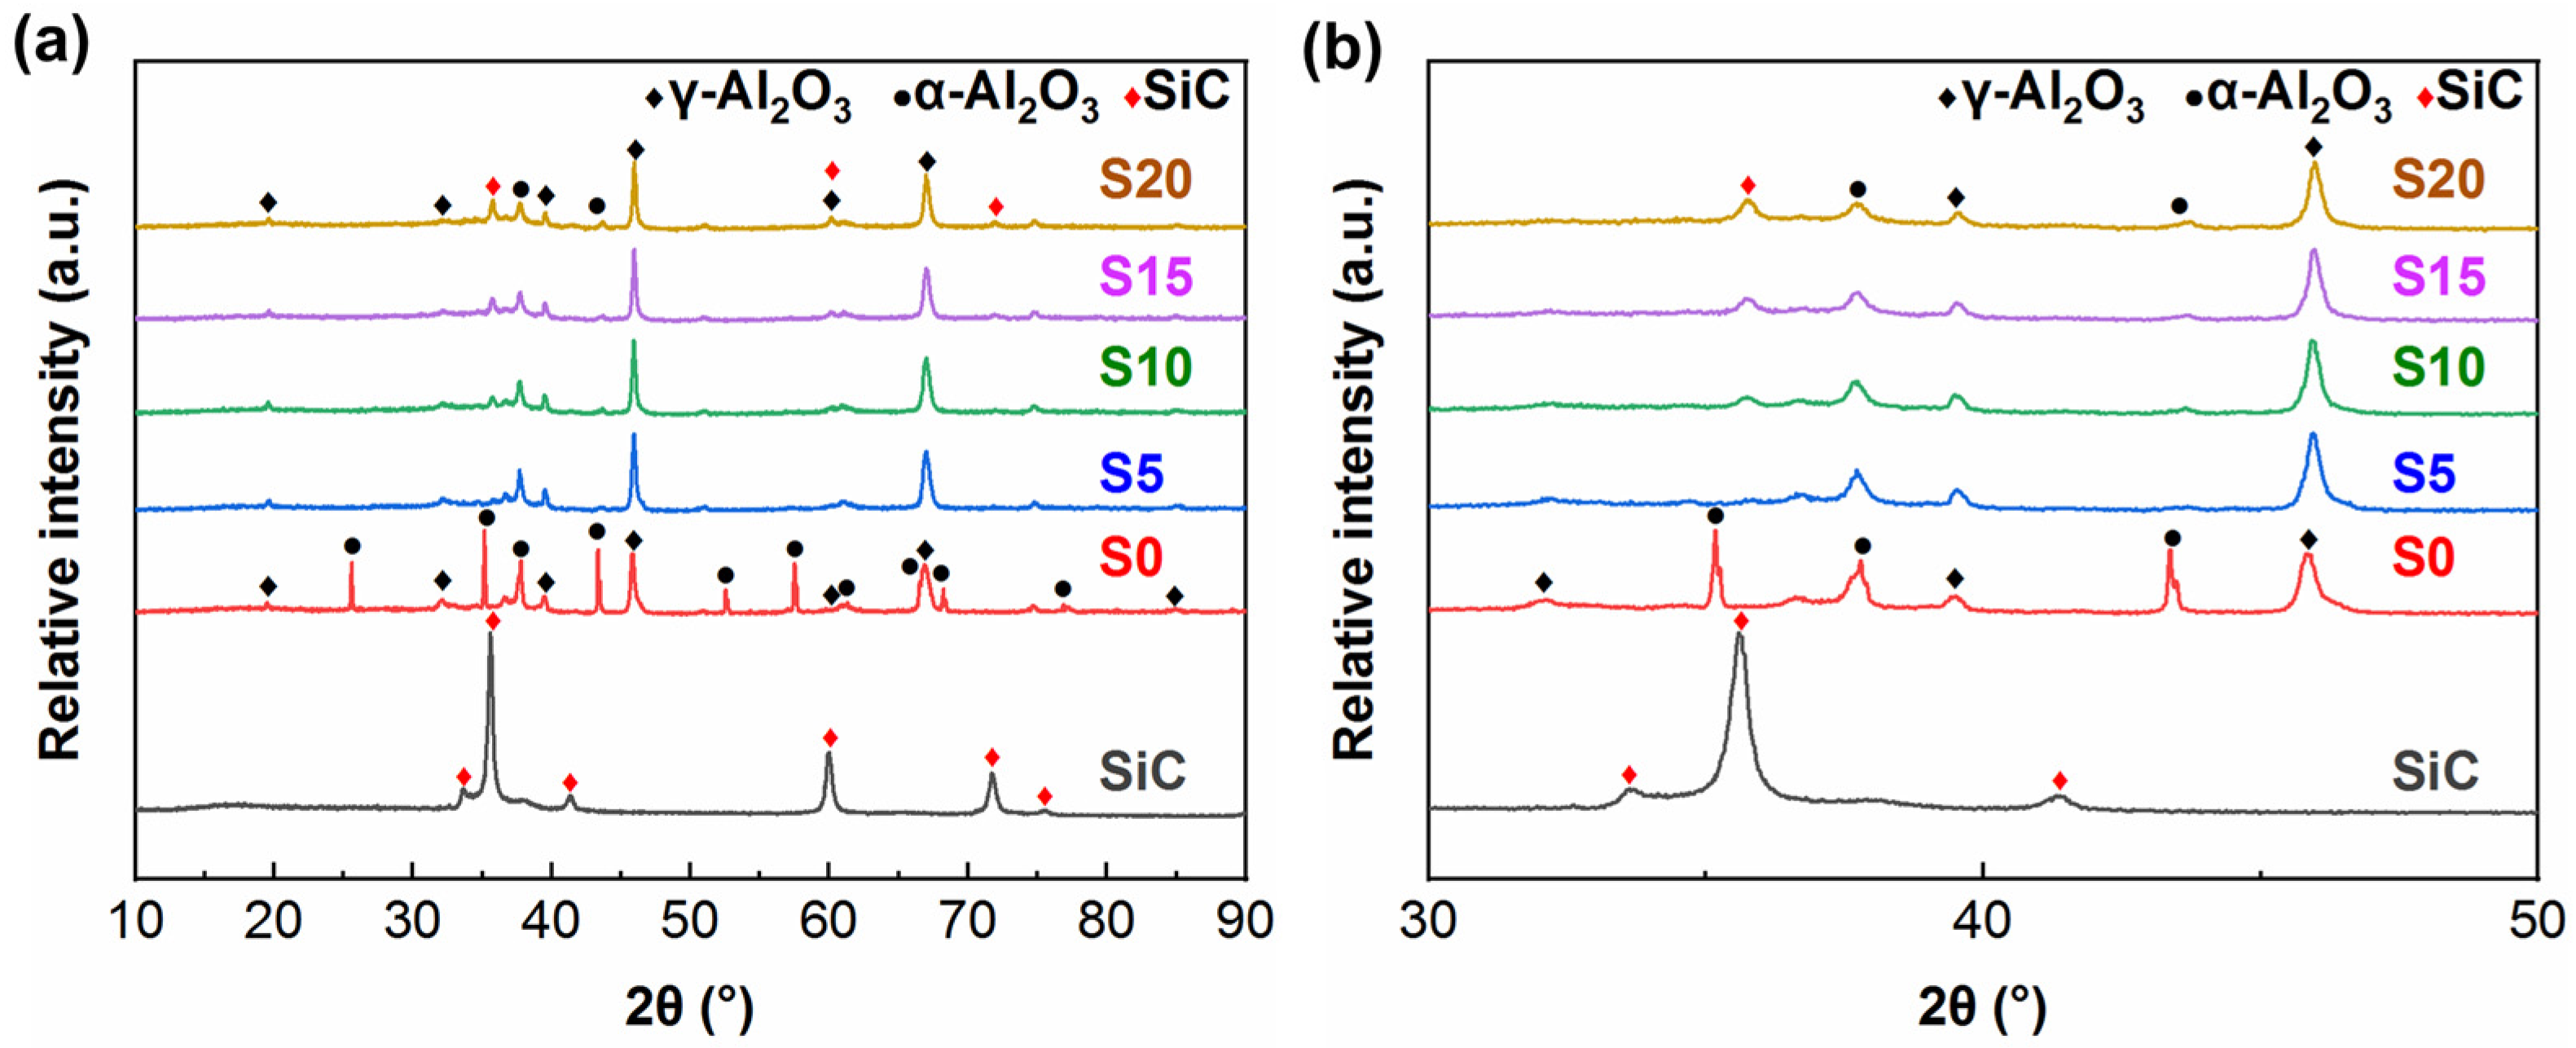
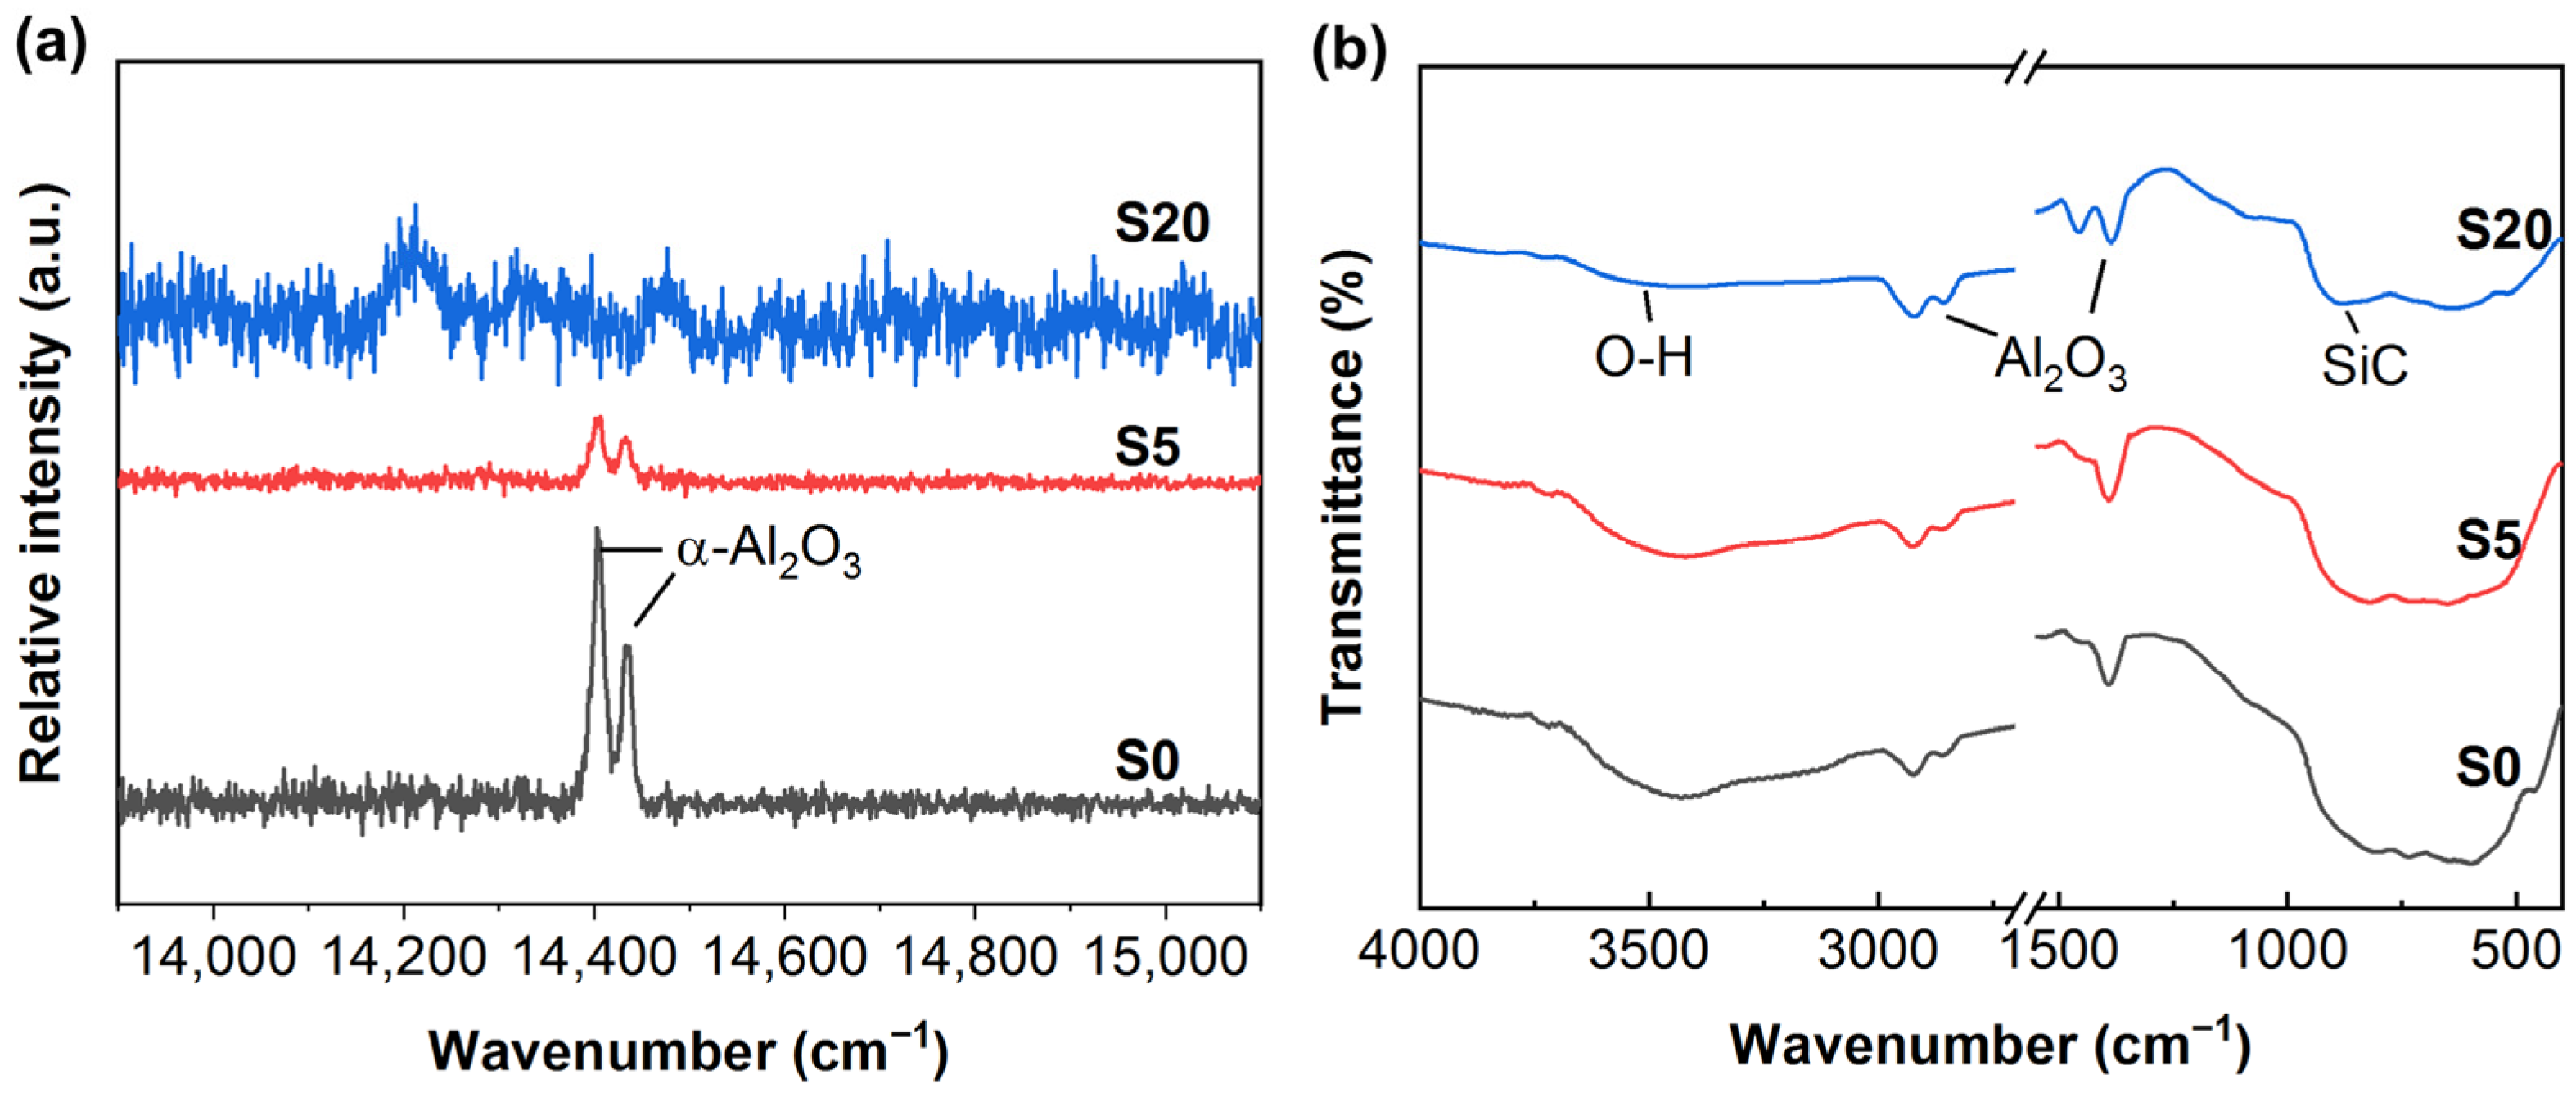
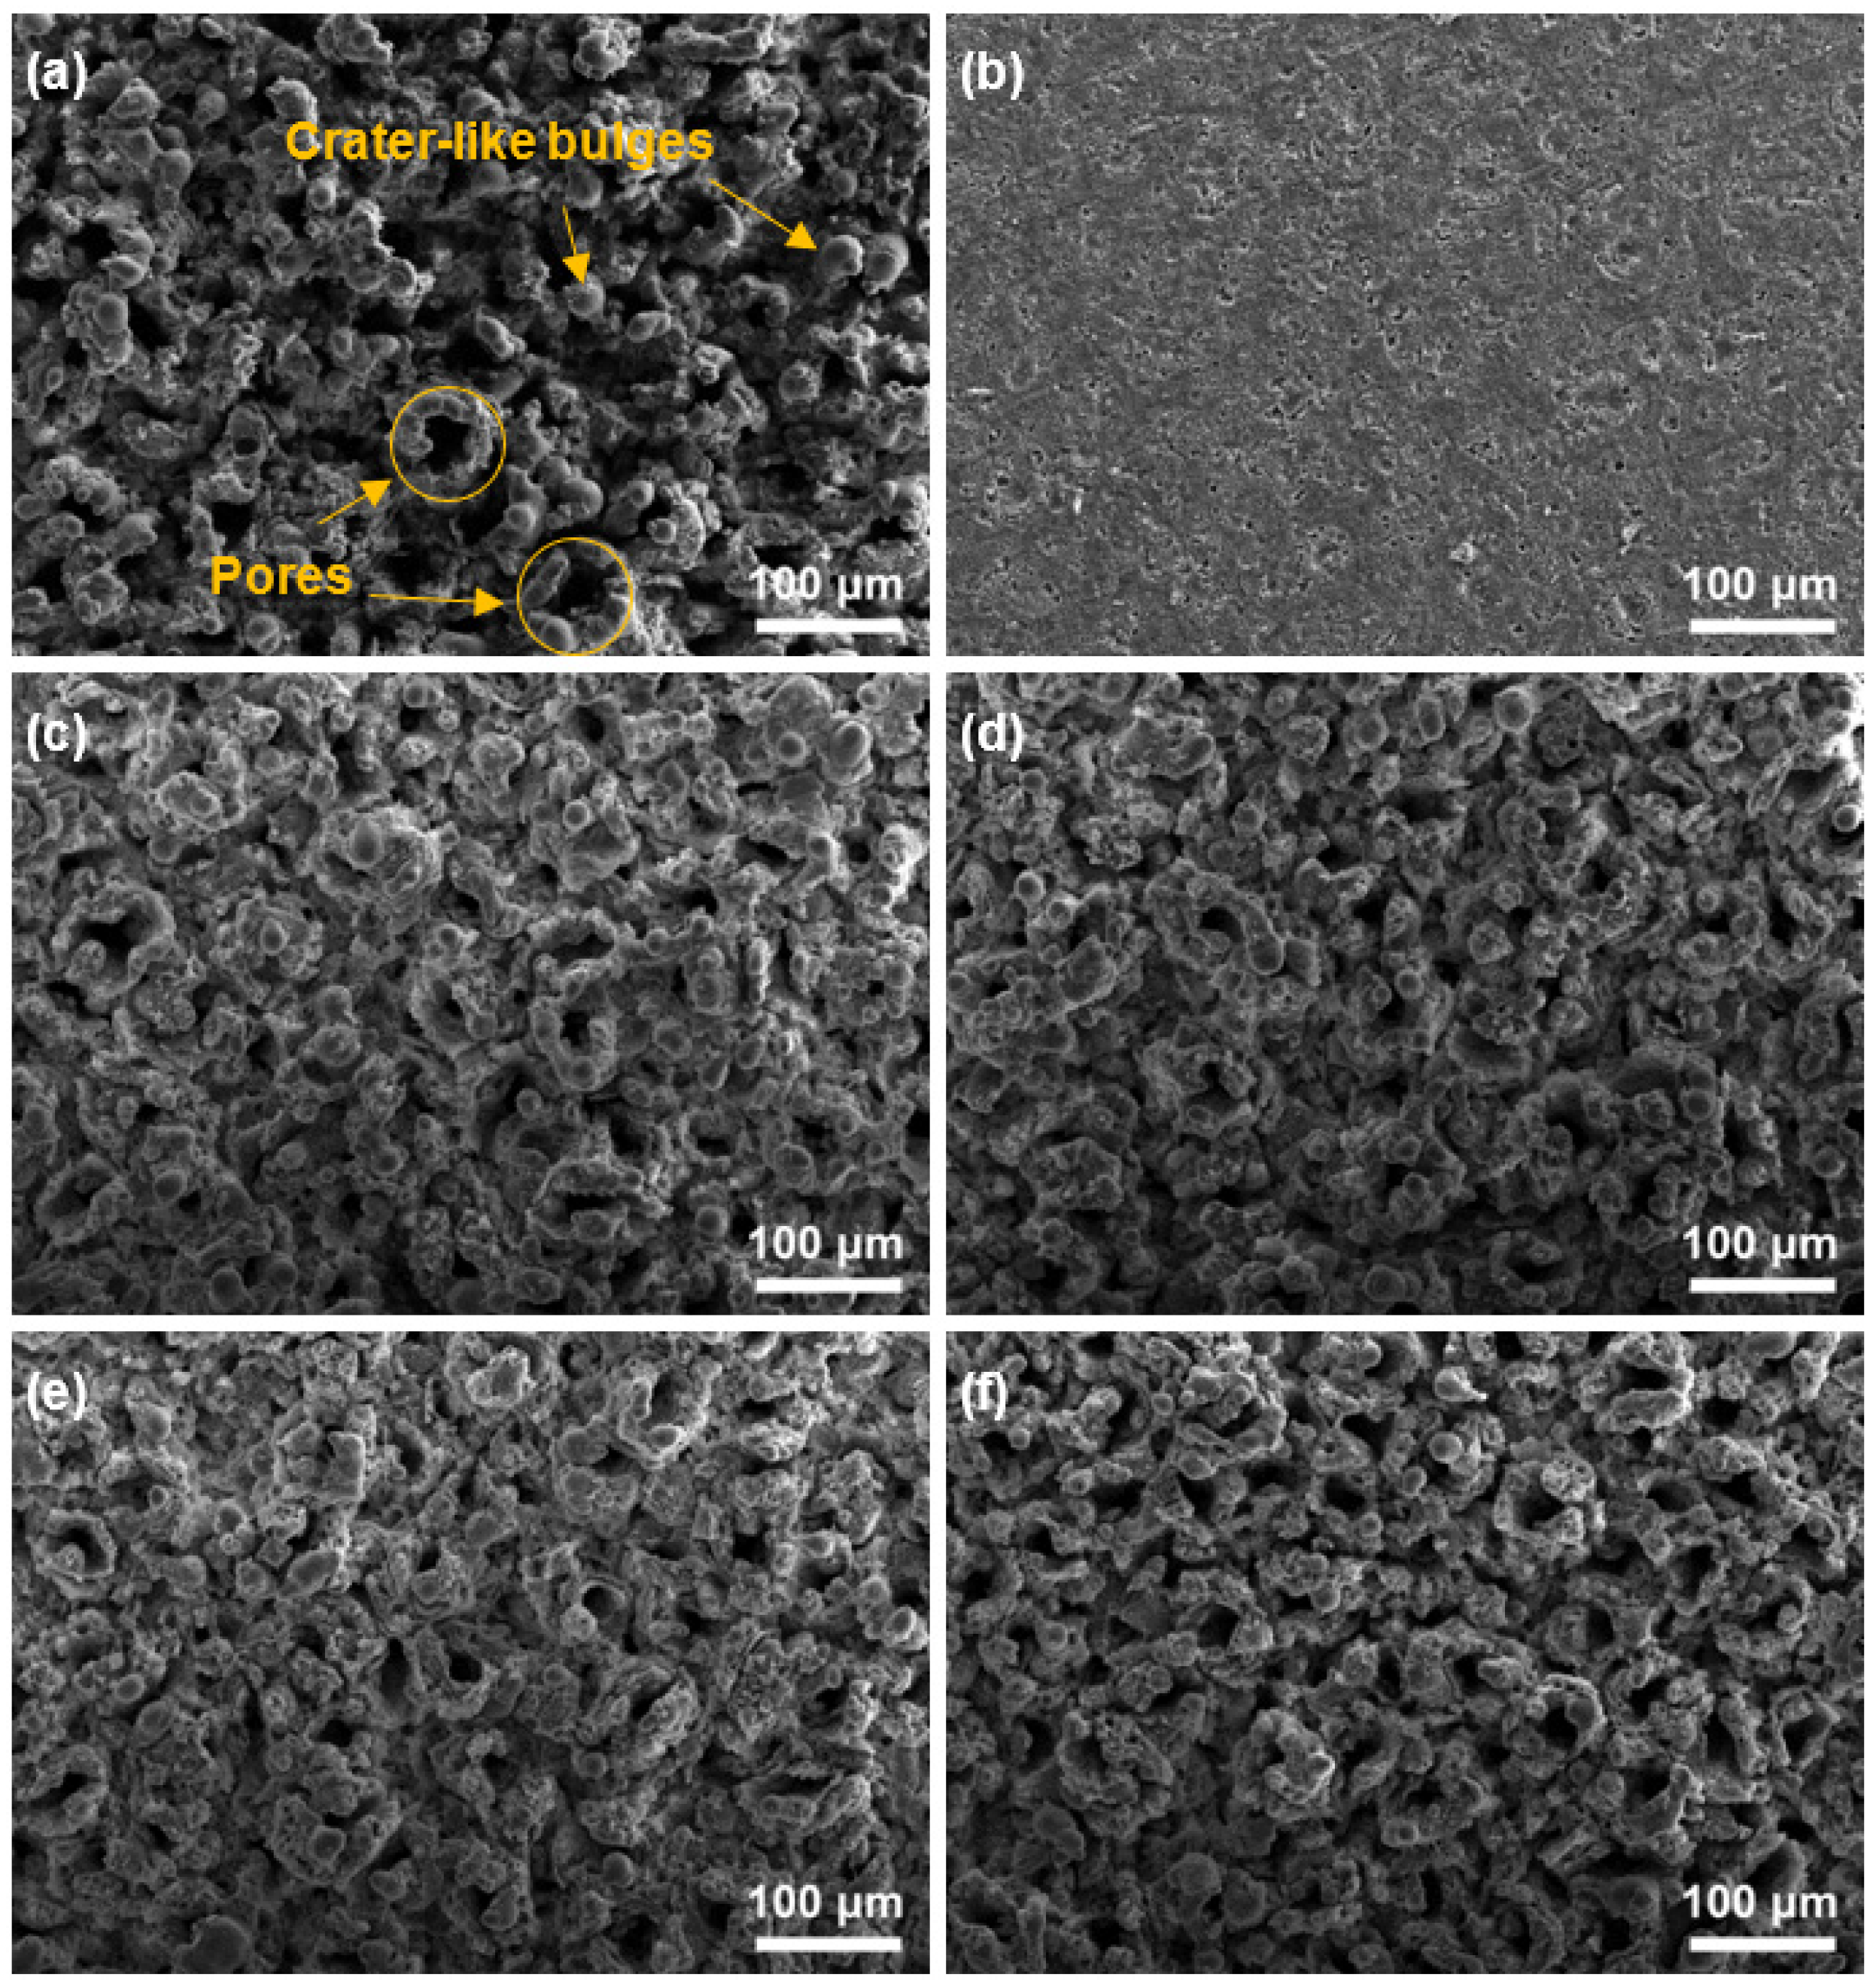
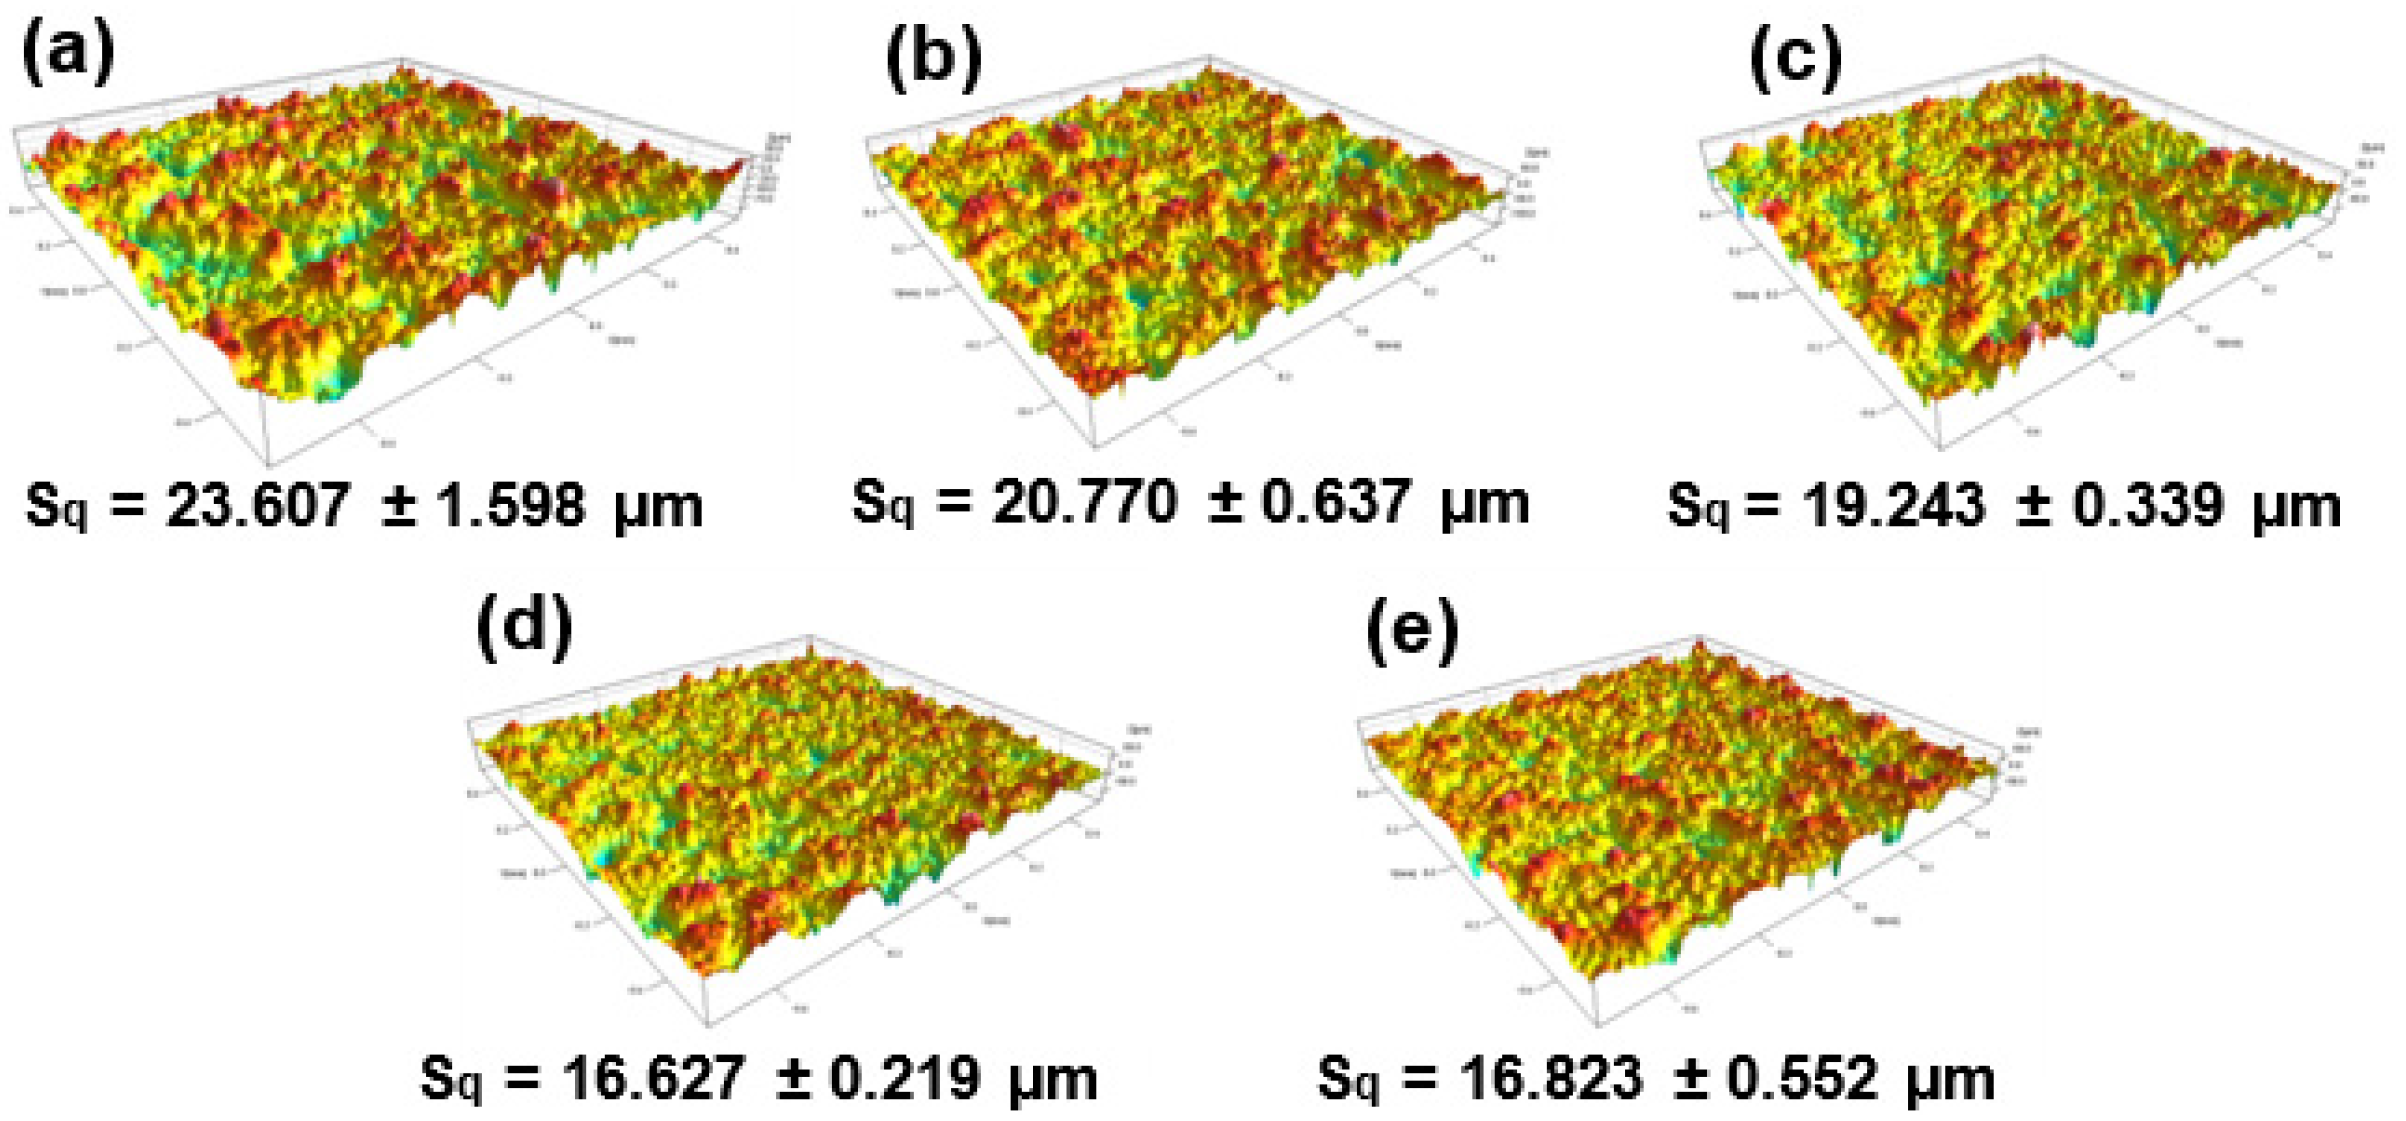
- The main phase of the coatings changes from α-Al2O3 to γ-Al2O3 when SiC nanoparticles are incorporated into the Al2O3 coatings. Compared with the Al2O3 coating, Al2O3–SiC composite coatings have a more uniform surface, lower surface roughness and more compact structure.
- (2)
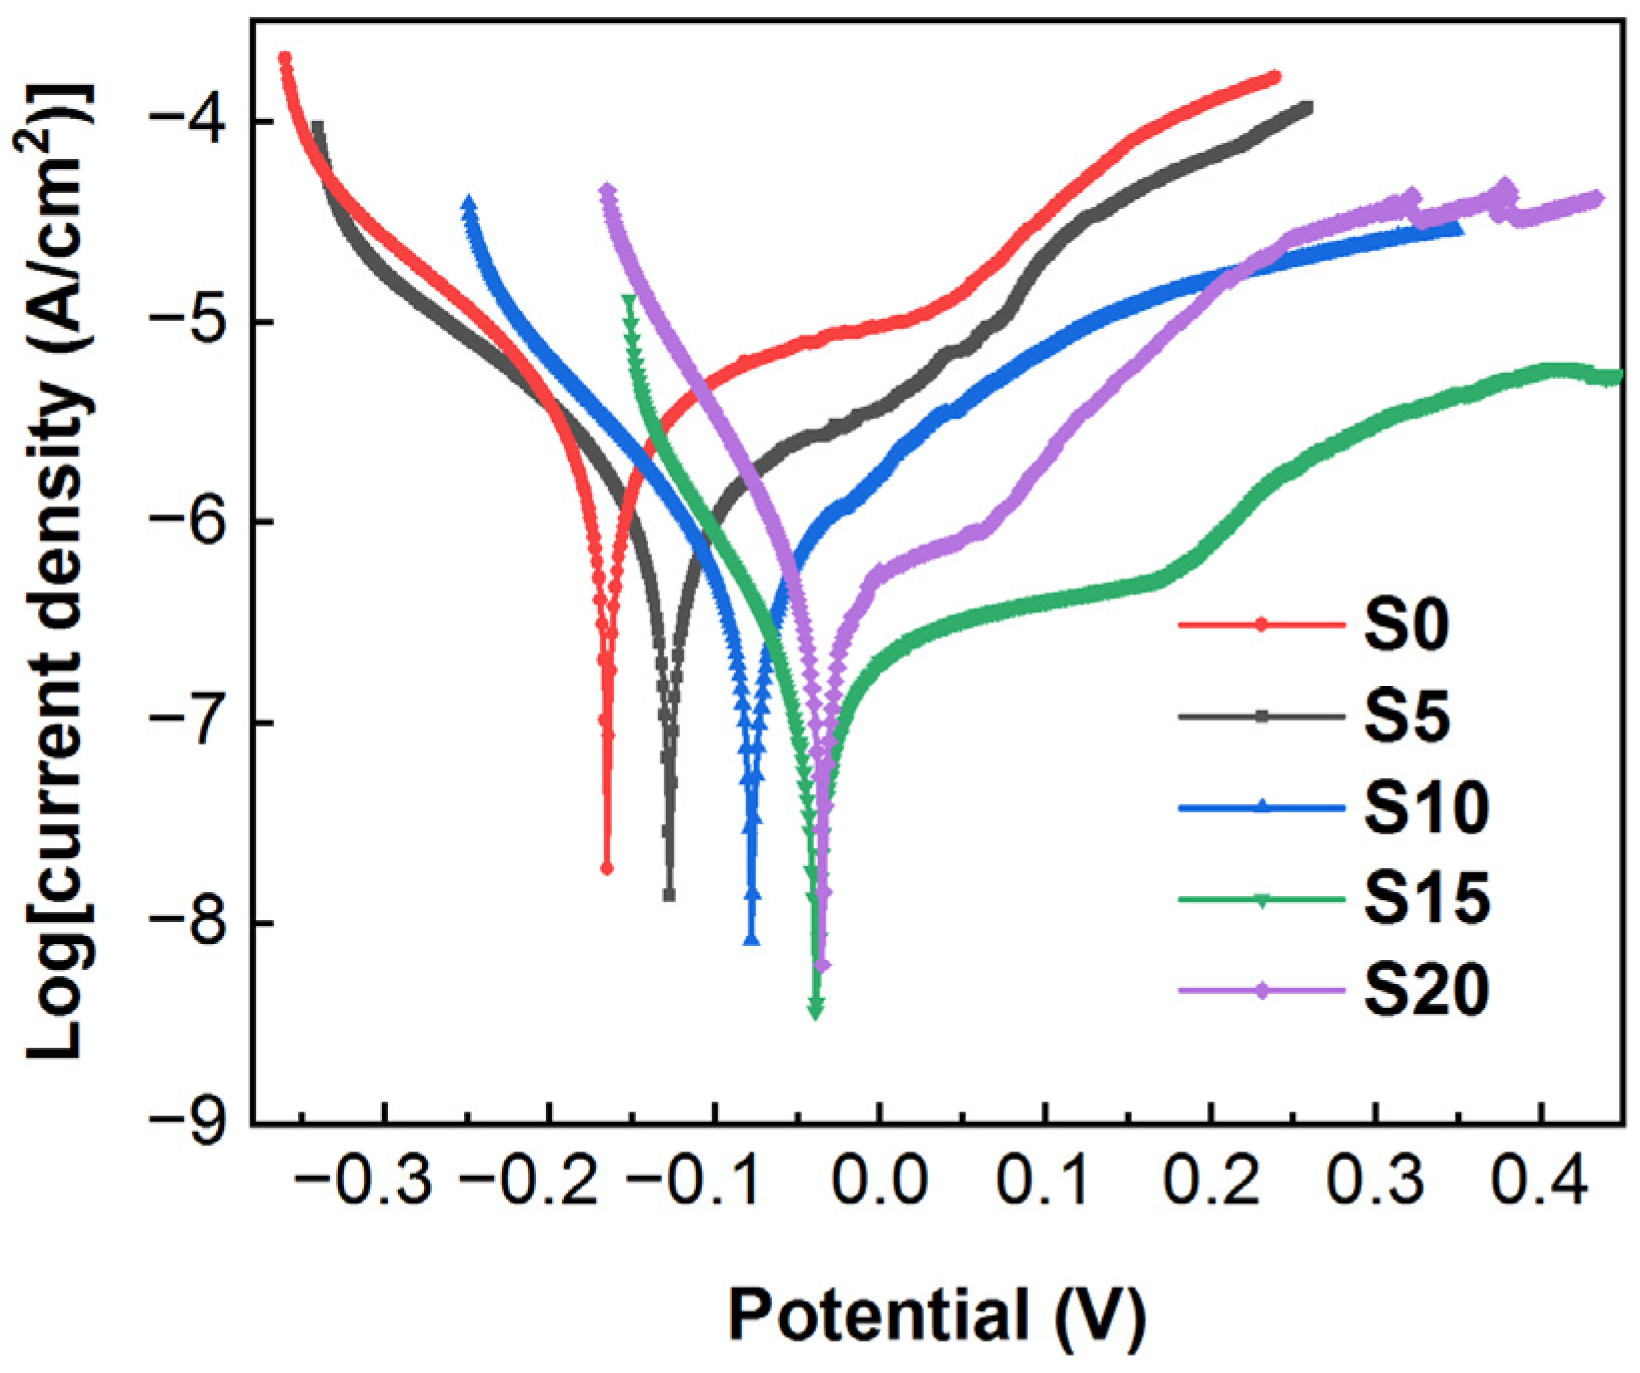
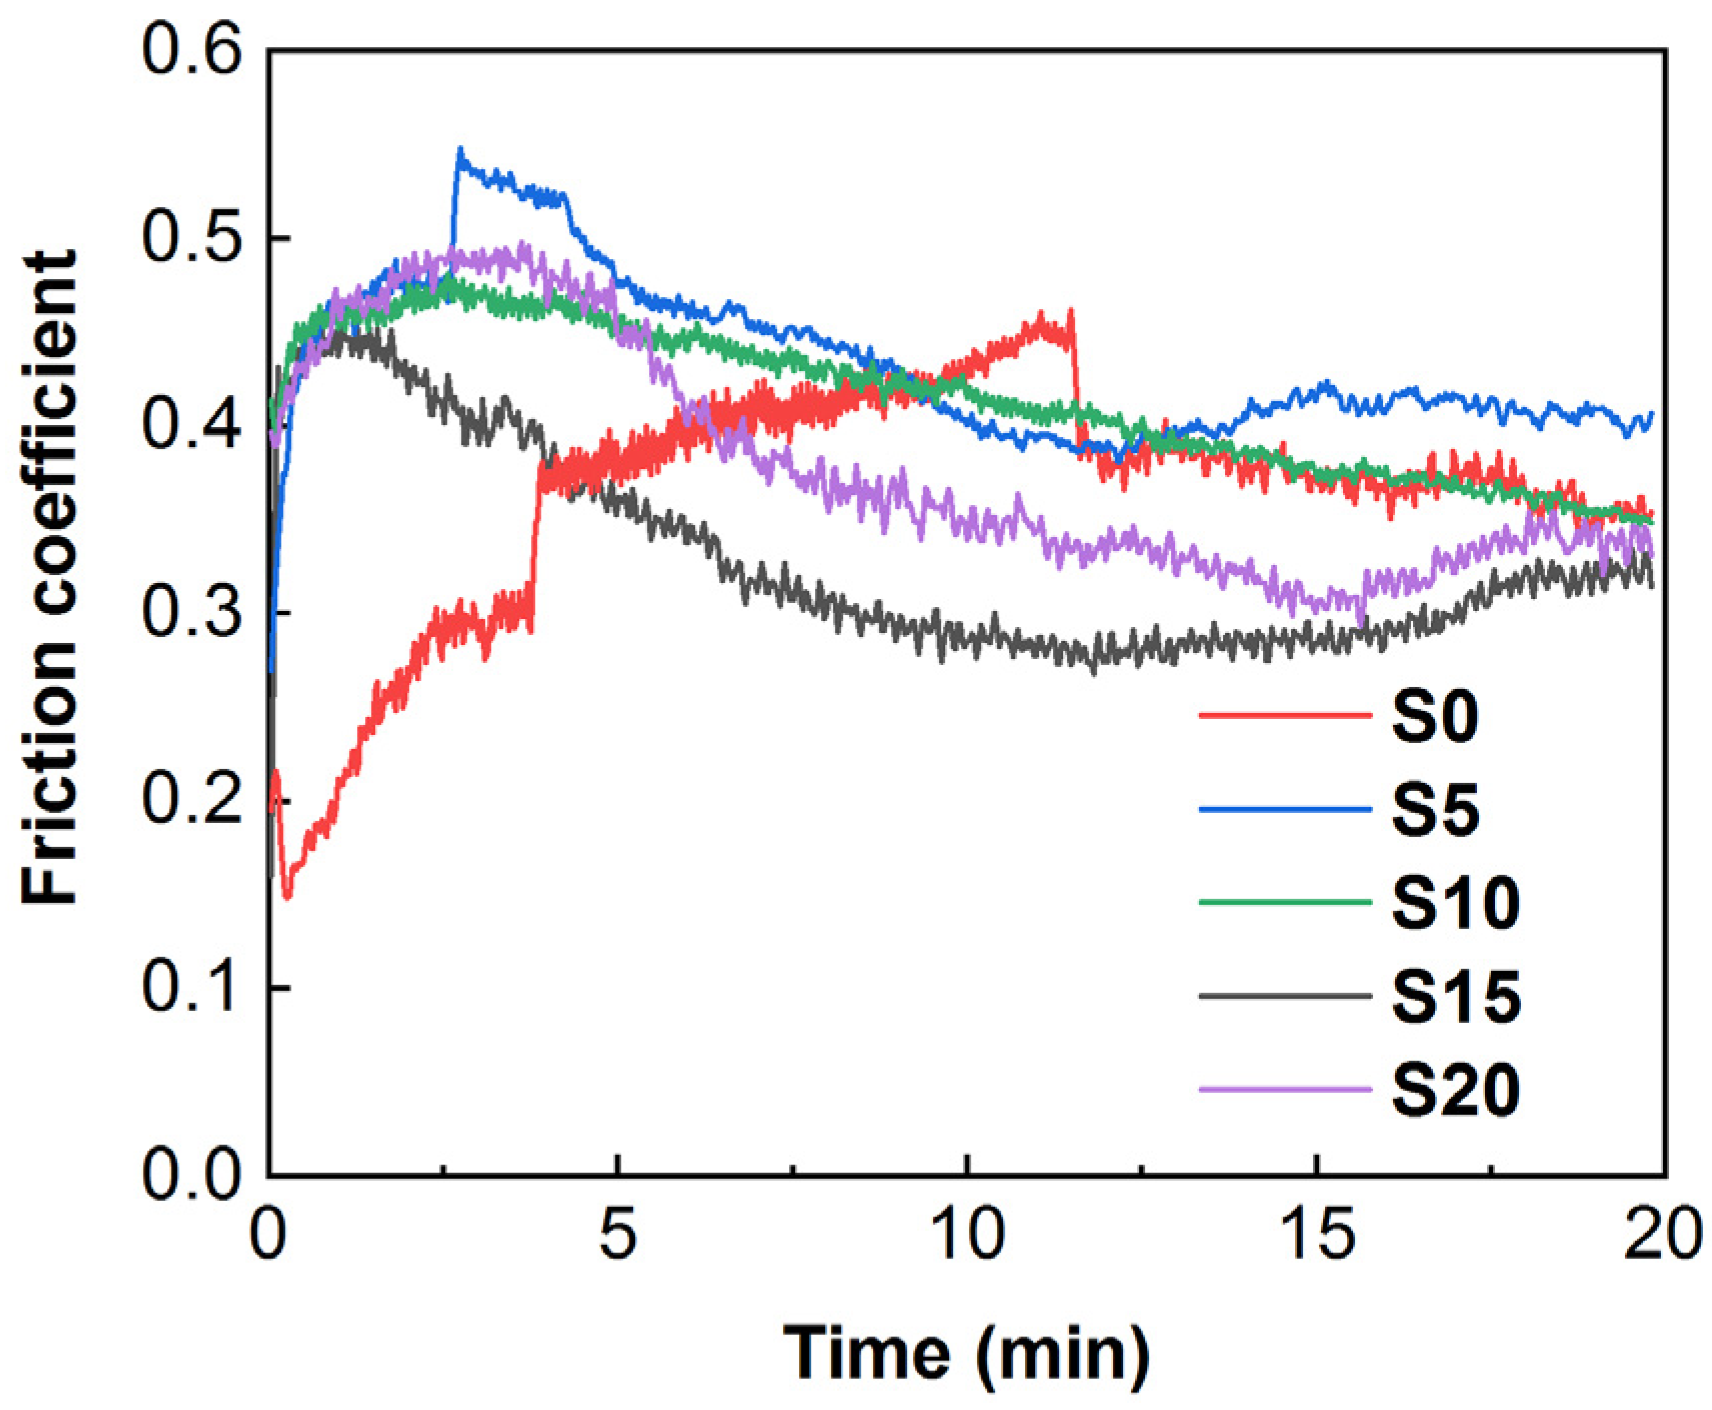
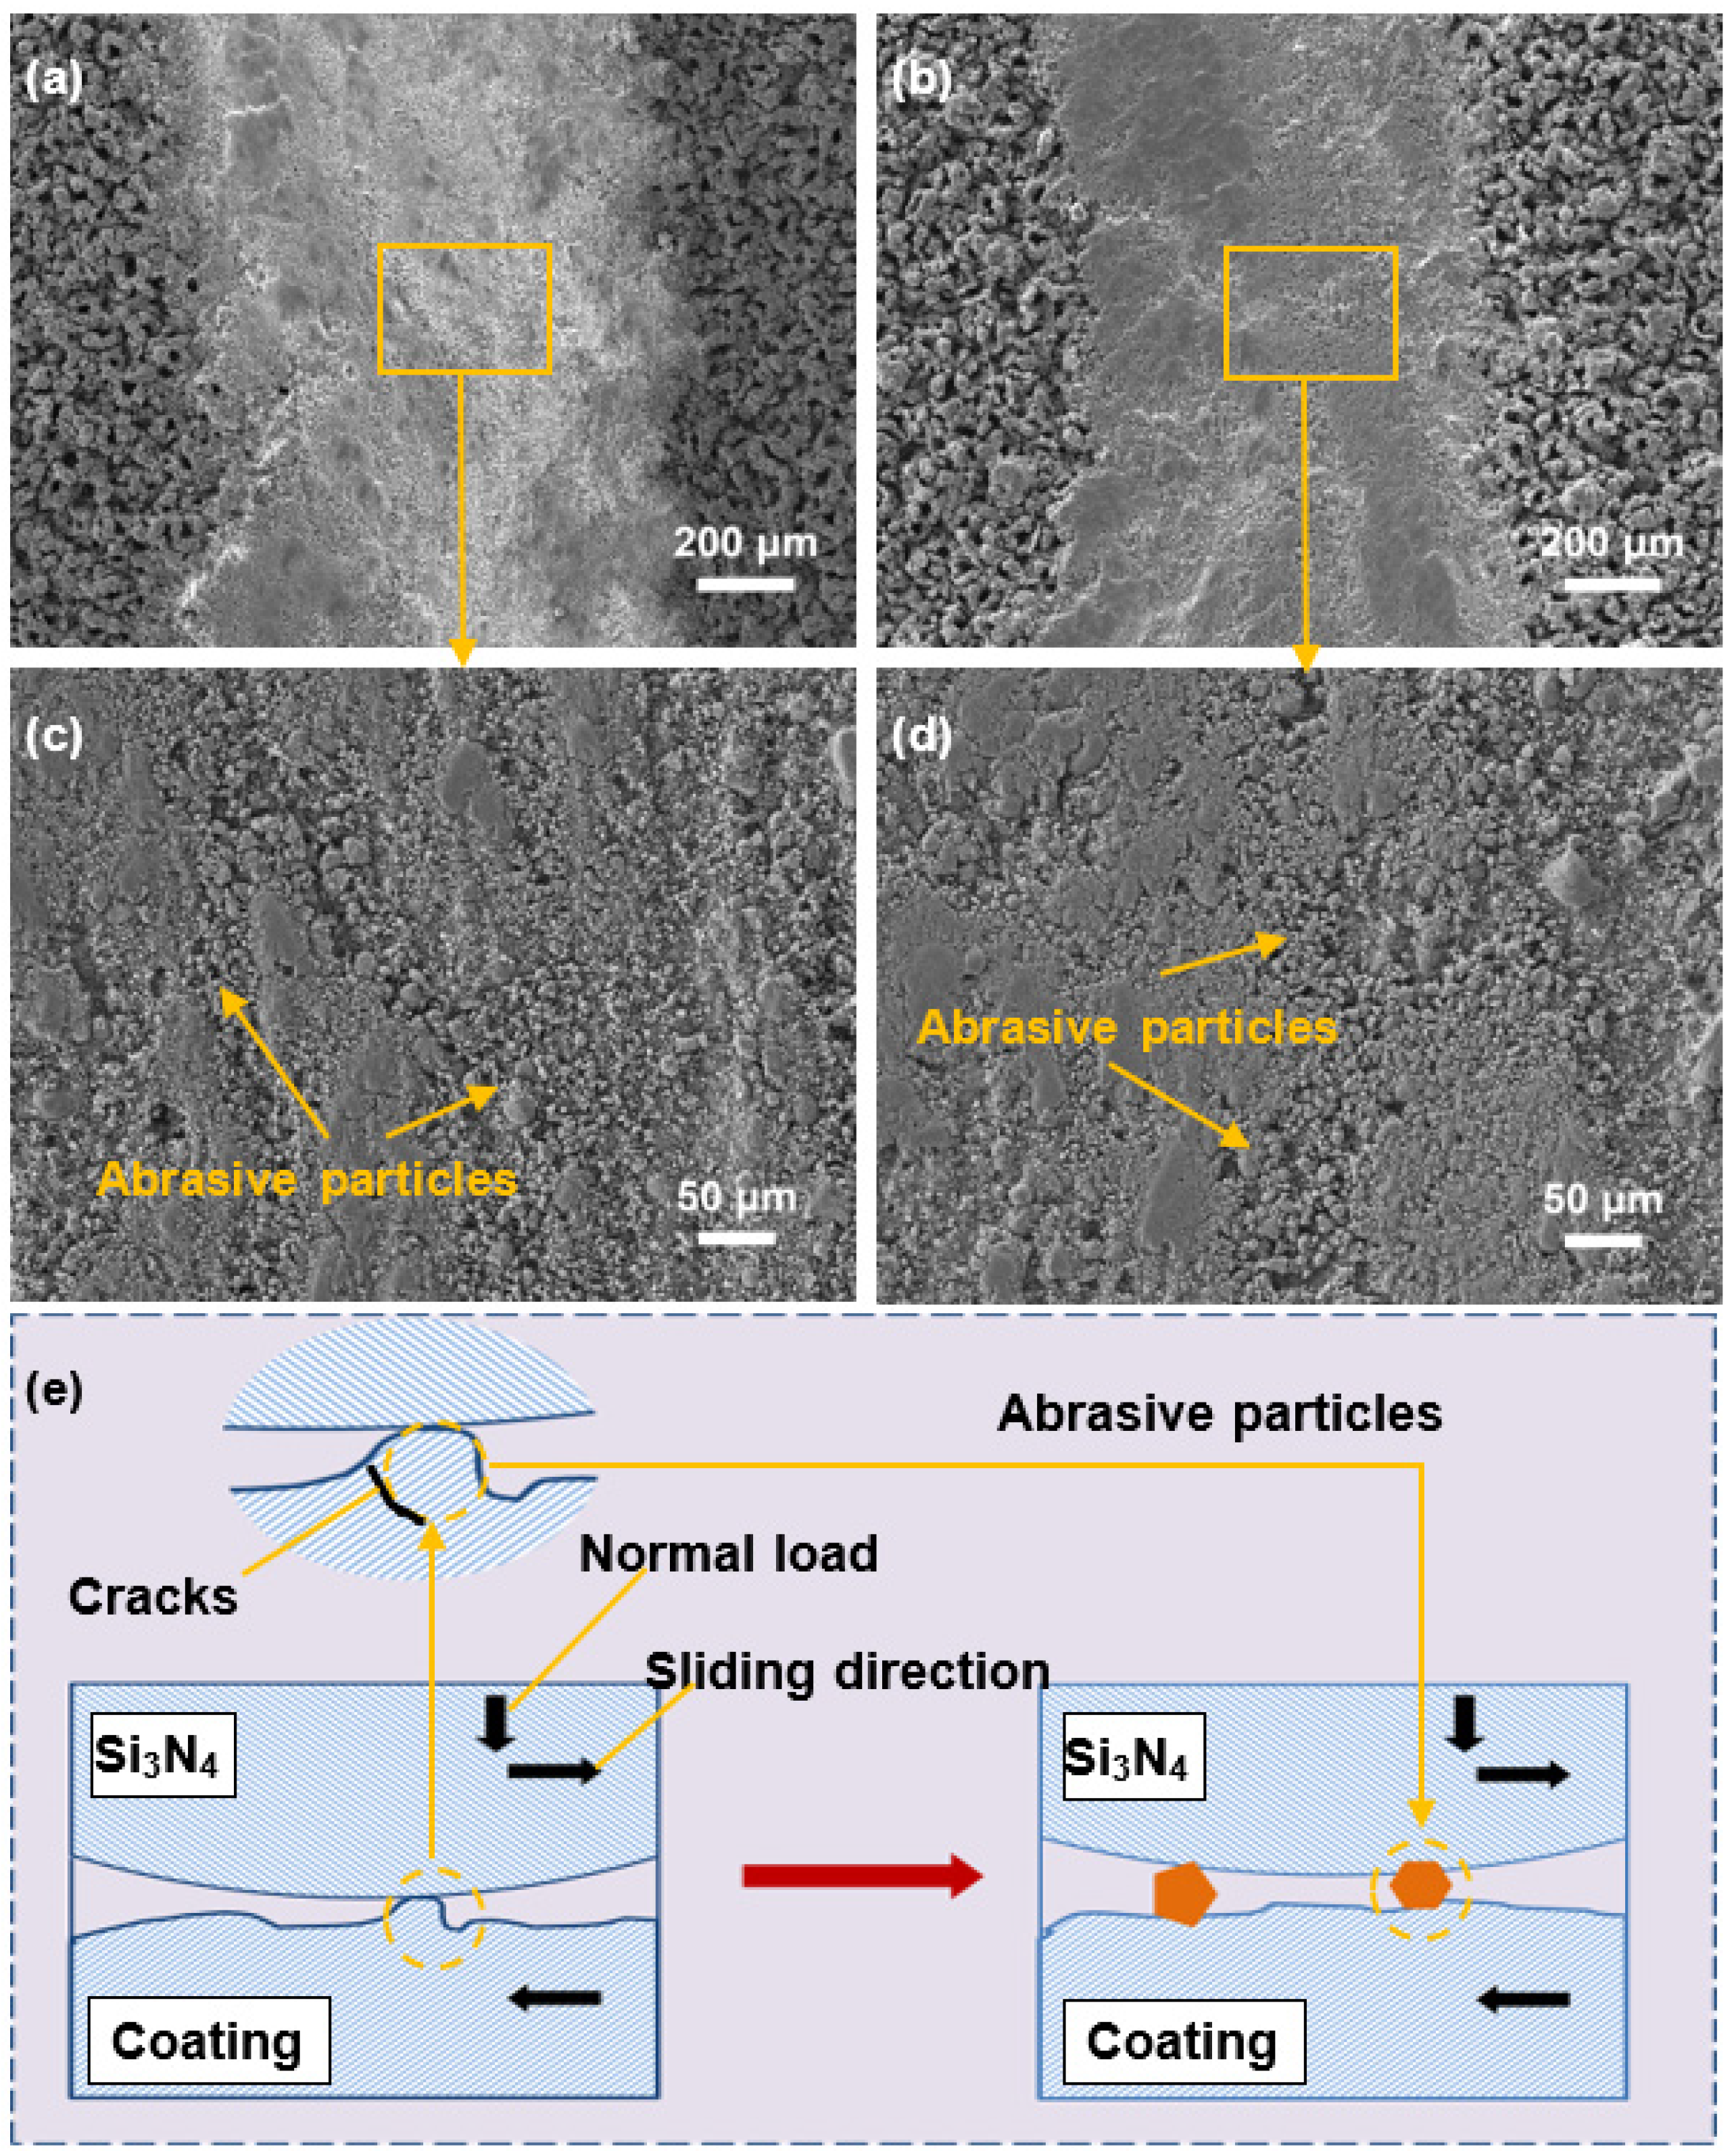
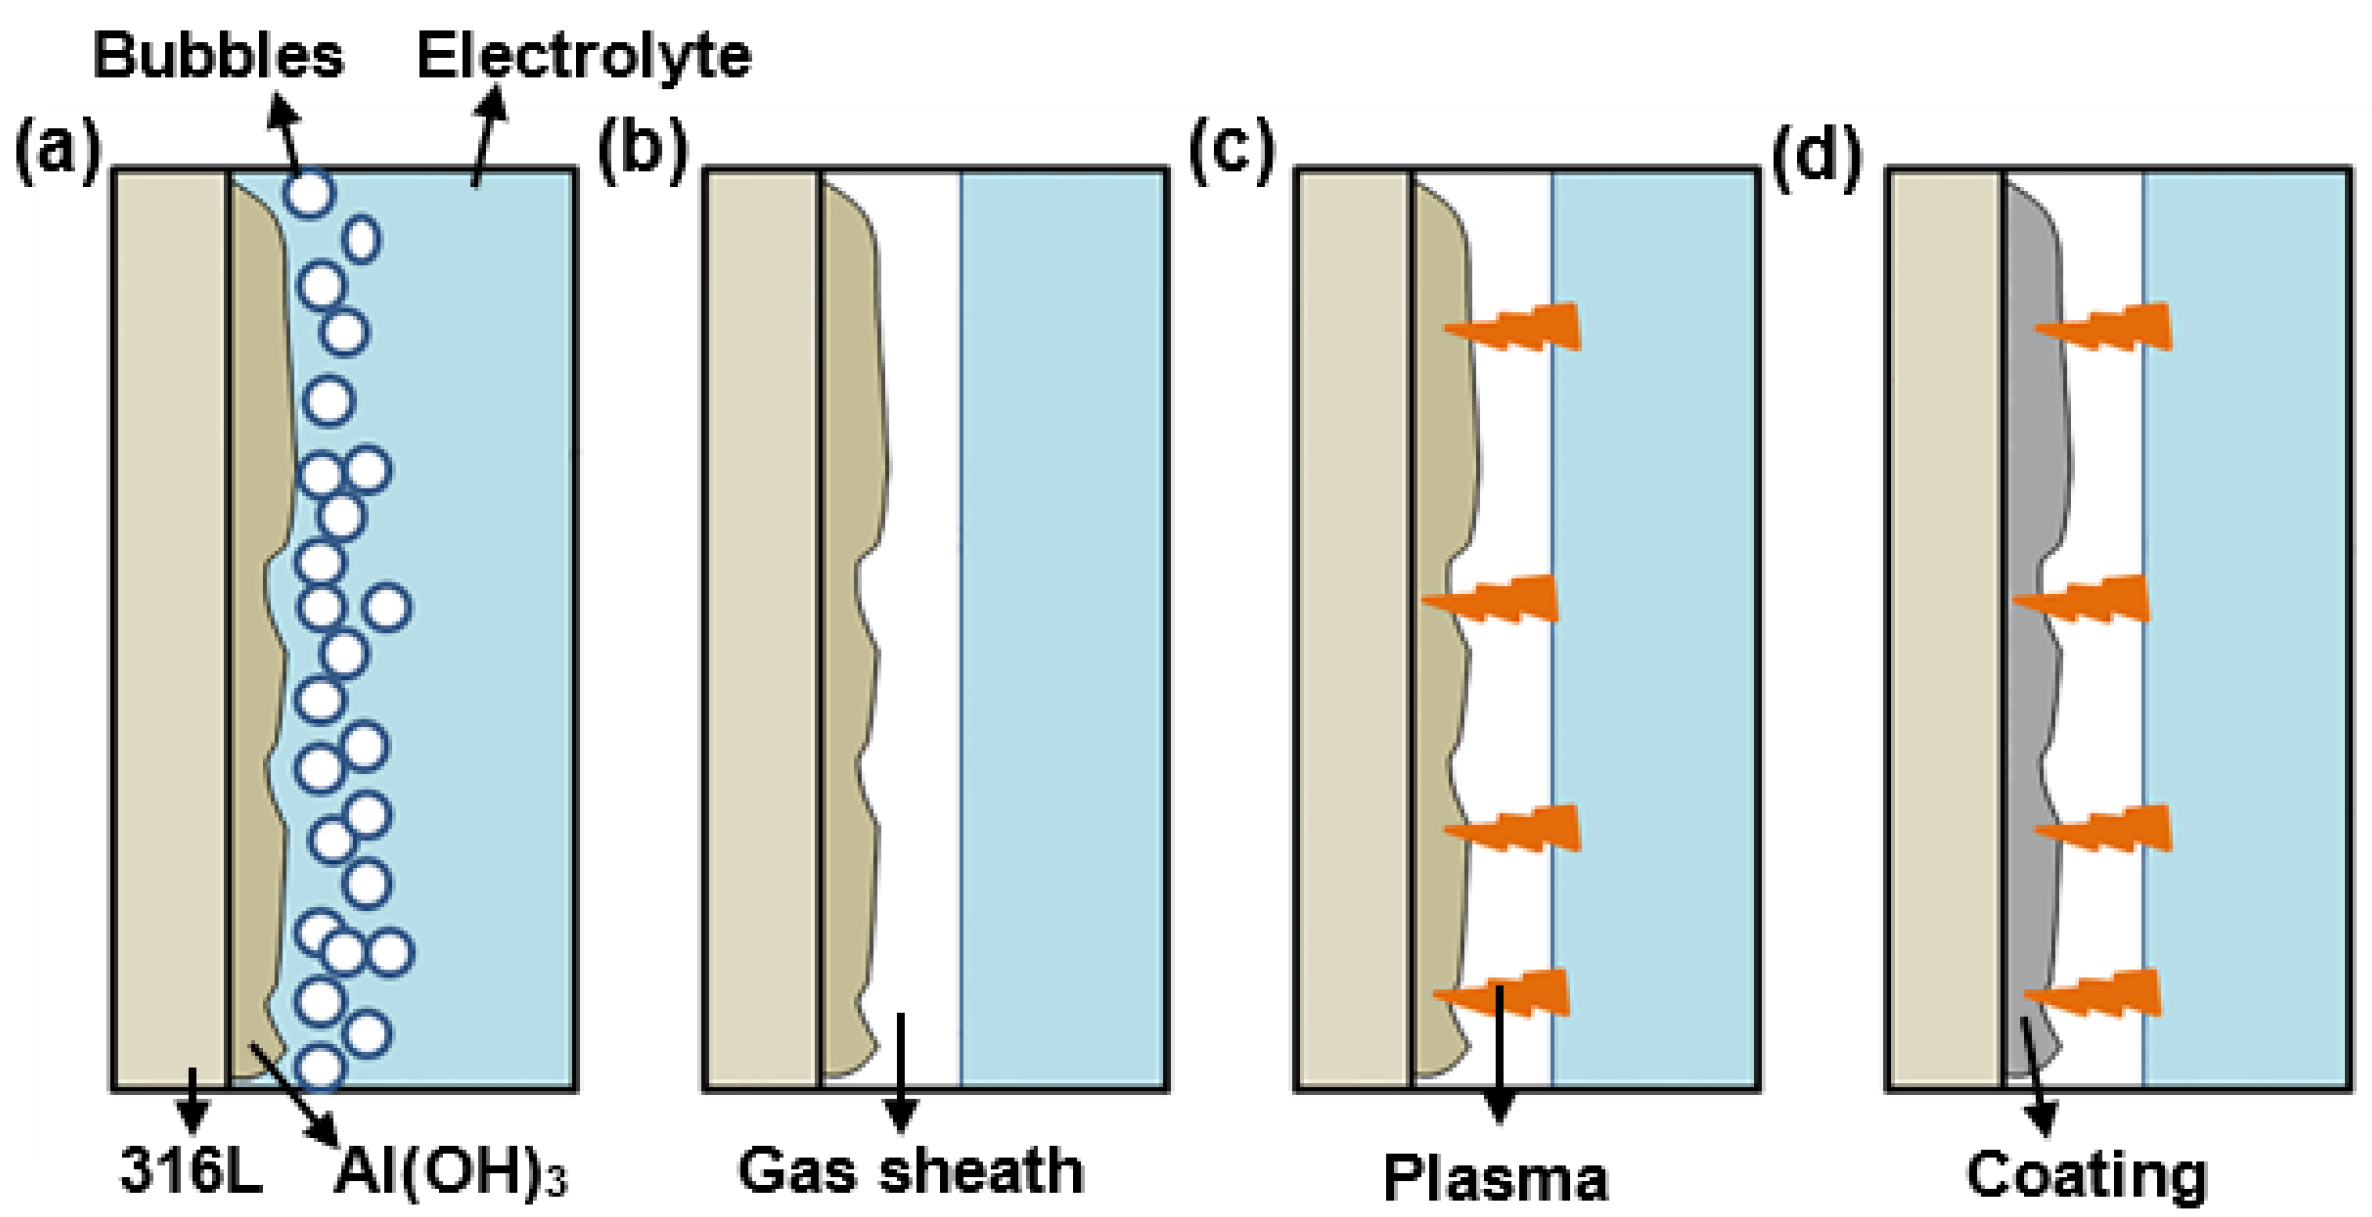
- The introduction of SiC nanoparticles can effectively weaken the electrical breakdown of the CPED process. The corrosion resistance and wear resistance of Al2O3–SiC composite coatings are significantly improved compared with the Al2O3 coating. When the addition of SiC nanoparticles reaches 15 g/L, the corrosion current density and polarization resistance of the coating decreases by an order of magnitude, and the coating exhibits maximum impedance. Compared with the Al2O3 coating, its wear loss decreases by 45%. The wear mechanism of both the Al2O3 coating and the Al2O3–SiC composite coating is abrasive wear.
- (3)
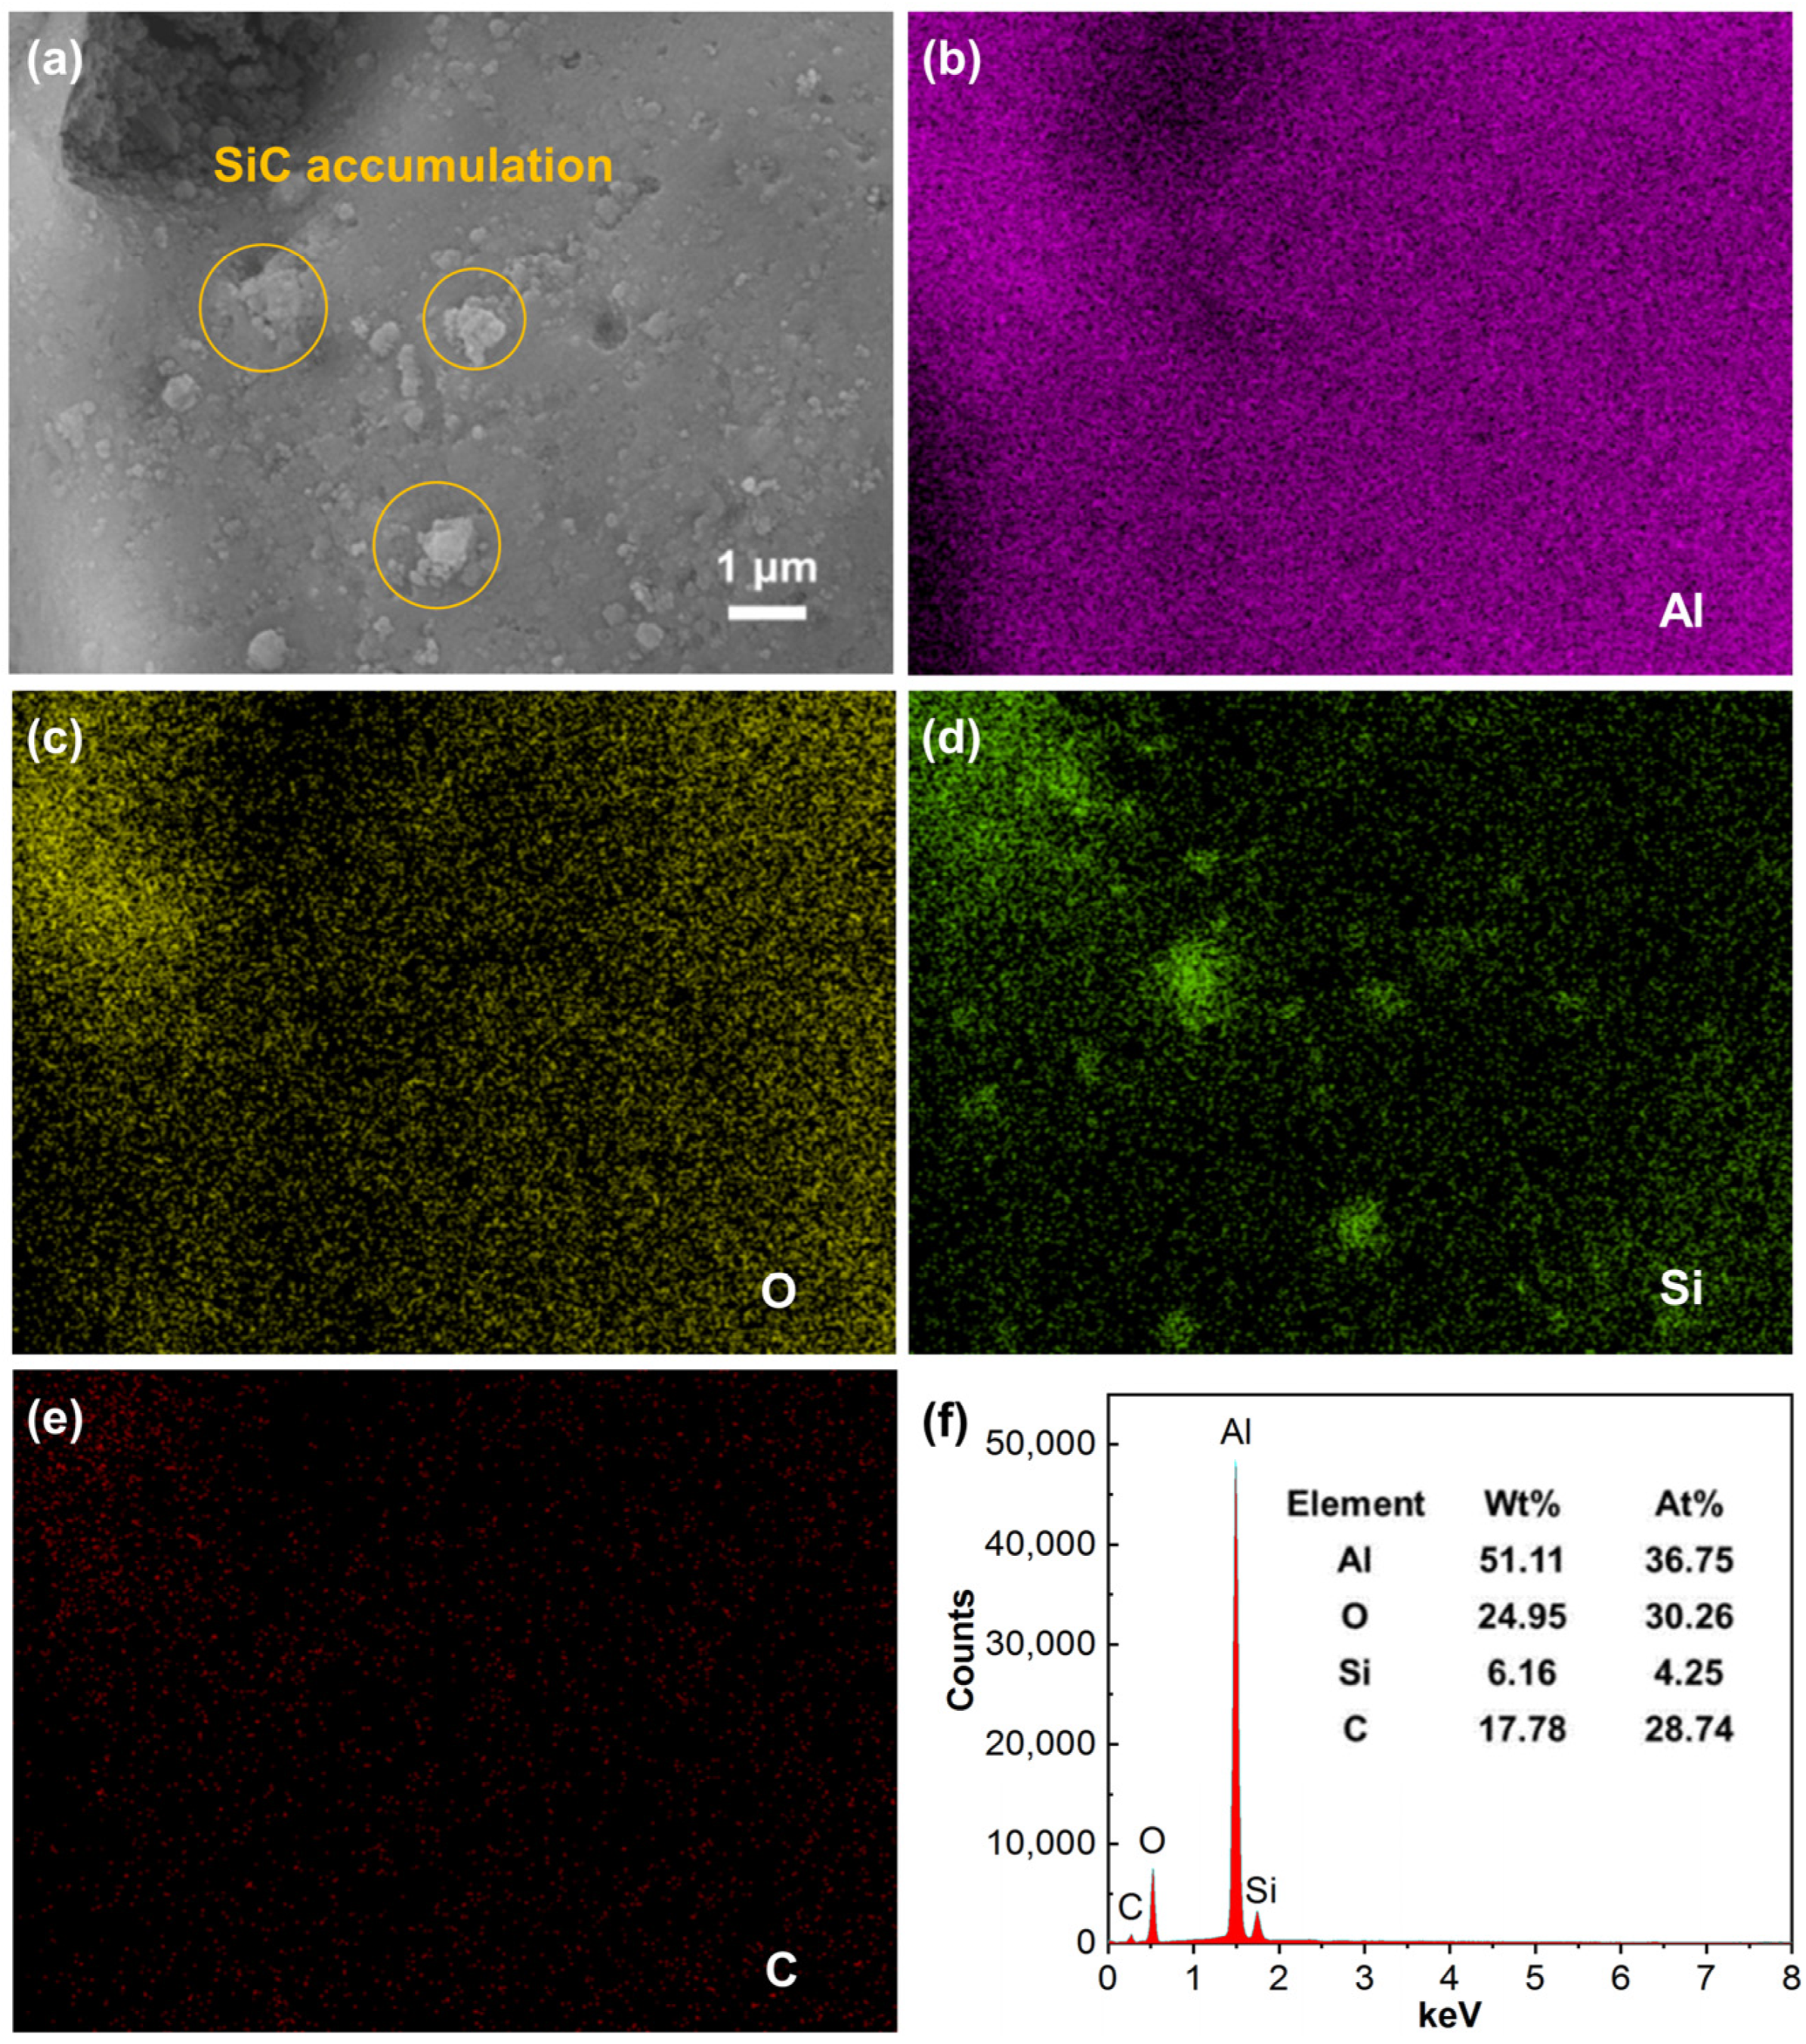
- When the concentration of SiC nanoparticles in the electrolyte is too high, reaching 20 g/L, submicron-scale particles accumulate on the surface of the coatings, which degrades the microstructure and properties of the coatings.
Author Contributions
Drafting the work or revising it critically for important intellectual content, analysis, or interpretation of data for the work, X.L.; Analysis and interpretation of data for the work, Z.L.; Data collection, Review, R.Z.; Literature search and Date Analysis, B.W.; Data collection, Y.W.; Data collection, Review & Editing, H.L.; Analysis and interpretation of data for the work, T.H.; Review & Editing, Y.M.; Supervision, T.G.; Data collection, W.F.; Conception or design of the work, final approval of the version, Y.B. All authors have read and agreed to the published version of the manuscript.
Funding
This work was supported by the National Key R&D Program of China (grant No. 2018YFB2004004), the National Natural Science Foundation of China (grant No.52130509), the National Natural Science Foundation of China (grant No. 52005388), the Collaborative Innovation Center of Advanced Control Valve Project (grant No. WZYB-XTCX-001) and the Fundamental Research Program of Shanxi Province (grant No. 202103021224217).
Institutional Review Board Statement
Not applicable.
Informed Consent Statement
Not applicable.
Data Availability Statement
The datasets generated during and/or analysed during the current study are available from the corresponding author on reasonable request.
Conflicts of Interest
The authors declare no conflict of interest.
References
- Yerokhin, A.L.; Nie, X.; Leyland, A.; Matthews, A.; Dowey, S.J. Plasma electrolysis for surface engineering. Surf. Coat. Technol. 1999, 122, 73–93. [Google Scholar] [CrossRef]
- Li, M.; Wang, D.; Xue, J.; Jia, R. Direct preparation of Y3Al5O12 hollow microspheres using cathode plasma electrolytic deposition. Ceram. Int. 2019, 45, 24919–24922. [Google Scholar] [CrossRef]
- Gu, W.-C.; Lv, G.-H.; Chen, H.; Chen, G.-L.; Feng, W.; Zhang, G.-L.; Yang, S.-Z. Preparation of ceramic coatings on inner surface of steel tubes using a combined technique of hot-dipping and plasma electrolytic oxidation. J. Alloys Compd. 2007, 430, 308–312. [Google Scholar] [CrossRef]
- Lin, A.-D.; Kung, C.-L.; Cao, Y.-Q.; Hsu, C.-M.; Chen, C.-Y. Stainless steel surface coating with nanocrystalline Ag film by plasma electrolysis technology. Coatings 2018, 8, 222. [Google Scholar] [CrossRef] [Green Version]
- Clyne, T.W.; Troughton, S.C. A review of recent work on discharge characteristics during plasma electrolytic oxidation of various metals. Int. Mater. Rev. 2018, 64, 127–162. [Google Scholar] [CrossRef] [Green Version]
- Narayanan, T.S.N.S.; Park, I.S.; Lee, M.H. Strategies to improve the corrosion resistance of microarc oxidation (MAO) coated magnesium alloys for degradable implants: Prospects and challenges. Prog. Mater. Sci. 2014, 60, 1–71. [Google Scholar] [CrossRef]
- Zhao, C.; Sun, J.Y.; Nie, X.Y.; Tjong, J.; Matthews, D.T.A. Anodic plasma electrolytic deposition of composite coating on ferrous alloys with low thermal conductivity and high adhesion strength. Surf. Coat. Technol. 2020, 398, 126081. [Google Scholar] [CrossRef]
- Rogov, A.B.; Huang, Y.; Shore, D.; Matthews, A.; Yerokhin, A. Toward rational design of ceramic coatings generated on valve metals by plasma electrolytic oxidation: The role of cathodic polarisation. Ceram. Int. 2021, 47, 34137–34158. [Google Scholar] [CrossRef]
- Stojadinovi, S.; Vasili, R.; Peri, M. Investigation of plasma electrolytic oxidation on valve metals by means of molecular spectroscopy—A review. RSC Adv. 2014, 4, 25759–25789. [Google Scholar] [CrossRef]
- Lin, A.-D.; Kung, C.-L.; Hsieh, W.-C.; Hsu, C.-M.; Chen, C.-Y. Study on cleaning the surface of stainless steel 316 using plasma electrolysis technology. Appl. Sci. 2018, 8, 1060. [Google Scholar] [CrossRef] [Green Version]
- Belkin, P.; Yerokhin, A.; Kusmanov, S. Plasma electrolytic saturation of steels with nitrogen and carbon. Surf. Coat. Technol. 2016, 307, 1194–1218. [Google Scholar] [CrossRef]
- Aliofkhazraei, M.; Aghdam, A.S.R.; Gupta, P. Nano-fabrication by cathodic plasma electrolysis. Crit. Rev. Solid State Mater. Sci. 2011, 36, 174–190. [Google Scholar] [CrossRef]
- Bahadori, E.; Javadpour, S.; Shariat, M.; Mahzoon, F. Preparation and properties of ceramic Al2O3 coating as TBCs on MCrAly layer applied on Inconel alloy by cathodic plasma electrolytic deposition. Surf. Coat. Technol. 2011, 228, S611–S614. [Google Scholar] [CrossRef]
- Zhang, S.; Zhao, C.; Zhang, J.; Lian, Y.; He, Y. C-Al2O3 coatings prepared by cathode plasma electrolytic deposition on TC4 substrate for better high temperature oxidation resistance. Surf. Coat. Technol. 2021, 405, 126585. [Google Scholar] [CrossRef]
- Wang, X.; Liu, F.; Song, Y.; Liu, Z.; Qin, D. Structure and properties of Al2O3 coatings formed on NiTi alloy by cathodic plasma electrolytic deposition. Surf. Coat. Technol. 2016, 285, 128–133. [Google Scholar] [CrossRef]
- Li, M.; Wang, D.; Xue, J.; Jia, R. Preparation of Pd-doped Y3Al5O12 thermal barrier coatings using cathode plasma electrolytic deposition. Ceram. Int. 2020, 46, 7019–7024. [Google Scholar] [CrossRef]
- Ji, R.; Peng, G.; Zhang, S.; Li, Z.; Li, J.; Fang, T.; Zhang, Z.; Wang, Y.; He, Y.; Wu, J. The fabrication of a CeO2 coating via cathode plasma electrolytic deposition for the corrosion resistance of AZ31 magnesium alloy. Ceram. Int. 2018, 44, 19885–19891. [Google Scholar] [CrossRef]
- Wang, Y.; Cao, X.Q.; Zhang, Z.; Huang, K.; Peng, G.C.; Fang, T.; He, Y.D.; Wu, J.S. Formation and wear performance of dia-mond-like carbon films on 316L stainless steel prepared by cathodic plasma electrolytic deposition. Diam. Relat. Mat. 2019, 95, 135–140. [Google Scholar] [CrossRef]
- Wang, P.; He, Y.; Zhang, J. Al2O3–ZrO2–Pt composite coatings prepared by cathode plasma electrolytic deposition on the TiAl alloy. Surf. Coat. Technol. 2015, 283, 37–43. [Google Scholar] [CrossRef]
- Wang, H.R.; Sun, T.; Chang, L.M.; Liu, F.; Liu, B.; Zhao, C.M.; Xue, X.X.; Xiong, X.B. Preparation of Ca doping ZrO2 coating on NiTi shape memory alloy by cathodic plasma electrolytic deposition and its structure, in-vitro bioactivity and biocompati-bility analysis. Surf. Coat. Technol. 2017, 325, 136–144. [Google Scholar] [CrossRef]
- Wang, S.Q.; Xie, F.Q.; Wu, X.Q.; Ma, Y.; Du, H.X.; Wu, G. Cathodic plasma electrolytic deposition of ZrO2/YSZ doped Al2O3 ceramic coating on TiAl alloy. Ceram. Int. 2019, 45, 18899–18907. [Google Scholar]
- Liu, Z.; Sun, Q.; Song, Y.; Wang, H.; Chen, X.; Wang, X.; Jiang, Z. Preparation of Mn doped Al2O3 heat-dissipating coatings on titanium alloy by cathodic plasma electrolytic deposition. J. Vac. 2019, 159, 228–234. [Google Scholar] [CrossRef]
- Wang, P.; He, Y.-D.; Deng, S.; Zhang, J. Porous α-Al2O3 thermal barrier coatings with dispersed Pt particles prepared by cathode plasma electrolytic deposition. Int. J. Miner. Met. Mater. 2016, 23, 92–101. [Google Scholar] [CrossRef]
- Wang, S.Q.; Xie, F.; Wu, X.Q.; Chen, L.Y. CeO2 doped Al2O3 composite ceramic coatings fabricated on γ–TiAl alloys via ca-thodic plasma electrolytic deposition. J. Alloys Compd. 2019, 788, 632–638. [Google Scholar] [CrossRef]
- Liu, P.; Pan, X.; Yang, W.H.; Cai, K.Y.; Chen, Y.S. Al2O3–ZrO2 ceramic coatings fabricated on WE43 magnesium alloy by ca-thodic plasma electrolytic deposition. Mater. Lett. 2012, 70, 16–18. [Google Scholar] [CrossRef]
- Liu, C.; Zhang, S.; Ji, R.; Wang, P.; Zhang, J.; Tian, Y.; Meng, Y.; He, Y. Cathode plasma electrolytic deposition of Al2O3 coatings doped with SiC particles. Ceram. Int. 2018, 45, 4747–4755. [Google Scholar] [CrossRef]
- Burduhos-Nergis, D.-P.; Vizureanu, P.; Sandu, A.V.; Bejinariu, C. Phosphate surface treatment for improving the corrosion resistance of the C45 carbon steel used in carabiners manufacturing. Materials 2020, 13, 3410. [Google Scholar] [CrossRef]
- Dunleavy, C.; Curran, J.; Clyne, T. Time dependent statistics of plasma discharge parameters during bulk AC plasma electrolytic oxidation of aluminium. Appl. Surf. Sci. 2013, 268, 397–409. [Google Scholar] [CrossRef]
- Wang, X.; Lee, G.; Atkinson, A. Investigation of TBCs on turbine blades by photoluminescence piezospectroscopy. Acta Mater. 2009, 57, 182–195. [Google Scholar] [CrossRef]
- Li, D.; Zhu, H.L.; Chen, S.O.; Jing, Y.L.; Shao, W.Q.; Luan, W.N.; Zhang, Y.C. Infrared spectral studies on relationship between phase transition and grain size of nanometre size γ-Al2O3 powder. Mater. Technol. 2009, 22, 91–94. [Google Scholar] [CrossRef]
- Karbovnyk, I.; Savchyn, P.; Huczko, A.; Guidi, M.C.; Mirri, C.; Popov, A.I. FTIR studies of silicon carbide 1D-nanostructures. Mater. Sci. Forum 2015, 821–823, 261–264. [Google Scholar] [CrossRef]
- Wang, Y.; Jiang, Z.; Liu, X.; Yao, Z. Influence of treating frequency on microstructure and properties of Al2O3 coating on 304 stainless steel by cathodic plasma electrolytic deposition. Appl. Surf. Sci. 2009, 255, 8836–8840. [Google Scholar] [CrossRef]
- Ma, L.; Huang, J.; Fan, X.; Li, J.; Zhu, H.; Xiong, D. Properties of thick ceramic composite coatings synthesized on an aluminium alloy by cathodic plasma electrolytic deposition. Surf. Coat. Technol. 2018, 356, 80–88. [Google Scholar] [CrossRef]
- Huang, J.W.; Zhu, J.Y.; Fan, X.M.; Xiong, D.S.; Li, J.L. Preparation of MoS2–Ti(C, N)–TiO2 coating by cathodic plasma electrolytic deposition and its tribological properties. Surf. Coat. Technol. 2018, 347, 76–83. [Google Scholar] [CrossRef]
- Wang, P.; Ma, Q.; Yuwen, Q.; Li, J. The differences in the formation mechanism of PEO and CPED composited ceramic coatings on Al-12Si alloy. J. Alloys Compd. 2019, 788, 61–66. [Google Scholar] [CrossRef]
- Wang, S.; Xie, F.; Wu, X. Mechanism of Al2O3 coating by cathodic plasma electrolytic deposition on TiAl alloy in Al(NO3)3 ethanol-water electrolytes. Mater. Chem. Phys. 2017, 202, 114–119. [Google Scholar] [CrossRef]
- Gupta, P.; Tenhundfeld, G.; Daigle, E.; Ryabkov, D. Electrolytic plasma technology: Science and engineering—An overview. Surf. Coat. Technol. 2007, 201, 8746–8760. [Google Scholar] [CrossRef]
- Paulmier, T.; Bell, J.; Fredericks, P. Development of a novel cathodic plasma/electrolytic deposition technique: Part 2: Physico-chemical analysis of the plasma discharge. Surf. Coat. Technol. 2007, 201, 8771–8781. [Google Scholar] [CrossRef] [Green Version]
- Yang, X.; Jiang, Z.P.; Hao, G.J.; Liang, Y.F.; Ding, X.F.; Lin, J.P. Ni-doped Al2O3 coatings prepared by cathode plasma electroly-sis deposition on Ti-45Al-8.5 Nb alloys. Appl. Surf. Sci. 2018, 455, 144–152. [Google Scholar] [CrossRef]
- Wang, P.; Deng, S.; He, Y.; Liu, C.; Zhang, J. Influence of polyethylene glycol on cathode plasma electrolytic depositing Al2O3 anti-oxidation coatings. Ceram. Int. 2016, 42, 8229–8233. [Google Scholar] [CrossRef]
- Zhang, S.; Zhang, J.; Ji, R.; Lian, Y.; He, Y. Structure analysis and formation mechanism of Ce doped Al2O3 coatings prepared by cathode plasma electrolytic deposition. Ceram. Int. 2018, 44, 14465–14470. [Google Scholar] [CrossRef]
- Zhang, S.G.; Zhang, J.; Ji, R.N.; Lian, Y.; He, Y.D. The effect of electric conductivity on the structure of ceramic coatings pre-pared by cathode plasma electrolytic deposition. Mater. Chem. Phys. 2019, 224, 36–39. [Google Scholar] [CrossRef]
- Ikonopisov, S. Theory of electrical breakdown during formation of barrier anodic films. Electrochim. Acta 1977, 22, 1077–1082. [Google Scholar] [CrossRef]
Publisher’s Note: MDPI stays neutral with regard to jurisdictional claims in published maps and institutional affiliations. |
© 2022 by the authors. Licensee MDPI, Basel, Switzerland. This article is an open access article distributed under the terms and conditions of the Creative Commons Attribution (CC BY) license (https://creativecommons.org/licenses/by/4.0/).