Article

Numerical Investigation on the Evaporation Performance of Desulfurization Wastewater in a Spray Drying Tower without Deflectors

1
Guangdong Electric Power Research Institute, Guangzhou 510663, China
2
China Southern Power Grid Technology Co., Ltd., Guangzhou 510080, China
*
Author to whom correspondence should be addressed.
Coatings 2021, 11(9), 1022; https://doi.org/10.3390/coatings11091022
Submission received: 20 July 2021 / Revised: 17 August 2021 / Accepted: 24 August 2021 / Published: 26 August 2021

Abstract

:
The desulfurization wastewater evaporation technology with flue gas has been widely applied to dispose of desulfurization wastewater. This paper investigates the effect of flue gas flow rate and temperature, wastewater flow rate and initial temperature, and droplet size on the evaporation performance of the desulfurization wastewater in a spray drying tower without deflectors. The results show that the flue gas flow rate and temperature affect the evaporation performance of desulfurization wastewater. The larger flow rate and higher temperature of flue gas correspond to the faster evaporation speed and the shorter complete evaporation distance of the wastewater droplet. Decreasing the flow rate and increasing the initial temperature of the desulfurization wastewater is advantageous to enhance the evaporation speed and shorten the complete evaporation distance of the wastewater droplet. Reducing the droplet size is beneficial to improve the evaporation performance of the desulfurization wastewater. The orthogonal test results show that the factors affecting droplet evaporation performance are ranked as follows: flue gas flow rate > wastewater flow rate > flue gas temperature > wastewater initial temperature > droplet size. Considering the evaporation ratio and the complete evaporation distance, the optimal setting is 14.470 kg/s for flue gas flow rate, 385 °C for flue gas temperature, 0.582 kg/s for wastewater flow rate, 25 °C for wastewater initial temperature, and 60 μm for droplet size. These studied results can provide valuable information to improve the operational performance of the desulfurization wastewater evaporation technology with flue gas.

1. Introduction

In China, wet flue gas desulfurization technology is widely applied to coal-fired thermal power plants to remove SO2 in the flue gas because it has the advantages of high efficiency, low operating cost, and high reliability [1,2,3,4]. However, this technology produces large quantities of desulfurization wastewater, which contains many acidic ions, heavy metal ions, and suspended solids [5,6,7]. Releasing desulfurization wastewater into the environment is strictly prohibited [8,9]. Therefore, the methods for desulfurization wastewater disposal have gained extensive research interest in recent years [10].
Some technologies have been proposed to dispose of the desulfurization wastewater, such as chemical precipitation, membrane separation, evaporative crystallization, electrodialysis technology, etc. [11,12,13,14]. Of these desulfurization wastewater disposal technologies, desulfurization wastewater evaporation technology is an effective method to achieve zero-emission of desulfurization wastewater [14,15,16,17]. Significantly, flue gas after the air preheater is the best choice as a heating source to evaporate the desulfurization wastewater, as shown in Figure 1 [18]. The flue gas is injected into the spray drying tower through a special-designed channel, and the desulfurization wastewater is sprayed into a spray drying tower through a high-speed rotating atomizer, and then evaporated under the preheating effect of the flue gas. The residual solid particles after evaporation are expected to be captured [19]. To improve the evaporation performance of desulfurization wastewater, some efforts have been performed. Liang et al. [20] investigated the evaporation and crystallization behaviors of the desulfurization wastewater droplet using thermogravimetric analysis. They found that the increase in heating rate can promote evaporation and crystallization rates simultaneously, while the final temperature has a limited effect on these rates. Deng et al. [21] numerically studied the effect of the position and number of nozzles, droplet size, and flue gas temperature on evaporation performance. Ma et al. [8] simulated the evaporation behavior of desulfurization wastewater and found that smaller droplet size, and higher flue gas flow rate and temperature could benefit the complete evaporation of the desulfurization wastewater. Zheng et al. [22] explored the chlorine migration of various chlorine salt solutions and typical desulfurization wastewater at high temperatures during the evaporation process of concentrated wastewater by a laboratory-scale tube furnace and a pilot-scale system. Although numerous efforts have been devoted to studies of the desulfurization wastewater evaporation, there are still few works that comprehensively investigate the desulfurization wastewater evaporation.
This work is aimed to comprehensively investigate the effects of flue gas flow rate, flue gas temperature, wastewater flow rate, initial wastewater temperature, and droplet size on the desulfurization wastewater evaporation performance. These studied results can give more helpful information to guide the desulfurization wastewater evaporation technology with flue gas.

2. Physical Model and Numerical Method

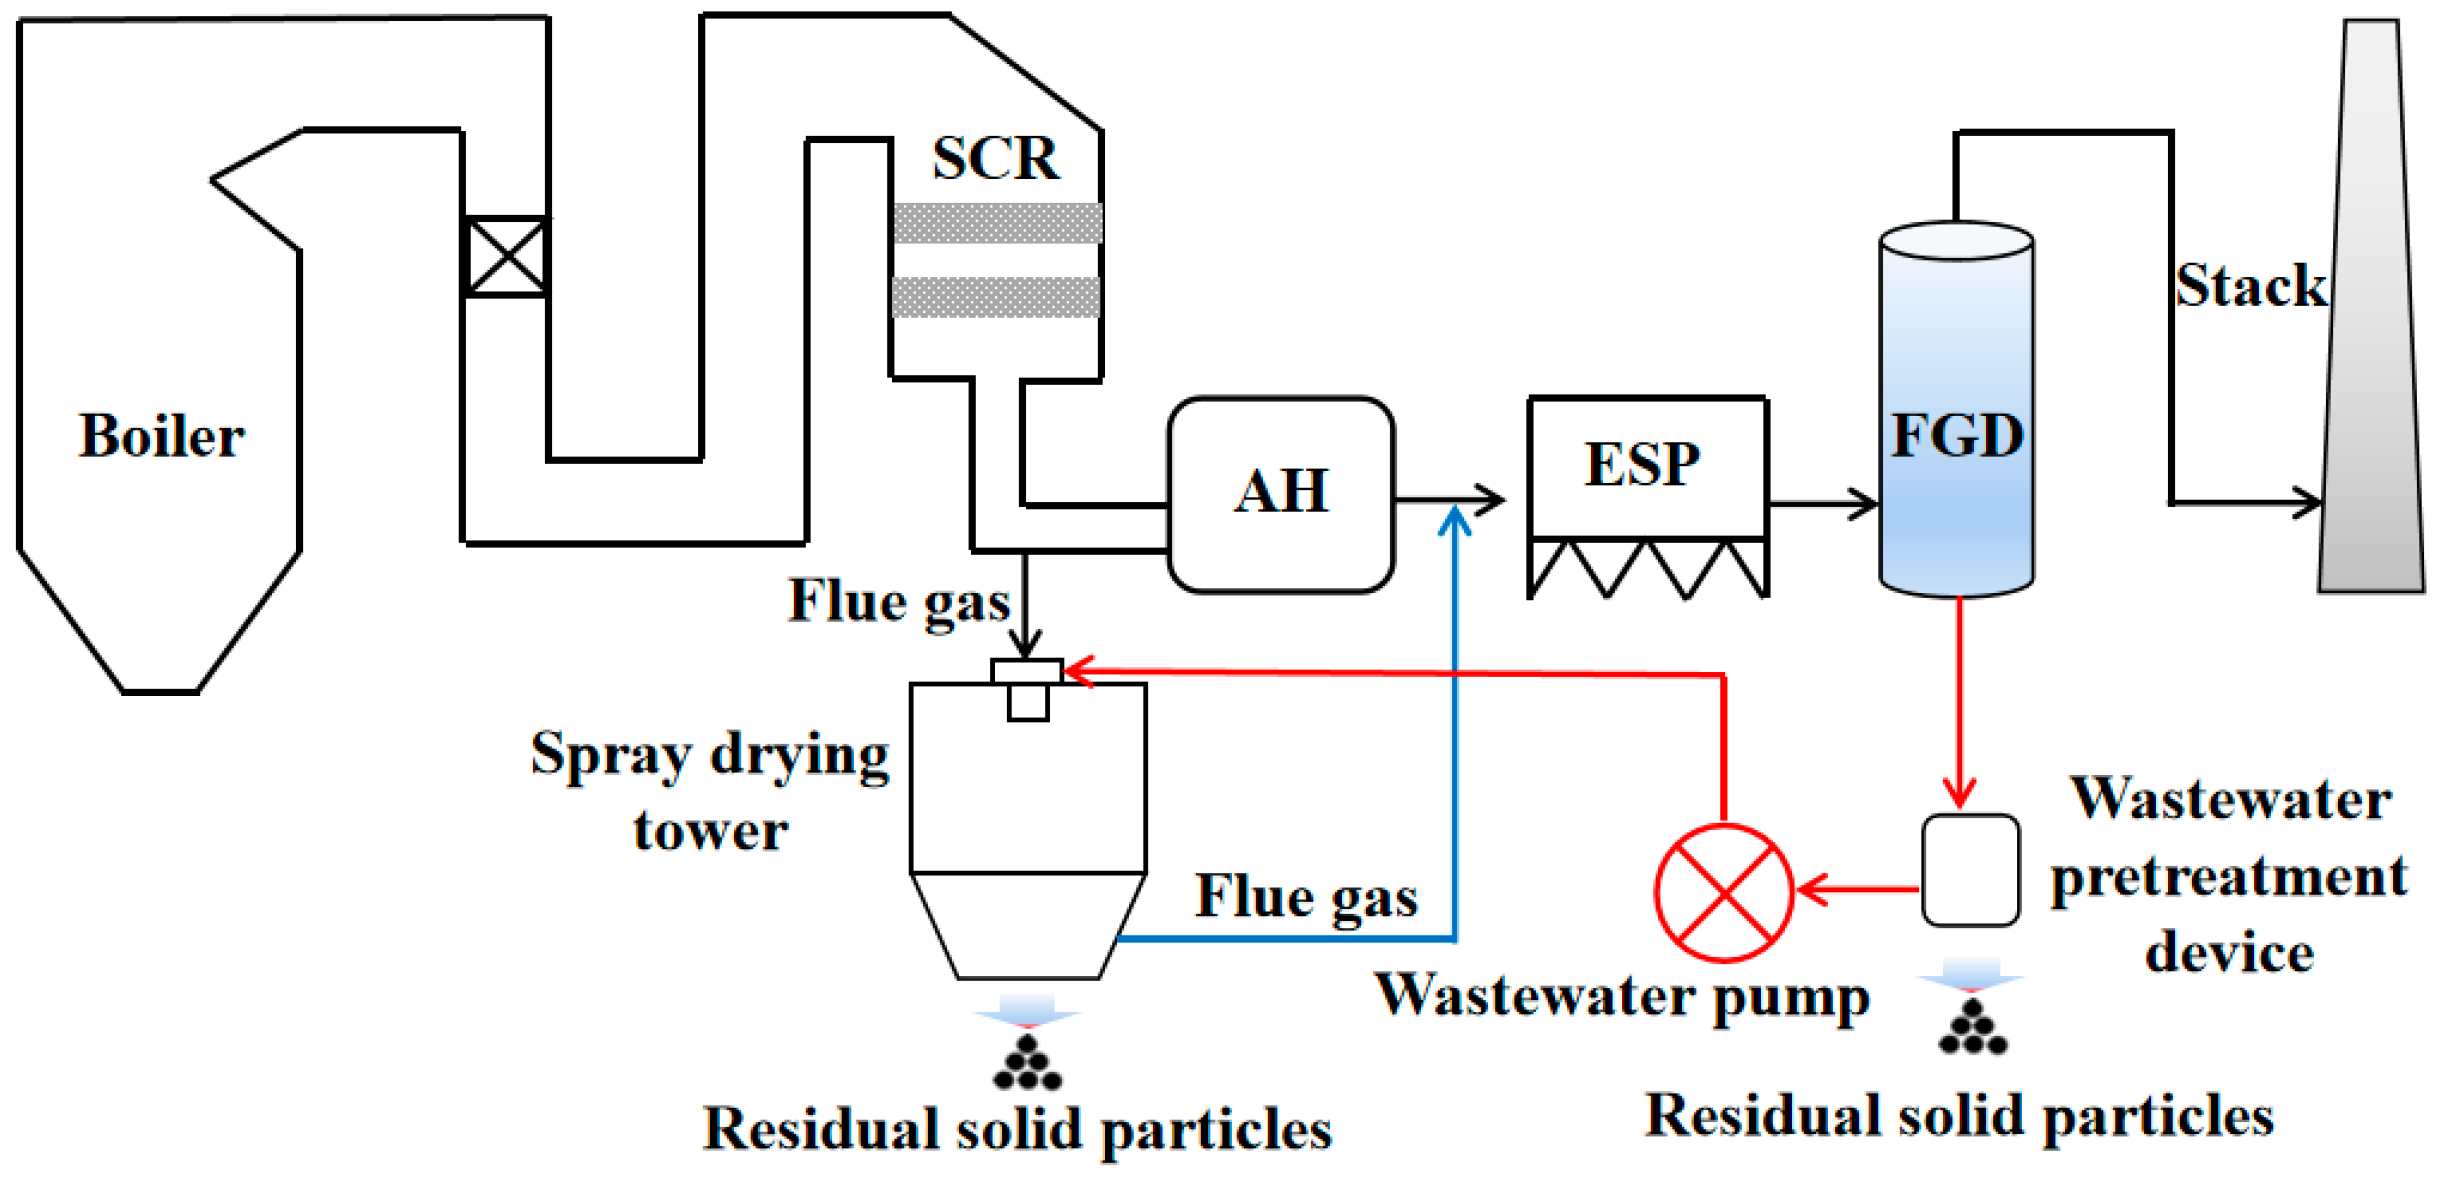
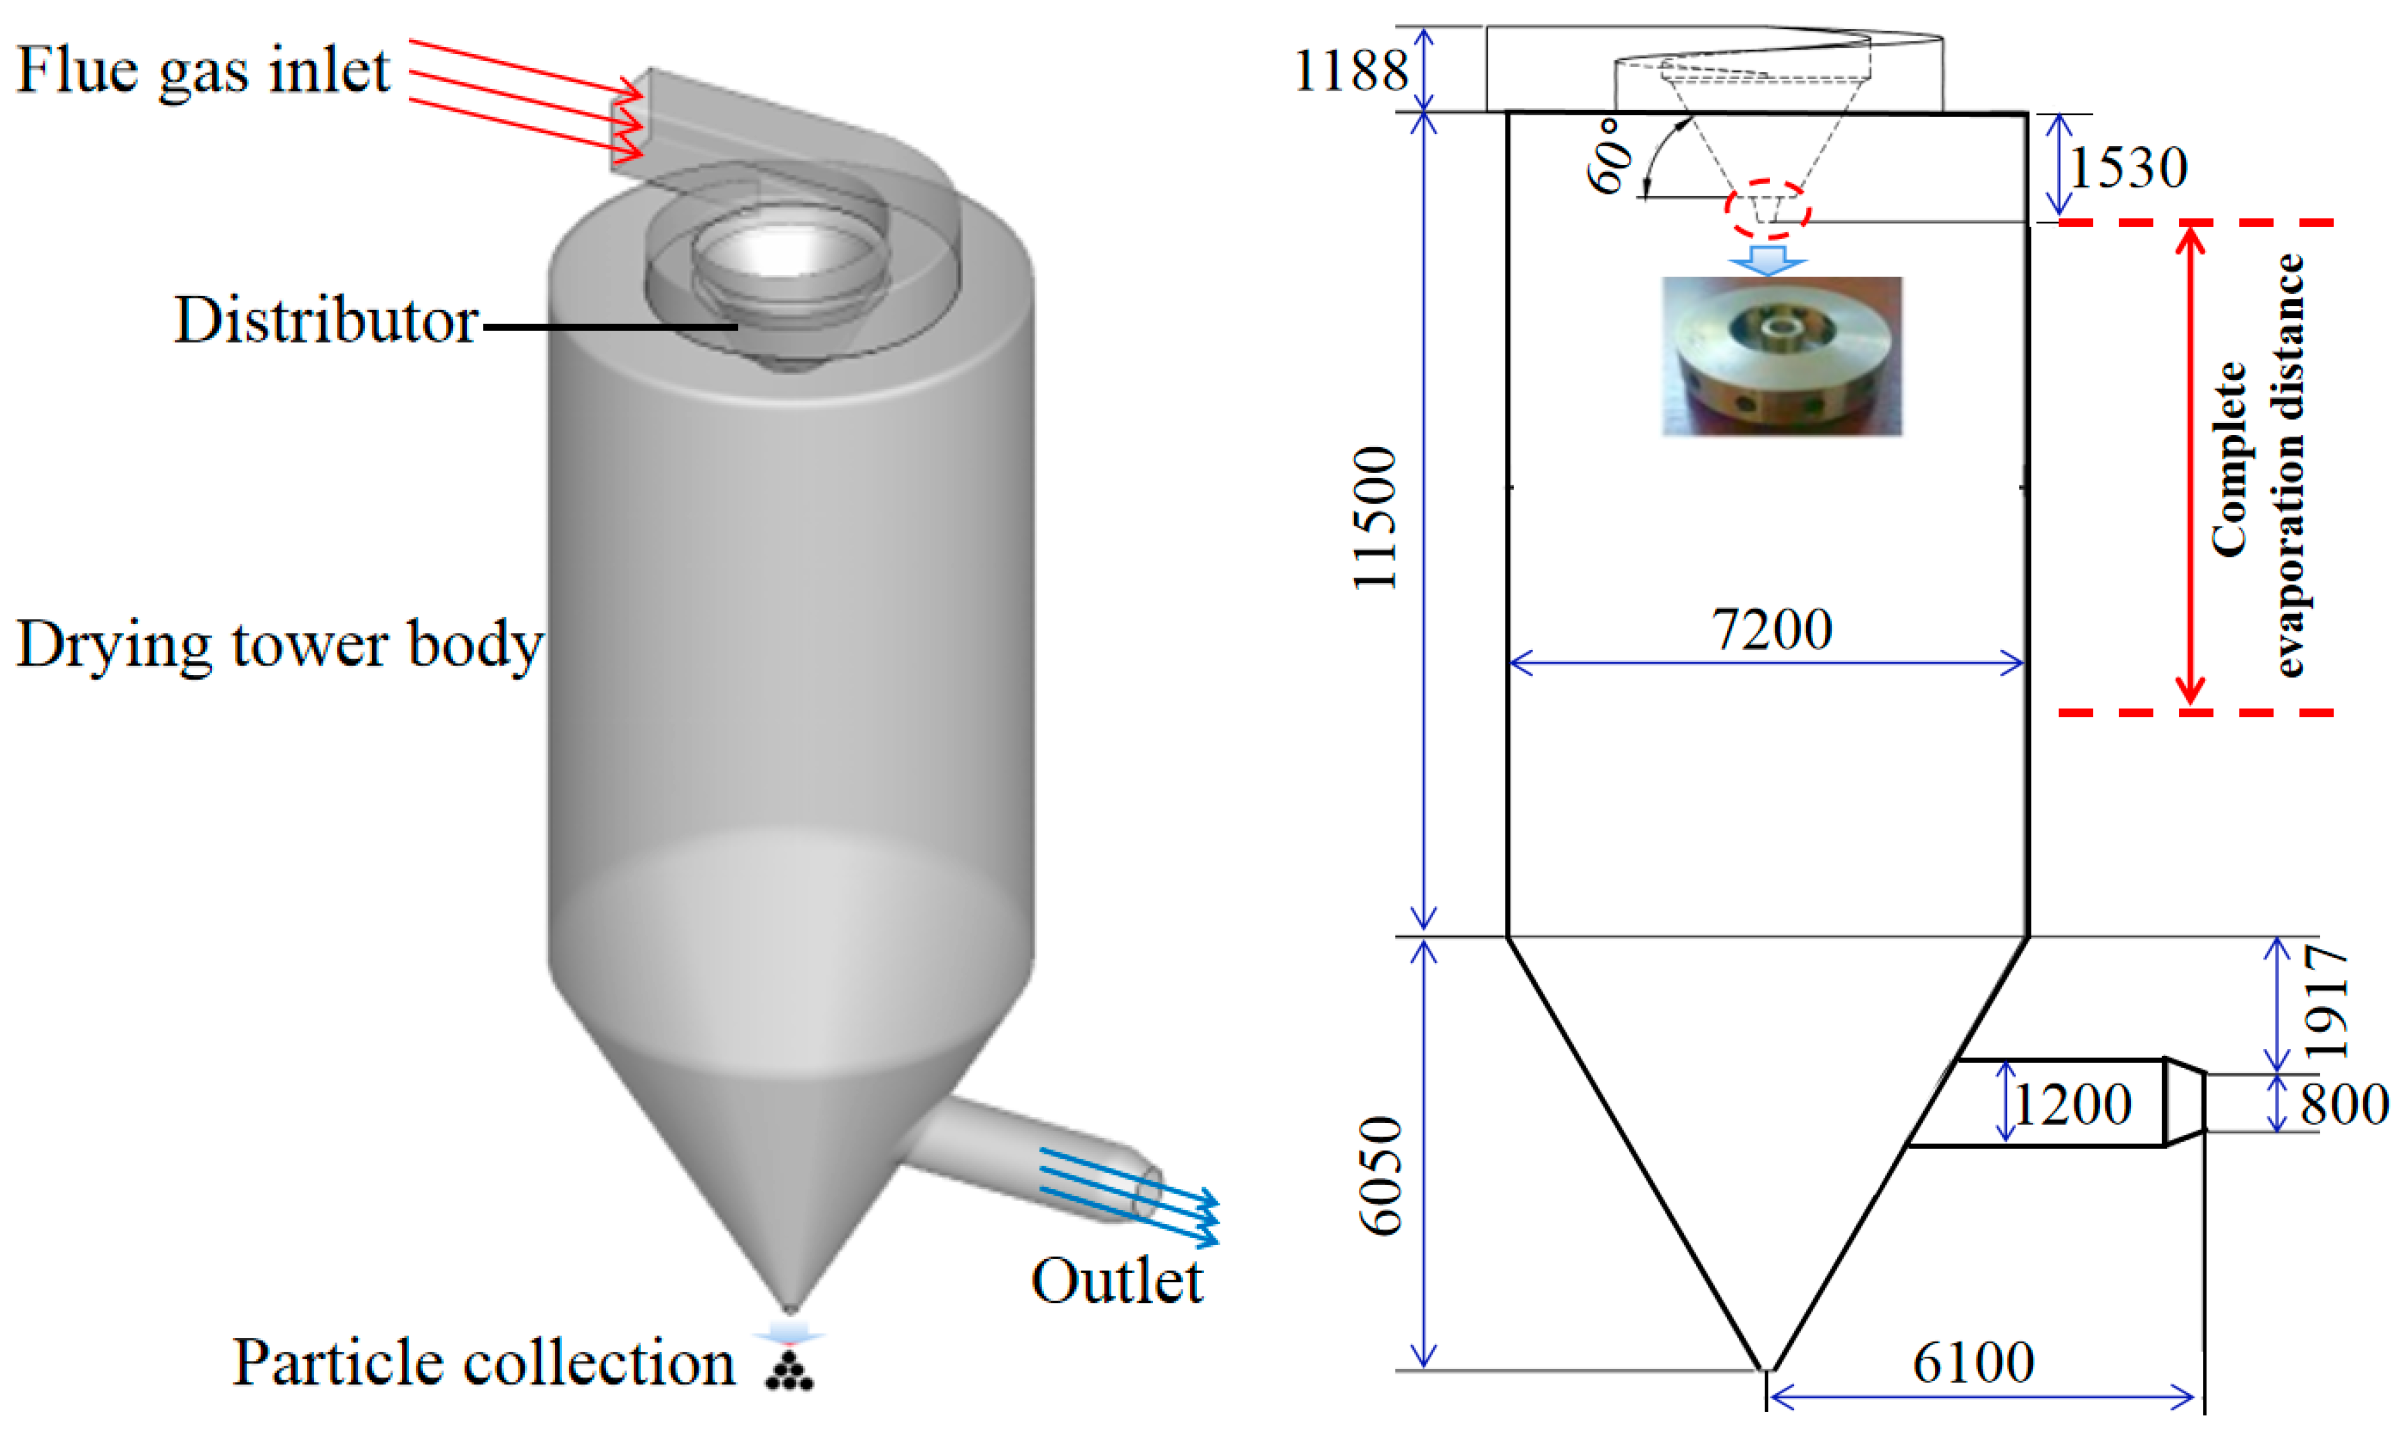
2.1. Spray Drying Tower Description

The schematic diagram of a spray drying tower without deflectors is shown in Figure 2. The height is 17.9 m, and the diameter is 7.2 m. The flue gas is injected into the spray drying tower through a specially-designed volute structure. In the atomization process, the desulfurization wastewater is firstly sent to the atomizer by the metering pump. The motor drives the atomizing disc to rotate at high speed, and the desulfurization wastewater is thrown out from the channels, thus atomizing into droplets. The droplets are then evaporated under the preheating effect of the flue gas. In this study, the complete evaporation distance (as shown in Figure 2) is defined as the maximum distance from the atomizer in the vertical direction when the droplet particle mass is zero. Table 1 lists the physical parameters of flue gas under full load.

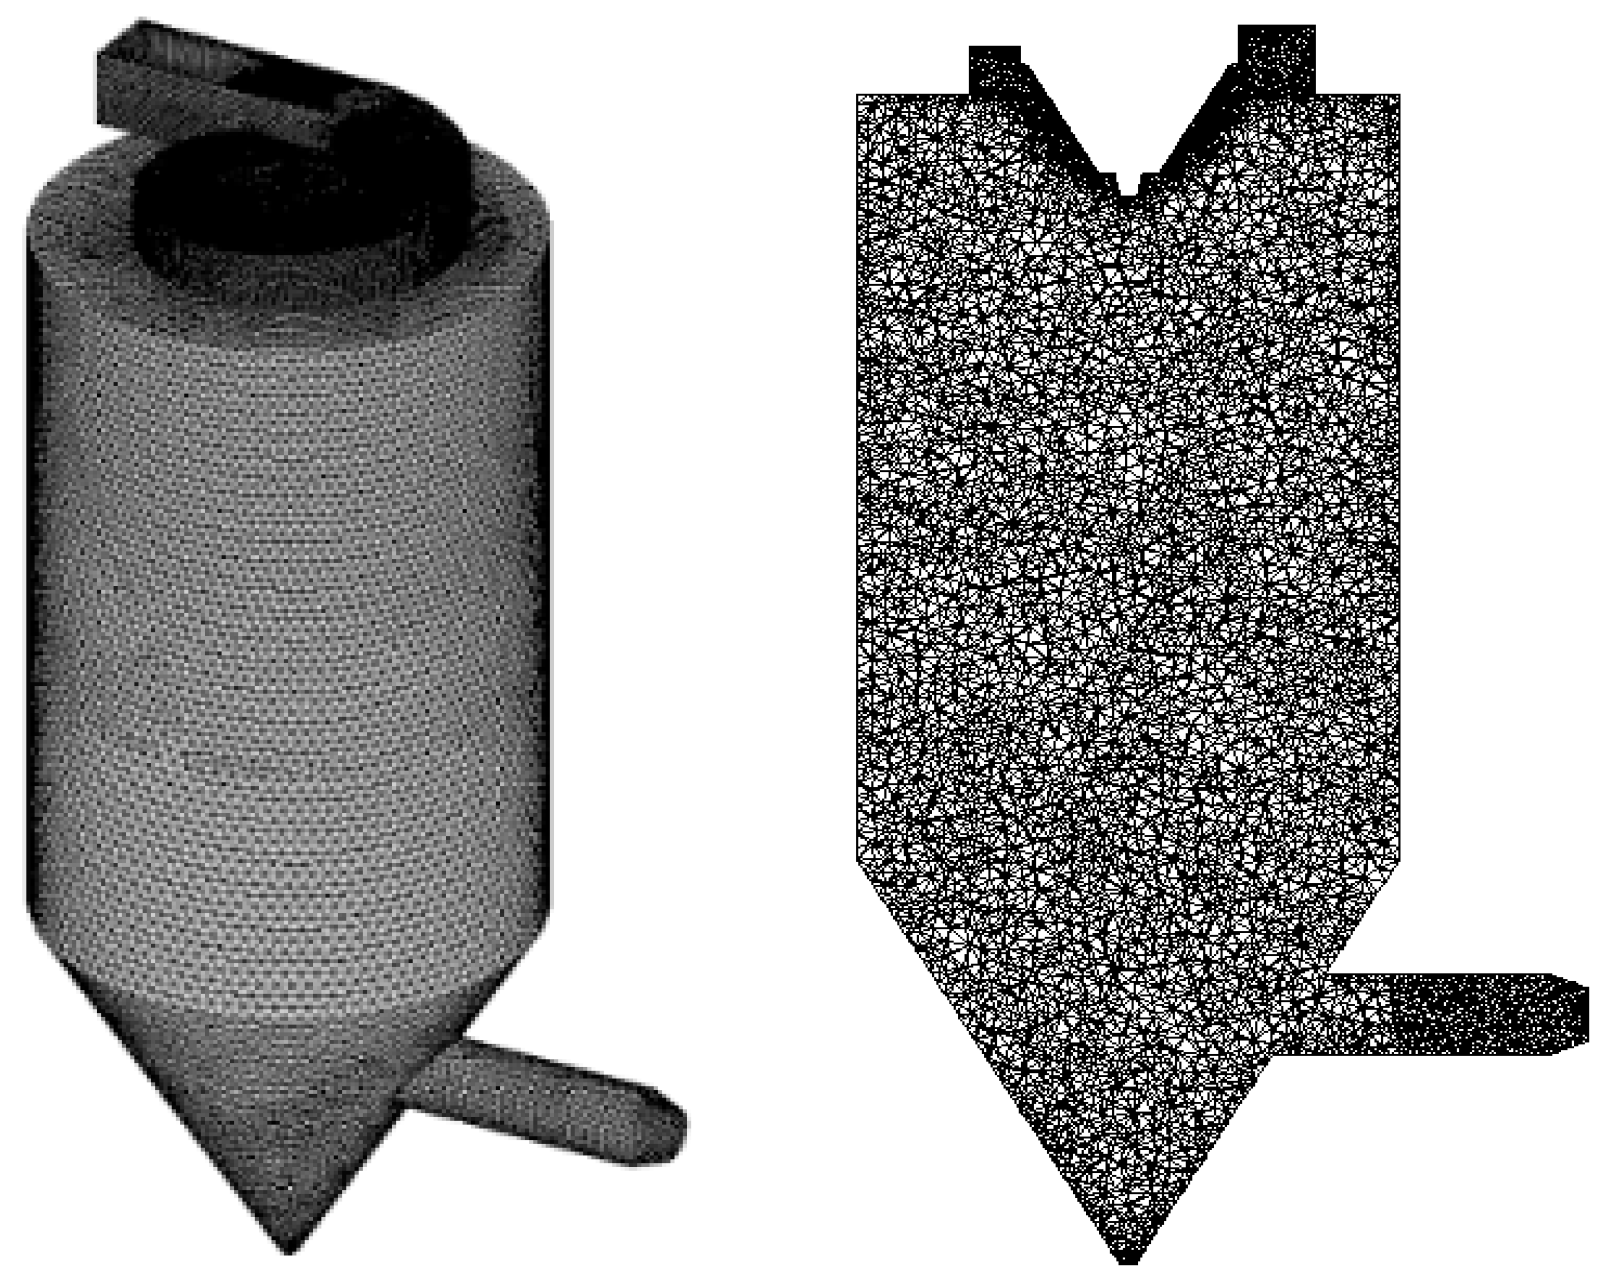
2.2. Numerical Method

In this work, commercial software (Ansys Fluent version 16.0) is adopted to perform this simulation. The continuous phase of drying gas is treated by an Eulerian approach, and a standard k-ε model is utilized for the turbulence description.
Continuity and momentum equations [23]:
ρ t + ( ρ v ) = S m
t ( ρ v ) + ( ρ v v ) = p + [ μ ( v + v T ) 2 3 μ v I ] + ρ g + F
where ρ and v are drying gas density and velocity, and Sm is the mass source term. ρ g is the gravitational force, F is the sum forces exerted by particles on the gas phase, μ is the drying gas effective viscosity, I is the unit tensor.
The standard k-ε is adopted to describe the flow. The turbulence kinetic energy and its rate of dissipation are obtained from the following transport equations [24]:
t ( ρ k ) + x i ( ρ k u i ) = x j [ ( μ + μ t σ k ) k x j ] + G k + G b ρ ε Y M + S k
t ( ρ ε ) + x i ( ρ ε u i ) = x j [ ( μ + μ t σ ε ) ε x j ] + C 1 ε ε k ( G k + C 3 ε G b ) C 2 ε ρ ε 2 k + S ε
where G k represents the generation of turbulence kinetic energy due to the mean velocity gradients, G b is the generation of turbulence kinetic energy due to buoyancy, Y M is the generation of turbulence kinetic energy due to buoyancy. C 1 ε , C 2 ε , and C 3 ε are constants. σ k and σ ε are the turbulent Prandtl numbers for k and ε . S k and S ε are user-defined source terms.
The trajectory of a discrete phase droplet integrates the force balance on the particle, which is written in a Lagrangian reference frame [25,26]. This force balance equates the droplet inertia with the forces acting on the droplet and can be written as:
d u p d t = F D ( u u p ) + g ( ρ p ρ ) ρ p + F
F D = 18 μ ρ p d p 2 C d Re p 24
Re p = ρ d p | u p u | μ
where u p is the droplet velocity, F D ( u u p ) is the drag force per unit droplet mass, u is the fluid phase velocity, ρ p is the density of the droplet, ρ is the fluid density, F is an additional acceleration (force/unit droplet mass) term, μ is the molecular viscosity of the fluid, Re is the relative Reynolds number of gas and liquid. C d is the drag coefficient.
The droplet temperature is updated according to a heat balance that relates the sensible heat change in the droplet to the convective and latent heat transfer between the droplet and the continuous phase [27]:
m p c p d T p d t = h A p ( T T p ) T p < T v a p
m p c p d T p d t = h A p ( T T p ) + d m p d t h l g     T v a p T p < T b p
d ( d p ) d t = 4 k g ρ p c p , g d p ( 1 + 0.23 Re p ) ln [ 1 + c p , g ( T T p ) h l g ]     T b p T p
where mp, cp, Tp, and Ap are the mass, specific heat capacity at constant pressure, temperature, and surface area of droplet particles, T is the temperature in the flue gas, T v a p is the droplet vaporization temperature, T b p is the boiling temperature of the droplet, h l g is the latent heat of the droplet vaporization, cp,g is the heat capacity of the gas, ρp is the droplet density, kg is the thermal conductivity of the gas. h is the convective heat transfer coefficient, which is calculated with a modified Nu number as follows [28]:
N u = h d p k = 2.0 + 0.6 Re d 1 / 2 P r 1 / 3
where k is the thermal conductivity of the continuous phase, Red is the Reynolds number, and Pr is the Prandtl number of the continuous phase.
The gas phase is described using the species transport model. The atomization model of the droplet adopts the hollow cone model. The atomization angle and inner diameter are 89° and 0.23 m, respectively. The droplet after atomizing follows the Rosin–Rammler distribution with the constant distribution coefficient (1.2). Different parts are meshed separately to attain a high-quality grid, as shown in Figure 3. After performing grid-independence tests, the mesh with 650,000 cells was finally used in the simulation study.
The simulated cases are listed in Table 2. Cases 1, 2, and 3 are used to study the influence of flue gas flow rate on evaporation performance. Cases 1, 4, and 5 are used to discuss the effect of flue gas temperature on evaporation performance. Cases 1, 6, and 7 are used to discuss the effect of wastewater flow rate on evaporation performance. Cases 1, 8, and 9 are used to discuss the effect of the initial temperature of wastewater on evaporation performance. Cases 10, 11, and 12 are used to discuss the effect of the droplet size of wastewater on evaporation performance. Cases 13–30 are the orthogonal test cases of evaporation performance.

2.3. Validation of the Simulated Results

To verify the model’s reliability, the measured and simulated temperatures, H2O(g) concentration at the outlet are compared, as shown in Table 3. The simulated results are consistent with the measured, proving that the model has high reliability and is acceptable in engineering.

3. Results and Discussion

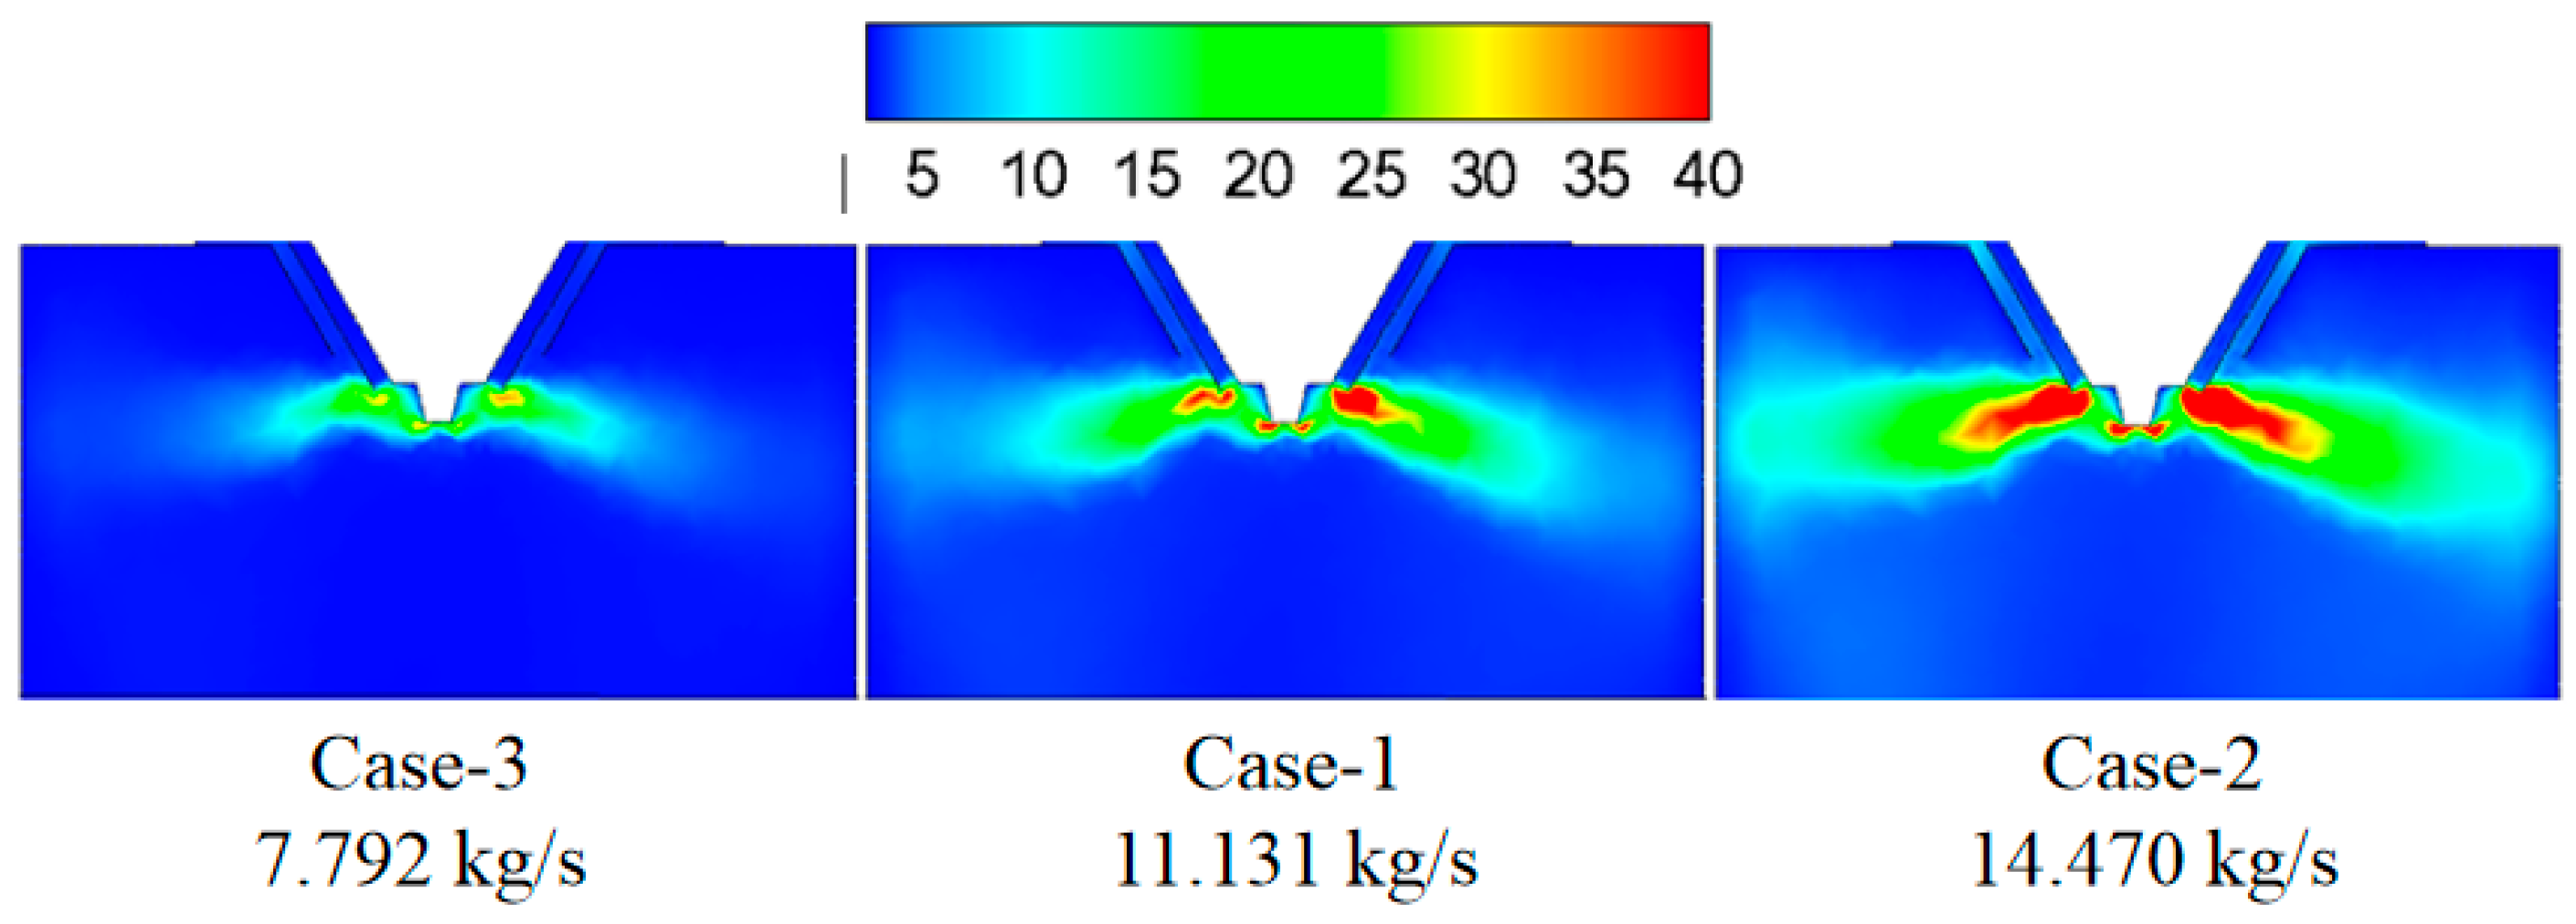
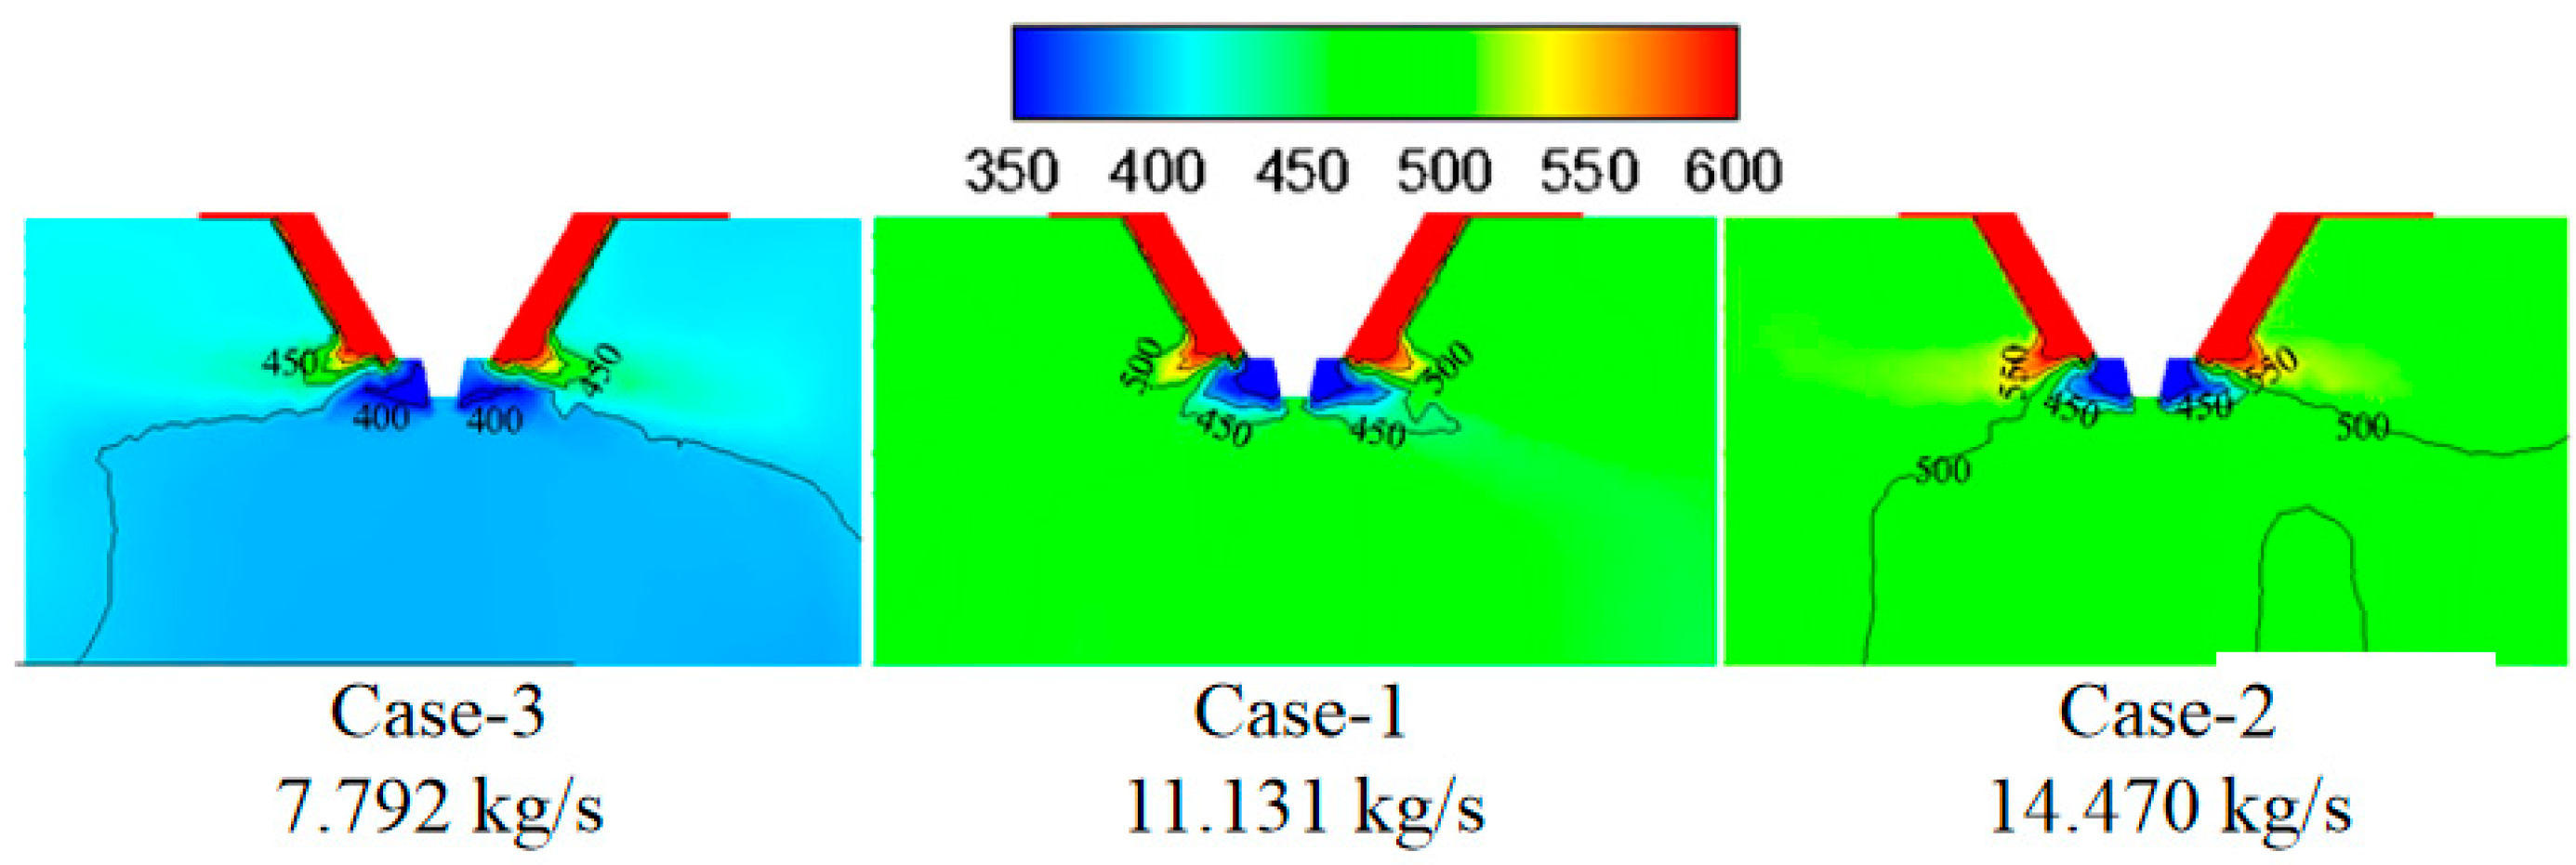
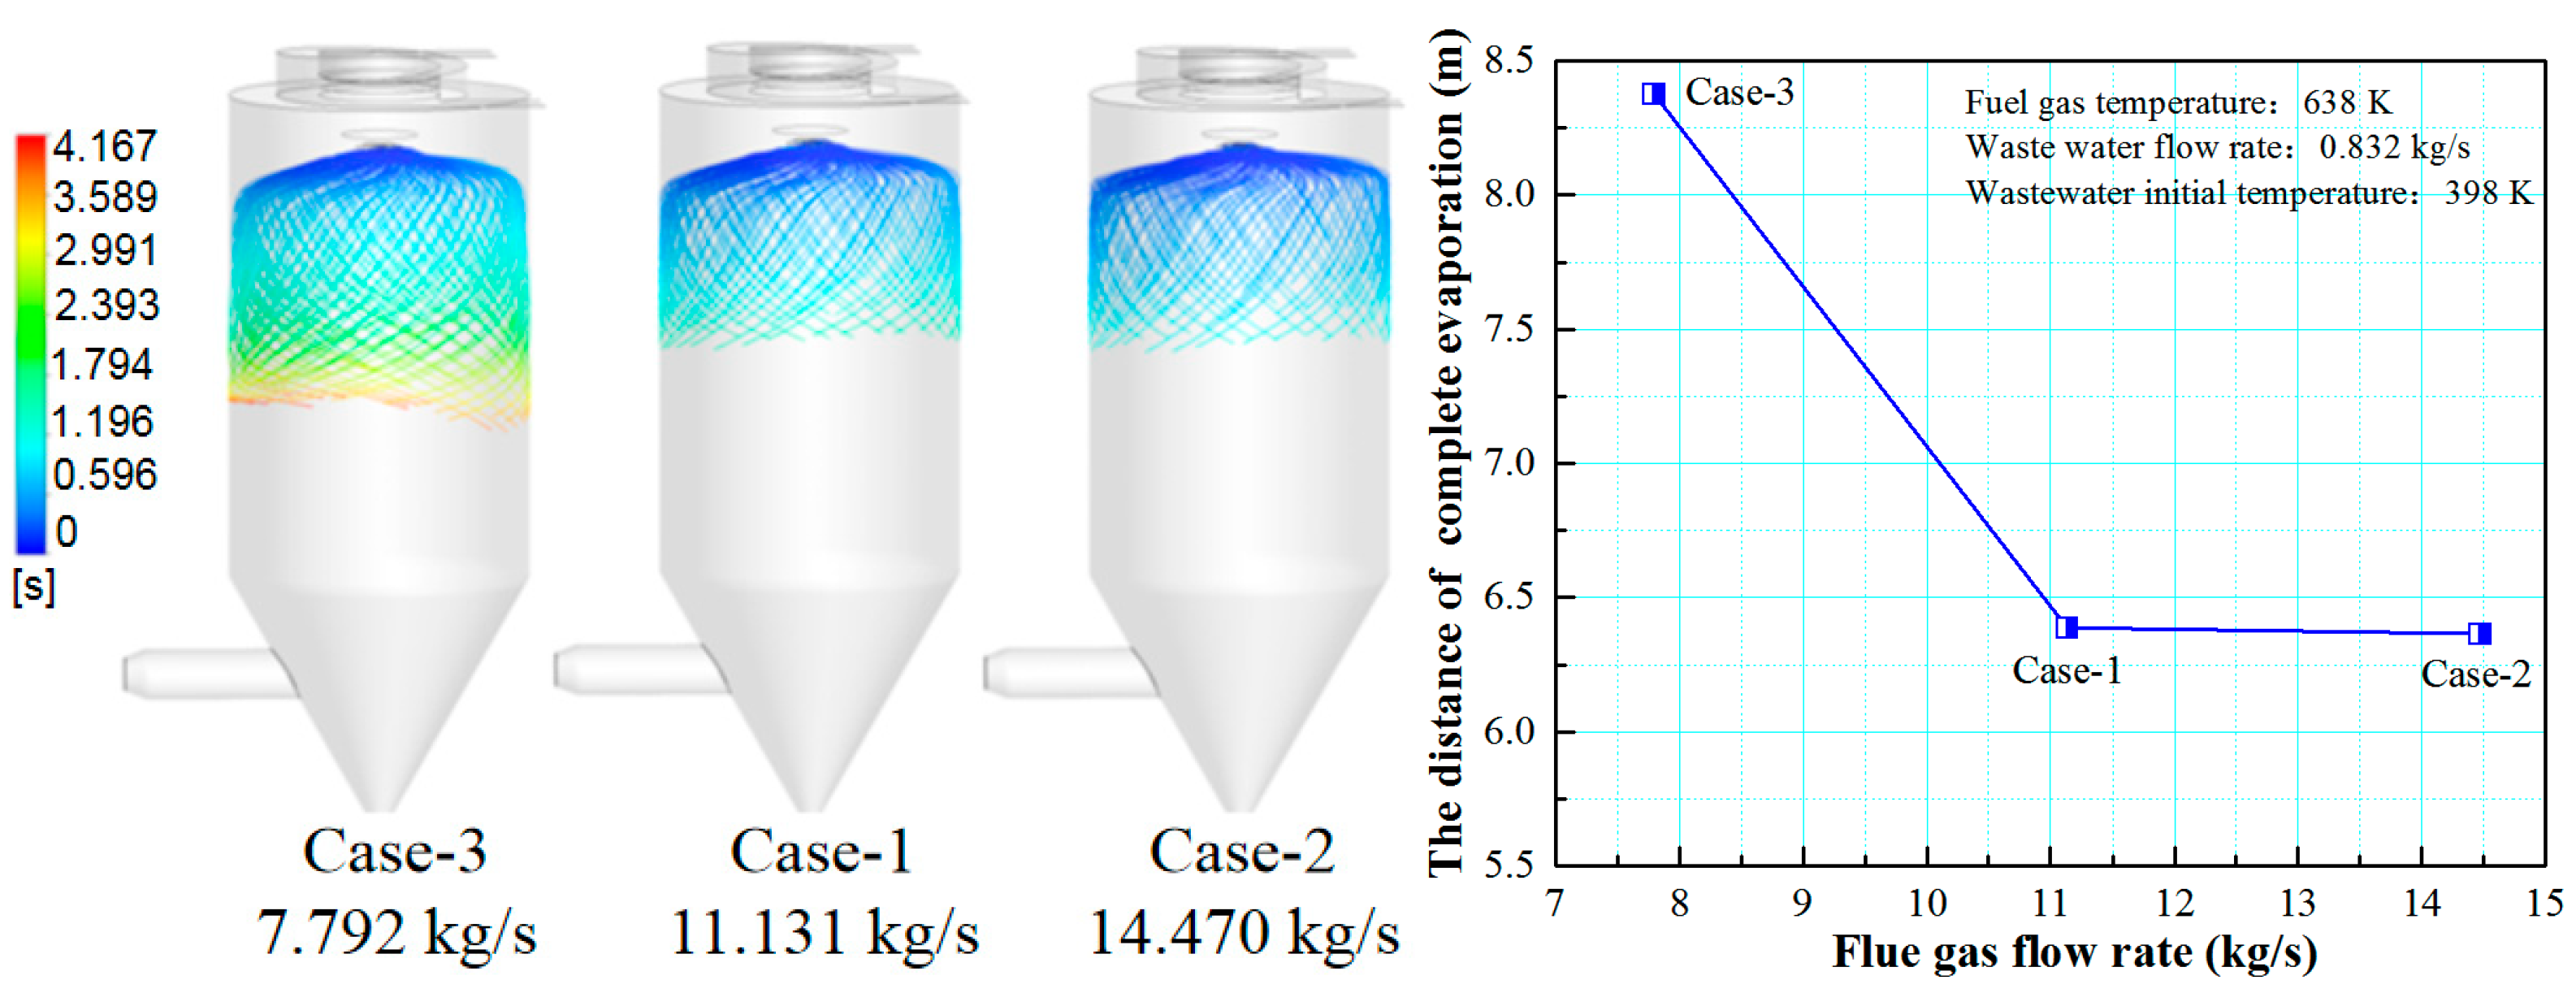
3.1. Effect of Flue Gas Flow Rate on the Evaporation Performance

Figure 4 shows the turbulence kinetic energy under different flue gas flow rates. By increasing the flue gas flow rate, the turbulence kinetic energy in the mixing zone of the flue gas and the droplets gradually increases, which indicates more vigorous mixing between the flue gas and the droplets. Figure 5 displays temperature under different flue gas flow rates. A larger flue flow rate corresponds to more heat, which is advantageous to droplet evaporation.
Figure 6 shows the effect of flue gas flow rate on the evaporation performance of the droplets in the spray drying tower. It can be seen that as increasing the flue gas flow rate from 7.792 (case-3) to 11.131 kg/s (case-1), the droplet evaporation time in the spray drying tower significantly decreases, and the distance of complete evaporation greatly decreases from 6.8 to 4.8 m. This can be explained by considering that the increase of the flue gas flow rate introduces more heat into the drying tower, which enhances the droplets evaporation performance. By further increasing the flue gas flow rate from 11.131 to 14.470 kg/s, the droplet evaporation time changes slightly, and the distance of complete evaporation only decreases from 4.8 to 4.7 m. Therefore, higher flue gas flow rate corresponds to shorter droplet evaporation time and shorter complete evaporation distance. Still, if the flue gas flow rate exceeds a certain level, the improvement of the droplet evaporation performance is not apparent. In actual operation, taking the evaporation performance and the safety of boiler operation into consideration, an appropriate amount of flue gas flow should be chosen.

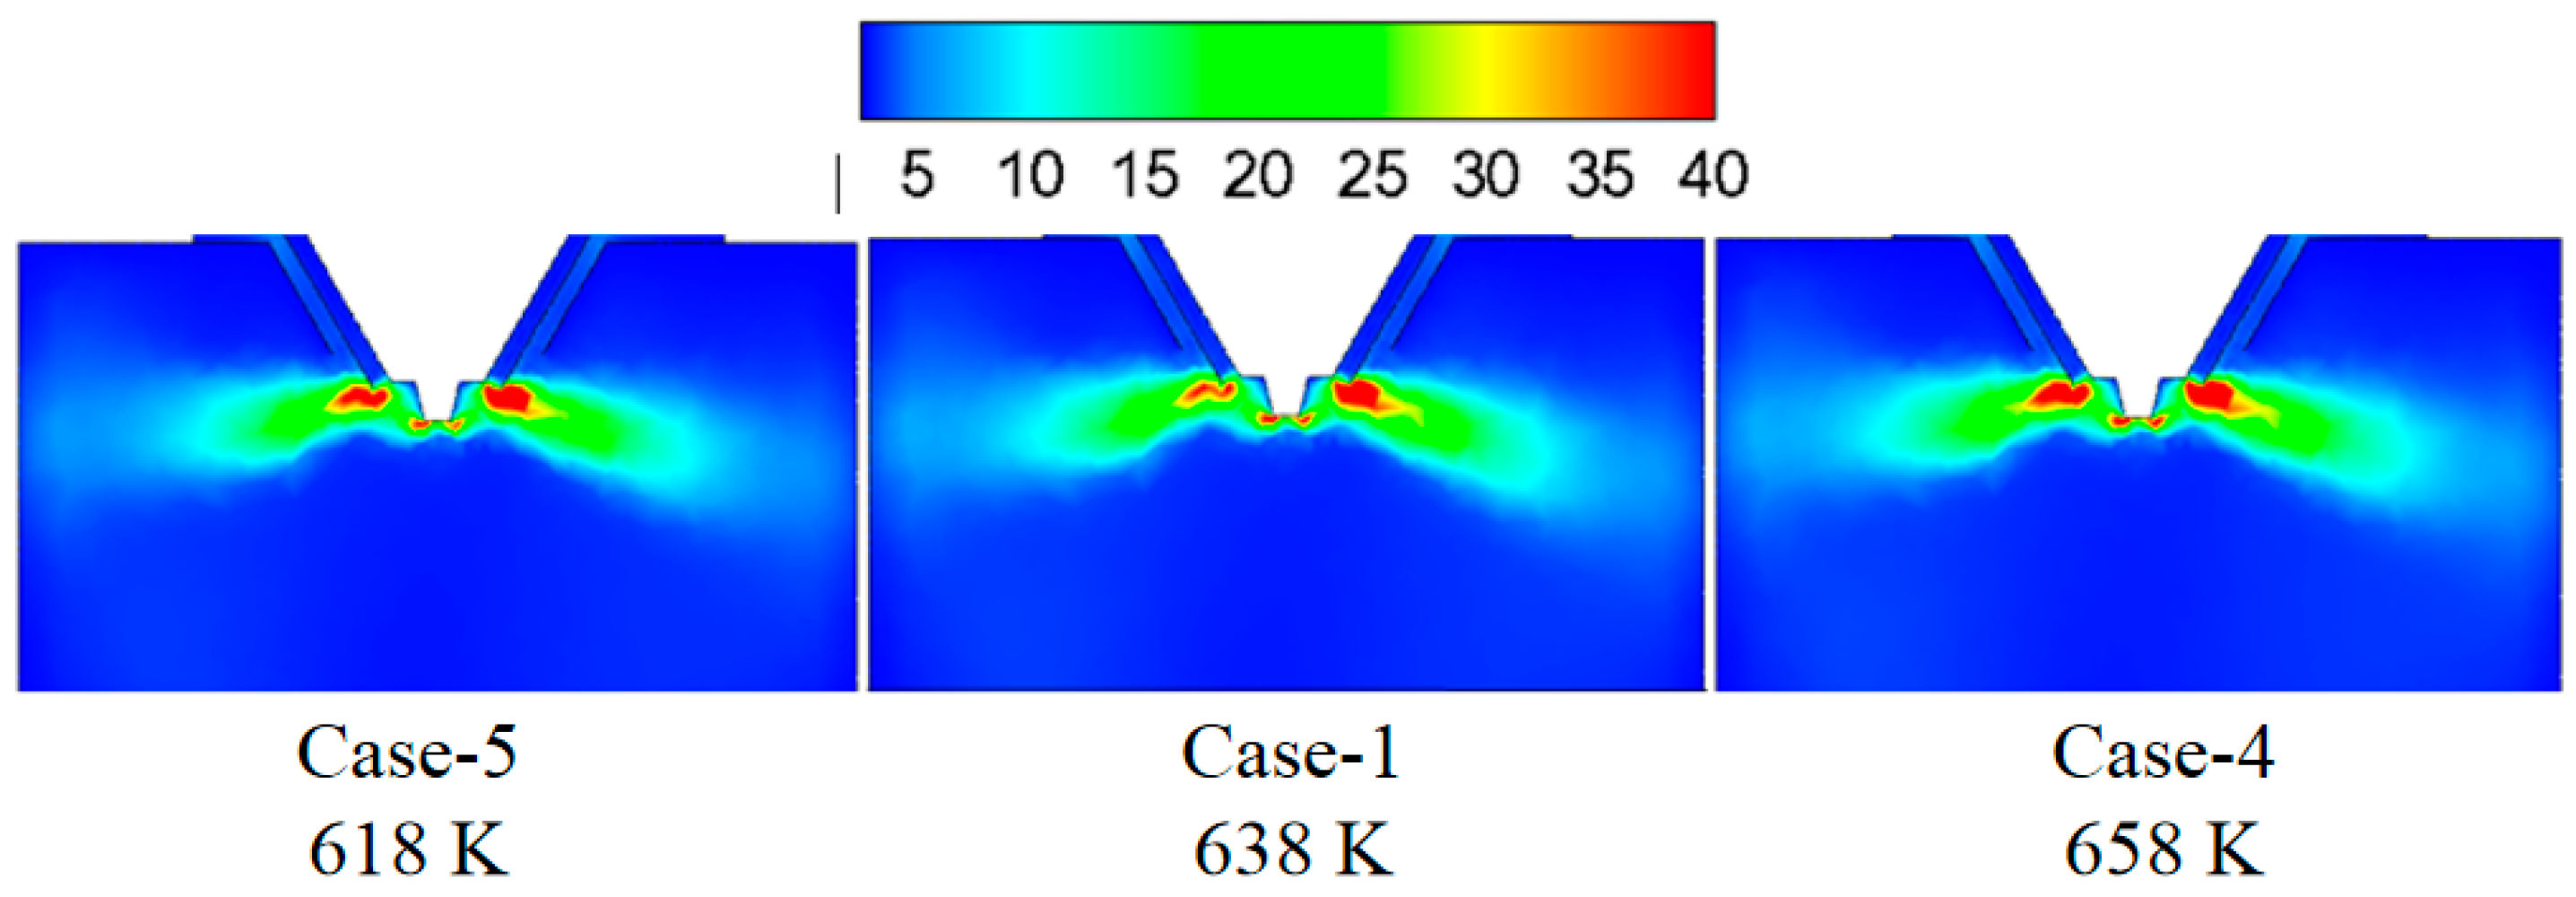
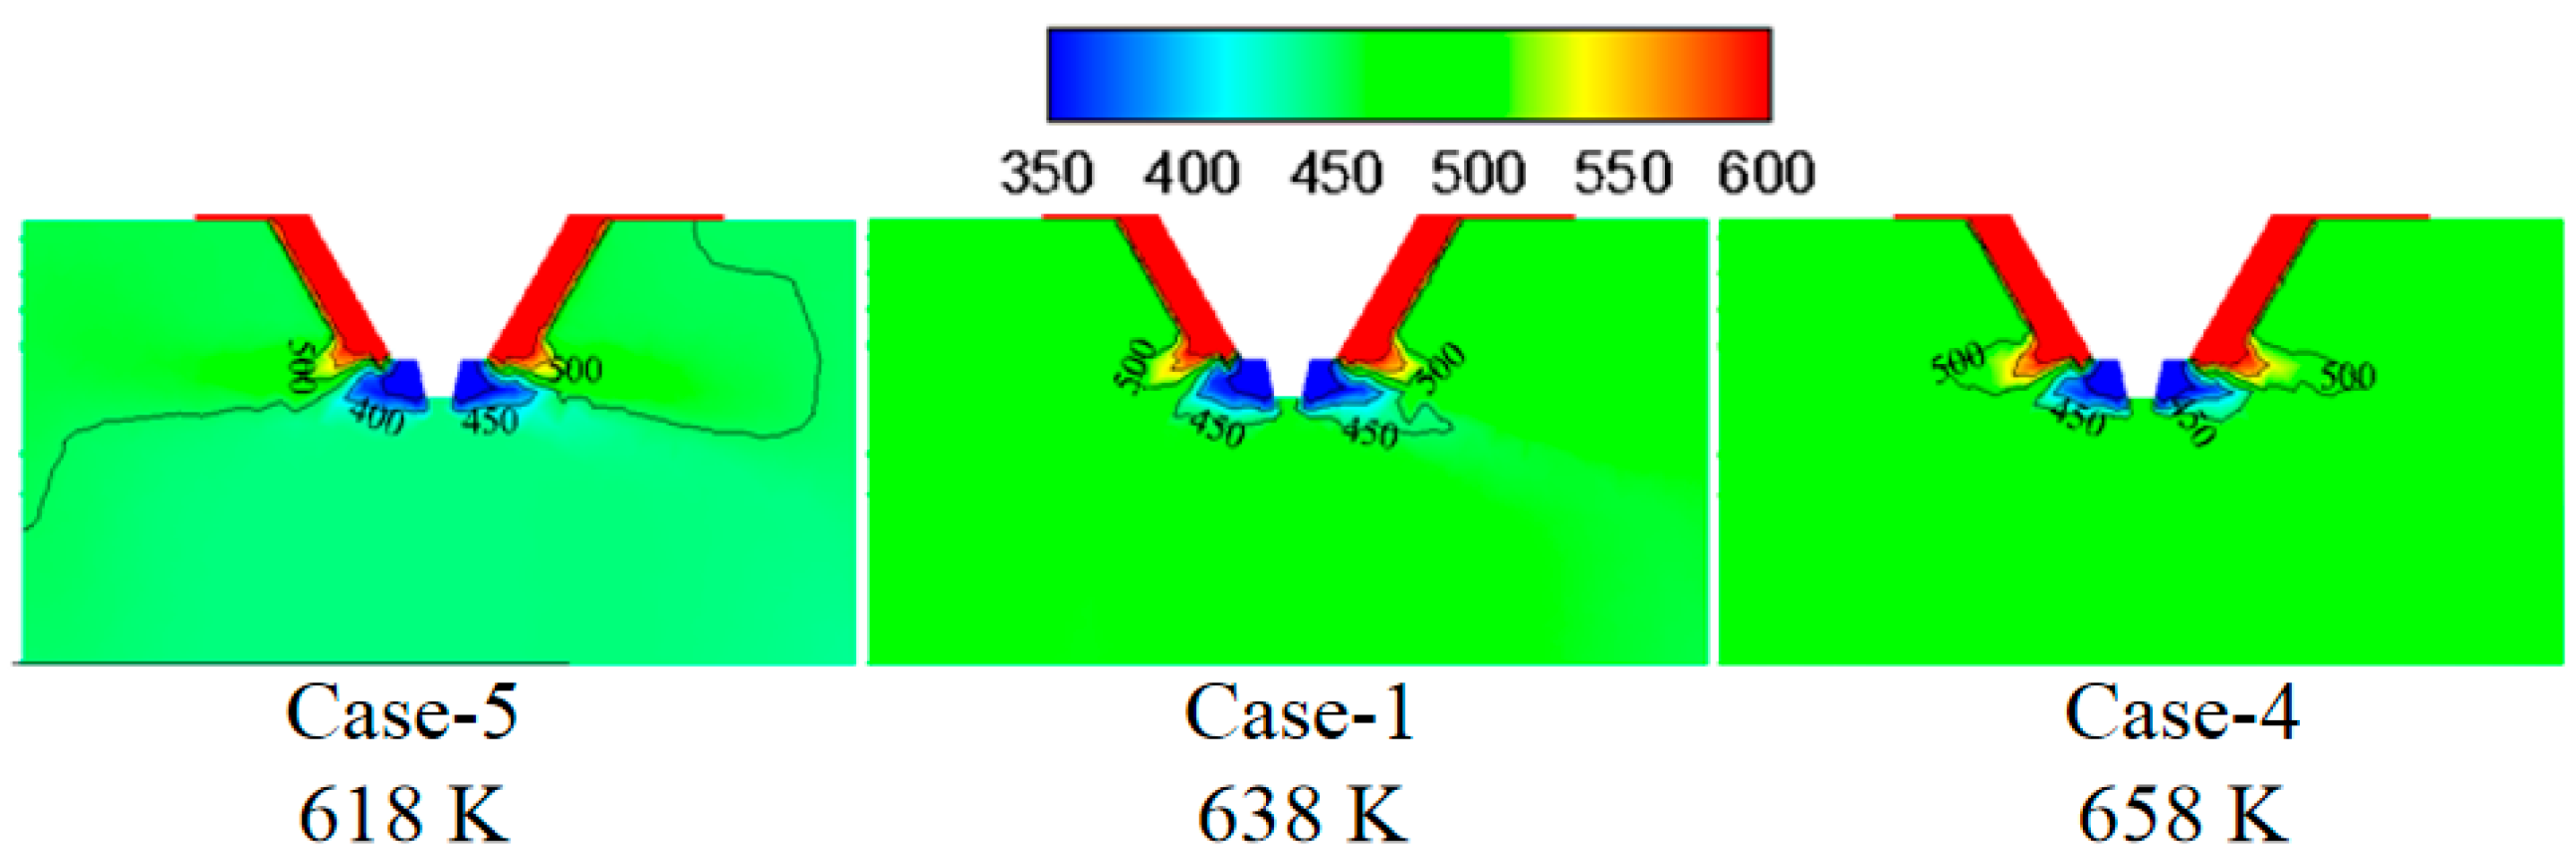
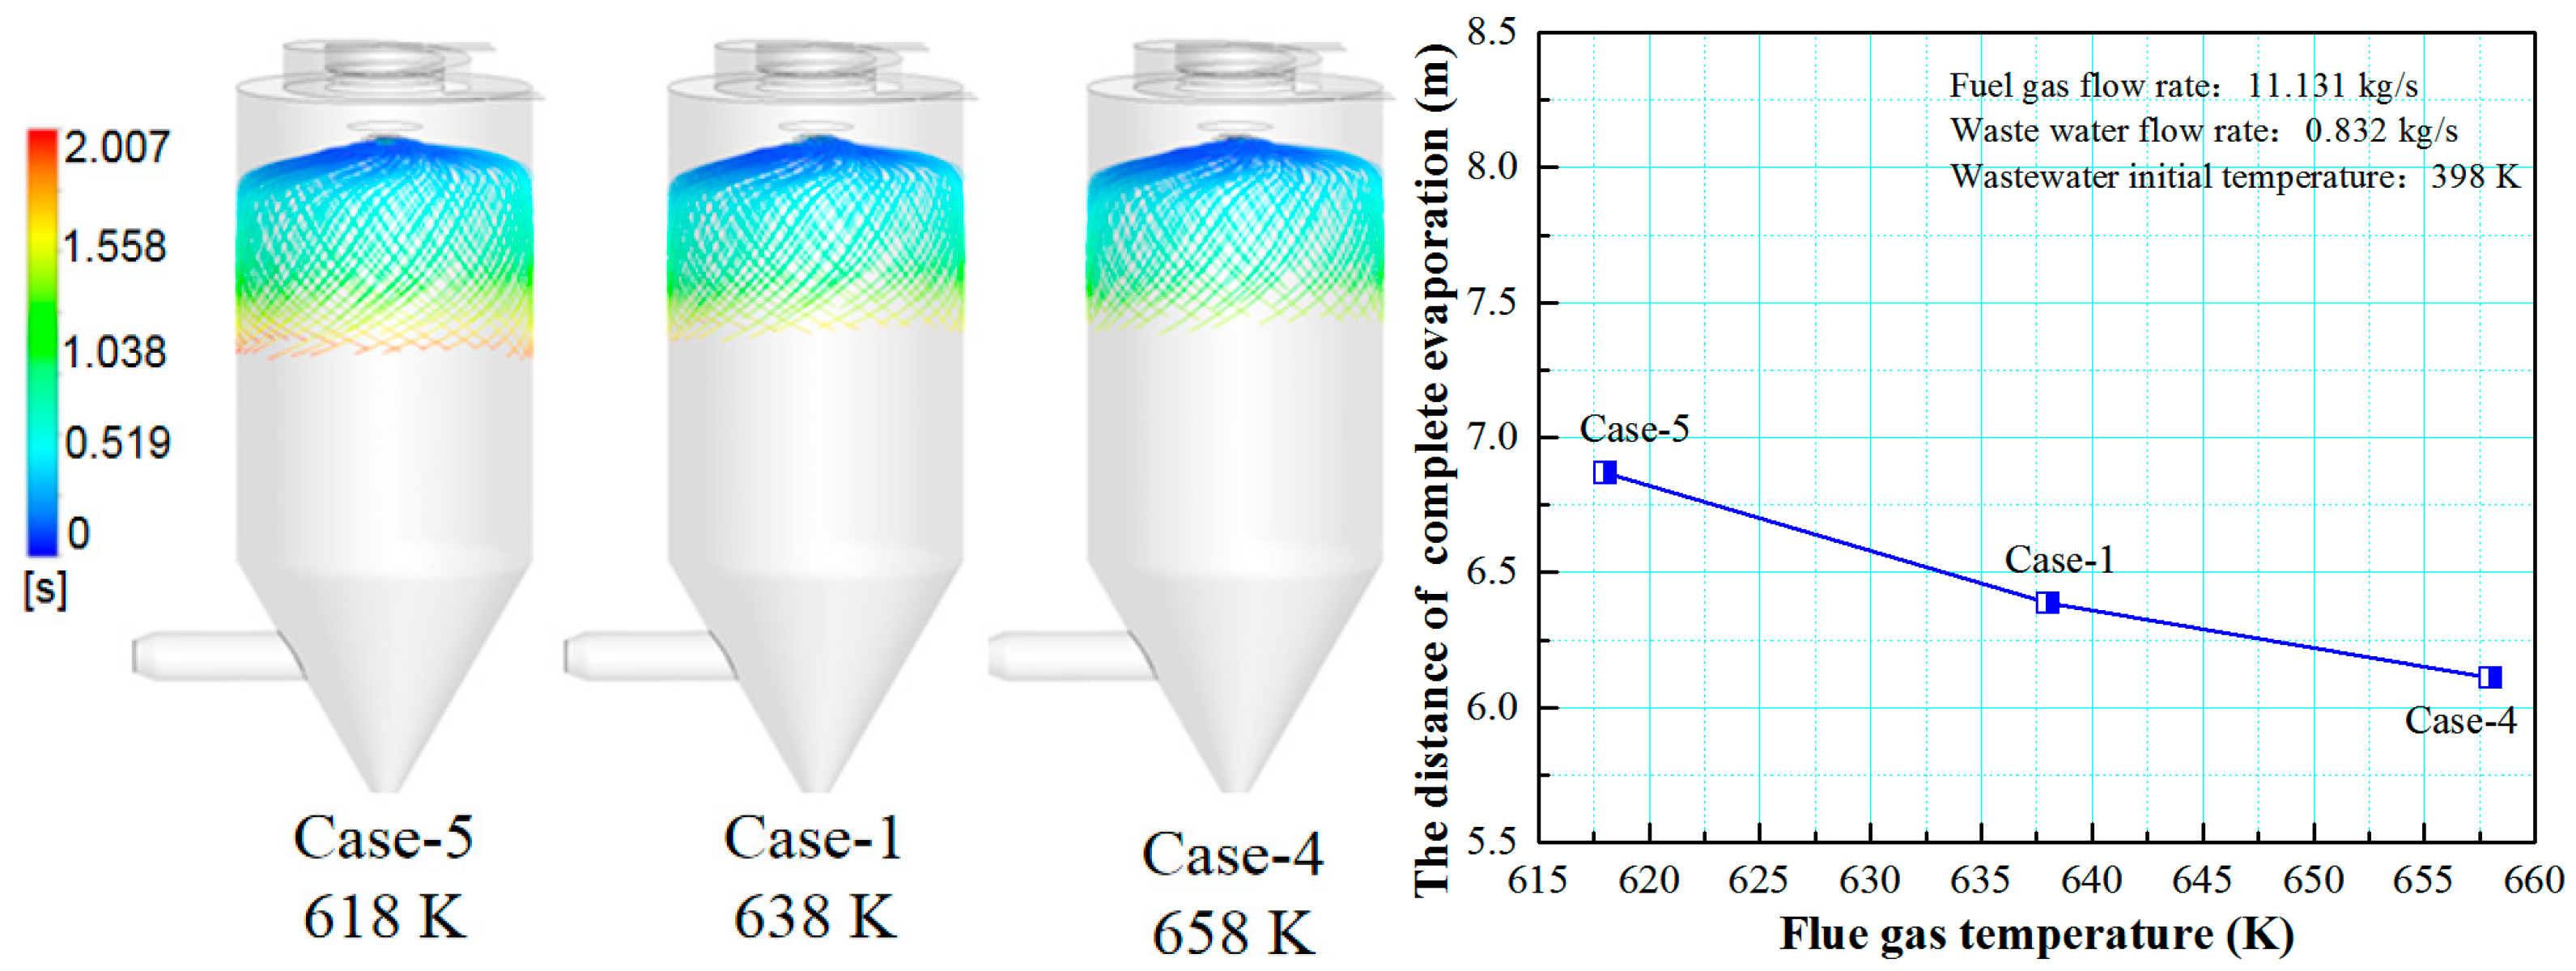
3.2. Effect of Flue Gas Temperature on the Evaporation Performance

Figure 7 shows the turbulence kinetic energy under different flue gas temperatures. By increasing the flue gas temperature, the turbulence kinetic energy in the mixing zone of the flue gas and the droplets changes slightly, which indicates the slight difference in the mixing intensity between flue gas and droplets. Figure 8 displays temperature under different flue gas flow rates. Higher flue gas temperature corresponds to higher temperature and more heat in the mixing zone of flue gas and droplets, which is advantageous to evaporate the droplets.
Figure 9 shows the effect of flue gas temperature on the droplet evaporation performance in the spray drying tower. It can be seen that increasing the flue gas temperature is beneficial for reducing the droplet residence time in the spray drying tower and improving droplet evaporation performance. This is because the higher flue gas temperature increases the temperature difference between the flue gas and the droplets, enhancing the diffusion and thermophoretic force effects. As a result, heat and mass transfer become more vital, and the droplet evaporation speed is accelerated and reduces the complete evaporation distance.

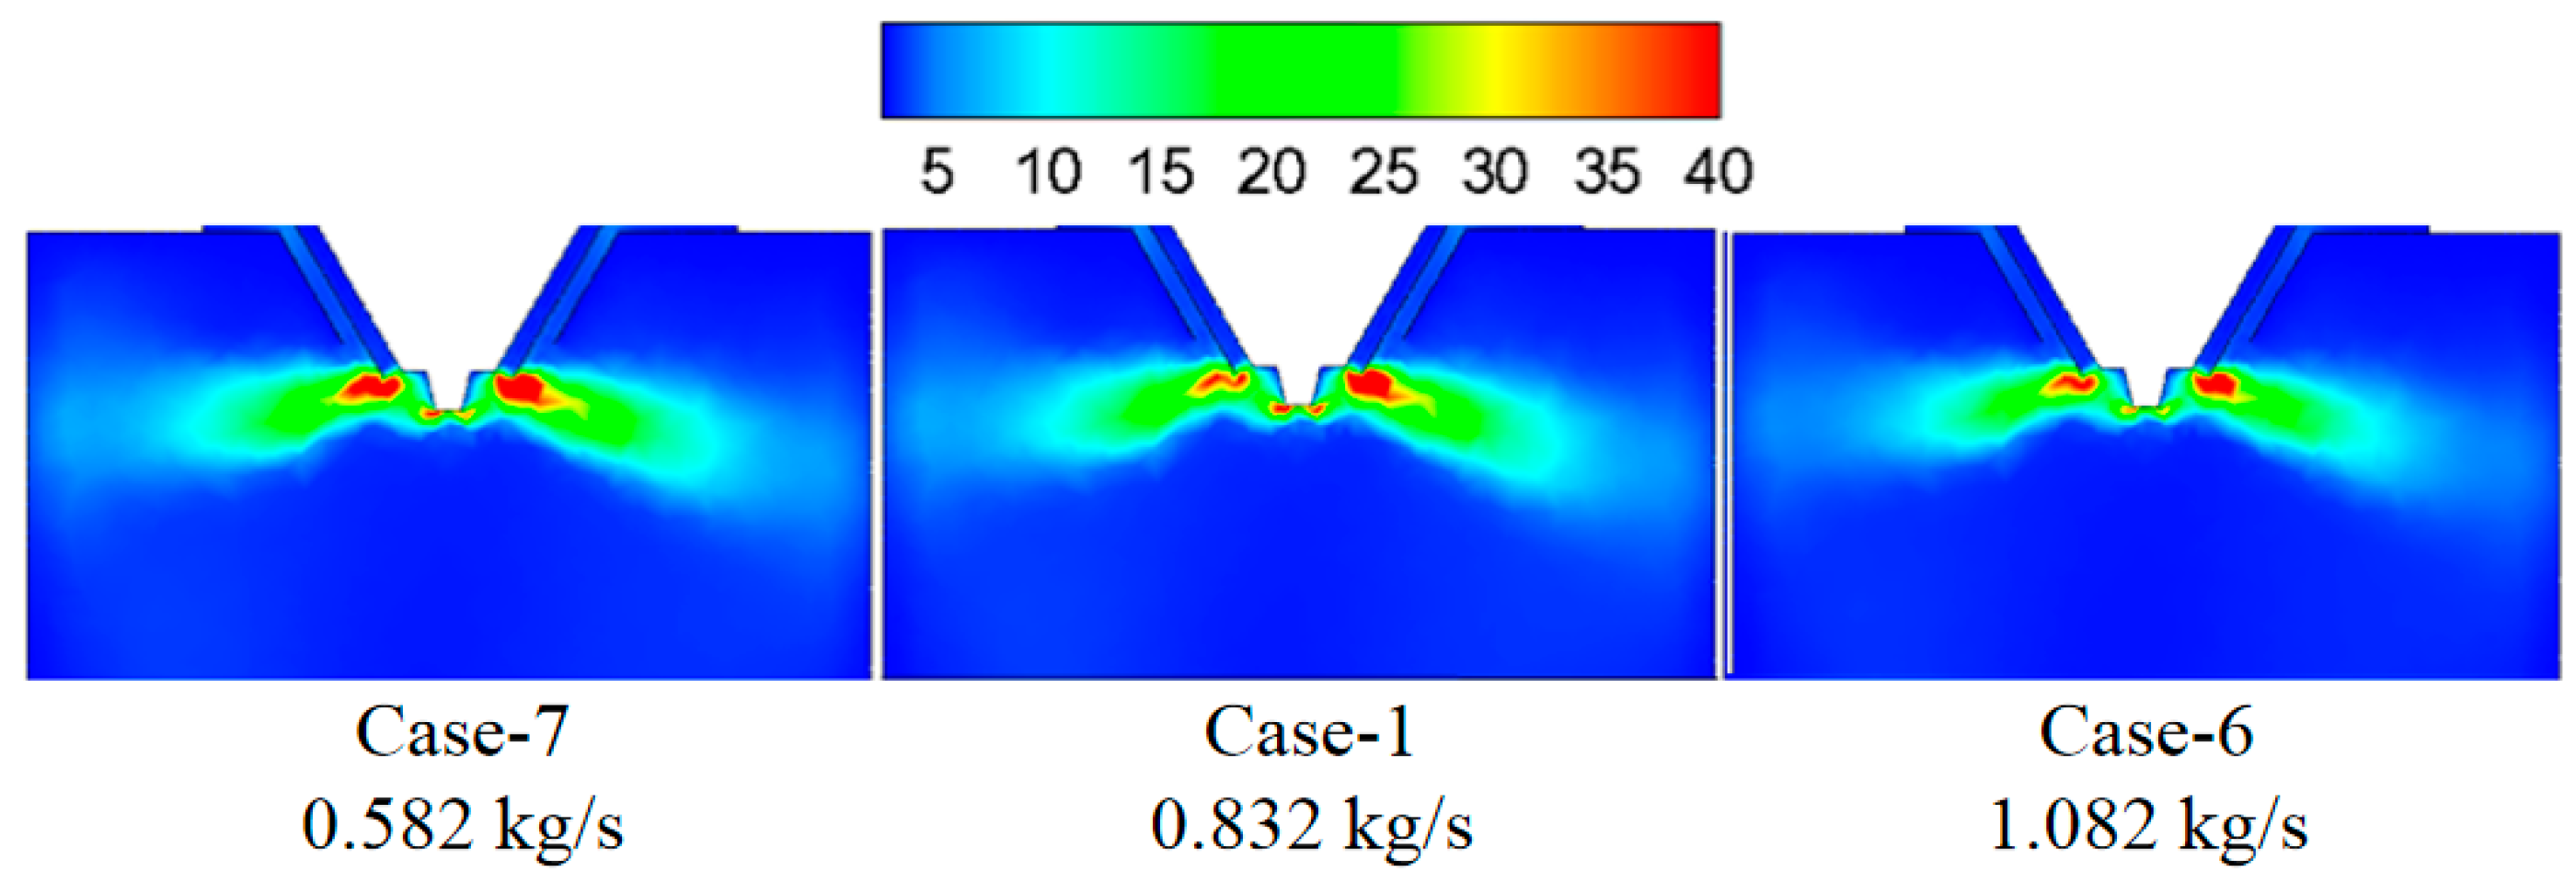
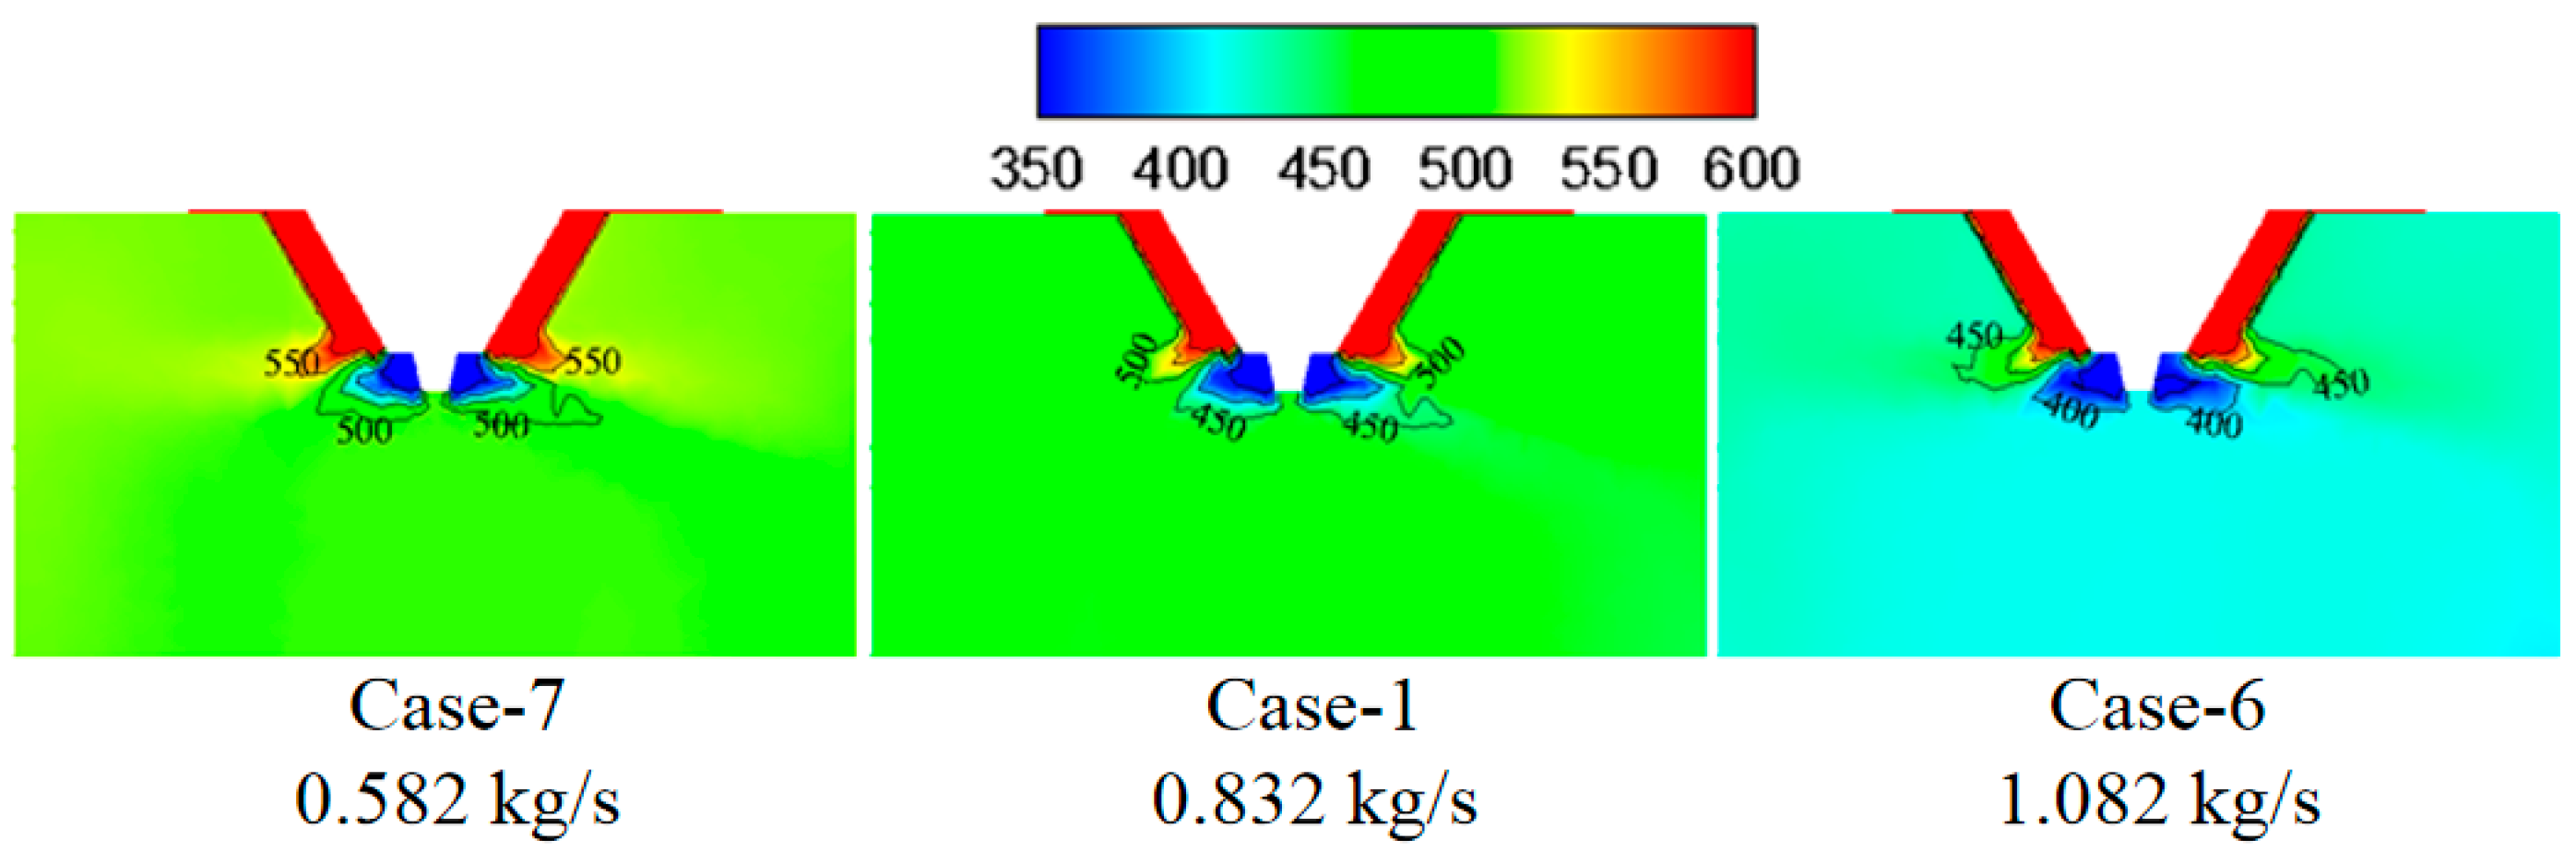
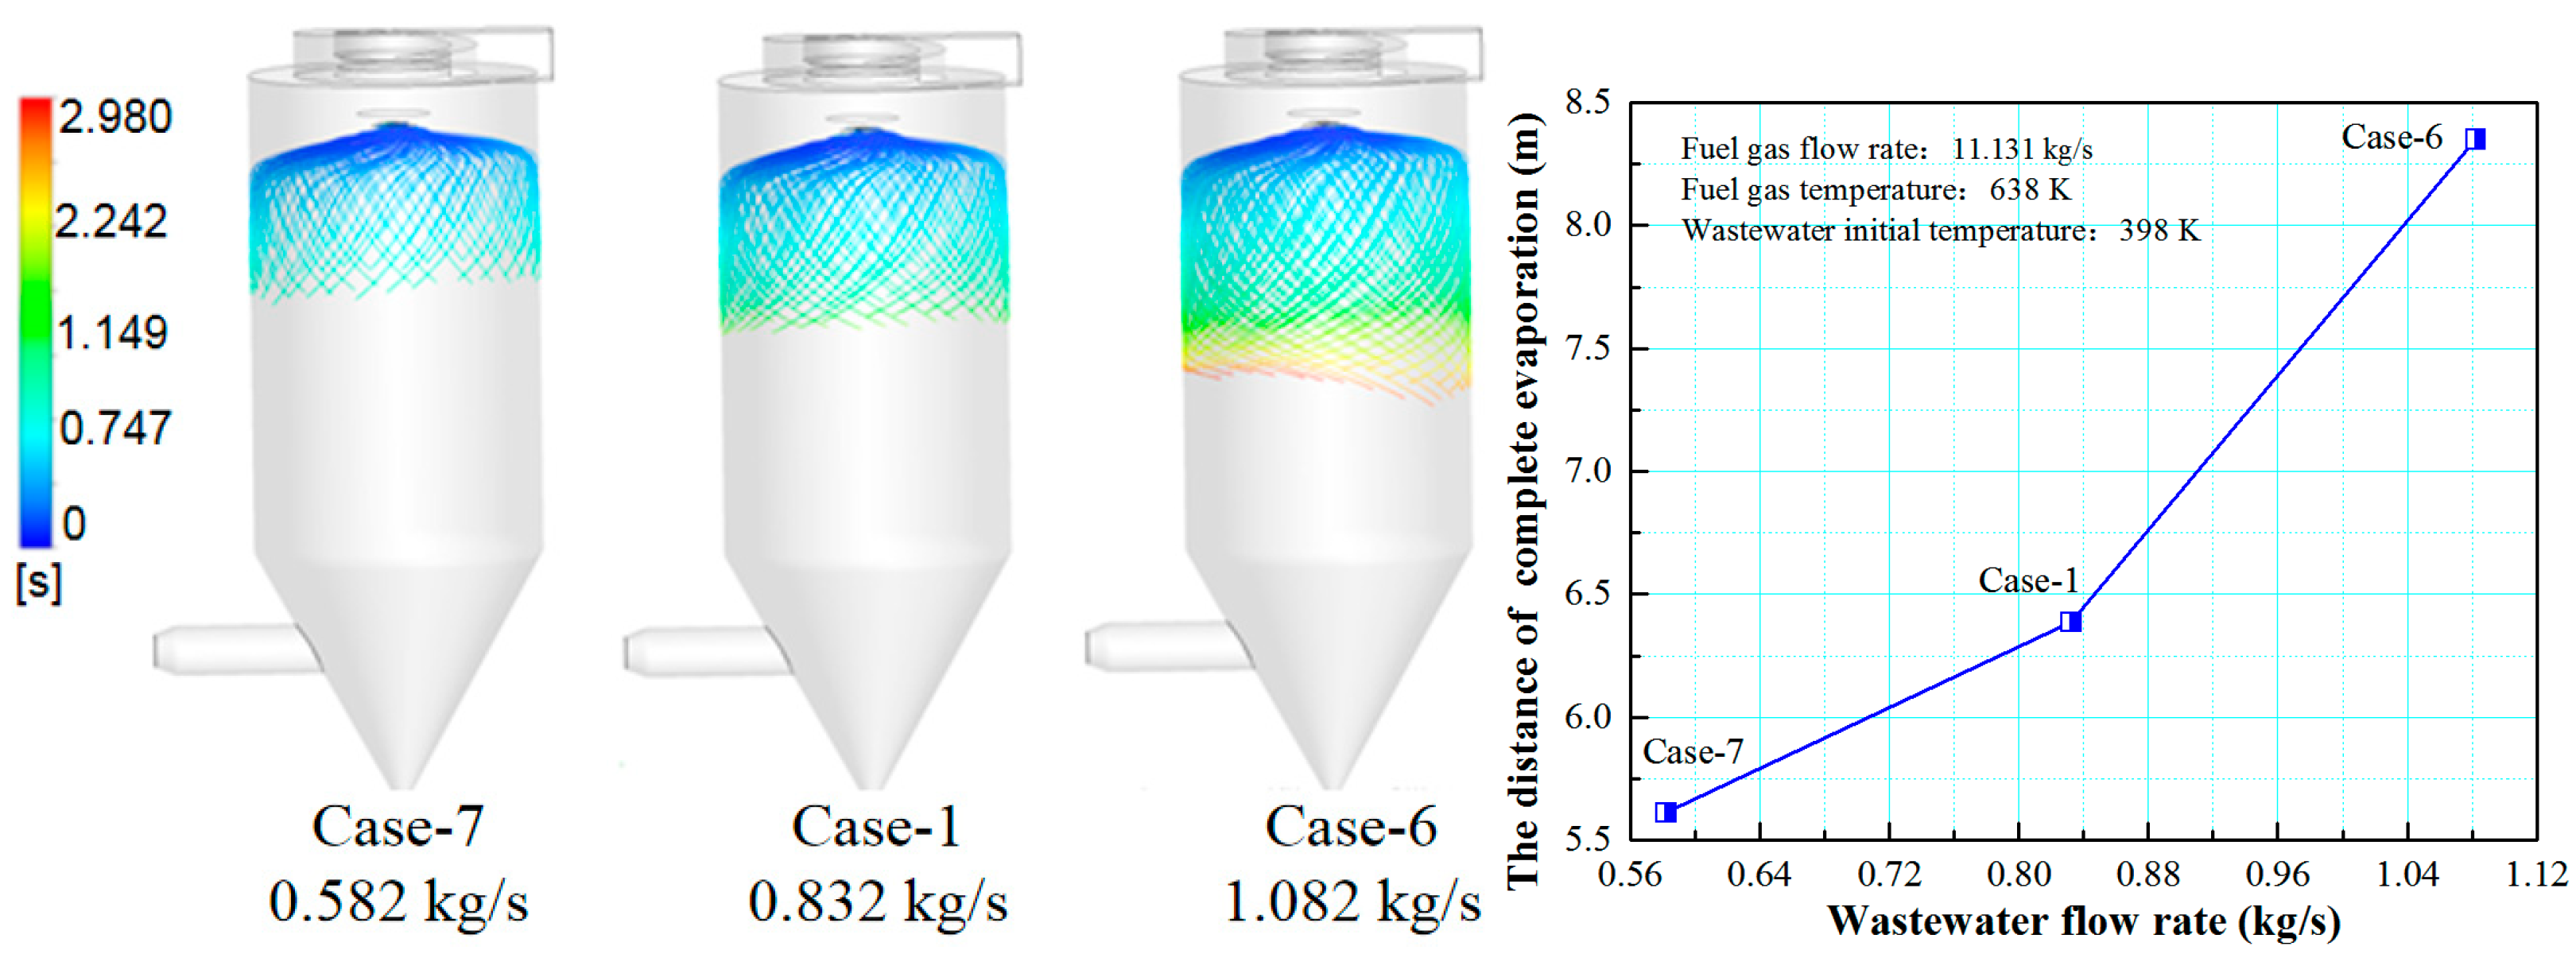
3.3. Effect of Wastewater Flow Rate on The Evaporation Performance

Figure 10 shows the turbulence kinetic energy under different wastewater flow rates. By increasing the wastewater flow rate, the turbulence kinetic energy in the mixing zone of flue gas and droplet changes slightly, which indicates the slight difference in the mixing intensity between flue gas and droplet. Figure 11 displays temperature under different wastewater flow rates. The larger wastewater flow rate corresponds with the lower temperature in the mixing zone of flue gas and droplets because the evaporation process of larger wastewater flow rate absorbs more heat.
Figure 12 shows the effect of wastewater flow rate on the droplet evaporation performance in the spray drying tower. With the increase of the wastewater flow rate, the droplet residence time in the spray drying tower becomes longer and the complete evaporation distance increases, thus, reducing the wastewater flow rate is beneficial to the evaporation performance of the wastewater. On the one hand, under the same flue gas flow rate, the input heat is constant. The larger wastewater that needs to be processed, the more time it takes to evaporate. On the other hand, the larger wastewater flow rate contains more large-diameter droplets. For these large-diameter droplets, more time is required for them to evaporate completely, and the complete evaporation distance is longer. Therefore, it is necessary to design the wastewater flow rate in a spray drying tower.

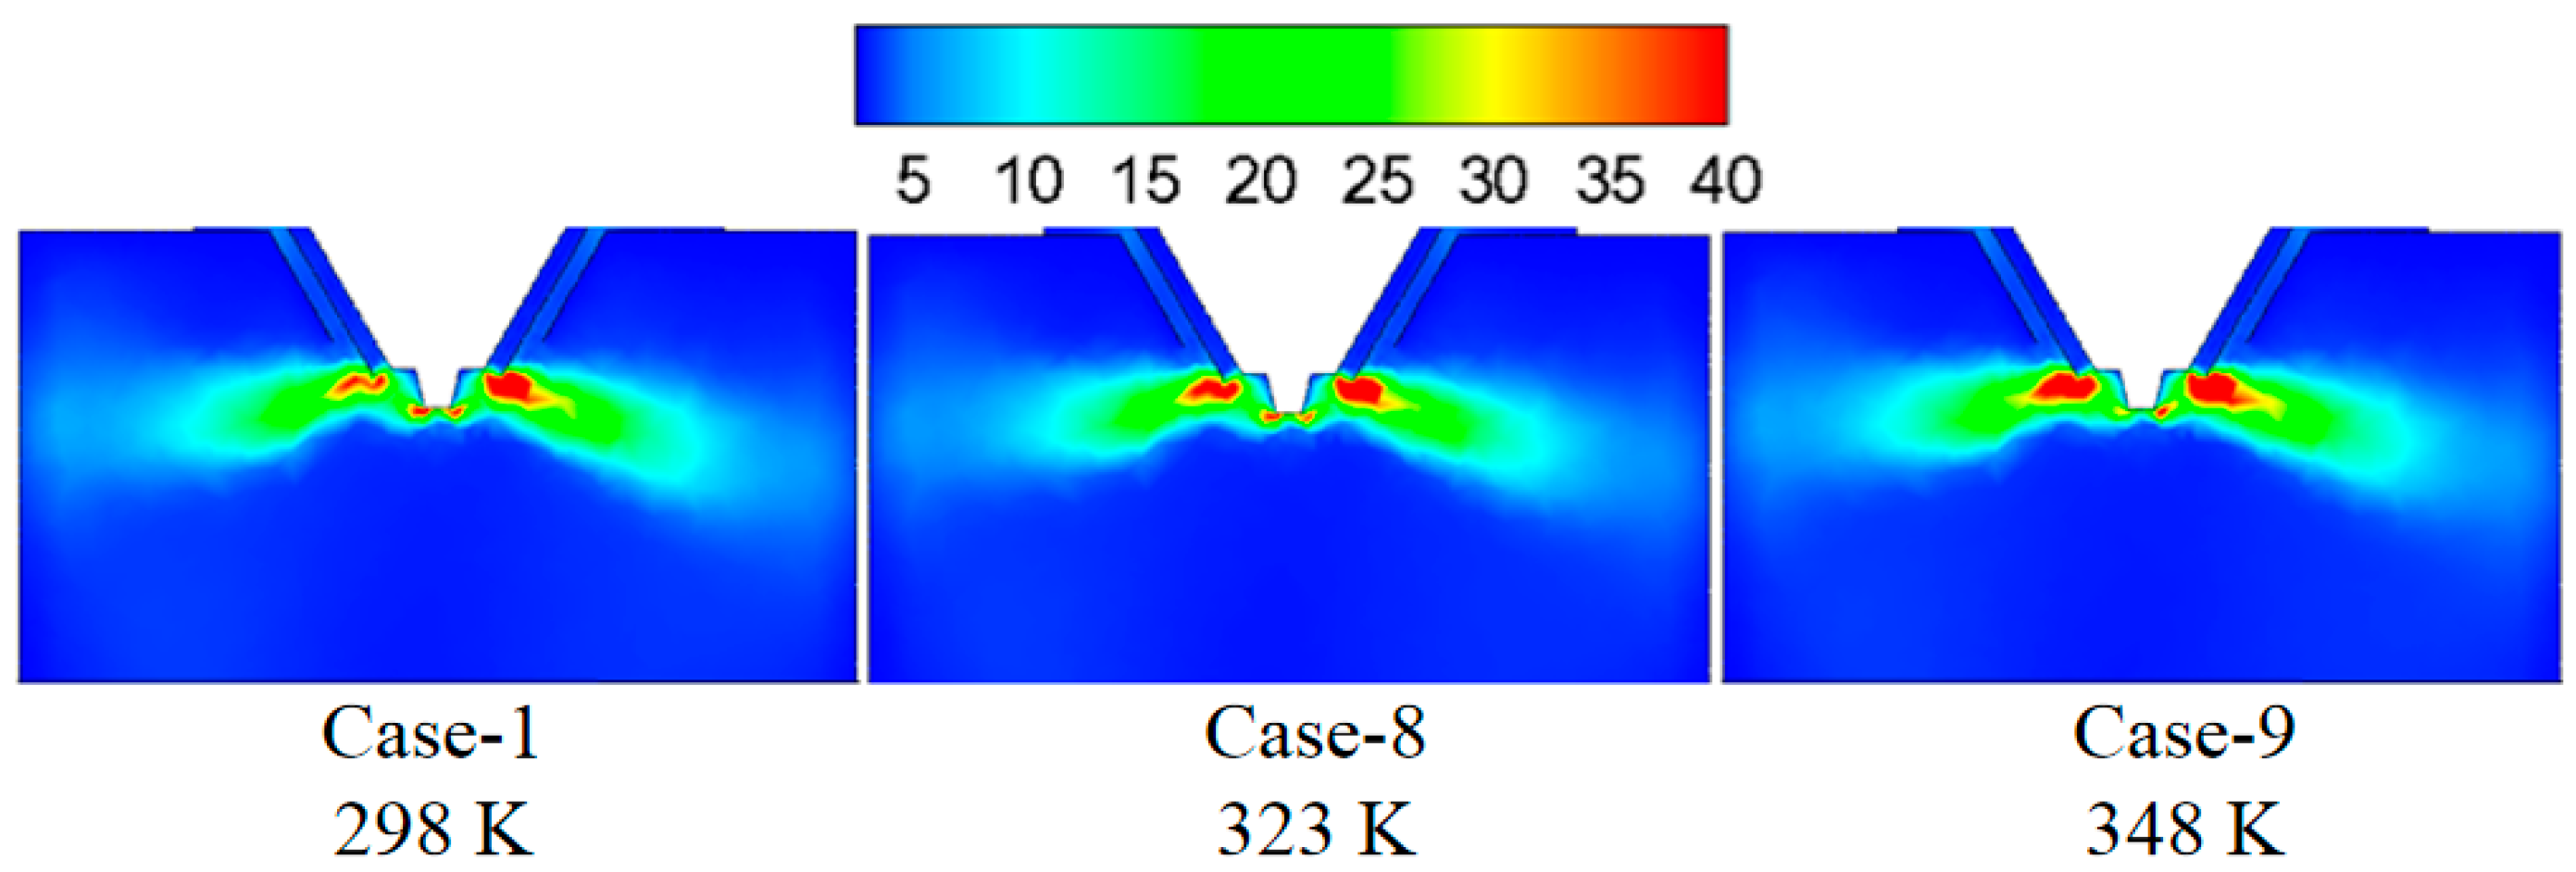
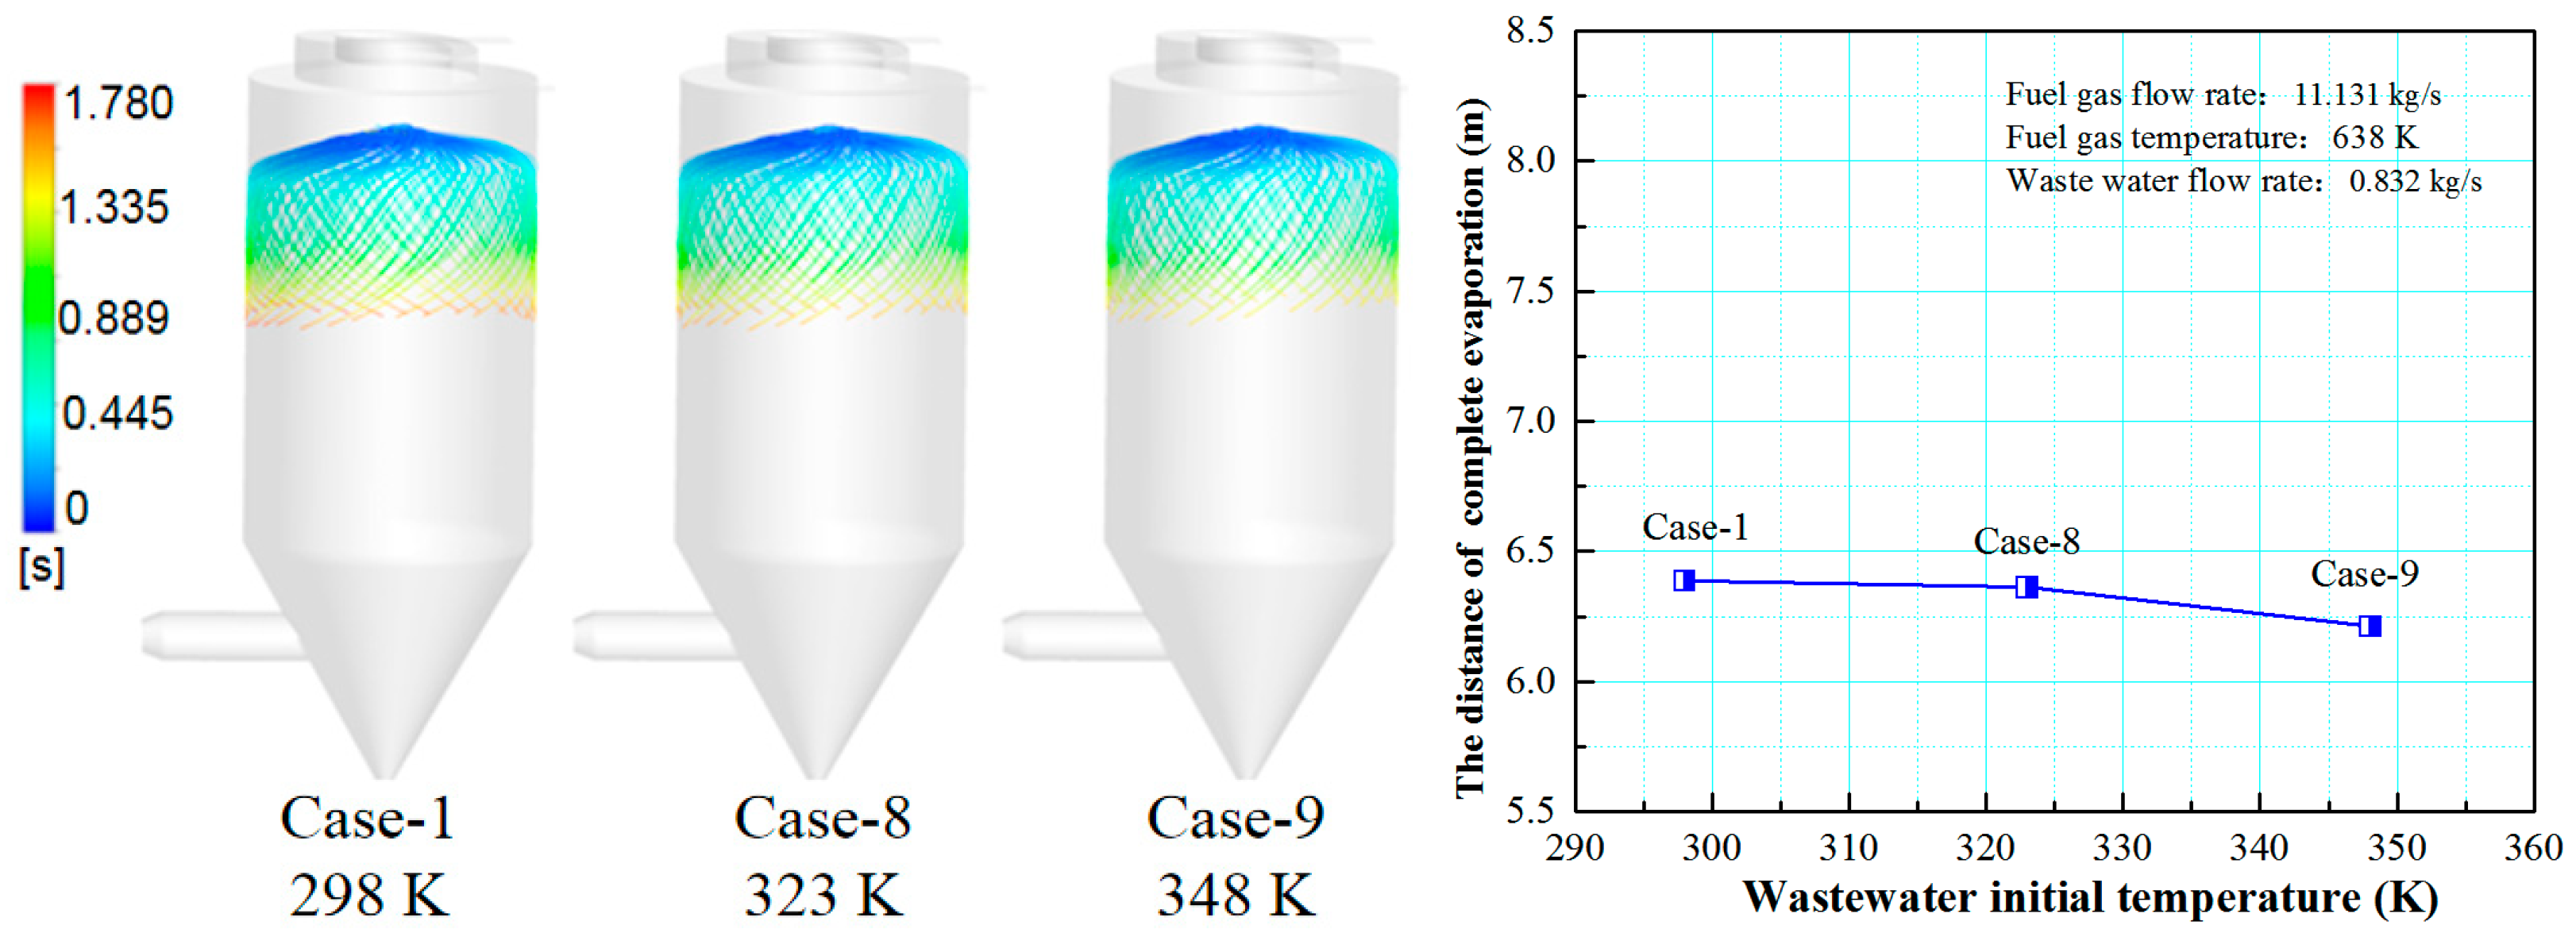
3.4. Effect of Wastewater Initial Temperature on the Evaporation Performance

Figure 13 shows the turbulence kinetic energy under different initial wastewater temperatures. By increasing the initial wastewater temperature, the turbulence kinetic energy in the mixing zone of the flue gas and the droplets changes slightly. Figure 14 displays temperature under different initial wastewater temperatures. Higher initial wastewater temperature corresponds to the higher temperature of the flue gas and the droplets in the mixing zone because the evaporation process of the wastewater droplet absorbs less heat under the constant input heat.
Figure 15 shows the effect of wastewater flow rate on the evaporation performance of the droplet in the spray drying tower. It can be seen that as the initial temperature of the wastewater increases from 298 to 348 K, the complete evaporation distance is reduced from 4.8 to 4.6 m, which is only 0.2 m. Additionally, there is no significant difference in the trajectory of the droplets under different initial wastewater temperatures. It can be concluded that the complete evaporation distance gradually decreases with the increase of the initial temperature of the wastewater, but the reduction degree is minimal. This is because if the initial temperature of the wastewater is higher, less heat is needed, and the evaporation temperature is reached quicker. However, this part of the heat only accounts for a small proportion of the heat carried by the flue gas, thus, the change of the initial temperature of the droplet has little effect on its complete evaporation distance. In the actual operation of the power plant, although the evaporation process of the desulfurization wastewater can be improved by increasing the initial temperature of the wastewater, its effect is minimal.

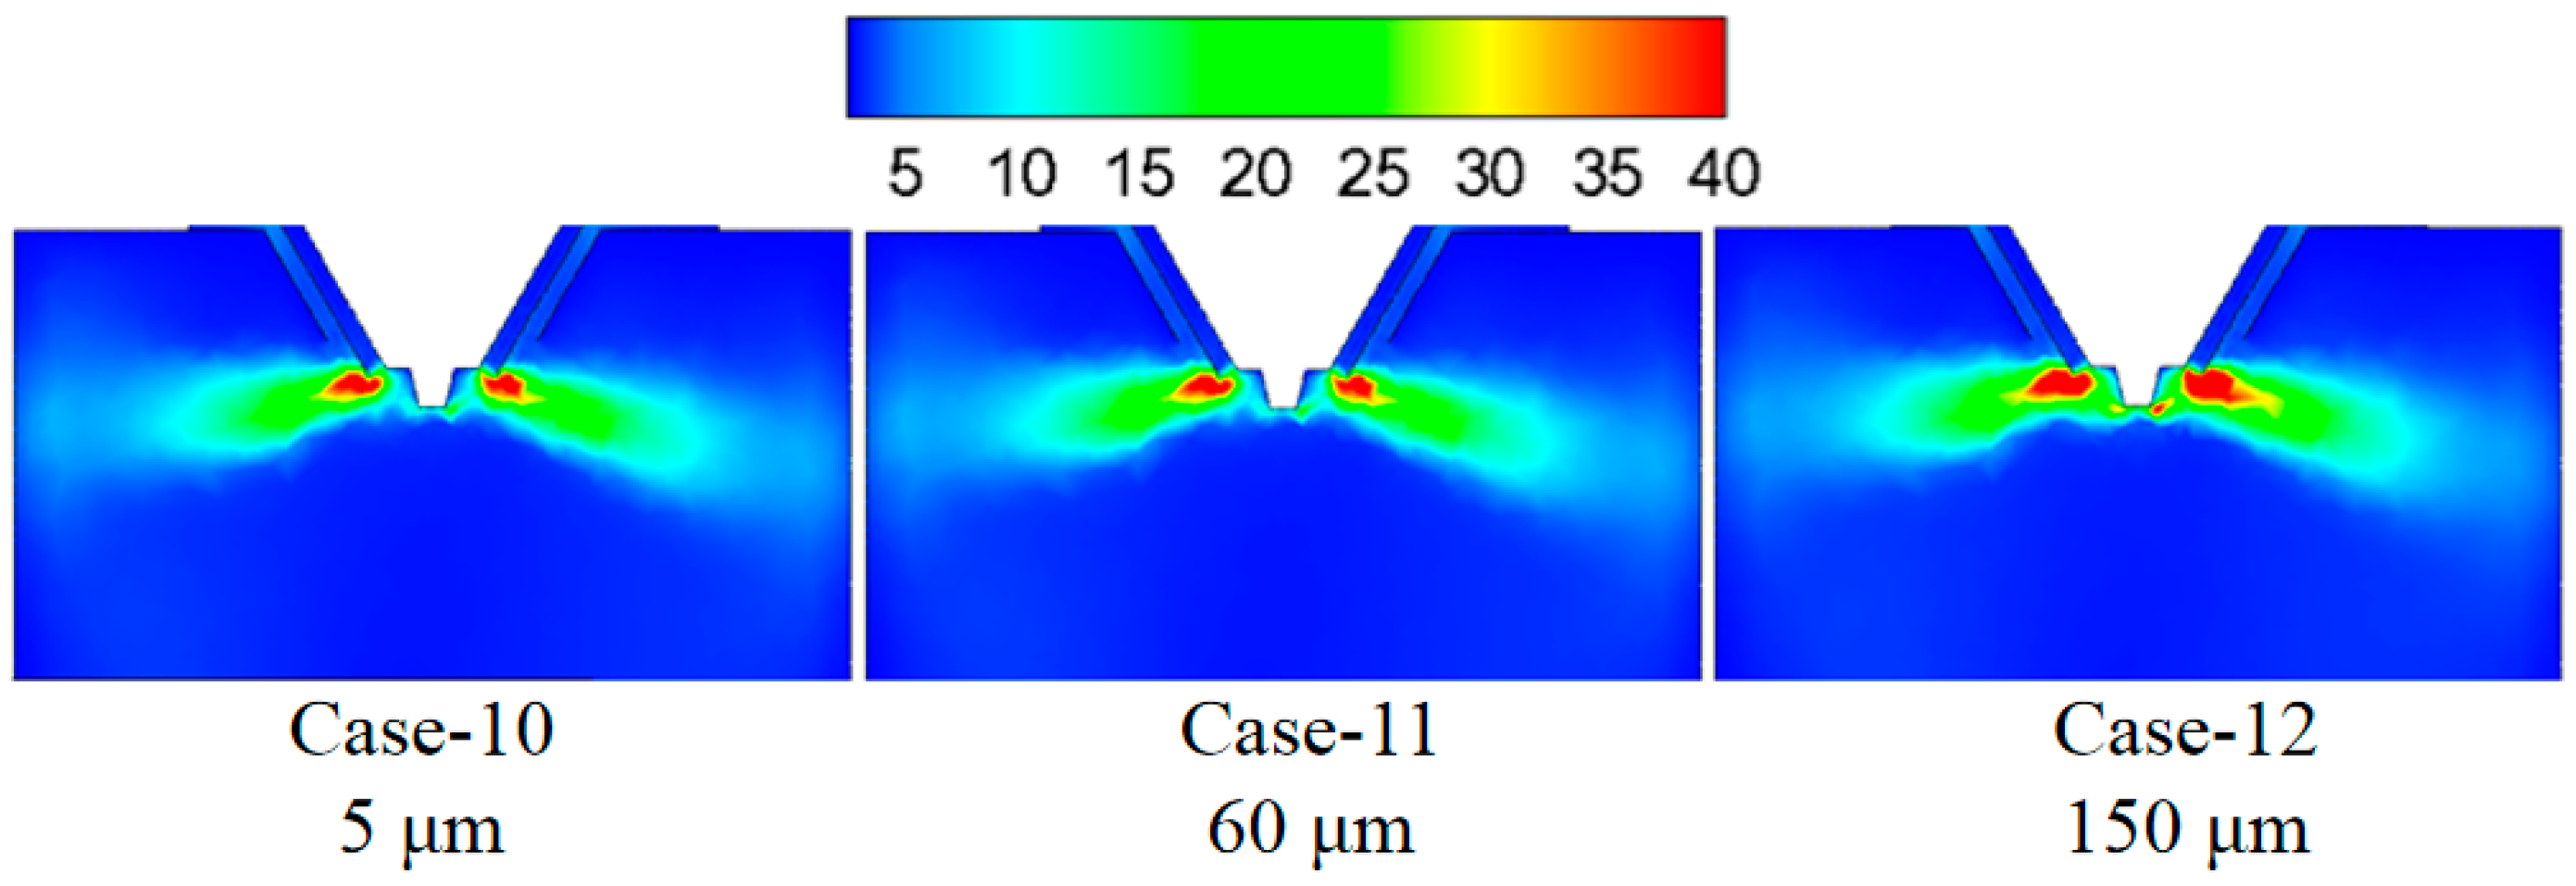
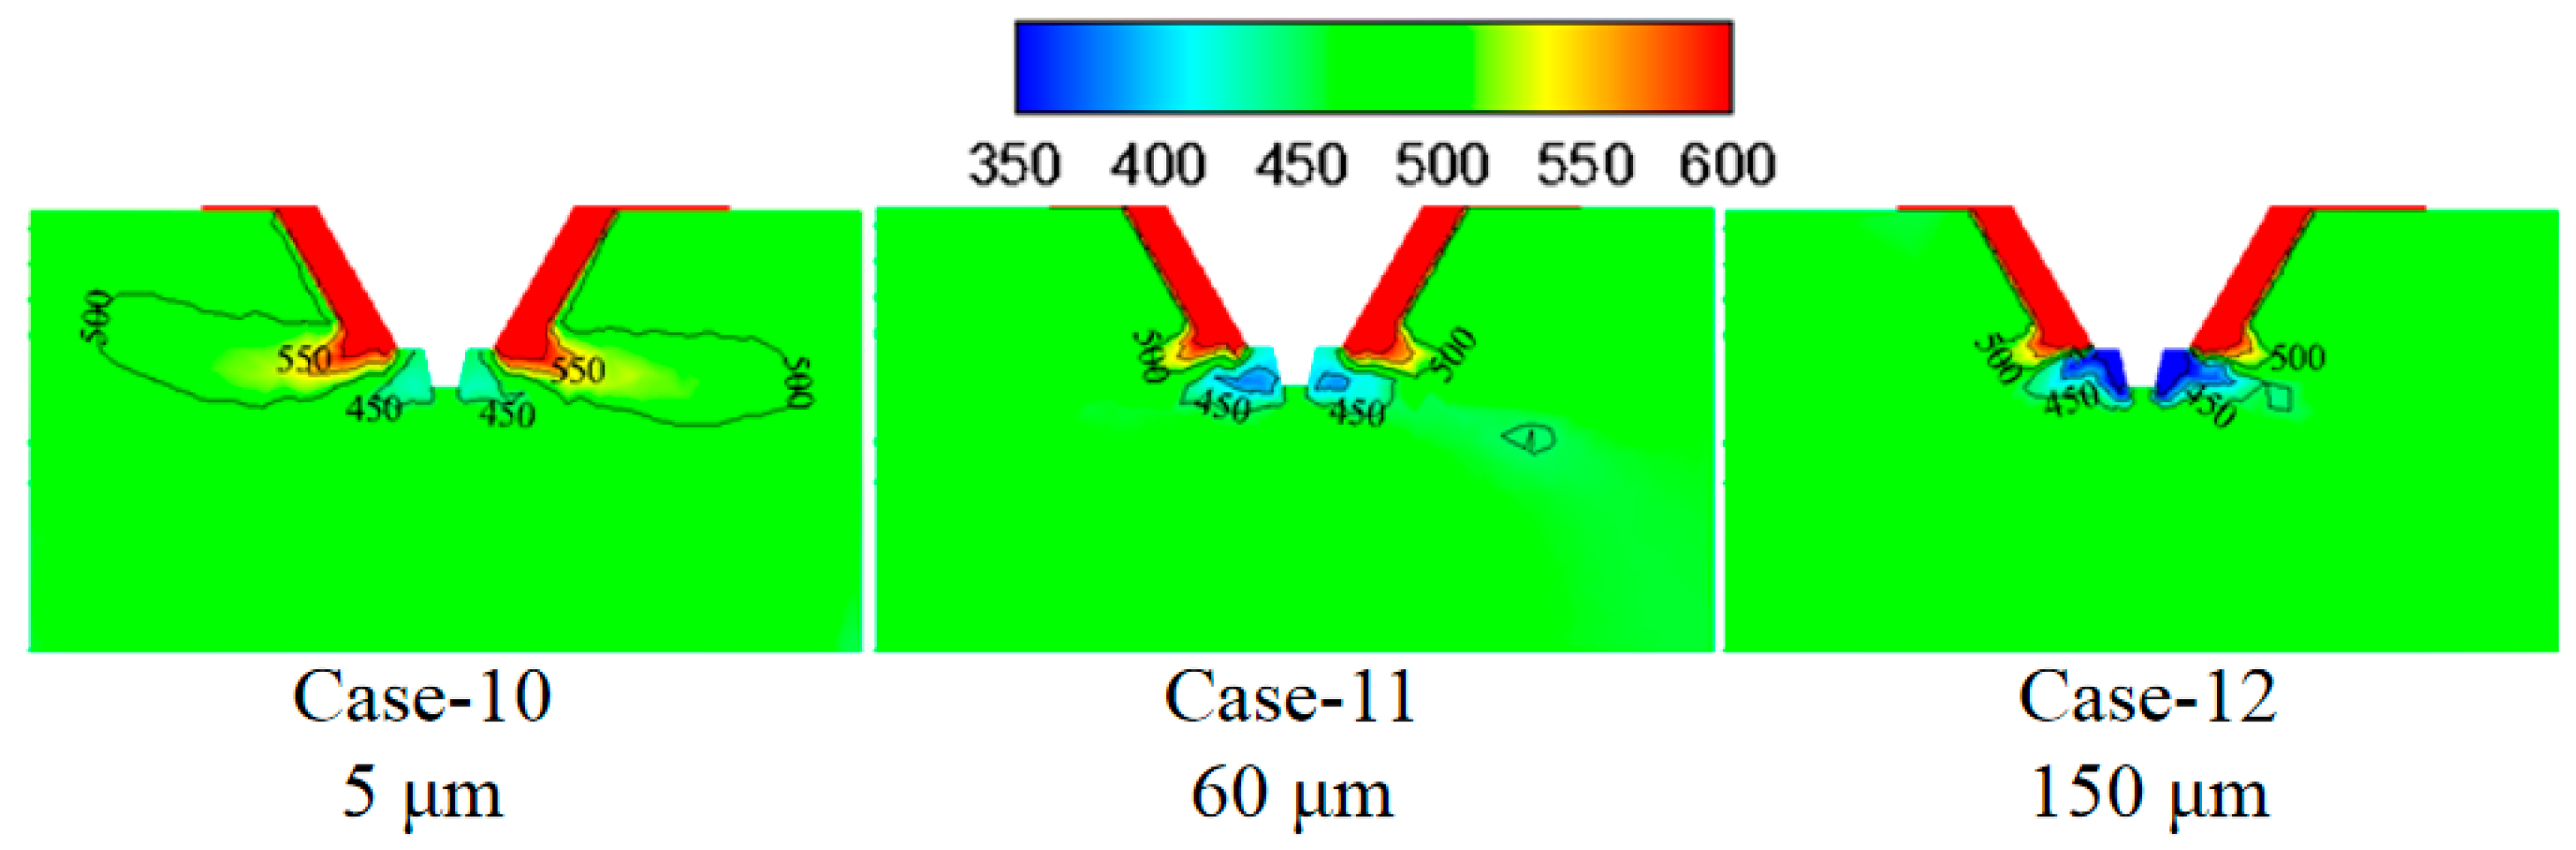
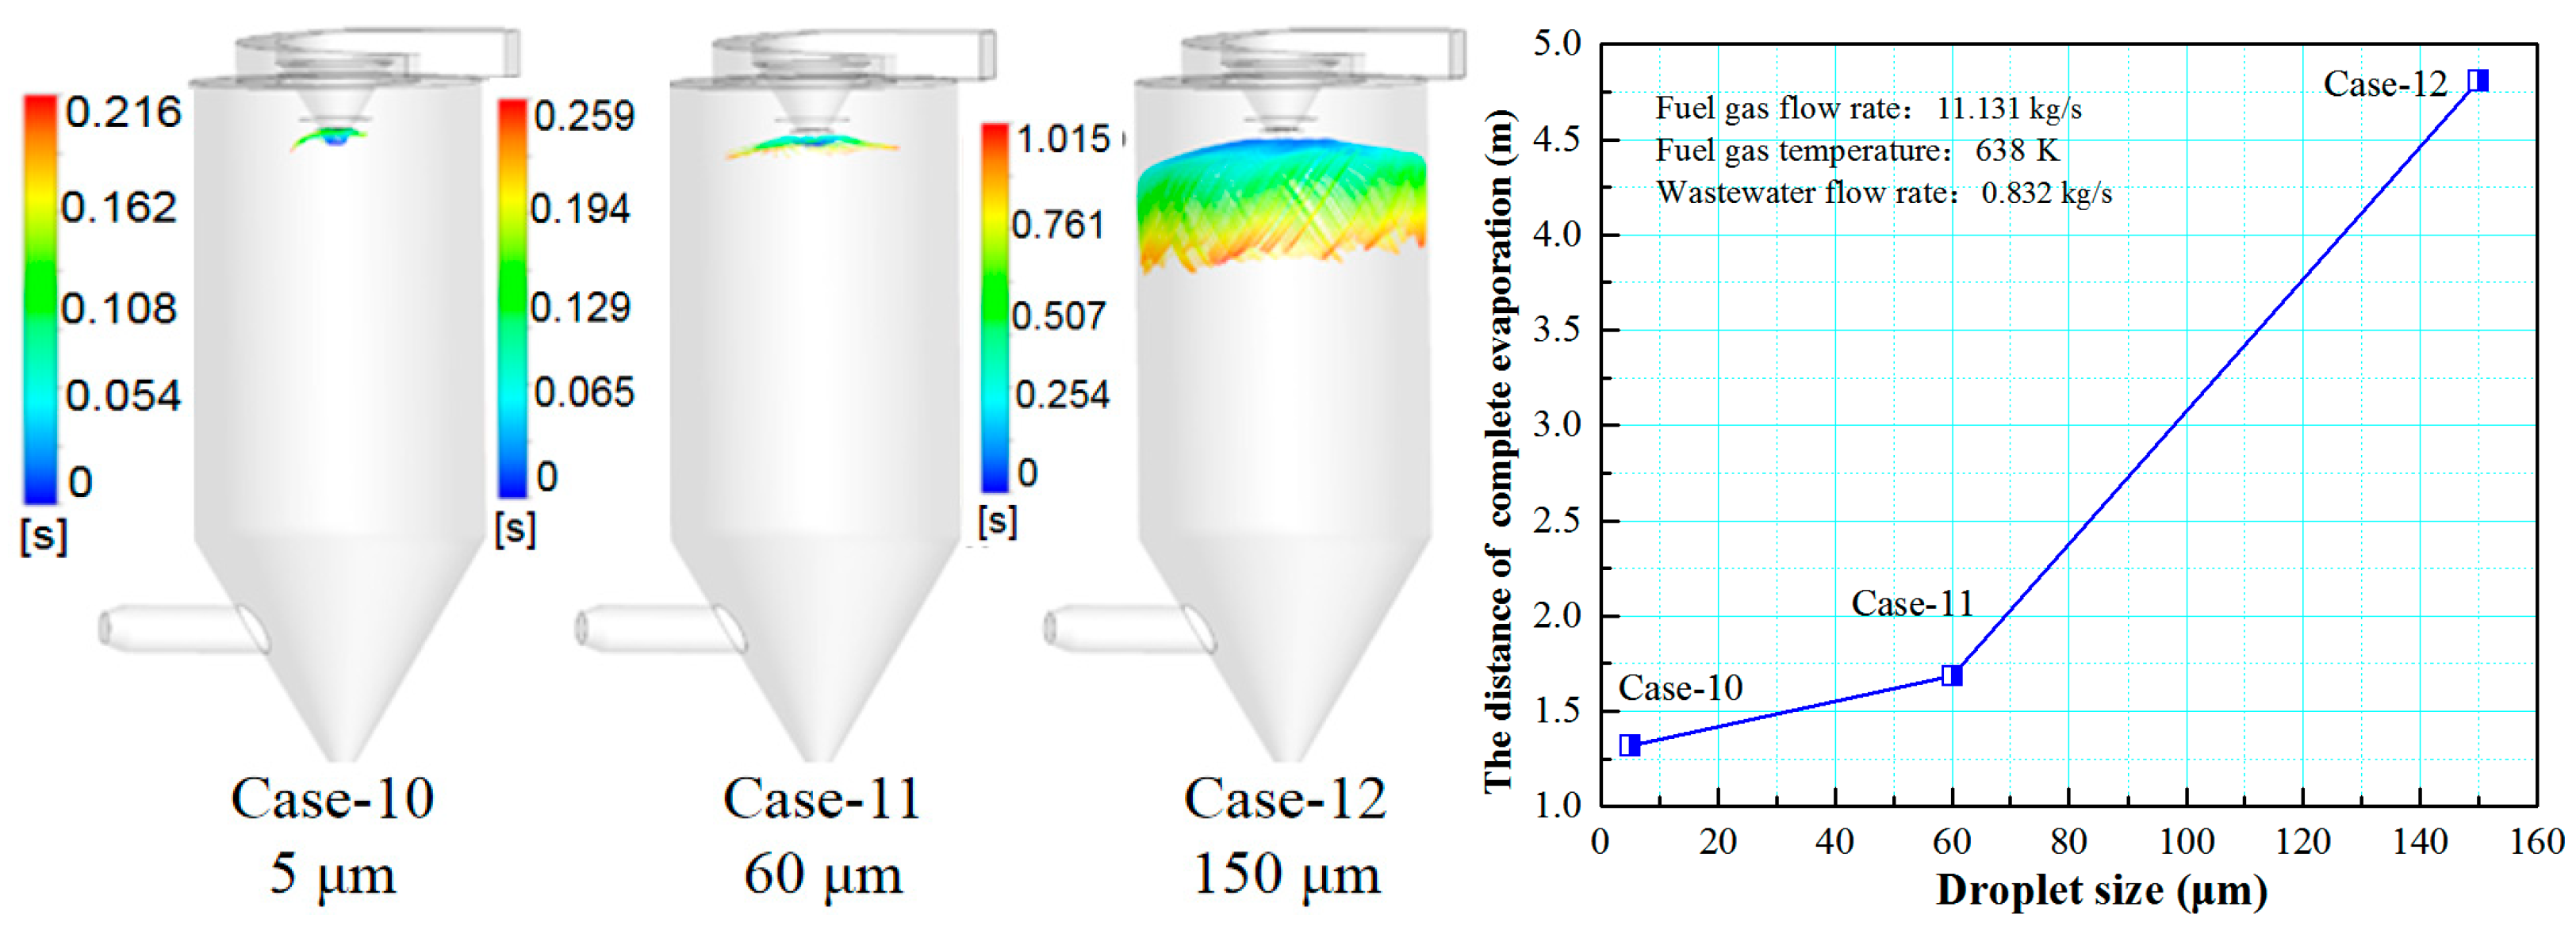
3.5. Effect of Droplet Size on the Evaporation Performance

Figure 16 shows the turbulence kinetic energy under different droplet sizes. By increasing the droplet size from 5 to 60 μm, the turbulence kinetic energy in the mixing zone of the flue gas and the droplets changes slightly, which indicates the slight difference in the mixing intensity between flue gas and droplet. By further increasing the droplet size from 60 to 150 μm, the turbulence kinetic energy in the mixing zone of the flue gas and the droplets becomes significantly stronger, and this is because the larger droplet size has a more substantial rigidity and turbulence. Figure 17 displays temperature under different droplet sizes, and smaller droplet size corresponds with the higher temperature in the mixing zone of the flue gas and the droplets because the smaller size droplet has a larger specific surface area and is sufficiently heated to evaporate.
Figure 18 shows the effect of wastewater flow rate on the evaporation performance of the droplet in the spray drying tower. As the droplet size increases, it can be seen that the trajectory of the droplets will diffuse toward the tail of the drying tower, the complete evaporation distance is extended, and the atomization evaporation effect is reduced. When the droplet sizes are 5 and 60 μm, the difference in the evaporation performance is slight. Considering the atomization cost and other factors, it is more economical and practical to choose a droplet size of 60 μm.

3.6. Orthogonal Test of Evaporation Performance

The orthogonal method is adopted to compare the degree of influence of various conditions on the evaporation performance, which includes five factors: flue gas flow rate, flue gas temperature, wastewater flow rate, initial wastewater temperature, and droplet size. Each factor is set at three levels with a total of 18 cases. The orthogonal results of each factor on the droplet evaporation performance are shown in Table 4. The orthogonal test results show that the evaporation ratio of cases 19, 21, 24, 27, 28, and 29 cannot reach 100%, and the evaporation ratio of case-21 is the lowest, only 90.39%. Compared to other cases, this case has the lowest flue gas flow, the largest wastewater flow rate, the largest flue gas/wastewater ratio, and the lowest initial temperature of the wastewater. Therefore, the input heat is insufficient, the evaporation performance is poor, and the desulfurization wastewater cannot be completely evaporated. According to the comparison of the R-value of the complete evaporation distance of each case, the factors affecting the droplet evaporation performance are ranked as follows: flue gas flow rate > wastewater flow rate > flue gas temperature > wastewater initial temperature > droplet size. Considering the evaporation ratio and the complete evaporation distance, the optimal setting is 14.470 kg/s for flue gas flow rate, 385 °C for flue gas temperature, 0.582 kg/s for wastewater flow rate, 25 °C for wastewater initial temperature, and 60 μm for droplet size.

4. Conclusions

This paper investigates the effect of flue gas flow rate, flue gas temperature, wastewater flow rate, initial wastewater temperature, and droplet size on the desulfurization wastewater evaporation performance in a spray drying tower without deflectors. These studied results can provide valuable information to improve the operational performance of the desulfurization wastewater evaporation technology with flue gas. Some conclusions are reached:
(1)
The flue gas flow rate and temperature affect the evaporation performance of the desulfurization wastewater. The larger the flue gas flow rate and the higher the flue gas temperature, the faster the wastewater droplet evaporation and the shorter the complete evaporation distance. However, if the flue gas flow rate exceeds a certain level, the improvement of the droplet evaporation performance is not apparent. In actual operation, the effect of atomization and the safety of boiler operation should be considered simultaneously, an appropriate amount of flue gas flow should be extracted, and the wastewater flow of the spray drying tower should be practically designed.
(2)
The smaller the wastewater flow rate, the higher the initial wastewater temperature, the faster the wastewater droplet evaporation, and the shorter the complete evaporation distance.
(3)
Reducing the droplet size is beneficial to improving the evaporation effect of the desulfurization wastewater. Considering all factors, it is more economical and practical to choose a droplet size of 60 μm.
(4)
The orthogonal test results of various factors show that the factors affecting droplet evaporation performance are as follows: flue gas flow rate > wastewater flow rate > flue gas temperature > initial wastewater temperature > droplet size. Considering the evaporation ratio and the distance of complete evaporation, the optimal setting is 14.470 kg/s for flue gas flow rate, 385 °C for flue gas temperature, 0.582 kg/s for wastewater flow rate, 25 °C for initial wastewater temperature, and 60 μm for droplet size.

Author Contributions

Writing—original draft, D.L.; investigation, N.Z.; writing—review and editing, Y.F.; project administration, Z.X. All authors have read and agreed to the published version of the manuscript.

Funding

This research was funded by Critical Technology Research and Integrated Application for Wastewater Resources and Zero-Emission in High Water Consumption Enterprises (GDKJXM20183546).

Institutional Review Board Statement

Not applicable.

Informed Consent Statement

Not applicable.

Data Availability Statement

Data is contained within the article.

Conflicts of Interest

The authors declare no conflict of interest.

References

  1. Córdoba, P. Status of flue gas desulphurisation (FGD) systems from coal-fired power plants: Overview of the physic-chemical control processes of wet limestone FGDs. Fuel 2015, 144, 274–286. [Google Scholar] [CrossRef]
  2. Guo, Y.; Xu, Z.; Zheng, C.; Shu, J.; Dong, H.; Zhang, Y.; Weng, W.; Gao, X. Modeling and optimization of wet flue gas desulfurization system based on a hybrid modeling method. J. Air Waste Manag. 2019, 69, 565–575. [Google Scholar] [CrossRef] [PubMed]
  3. Gutiérrez Ortiz, F.J.; Vidal, F.; Ollero, P.; Salvador, L.; Cortés, V.; Gimenez, A. Pilot-plant technical assessment of wet flue gas desulfu-rization using limestone. Ind. Eng. Chem. Res. 2006, 45, 1466–1477. [Google Scholar] [CrossRef]
  4. Srivastava, R.K.; Jozewicz, W. Flue gas desulfurization: The state of the art. J. Air Waste Manage. 2001, 51, 1676–1688. [Google Scholar] [CrossRef]
  5. Ma, S.; Chai, J.; Chen, G.; Wu, K.; Xiang, Y.; Wan, Z.; Zhang, J.; Zhu, H. Partitioning characteristic of chlorine ion in gas and solid phases in process of desulfurization waste water evaporation: Model development and calculation. Environ. Sci. Pollut. Res. 2019, 26, 8257–8265. [Google Scholar] [CrossRef] [PubMed]
  6. Shafiq, I.; Hussain, M.; Shehzad, N.; Maafa, I.M.; Akhter, P.; Amjad, U.; Razzaq, S.S.A.; Yang, W.; Tahir, M.; Russo, N. The effect of crystal facets and induced porosity on the performance of monoclinic BiVO4 for the enhanced visible-light driven photocatalytic abatement of methylene blue. J. Environ. Chem. Eng. 2019, 7, 103265. [Google Scholar] [CrossRef]
  7. Azam, K.; Raza, R.; Shezad, N.; Shabir, M.; Yang, W.; Ahmad, N.; Shafiq, I.; Akhter, P.; Razzaq, A.; Hussain, M. Development of recoverable magnetic mesoporous carbon ad-sorbent for removal of methyl blue and methyl orange from waste water. J. Environ. Chem. Eng. 2020, 8, 104220. [Google Scholar] [CrossRef]
  8. Ma, S.; Chai, J.; Chen, J.; Wu, K.; Wan, Z.; Zhang, J. Numerical simulation of bypass evaporation system treating FGD waste water using high temperature flue gas. Environ. Technol. 2018, 5, 1–24. [Google Scholar]
  9. Guo, J.; Shu, S.; Liu, X.; Wang, X.; Yin, H.; Chu, Y. Influence of Fe loadings on desulfurization performance of activated carbon treated by nitric acid. Environ. Technol. 2017, 38, 266–276. [Google Scholar] [CrossRef]
  10. Ma, S.; Chai, J.; Chen, G.; Yu, W.; Zhu, S. Research on desulfurization waste water evaporation: Present and future perspectives. Renew. Sust. Energ. Rev. 2016, 58, 1143–1151. [Google Scholar]
  11. Cui, L.; Li, G.; Li, Y.; Yang, B.; Zhang, L.; Dong, Y.; Ma, C. Electrolysis-electrodialysis process for removing chloride ion in wet flue gas desulfurization waste water (DW): Influencing factors and energy consumption analysis. Chem. Eng. Res. Des. 2017, 123, 240–247. [Google Scholar] [CrossRef]
  12. Enoch, G.D.; Spiering, W.; Tigchelaar, P.; de Niet, J.; Lefers, J.B. Treatment of waste water from wet lime (stone) flue gas desulfurization plants with aid of crossflow microfiltration. Sep. Sci. Technol. 1990, 25, 1587–1605. [Google Scholar] [CrossRef]
  13. Ye, C.S.; Huang, J.W.; Liu, T. Technology progress and treatment methods of flue Gas desulfurization waste water in coal-fired plants. Environ. Eng. 2017, 35, 10–13. [Google Scholar]
  14. Liu, Z.; Wey, M.; Lin, C. Reaction characteristics of Ca(OH)2, HCl and SO2 at low temperature in a spray dryer integrated with a fabric filter. J. Hazard Mater. 2002, 95, 291–304. [Google Scholar] [CrossRef]
  15. Ukai, N.; Nagayasu, T.; Kamiyama, N.; Fukuda, T. Spray-Drying Device for Dehydrated Filtrate from Desulfurization Waste Water, Air Pollution Control System and Flue Gas Treatment Method. U.S. Patent No. 9,555,341, 31 January 2017. [Google Scholar]
  16. Shaw, W.A. Fundamentals of zero liquid discharge system design. Power 2011, 155, 56–58. [Google Scholar]
  17. Shaw, W.A. Benefits of evaporation FGD purge water. Power 2008, 152, 60–63. [Google Scholar]
  18. Mosti, C.; Cenci, V. ZLD systens applied to ENEL coal-fired power plants. Power Tech. 2012, 92, 69–73. [Google Scholar]
  19. Xu, Y.; Jin, B.S.; Zhou, Z.; Fang, W. Experimental and numerical investigations of desulfurization waste water evaporation in a lab-scale flue gas duct: Evaporation and HCl release characteristics. Environ. Technol. 2021, 42, 1411–1427. [Google Scholar] [CrossRef]
  20. Liang, Z.; Zhang, L.; Yang, Z.; Qiang, T.; Pu, G.; Ran, J. Evaporation and crystallization of a droplet of desulfurization waste water from a coal-fired power plant. Appl. Therm. Eng. 2017, 119, 52–62. [Google Scholar] [CrossRef]
  21. Deng, J.J.; Pan, L.M.; Chen, D.Q.; Dong, Y.Q.; Wang, C.M.; Liu, H.; Kang, M.Q. Numerical simulation and field test study of desulfuriza-tion waste water evaporation treatment through flue gas. Water Sci. Technol. 2014, 70, 1285–1291. [Google Scholar] [CrossRef]
  22. Zheng, C.; Zheng, H.; Yang, Z.; Liu, S.; Li, X.; Zhang, Y.; Weng, W.; Gao, X. Experimental study on the evaporation and chlorine migration of desulfurization waste water in flue gas. Environ. Sci. Pollut. Res. 2019, 26, 4791–4800. [Google Scholar] [CrossRef] [PubMed]
  23. Jen, T.C.; Li, L.; Cui, W.; Chen, Q.; Zhang, X. Numerical investigations on cold gas dynamic spray process with nano- and microsize particles. Int. J. Heat Mass Tran. 2005, 48, 4384–4396. [Google Scholar] [CrossRef]
  24. Launder, B.E.; Spalding, D.B. Lectures in Mathe-Matical Models of Turbulence; Von Karman In-stitutefor Fluid Dynamics: Sint-Genesius-Rode, Belgium, 1972. [Google Scholar]
  25. ANSYS. Ver A F 16.0—User’s Guide; ANSYS Inc.: Canonsburg, PA, USA, 2015. [Google Scholar]
  26. Orourke, P.J.; Amsden, A.A. The TAB method for numerical calculation of spray droplet breakup. In Proceedings of the International Fuels and Lubricants Meeting and Exposition, Toronto, ON, Canada, 2 November 1987. [Google Scholar]
  27. Miura, K.; Miura, T.; Ohtani, S. Heat and mass transfer to and from droplets. Chem. Eng. Prog. Sym. Ser. 1977, 163, 95–102. [Google Scholar]
  28. Sazhin, S.S. Advanced models of fuel droplet heating and evaporation. Prog. Energ. Combust. Sci. 2006, 32, 162–214. [Google Scholar] [CrossRef]
  29. Zhou, J.; Zhao, M.; Wang, C.; Gao, Z. Optimal design of diversion piers of lateral intake pumping station based on orthogonal test. Shock Vib. 2021, 5, 1–9. [Google Scholar]
Figure 1. The desulfurization wastewater evaporation technology with flue gas.
Coatings 11 01022 g001
Figure 2. Schematic diagram of spray drying tower without deflectors.
Coatings 11 01022 g002
Figure 3. Grid division of this spray drying tower without deflectors.
Coatings 11 01022 g003
Figure 4. Turbulence kinetic energy under different flue gas flow rates (m2/s2).
Coatings 11 01022 g004
Figure 5. Temperature under different flue gas flow rates (K).
Coatings 11 01022 g005
Figure 6. Effect of flue gas flow rate on evaporation performance.
Coatings 11 01022 g006
Figure 7. Turbulence kinetic energy under different flue gas temperatures (m2/s2).
Coatings 11 01022 g007
Figure 8. Temperature under different flue gas temperatures (K).
Coatings 11 01022 g008
Figure 9. Effect of flue gas temperature on evaporation performance.
Coatings 11 01022 g009
Figure 10. Turbulence kinetic energy under different waste water flow rates (m2/s2).
Coatings 11 01022 g010
Figure 11. Temperature under different wastewater flow rates (K).
Coatings 11 01022 g011
Figure 12. Effect of wastewater flow rate on evaporation performance.
Coatings 11 01022 g012
Figure 13. Turbulence kinetic energy under different wastewater initial temperatures (m2/s2).
Coatings 11 01022 g013
Figure 14. Temperature under different wastewater initial temperatures (K).
Coatings 11 01022 g014
Figure 15. Effect of initial wastewater temperature on evaporation performance.
Coatings 11 01022 g015
Figure 16. Turbulence kinetic energy under different droplet sizes (m2/s2).
Coatings 11 01022 g016
Figure 17. Temperature under different droplet sizes (K).
Coatings 11 01022 g017
Figure 18. Effect of droplet sizes on evaporation performance.
Coatings 11 01022 g018
Table 1. Physical parameters of flue gas in actual operation under full load.
ItemValue
Volume flow of flue gas (Nm3/h)32,315
Temperature (K)638
Density (kg/m3)1.24
viscosity (kg/m·s)3.22 × 10−5
Specific heat capacity at constant pressure (J/kg·k)1159.2
Components (%)
N273.00
O23.00
CO213.00
H2O(g)11.00
Table 2. Case setting.
CasesFlow Rate of Flue GasTemperature of Flue GasFlow Rate of WastewaterInitial Temperature of WastewaterDroplet Size
kg/sKkg/sKμm
111.1316380.832298size range: 10–200 μm,
an average diameter: 60 μm, spread parameter: 1.2
214.4706380.832298
37.7926380.832298
411.1316580.832298
511.1316180.832298
611.1316381.082298
711.1316380.582298
811.1316380.832323
911.1316380.832348
1011.1316380.8322985 μm
1111.1316380.83229860 μm
1211.1316380.832298150 μm
13–30Orthogonal test of evaporation performance
Table 3. Comparison between the simulated and measured results.
Item100% Load (600 MW)66% Load (400 MW)
Operation parameterFlue gas temperature (K)638610
Flow rate of wastewater (kg/s)0.8320.582
Inlet wastewater temperature (K)298298
Temperature at the outlet (K)Simulated460446
Measured453432
H2O(g) concentration at the outlet (%)Simulated17.516.9
Measured17.116.3
Table 4. Orthogonal table of each factor.
CasesFlue Gas Flow RateFlue Gas TemperatureWastewater Flow RateWastewater Initial TemperatureDroplet SizeEvaporation Ratio *The Distance of Complete Evaporation
kg/s°Ckg/s°Cμm%m
1314.4703851.082751501004.774
1414.4703650.83250601001.888
1514.4703450.5822551002.504
1611.1313851.08250601002.021
1711.1313650.8322551002.664
1811.1313450.582751501003.854
197.7923850.83275596.51-
207.7923650.582501501003.687
217.7923451.082256090.39-
2214.4703850.582 25601001.780
2314.4703651.08275 1501005.107
2414.4703450.832 50 598.68-
2511.1313850.832 25 1501004.480
2611.1313650.58275601001.783
2711.1313451.08250598.34-
287.7923850.58250 599.71-
297.7923651.0822515097.04-
307.7923450.83275601002.153
K1598.68596.22585.77596.51597.04-
K2598.34597.04595.19596.73590.39--
K3583.65587.41599.71587.43593.24--
k199.7899.3797.6399.4299.51--
k299.7299.5199.2099.4698.40--
k397.2897.9099.9597.9198.87--
R2.501.612.321.551.11--
* The evaporation ratio is defined as: ( m · o u t m · i n f l u e   g a s ) / m · w a s t e w a t e r , where m · i n f l u e   g a s indicates the mass flow of the flue gas injected into the spray drying tower, m · o u t indicates the mass flow of the mixture gas flowing out of the spray drying tower, m · w a s t e w a t e r is the mass flow of the wastewater (liquid) injected into the spray drying tower. Ki (i = 1, 2, 3) indicates the test index sum of each factor at the same level; ki (i = 1, 2, 3) indicates the test index average value of each factor at the same level; R indicates the range, which refers to the difference between the maximum value and the minimum value of the sum of each level index in the same factor, R = max { k 1 , k 2 , k 3 } min { k 1 , k 2 , k 3 } in any column. For more details about the orthogonal test please refer to [29].
Publisher’s Note: MDPI stays neutral with regard to jurisdictional claims in published maps and institutional affiliations.

