Abstract
Morphological, structural, and thermoresistive properties of films deposited on low-density polyethylene (LDPE) substrates are investigated for possible application in flexible electronics. Scanning and transmission electron microscopy analyses, and X-ray diffraction measurements show that the films consist of overlapped graphite nanoplatelets (GNP) each composed on average of 41 graphene layers. Differential scanning calorimetry and dynamic-mechanical-thermal analysis indicate that irreversible phase transitions and large variations of mechanical parameters in the polymer substrates can be avoided by limiting the temperature variations between −40 and 40 °C. Electrical measurements performed in such temperature range reveal that the resistance of GNP films on LDPE substrates increases as a function of the temperature, unlike the behavior of graphite-based materials in which the temperature coefficient of resistance is negative. The explanation is given by the strong influence of the thermal expansion properties of the LDPE substrates on the thermo-resistive features of GNP coating films. The results show that, narrowing the temperature range from 20 to 40 °C, the GNP on LDPE samples can work as temperature sensors having linear temperature-resistance relationship, while keeping constant the temperature and applying mechanical strains in the 0–4.2 × 10⁻³ range, they can operate as strain gauges with a gauge factor of about 48.
1. Introduction
Flexible electronics covers a wide range of applications including solar cells, piezoresistive sensors, strain gauges, displays, health care, industrial automation, robotics, smart textile and others [1,2,3,4,5]. It is a technology for assembling electronic devices on electrically passive substrates. The simplest flexible circuit is formed by a layer of either metal or polymer composite on flexible plastic substrate, such as polyimide, polyester, polyethylene naphthalate, polyetherimide, polydimethylsiloxane along with various fluropolymers and copolymers [1,5].
On the other hand, carbon-based materials, such as carbon black [6], graphite [7], CNTs [8], graphene [9] and reduced graphene oxide [10], play an important role as conductive layers, in preparing effective electrical conductors. Indeed, these materials can be used as fillers also in ceramics and polymers to increase their electrical conductivity [8,11,12,13,14]. On other cases, they can be deposited as conductive thin films on polymer substrates by means of various fabrication techniques [15]. Graphene layers and graphene/graphite nanoplatelets (GNP), for example, can be deposited by a top-down approach using the exfoliation of graphite, by mechanical methods [16,17,18,19], electrostatic deposition [20], chemical synthesis [7], electrochemical [21] and thermal expansions [22].
The aim of the present work is to explore the morphological, structural, and thermo-resistive properties of graphite nanoplatelet films deposited by a micromechanical technique [19] on low-density polyethylene (LDPE) substrates for possible applications in flexible electronics [23]. LDPE was selected, since it is the most commonly used polymer with applications ranging from film packaging and electrical insulation to containers and piping [24,25]. Moreover, although the properties of this polymer depend on the grade of crystallinity it is a mechanically tough and flexible material. In addition, this selection is corroborate by the good adhesion property between the LDPE surface and coating due to a high surface energy value ~31.9 mJ/m2 [26], and a strong CH-π hydrogen bond of ca. 1.5–2.5 kcal/mol [27].
It is known that the thermomechanical stability of the substrate is an important technological issue in the application of microelectronics, micro-electromechanical systems, and flexible electronics [28,29]. Therefore, to establish the proper operating temperature ranges of the samples, extensive characterizations of the LDPE were carried out by means of differential scanning calorimetry and dynamic-mechanical-thermal analysis over wide temperature ranges. These thermomechanical characterizations, along with the electrical ones as a function of the temperature, allow us to investigate the influence of the thermal expansion of the polymer substrates on the thermo-resistive behavior of the deposited GNP films.
2. Materials and Methods
The low-density polyethylene (LDPE, Riblene FF20) selected as a substrate was supplied in form of pellets by Versalis (ENI S.p.A., S. Donato Milanese, Italy) with the following properties: density = 0.921 kg/m3, melt flow index = 0.8 g/10 min (190 °C/2.16 kg) and Tmelting = 112 °C. The substrates were produced by compression molding using a PV Collin P300 hydraulic hot-press (Dr. Collin GmbH, Maitenbeth, Germany). Prior to use, the LDPE pellets were carefully kept under vacuum for 24 h at 60 °C to remove the adsorbed water. Then, about 3 g of dried pellets were placed between two Polytetrafluoroethylene (PTFE)-coated peel-ply films and sandwiched between two steel plates. Afterwards, they were placed between the two preheated plates (30 × 30 cm2) of the press and left freely to melt for about 1 min at 180 °C. The plates were brought closer together in order to obtain a force of 10 kN. The pressure was maintained for about 5 min, after which the samples were removed from the press and cooled down to room temperature. It is worth noting that the reduced processing time at 180 °C and the previous drying process carried out at the lowest temperature of 60 °C, ensured that no thermal degradation occurred in the polymeric material allowing to obtain homogeneous films, without bubbles or inclusions.
After quenching, the samples were peeled off from the nonstick peel layer and cut into a circular shape approximately 20 cm in diameter. The LDPE samples were stabilized at room temperature for three days and then measured with a film thickness gauge.
The GNP films were deposited on the LDPE substrates by the micromechanical method [19] summarized as follows. The preparation started from commercial expandable graphite (Asbury Carbon, Asbury, NJ, USA), which was thermally expanded in air at 750 °C for 3 min using a muffle furnace. Such an expansion reaction explosively transformed the graphite flakes into high porous, wormlike structures usually named ‘expanded graphite’. A cleaning sonication bath was used to disaggregate the expanded graphite filaments dispersed in a volatile liquid medium (Acetone, Sigma-Aldrich, St. Louis, MO, USA) by means of ultrasounds applied for a few tens of minutes at room temperature.
The resulting powder was dried in air at room temperature to produce a highly porous and fragile graphite aerogel that was mechanically broken to give graphite platelets. In a previous paper [19] we evaluated by TEM and SEM measurements that these platelets can have a high aspect ratio with an average size of ca. 80 μm and thickness ranging from 10 to 200 nm. Then, a colloidal dispersion (33 g/L) was obtained by accurately mixing the dry graphite platelet powder with pure ethanol (100%, Sigma-Aldrich, St. Louis, MO, USA) using a sonication bath; then a soft graphite paste was achieved at room temperature by solvent evaporation.
Samples were obtained by fixing a LDPE substrate with a thickness of 1 mm onto a flat glass and carefully spreading a small amount of paste onto the substrate surfaces using a LDPE sheet as a counterface and applying on it a manual pressure ranging from 3 to 9 kPa. The deposition temperature of the films was ∼20 °C.
The adhesion property between the LDPE surface and graphite/ethanol paste combined with the shear stress and friction forces applied during the deposition, allowed to uniformly cover a large area of LDPE substrate with overlapped graphene or graphite nanoplatelets. The thickness of the deposited coating can be roughly controlled by varying the amount of graphite paste and the applied pressure to spread it on the LDPE substrate. The obtained samples were rinsed with acetone to remove residual GNP debris and then dried in air at room temperature.
The surface morphologies of pristine LDPE substrate and GNP coating layer on LDPE substrate were carried out by scanning electron microscopy (SEM), FEI Quanta 200 FEG (Thermo Fisher Scientific, Hillsboro, OR, USA), operating at 10 kV. The samples were mounted on standard aluminum stubs by double coated carbon conductive tabs. In addition, an ultra-thin coating of electrically-conducting metal (gold/palladium) was sputtered on the sample surface to prevent charging of the specimen, which occurs because of the accumulation of static electric fields.
SEM cross section observations were performed by using a Zeiss Supra 40 field-emission electron microscope (Carl Zeiss Microscopy GmbH, Jena, Germany) operating at 7 kV. For SEM cross-sectional analysis, samples were glued between two silicon substrates. The obtained “sandwich” was grinded on the side using abrasive papers with ascending grit in order to achieve a flat and polished surface adapt to investigate the thickness of the GNP film.
High-resolution transmission electron microscopy (HR-TEM) analysis was carried out by using a Philips CM200 microscope (Philips, Amsterdam, The Netherlands) operating at 200 kV and equipped with a LaB6 filament. For TEM observations, samples were prepared in cross-section by using a Leica EM UC6/FC6 cryo-ultramicrotome.
Samples’ structural properties were also investigated by X-ray diffraction (XRD) measurements using a Panalytical, X’PERT PRO diffractometer (Malvern Panalytical, Cambridge, UK) with CuKα radiation (λ = 0.154 nm) in the range of 2θ from 5° to 60°, scan step = 0.0130°, and full scan time = 18.9 s.
Thermal analysis of pristine LDPE samples was carried out under a nitrogen atmosphere using a differential scanning calorimeter (DSC) Q1000-TA instrument (TA instrument, New Castle, PA, USA). Small LDPE samples (approximately 1–2 mg) were weighed accurately and then placed into DSC crimped aluminum pans ensuring a good sample/pan contact. Non-isothermal cooling-heating-cooling tests were carried out at different scan rates in the temperature range from −110 °C to +180 °C. Before each experiment, the apparatus was calibrated using indium and zinc as reference.
Expansion and contraction behaviors of the LDPE samples were tested under a very small tensile load of 10 mN. Samples with dimensions of 5 × 20 × 0.1 mm3 were examined in the temperature range from −40 °C to +40 °C approximately, at a rate of 5 °C/min (measurement with TMA 450, TA-Instruments, New Castle, PA, USA).
The dynamical-mechanical analyses of the LDPE samples were performed using a DMA 2980 (TA instrument, New Castle, PA, USA). Samples with dimensions 18 × 9 × 0.1 mm3 were tested by applying a variable tensile deformation with the frequency of 1 Hz and constant displacement amplitude of 1.0%. The measurements were carried out by using liquid nitrogen as a coolant, to allow scans from −120 °C to 110 °C at a scanning rate of 3 °C/min. In this case a lower scanning rate was preferred to ensure sufficient thermal equilibrium (±0.1 °C) between the instrument oven and the sample as well as to highlight the different transitions in the material.
Electrical measurements of GNP on LDPE samples were executed under vacuum (∼1 mbar) in a coplanar configuration by silver paint contacts (1 cm long and 1 mm spaced) spread on their surfaces. Current-voltage (I-V) characteristics were taken in a Janis Research ST-500 probe station (Janis Research, Woburn, MA, USA) equipped with four micromanipulators connected to a source-measurement unit (SMU) Keithley 4200-SCS (Tektronix, Inc. Beaverton, OR, USA). The mean resistance of the samples at different temperatures (T) was estimated from each I-V characteristic and monitoring the resistance during a period of 60s in cooling-heating cycles from −40 °C to 40 °C at the rate of about 5 °C/min in order to compare the electrical and TMA measurements.
3. Results and Discussions
Carbon-based films with good adhesion to LDPE substrates were obtained by means of a micromechanical technique based on the application of shear-stress and friction forces to a graphite platelets/ethanol paste on the surface of the polymeric substrate [19]. SEM-micrograph in Figure 1a shows that the pristine LDPE surface is quite flat with few little blisters and/or wrinkles as defects, generated by the flat plates of the hydraulic hot-press used during the substrate fabrication process. SEM micrograph in Figure 1b reveals that the coating layer deposited on the LDPE is composed of an aggregate of thin platelets (submicrometric thickness). The platelets are irregular in shape and have typical lateral dimensions ranging from about one to a few tens of microns.
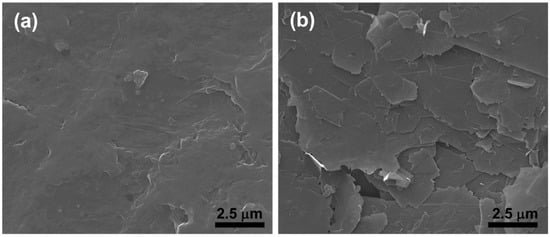
Figure 1.
SEM micrographs of low-density polyethylene (LDPE) surface (a) and of the coating layer deposited on LDPE (b).
In order to investigate the thickness of the coating layer, SEM observations were further performed on cross sectional samples. Figure 2 shows a typical SEM image of such samples. The LDPE substrate is indicated together with the estimated thickness of the coating in three different areas. The sample is slightly tilted with respect to the direction of the electron beam such that it is possible to recognize the shape of some platelets at the top of the coating (red arrows). Some residuals of the glue used to prepare the sample in cross-section (green arrows) are also visible.
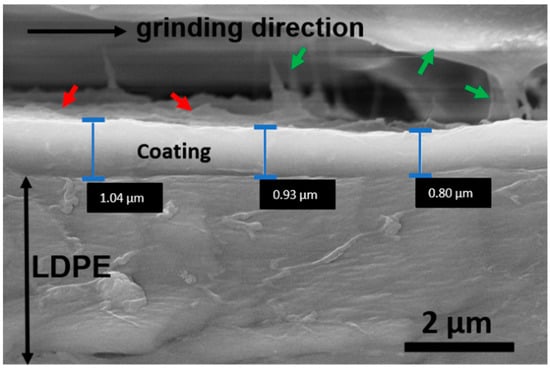
Figure 2.
SEM micrograph of a cross-sectional coating deposited on an LDPE substrate. The thickness of the coating is indicated in three different regions.
A major part of the glue was removed by the grind-papers used to obtain a flat surface suitable to reveal the thickness of the coating. In particular, the grinding process was performed in a direction parallel to the LDPE/coating interface, in order to avoid a possible spread of the LDPE substrate in the coating or vice versa. In this way, a selective removal of the softer glue was obtained. SEM measurements allowed to identify the coating layer as a thin film with thickness of (900 ± 200) nm.
The inner structure of the platelets shown in Figure 1b was explored in greater detail by means of HR-TEM measurements performed on cross-sectional samples. HR-TEM analysis reveals that the platelets were composed of stacks of graphene sheets having again a platelet shape and thickness between one and a few tens of nanometers.
According to ref. [30], such nanostructures can be classified as nanoplatelets. Figure 3 shows the two typical configurations of the nanoplatelets inside the larger platelets. They can be identified but not completely separated among them giving rise to a compact structure, as shown in Figure 3a, or they can have a more rarefied nature, as imaged in Figure 3b, where the nanoplatelets are typically thinner and well detached. Inside the nanoplatelets of both the images, fringes corresponding to the different graphene layers can be observed.
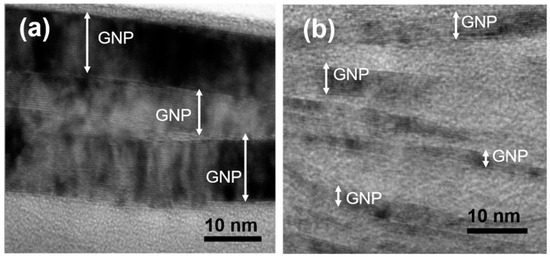
Figure 3.
HR-TEM images of cross-sectional film’s platelets showing that they are composed by the superposition of graphite nanoplatelets (GNP). GNP can be well compacted (a), or quite separated (b) inside the platelets.
The structural properties of GNP deposited on LDPE were further investigated by XRD analysis. In Figure 4a the XRD pattern of the pristine LDPE substrate shows a dominant sharp peak at 2θ = 21.40°, a weak broad peak at 2θ = 23.70°, and one more weak peak at 2θ = 36.28° corresponding respectively to (110), (200), and (020) reflections from the crystalline polyethylene phase [31]. These peaks are superimposed on a large halo, generated by the amorphous polyethylene phase [32,33]. On the other hand, in Figure 4b, the XRD diffractogram of GNP deposited on LDPE includes two peaks of low intensity at 2θ = 26.46° and 2θ = 42.82°. These peaks can be referred to the graphite (002) and (100) planes, respectively [19]. As it is known, the average crystal thickness perpendicular to the lattice plane indicated by Miller’s indices (hkl) can be obtained from the following Scherrer’s equation:
where FWHM (full-width-at-half-maximum in radians), obtained by a Gaussian fit of the peak, is equal to 0.59 (see inset in Figure 4b), K is a constant depending on the crystallite shape, taken as 0.89 [34,35], λ is the wavelength of the X-ray radiation (Cu-Kα1 = 0.15481 nm) and θ = 13.23° is the half of the corresponding scattering angle. This equation applied to the (002) peak has allowed to determine that the graphite platelets are composed of crystallites with an average size L(hkl) = 13.6 ± 0.5 nm in the (002) direction. Moreover, the interplane distance can be obtained by the Bragg’s law for a family of lattice planes (hkl) [35,36,37]:
where λ and θ are the same parameters previously described, and n = 1 is the diffraction peak order.
L(hkl) = K × λ/(FWHM × cosθ)
d(hkl) = nλ/sinθ
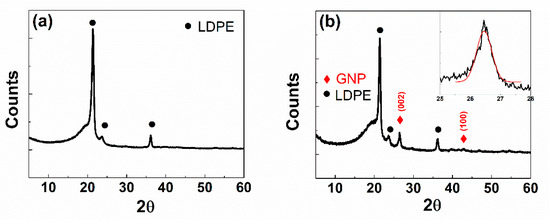
Figure 4.
XRD diffractogram of pristine LDPE (a), and GNP on LDPE (b). The Gaussian fit of (002) peak in the inset of Figure (b).
The calculated d(002) value is (0.337 ± 0.003) nm in agreement with the separation distance between two graphene layers (d = 0.335 nm) inside the graphite phase [38,39].
Therefore, the average number of the graphene layers (N) per crystalline domain can be calculated from the following equation:
N = (L(002)/d(002)) + 1
In our case, the obtained N value is 41, which means, according to the HR-TEM analysis, and following the nomenclature of refs. [30,40] that the deposited film is composed of the superposition of graphite nanoplatelets, each with an average thickness of about 14 nm or, equivalently formed from 41 layers of graphene. All the results are summarized in Table 1. The graphitic nature of the nanoplatelets was confirmed by preliminary Raman measurements carried out on samples prepared in similar conditions.

Table 1.
Structural parameters obtained from the (002) peak in the XRD patterns of the GNP on LDPE substrate. 2θ is the diffraction angle, FWHM is the full width at half maximum, d(hkl) is the average distance of graphene layers, L(hkl) is the average height of the crystallites obtained from the FWHM, and N is the average number of graphene layers of a nanoplatelet.
In view of their possible applications, to properly define the operating temperature ranges of the samples and avoid irreversible structural modifications of the LDPE capable of causing damage and large fractures also in GNP films, thermal and mechanical properties of the polymer substrates were examined by differential scanning calorimetry (DSC) and dynamic mechanical analysis (DMA) in wide temperature ranges from −110 to 180 °C and from −120 to 110 °C, respectively.
Figure 5 show the conventional DSC results from the heating at different scanning rate of the pristine LDPE substrates. The enthalpic curve recorded at 10 °C/min indicates the occurrence of a broad melting transition with a minimum at about 114 °C (Figure 5a). Probably, the broad melting range is due to the superposition of different melting processes associated with the different crystalline habits formed during the film solidification. Some molecular relaxations with crystals rearrangements are also expected to take place during the melting process. The total heat of fusion associated with this melting peak is 110 J/g, which corresponds to about 37% of the theoretical value found for LDPE sample having 100% of crystallinity (ΔH∞ = 293.1 J/g) [41].
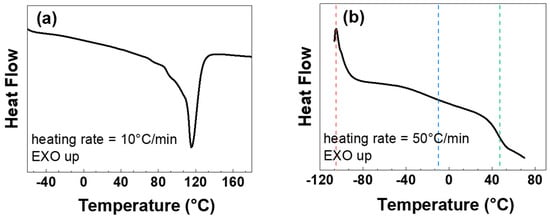
Figure 5.
DSC heating curves of a LDPE sample in the –60–180 °C range at the rate of 10 °C/min (a) and in the −110–70 °C range at the rate of 50 °C/min (b). Vertical dot lines at T = −105, −10 and 47 °C represent the second-order transition temperatures.
The glass transition temperature (Tg) corresponded to the point where half of the increase of the heat capacity occurred in the DSC signal. In order to increase the signal associated with the heat capacity, a DSC scan at high heating rate (50 °C/min) was carried out (Figure 5b). For LDPE, the enthalpic curve shows three second-order transition temperatures, T = −105, −10 and 47 °C (vertical dot lines in Figure 5b), corresponding to the discontinuity in the second derivative of the Gibbs free energy. These temperatures are associated with different relaxations of the amorphous and crystalline regions present in the polymer matrix. The effects of such transition temperatures on the molecular mobility of the LDPE materials are well evidenced by their thermomechanical behavior.
The dynamic mechanical properties, namely the loss factor as well as the storage modulus and loss modulus as a function of the temperature, are reported in Figure 6a,b, respectively. From the loss factor curve the main features of the LDPE are evident. In particular, the three characteristic relaxation temperatures α, β, and γ of LDPE are clearly resolved. In LDPE, the α relaxation is generally observed between 20 and 60 °C (in this case it corresponds to 47 °C). The intensity of the α relaxation increases with increasing the material density and it is very sensitive to the thermal history of the sample [41,42]. It is associated with the viscoelastic process due to the molecular motion in the crystal caused by the premelting process. The β relaxation generally occurs between −35 and −5 °C and it is related to the amorphous phase. From the loss factor curve shown in Figure 6a the β relaxation for the considered LDPE sample occurs at about −10 °C. Many authors considered β relaxation as the glass transition of the crystalline-amorphous interphase [43,44]. More specifically, it is ascribed to the movement of amorphous molecular chains closer to the crystalline domains. The greater the intensity of this relaxation, the higher is the amorphous fraction present in the system. The γ relaxation for LDPE generally occurs from −95 to −115 °C and it depends on the material density. In this case it occurs at −105 °C. This relaxation is caused by short-range segmental motion. Experimental results obtained on quasi-amorphous samples have demonstrated that the γ transition arises from contributions of the noncrystalline regions of the polymer. This observation favors the assignment of the γ transition rather than the β one as the primary glass transition of LDPE [45]. Despite this discrepancy in the definition of the primary glass transition of linear polyethylene, the phase transitions identified by these temperatures have a strong effect on the mechanical and thermal expansion of LDPE. For example, the thermomechanical behavior of the LDPE (namely the storage modulus, Figure 6b) against the temperature can be divided into distinct regions. These regions are directly related to the mobility of its molecular chains. At very low temperatures, LDPE behaves like a glass and exhibits a high modulus. As increasing the temperature, the modulus continuously decreases. The fall in modulus through the β relaxation region is between one and two orders of magnitude. Upon heating both storage modulus and loss modulus decrease because less force is required for deformation. However, as the temperature approaches the glass transition temperature more work of applied force is dissipated as heat. It results in a local increase in the loss modulus followed by a sharp decrease. The location of the loss modulus peak, which reflects the segmental motion of the LDPE, is considered another physical evidence of the glass transition temperature.
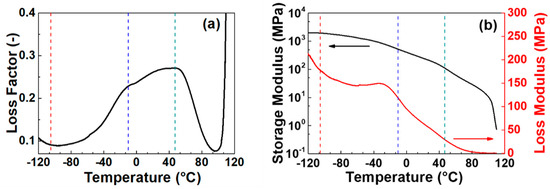
Figure 6.
Dynamical mechanical analysis as a function of temperature of a LDPE sample. Loss factor (a), storage modulus and loss modulus (MPa) (b). Vertical dot lines at T = −105, −10 and 47 °C represent the second-order transition temperatures.
For applications of the LDPE requiring thermal stability and thermomechanical reproducibility, the above study indicates that it is necessary to avoid temperatures that can induce large variations in the mechanical parameters, and irreversible structural changes. To this aim, in the present work, the operating temperature range of the LDPE was roughly limited between −40 and 40 °C to explore the thermal expansion properties. In fact, the melting and glass phase transitions as well as the α relaxation are prevented in this range, while β relaxation (glass transition of the crystalline-amorphous interphase) can take place without modifying the polymer structure. Moreover, a low variation in storage modulus (only about one order of magnitude) occurs and, therefore, suitable working conditions can be obtained in this temperature range for LDPE.
Results on thermal expansion characterization carried out on a typical LDPE substrate sample are presented in Figure 7, where the temperature dependence of the linear strain, ε, is plotted as a function of temperature during a cooling-heating-cooling cycle. Here, ε is calculated by the following ratio:
where l0 is the initial size of the sample at temperature T0 = 20 °C and l is the size of the sample at the temperature, T. The plot of Figure 7 shows a clear hysteresis between the cooling and heating curves. In particular, the curve recorded in cooling mode is linear, while during the heating the curve shows a continuous change in slope. This is due to the presence of the second-order transition temperature, β, which separates the experimental data into two sets. In fact, as shown in Figure 7, the abscissa of the intersection point of the two linear fit lines obtained in different regions of the heating curve is very close to the β transition temperature (−10 °C). The different trend observed during the heating stage can be explained considering the relaxation time associated with the second order transition. During the cooling stage, the LDPE molecules result undercooled with respect to their equilibrium state. In fact, if the sample is left for a sufficient time at the minimum temperature (in this case −43 °C) it naturally returns to the equilibrium value, corresponding to the initial one of the heating curves. The time requested to reach equilibrium depends on the temperature, the higher temperatures the shorter times are required. For this reason, during heating the polymer molecules have more change to follow point by point their equilibrium state. This behavior is intimately linked to the time-temperature dependence of the molecular mechanisms involved in this second order transition. According to this, the point that identifies the transition represents the temperature at which the kinetics of the process equals the time scale of the experiments (higher heating rate leads to higher temperature transitions). In any case, thermal expansion measurements are always obtained in nonequilibrium conditions, i.e., at finite rates of temperature change. Under these conditions, a correct identification of a transition temperature requires the specification of all the experimental conditions adopted.
ε = (l0 − l)/l0
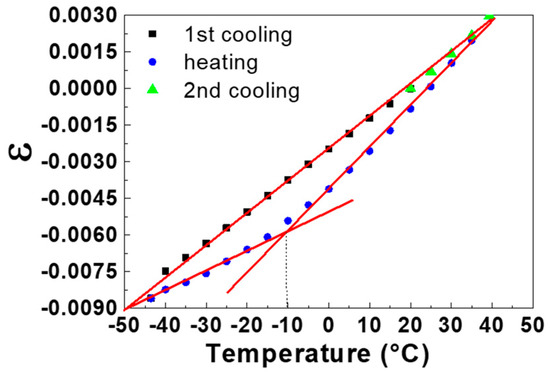
Figure 7.
Linear strain, ε, vs. temperature of a LDPE sample subjected to a cooling-heating-cooling cycle. The solid straight lines are linear fit lines, and the vertical dot line allows to determine the β second-order transition temperature.
From the linear fits shown in Figure 7, it is possible to determine, in different temperature ranges, the values of the linear thermal expansion coefficient, CTE, defined as the fractional change in length for a unit change in temperature. The obtained CTE values vary between 1.29 × 10⁻⁴ and 1.79 × 10⁻⁴ °C−1 according to the literature data [46].
In summary, the characterizations carried out on the LDPE, indicate that in the temperature range between −40 and 40 °C approximately, the constancy in the crystalline phase and the low variation in storage modulus (about one order of magnitude) ensure sufficient stability and reproducibility of the LDPE thermomechanical parameters, despite the occurrence of hysteresis phenomena during the thermal cycles.
Accordingly, the electrical measurements as a function of temperature of GNP films deposited on LDPE substrates were performed from −40 to 40 °C under vacuum in two probe configurations. The ohmicity of the contacts was revealed by the linearity of the I-V characteristics for each temperature value as shown in Figure 8a, where the current I of a representative sample is plotted as a function of voltage V at −40, 20 and 40 °C.
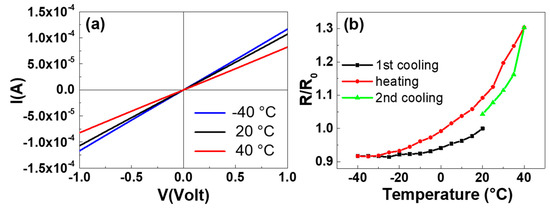
Figure 8.
Current-voltage (I-V) characteristics recorded at different temperatures of a GNP film deposited on LDPE substrate (a). The ratio of the resistance R to the initial resistance R0 at 20 °C (R/R0) vs. temperature during a cooling-heating-cooling cycle for a GNP film deposited on LDPE substrate (b).
The resistances R of the GNP films, determined from the fit of the I-V experimental data plotted in Figure 8a at different temperatures, were R(20 °C) = R0 = 9371 ± 1 Ω, R(40 °C) = 12208 ± 3 Ω, and R(−40 °C) = 8592 ± 2 Ω. The thermo-resistive properties of GNP films were further explored by recording R as a function of the temperature, starting from 20 °C and performing cooling-heating-cooling cycles in the range between −40 and 40 °C. Figure 8b displays the temperature behavior of the R/R0 ratio (where R0 is the initial resistance measured at 20 °C) of the above representative sample under a thermal cycle. Clearly, the resistance increases as a function of the temperature in the investigated range. Such a trend is opposed to the behavior of graphite-based materials, whose resistance decreases with increasing temperature [47]. The resistance increase was observed in all the deposited samples and it can be attributed to the thermal expansion coefficient mismatch between the LDPE (1–2 × 10⁻⁴ °C−1) [46] and nanoplatelet films (approximately −2 × 10⁻⁶ °C−1) [48,49]. Indeed, the larger thermal expansion of the polymeric substrate can induce strains in the deposited film that affect the overlapping GNP and modify the film resistance [50]. Furthermore, it can be seen that the slope of the heating curve between −40 and 20 °C is lower than that between 20 and 40 °C. This behavior can be explained taking into account that the GNP film was deposited at 20 °C, therefore above this value the main effect of the temperature increase is the thermal expansion (larger for LDPE with respect to GNP film) which tends to decrease the contact area among the nanoplatelets and to increase their separation distance. The result is to decrease the number of conductive paths and so to increase the film resistance. When the temperature of the sample is below the deposition temperature (20 °C), the larger contraction of the LDPE compared to that of the GNP film (due again to the difference in their thermal expansion coefficients) leads to a greater compaction of the nanoplatelets. This phenomenon implies that, by heating the sample from −40 to 20 °C, the effect of the resistance decrease with the temperature (characteristic of the graphite/graphene based materials and in any case present) becomes more evident and opposes to the resistance increase induced by the thermal expansion of the substrate. The superimposition of the two opposite resistance behaviors results in a slower growth of total resistance [51].
The resistance hysteresis occurring in GNP film on LDPE during the thermal cycles (Figure 8b) can be attributed to the mismatched thermal expansion coefficient between LDPE and GNP film, too. Indeed, the larger strain of the polymer substrate causes a greater mobility of the nanoplatelets and the occurrence of nano-/microfractures in the films which can lead to different rearrangements of the platelets with different resistance values for the same temperature during a thermal cycle. It was observed that the cooling and heating R-T curves tend to become closer in thermal cycles performed in narrower temperature intervals, however more work needs to be done to reduce the resistance hysteresis in all the examined range by optimizing the deposition conditions of GNP films on LDPE, and to determine the performance of the samples as a function of the film thickness.
It is worth noting that by further limiting the temperature variations between 20 and 40 °C, the fractional change of the electrical resistance, (R − R0)/R0, is directly proportional to temperature as illustrated in Figure 9a, and the investigated sample works as a temperature sensor. On the other hand, the heating of the sample produces positive tensile strains, ε, which are also directly proportional to temperature, as it can be seen in the same figure.
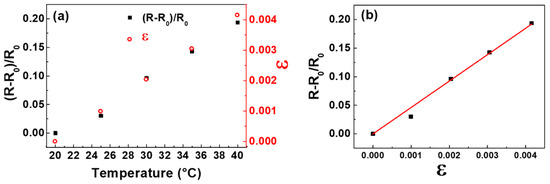
Figure 9.
Fractional change of the electrical resistance, (R − R0)/R0, and strain, ε, versus temperature for a GNP film deposited on LDPE substrate (a). Fractional change of the electrical resistance, (R − R0)/R0, versus strain, ε, for a GNP film deposited on LDPE substrate (b). The straight line is the fit of the experimental data.
Therefore, keeping constant the temperature at 20 °C and applying mechanical strain, ε, (having the same values induced by the thermal ones) in the 0–4.2 × 10⁻³ range, (R − R0)/R0 is a linear function of ε, as shown in Figure 9b. This demonstrates that the sample can operate as a strain gauge because it converts the mechanical strains into electrical resistance changes. The electrical response to mechanical deformations of strain sensors is quantified by the gauge factor (GF), that is the ratio of the relative change in electrical resistance, R, to the mechanical strain, ε, namely
where R0 is the unstrained resistance. From the fit of the experimental data plotted in Figure 9b, a gauge factor of 48 ± 2 is obtained with a correlation coefficient r = 0.990.
GF = (R − R0)/(εR0)
4. Conclusions
Films were deposited on LDPE substrates by spreading a graphite paste on their surfaces by using a micromechanical method. SEM, TEM and XRD characterizations show films about 900 nm thick consisting of overlapped nanoplatelets, each composed of 41 graphene layers on average.
DSC and DMA results reveal that by limiting the temperature variations in the range between −40 and 40 °C approximately, irreversible phase transitions, as melting, glass and partial melting/recrystallization, as well as large variations of the mechanical parameters in the LDPE substrates, can be avoided. This prevents damages and large fractures even in the graphite nanoplatelet films. In this temperature range only the glass transition of the crystalline-amorphous interphase (β relaxation) can take place without modifying the polymer structure. However, it leads to a hysteretic behavior in the strain versus temperature curve and variations of the linear thermal expansion coefficient in the range 1.29 × 10⁻⁴–1.79 × 10⁻⁴ °C−1 during thermal cycles. Nevertheless, the constancy in the crystalline phase and the low variation in storage modulus ensure sufficient stability and reproducibility of the LDPE thermo-mechanical parameters.
The electrical measurements of GNP on LDPE samples performed under vacuum in two probe configurations in the temperature range from −40 to 40 °C, show linear I-V characteristics for each temperature. The electrical resistance of these samples increases with temperature, showing an opposite behavior with respect graphene/graphite-based materials in which the temperature coefficient of resistance is negative. The observed resistance trend can be attributed to the much higher thermal expansion coefficient of the LDPE substrate which, as the temperature increases, induces large strains in the deposited film affecting the overlapping of graphite nanoplatelets and decreasing the number of conductive paths, thus increasing the film resistance. Furthermore, the large strains of the polymer substrate cause a great mobility of the nanoplatelets and the occurrence of nano-/microfractures in the films that can lead to different rearrangements of the platelets with different resistance values for the same temperature during thermal cycles and therefore to hysteresis phenomena.
The hysteresis of the resistance tends to reduce as the temperature range narrows and the fractional change of the electrical resistance becomes directly proportional to temperature between 20 and 40 °C, indicating that GNP on LDPE samples can work as temperature sensors. Finally, it has been demonstrated that keeping constant the temperature at 20 °C and applying mechanical strains in the 0–4.2 × 10⁻³ range, these samples can operate as strain gauges with a gauge factor of about 48.
Author Contributions
Conceptualization, U.C., G.C., A.S., G.B., and A.D.B.; software, A.L., A.S., G.B., and F.U.; validation, U.C., A.L., M.P., A.S., F.U., G.B., and G.A.; formal analysis, A.L., M.P., U.C., A.S., and G.B.; investigation, G.B., F.U., A.L., A.S., and M.P.; data curation, G.C., A.L., and M.P.; writing—original draft preparation, G.C., M.P., A.L., A.D.B., G.B., A.S., G.A., F.U., and U.C.; writing—review and editing, A.D.B., G.B., G.A., A.S., A.L., and U.C.; supervision, U.C., G.A., G.C., and A.D.B.; All authors have read and agreed to the published version of the manuscript.
Funding
This research received no external funding.
Institutional Review Board Statement
Not applicable.
Informed Consent Statement
Not applicable.
Data Availability Statement
Not applicable.
Acknowledgments
The authors are grateful to M.C. Del Barone of LAMEST laboratory (IPCB-CNR) for SEM measurements. The authors are also grateful to A. Vanzanella and the electronic workshop of INFN Napoli for the fruitful discussions and their support during the assembling of the experimental setup.
Conflicts of Interest
The authors declare no conflict of interest.
References
- Costa, J.C.; Spina, F.; Lugoda, P.; Garcia-Garcia, L.; Roggen, D.; Münzenrieder, N. Flex. Sens.—Mater. Appl. Technol. 2019, 7, 35. [CrossRef]
- Seo, C.U.; Yoon, Y.; Kim, D.H.; Choi, S.Y.; Park, W.K.; Yoo, J.S.; Baek, B.; Kwon, S.B.; Yang, C.M.; Song, Y.H.; et al. Fabrication of polyaniline-carbon nano composite for application in sensitive flexible acid sensor. J. Ind. Eng. Chem. 2018, 64, 97–101. [Google Scholar] [CrossRef]
- Wang, P.; Hu, M.; Wang, H.; Chen, Z.; Feng, Y.; Wang, J.; Ling, W.; Huang, Y. The evolution of flexible electronics: From nature, beyond nature, and to nature. Adv. Sci. 2020, 7, 2001116. [Google Scholar] [CrossRef] [PubMed]
- Hussain, M.M.; El-Atab, N. Handbook of Flexible and Stretchable Electronics, 1st ed.; CRC Press: Boca Raton, FL, USA, 2019. [Google Scholar]
- Garidiner, F.; Carter, E. Polymer Electronics—A Flexible Technology; iSmithers Rapra Publishing: Akron, OH, USA, 2010. [Google Scholar]
- Shintake, J.; Piskarev, E.; Jeong, S.H.; Floreano, D. Ultrastretchable strain sensors using carbon black-filled elastomer composites and comparison of capacitive versus resistive sensors. Adv. Mater. Technol. 2017, 3, 1700284. [Google Scholar] [CrossRef]
- Allen, M.J.; Tung, V.C.; Kaner, R.B. Honeycomb carbon: A review of graphene. Chem. Rev. 2010, 110, 132–145. [Google Scholar] [CrossRef]
- Shi, J.; Li, X.; Cheng, H.; Liu, Z.; Zhao, L.; Yang, T.; Dai, Z.; Cheng, Z.; Shi, E.; Yang, L.; et al. Graphene reinforced carbon nanotube networks for wearable strain sensors. Adv. Funct. Mater. 2016, 26, 2078–2084. [Google Scholar] [CrossRef]
- Novoselov, K.S.; Geim, A.K.; Morozov, S.V.; Jiang, D.; Zhang, Y.; Dubonos, S.V.; Grigorieva, I.V.; Firsov, A.A. Electric field effect in atomically thin carbon films. Science 2004, 306, 666–669. [Google Scholar] [CrossRef]
- Longo, A.; Verucchi, R.; Aversa, L.; Tatti, R.; Ambrosio, A.; Orabona, E.; Coscia, U.; Carotenuto, G.; Maddalena, P. Graphene oxide prepared by graphene nano-platelets and reduced by laser treatment. Nanotechnology 2017, 28, 224002–224008. [Google Scholar] [CrossRef]
- Kumar, S.; Blanchet, G.; Hybertsen, M.S.; Murthy, J.; Alam, M. Performance of carbon nanotube-dispersed thin film transistors. Appl. Phys. Lett. 2006, 89, 143501. [Google Scholar] [CrossRef]
- Gorrasi, G.; Bugatti, V.; Milone, C.; Mastronardo, E.; Piperopoulos, E.; Iemmo, L.; Di Bartolomeo, A. Effect of temperature and morphology on the electrical properties of PET/conductive nanofillers composites. Compos. Part B Eng. 2018, 135, 149–154. [Google Scholar] [CrossRef]
- Guadagno, L.; Raimondo, M.; Naddeo, C.; Di Bartolomeo, A.; Lafdi, K. Influence of multiwall carbon nanotubes on morphological and structural changes during UV irradiation of syndiotactic polypropylene films. J. Polym. Sci. Part B Polym. Phys. 2012, 50, 963–975. [Google Scholar] [CrossRef]
- Pinargote, N.W.S.; Smirnov, A.; Peretyagin, N.; Seleznev, A.; Peretyagin, P. Direct ink writing technology (3D printing) of graphene-based ceramic nanocomposites: A review. Nanomaterials 2020, 10, 1300. [Google Scholar] [CrossRef] [PubMed]
- Giovannetti, R.; Rommozzi, E.; Zannotti, M.; D’Amato, C.A. Recent advances in graphene based TiO2 nanocomposites (GTiO2Ns) for photocatalytic degradation of synthetic dyes. Catalysts 2017, 7, 305. [Google Scholar] [CrossRef]
- Urban, F.; Lupina, G.; Grillo, A.; Martucciello, N.; Di Bartolomeo, A. Contact resistance and mobility in back-gate graphene transistors. Nano Express 2020, 1, 010001. [Google Scholar] [CrossRef]
- Yi, M.; Shen, Z. A review on mechanical exfoliation for the scalable production of graphene. J. Mater. Chem. A 2015, 3, 11700–11715. [Google Scholar] [CrossRef]
- Hernandez, Y.; Nicolosi, V.; Lotya, M.; Blighe, F.M.; Sun, Z.Y.; De, S.; McGovern, I.T.; Holland, B.; Byrne, M.; Gunko, Y.K.; et al. High-yield production of graphene by liquid-phase exfoliation of graphite. Nat. Nanotechnol. 2008, 3, 563–568. [Google Scholar] [CrossRef]
- Coscia, U.; Palomba, M.; Ambrosone, G.; Barucca, G.; Cabibbo, M.; Mengucci, P.; De Asmundis, R.; Carotenuto, G. A new micromechanical approach for the preparation of graphene nanoplatelets deposited on polyethylene. Nanotechnology 2017, 28, 194001. [Google Scholar] [CrossRef]
- Wgbnn Beidaghi, M.; Wang, Z.; Gu, L.; Wang, C. Electrostatic spray deposition of graphene nanoplatelets for highpower thin-film supercapacitor electrodes. J. Solid State Electrochem. 2012, 16, 3341–3348. [Google Scholar] [CrossRef]
- Zhong, Y.L.; Swager, T.M. Enhanced electrochemical expansion of graphite for in situ electrochemical functionalization. J. Am. Chem. Soc. 2012, 134, 17896–17899. [Google Scholar] [CrossRef]
- McAllister, M.J.; Li, J.L.; Adamson, D.H.; Schniepp, H.C.; Abdala, A.A.; Liu, J.; Herrera-Alonso, M.; Milius, D.L.; Car, R.; Prudhomme, R.K.; et al. Single sheet functionalized graphene by oxidation and thermal expansion of graphite. Chem. Mater. 2007, 19, 4396–4404. [Google Scholar] [CrossRef]
- Ren, J.; Wang, C.; Zhang, X.; Carey, T.; Chen, K.; Yin, Y.; Torrisi, F. Environmentally—friendly conductive cotton fabric as flexible strain sensor based on hot press reduced graphene oxide. Carbon 2017, 111, 622–630. [Google Scholar] [CrossRef]
- Zhong, X.; Zhao, X.; Qian, Y.; Zou, Y. Polyethylene plastic production process. Insight−Mater. Sci. 2018, 1, 1. [Google Scholar] [CrossRef]
- Vasile, C.; Pascu, M. Practical Guide to Polyethylene; ISmithers Rapra Press: Shrewsbury, UK, 2005. [Google Scholar]
- De Oilveira, M.F. Adhesion mechanisms for automotive plastic parts. In Proceedings of the 11th International Conference Coatings, São Paulo, Brazil, 23–25 September 2009. [Google Scholar]
- Nishio, M. The CH/p hydrogen bond in chemistry. Conformation, supramolecules, optical resolution and interactions involving carbohydrates. Phys. Chem. Chem. Phys. 2011, 13, 13873. [Google Scholar] [CrossRef]
- Spearing, S.M. Material issues in microelectromechanical systems (MEMS). Acta Mater. 2000, 48, 179–196. [Google Scholar] [CrossRef]
- Gonzalez, M.; Vandevelde, B.; Christiaens, W.; Hsu, Y.Y.; Iker, F.; Bossuyt, F.; Timmermans, P. Thermo-mechanical analysis of flexible and stretchable systems. In Proceedings of the 11th International Thermal, Mechanical and Multi-Physics Simulation, and Experiments in Microelectronics and Microsystems (EuroSimE), Bordeaux, France, 26–28 April 2011; pp. 1–7. [Google Scholar]
- Bianco, A.; Cheng, H.-M.; Enoki, T.; Gogotsi, Y.; Hurt, R.; Koratkar, N.; Kyotani, T. All in the graphene family–A recommended nomenclature for two-dimensional carbon materials. Carbon 2013, 65, 1. [Google Scholar] [CrossRef]
- Alexander, L.E. X-ray Diffraction Methods in Polymer Science; Krieger Pub.: Huntington, NY, USA, 1979. [Google Scholar]
- Singh, B.P.; Saini, P.P.; Gupta, T.; Garg, P.; Kumar, G.; Pande, I.; Pande, S.; Seth, R.K.; Dhawan, S.K.; Mathur, R.B. Designing of multiwalled carbon nanotubes reinforced low density polyethylene nanocomposites for suppression of electromagnetic radiation. J. Nanopart. Res. 2011, 13, 7065–7074. [Google Scholar] [CrossRef]
- Akinci, A. Mechanical and morphological properties of basalt filled polymer matrix composites. Arch. Mater. Sci. Eng. 2009, 35, 29–32. [Google Scholar]
- Sharma, R.; Chadha, N.; Saini, P. Determination of defect density, crystallite size and number of graphene layers in graphene analogues using X-ray diffraction and Raman spectroscopy. Indian J. Pure Appl. Phys. 2017, 55, 625–629. [Google Scholar]
- Buerger, M.J. X-ray Crystallography; Wiley: Hoboken, NJ, USA, 1942. [Google Scholar]
- Cullity, B.D. Elements of X-ray Diffraction, Reading; Addison-Wesley: Boston, MA, USA, 1956. [Google Scholar]
- Bacon, G.E. Unit-cell dimensions of graphite. Acta Cryst. 1950, 3, 137. [Google Scholar] [CrossRef]
- Bacon, G.E. The rhombohedral modification of graphite. Acta Cryst. 1950, 3, 320. [Google Scholar] [CrossRef]
- Kazimi, M.R.; Shah, T.; Jamari, S.S.B.; Ahmed, I.; Faizal, C.K.M. Sulfonation of low-density polyethylene and its impact on polymer properties. Polym. Eng. Sci. 2014, 54, 2522–2530. [Google Scholar] [CrossRef]
- De Sousa, D.E.S.; Scuracchio, C.H.; De Oliveira Barra, G.M.; De Almeida, L.A. Expanded graphite as a multifunctional filler for polymer nanocomposites. Multifunct. Polym. Compos. 2015, 245. [Google Scholar]
- Stein, R.S. Time-dependence of crystal orientation in crystalline polymers. Polym. Eng. Sci. 1968, 8, 259–266. [Google Scholar] [CrossRef]
- Lam, R.; Geil, P.H. Amorphous linear polyethylene: Annealing effects. J. Macromol. Sci. Part. B Phys. 1981, 20, 37–58. [Google Scholar] [CrossRef]
- Zakin, J.L.; Simha, R.; Hershey, H.C. Low-temperature thermal expansivities of polyethylene, polypropylene, mixtures of polyethylene and polypropylene, and polystyrene. J. Appl. Polym. Sci. 1966, 10, 1455–1473. [Google Scholar] [CrossRef]
- Davis, G.T.; Eby, R.K. Glass transition of polyethylene: Volume relaxation. J. Appl. Phys. 1973, 44, 4274. [Google Scholar] [CrossRef]
- Boyer, R.F. Dependence of mechanical properties on molecular motion in polymers. Polym. Eng. Sci. 1968, 8, 161–185. [Google Scholar] [CrossRef]
- Kissin, Y.V. Polyethylene: End-Use Properties and Their Physical Meaning; Hanser Pub Inc.: Liberty Township, OH, USA, 2013. [Google Scholar]
- Iwashita, H.; Imagawa, H.; Nishiumi, W. Variation of temperature dependence of electrical resistivity with crystal structure of artificial products. Carbon 2013, 61, 602–608. [Google Scholar] [CrossRef]
- Mag-isa, A.E.; Kim, J.H.; Oh, C.S. Measurements of the in-plane coefficient of thermal expansion of freestanding single-crystal natural graphite. Mater. Lett. 2016, 171, 312. [Google Scholar] [CrossRef]
- Mag-isa, A.E.; Kim, S.M.; Kim, J.H.; Oh, C.S. Variation of thermal expansion coefficient of freestanding multilayer pristine graphene with temperature and number of layers. Mater. Today Commun. 2020, 25, 101387. [Google Scholar] [CrossRef]
- Palomba, M.; Carotenuto, G.; Longo, A.; Sorrentino, A.; Di Bartolomeo, A.; Iemmo, L.; Urban, F.; Giubileo, F.; Barucca, G.; Rovere, M.; et al. Thermoresistive properties of graphite platelet films supported by different substrates. Materials 2019, 12, 3638. [Google Scholar] [CrossRef] [PubMed]
- Tian, M.; Huang, Y.; Wang, W.; Li, R.; Liu, P.; Liu, C.; Zang, Y. Temperature-dependent electrical properties of graphene nanoplatelets film dropped on flexible substrates. J. Mater. Res. 2014, 29, 1288–1294. [Google Scholar] [CrossRef]
Publisher’s Note: MDPI stays neutral with regard to jurisdictional claims in published maps and institutional affiliations. |
© 2021 by the authors. Licensee MDPI, Basel, Switzerland. This article is an open access article distributed under the terms and conditions of the Creative Commons Attribution (CC BY) license (http://creativecommons.org/licenses/by/4.0/).