Insightful Analysis of Phenomena Arising at the Metal|Polymer Interphase of Au-Ti Based Non-Enzymatic Glucose Sensitive Electrodes Covered by Nafion

 , ,
, ,
Abstract
:1. Introduction
2. Experimental
2.1. Reagents
2.2. Material Preparation
2.3. Morphology of Electrodes and Chemical Composition of the Nafion Coating
2.4. Electrochemical Measurements
3. Results and Discussion
3.1. Morphology of Electrodes and Chemical Composition of the Nafion Coating
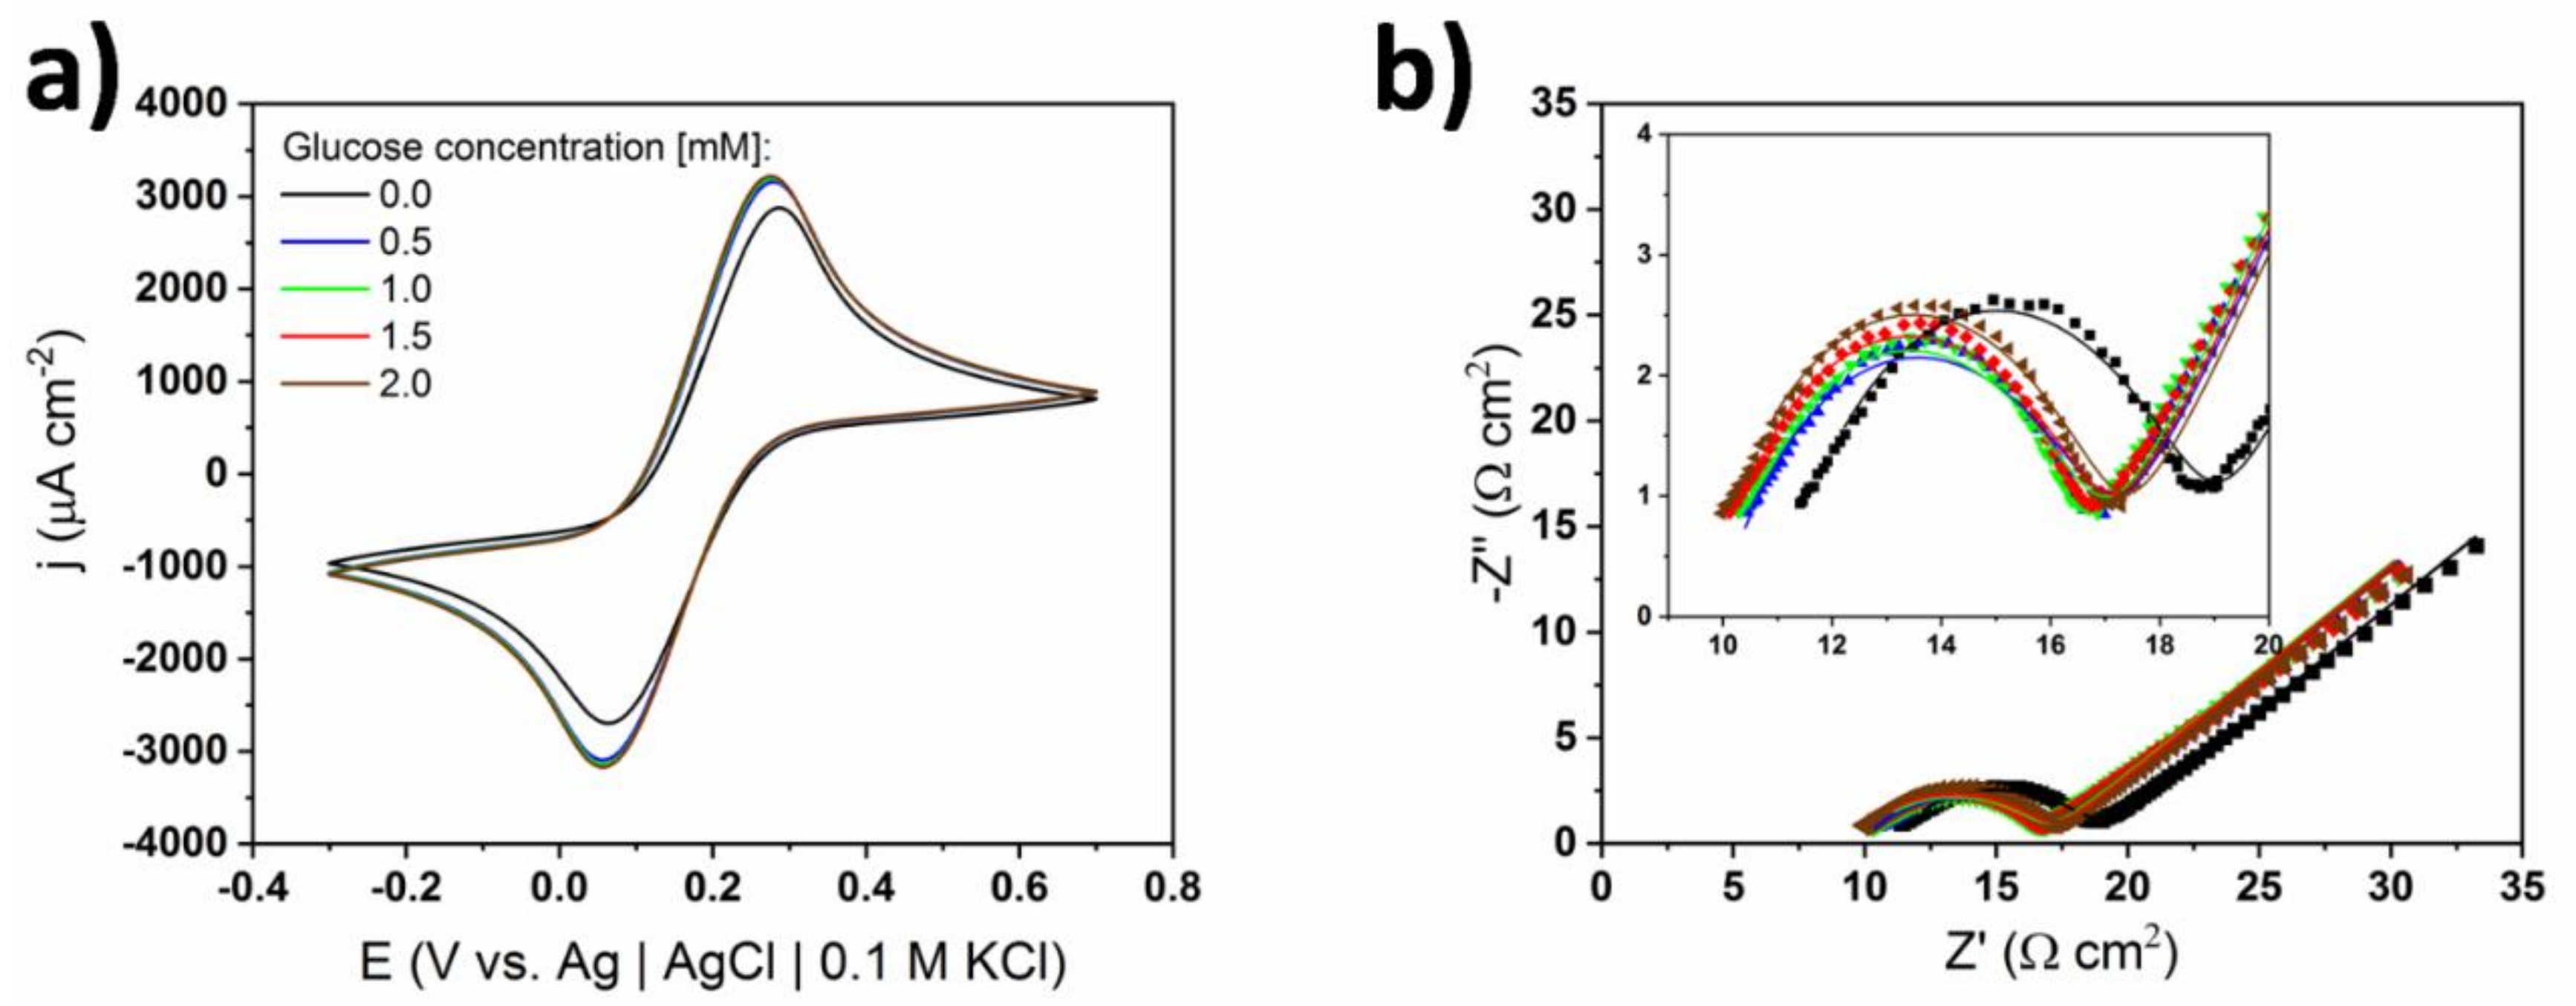
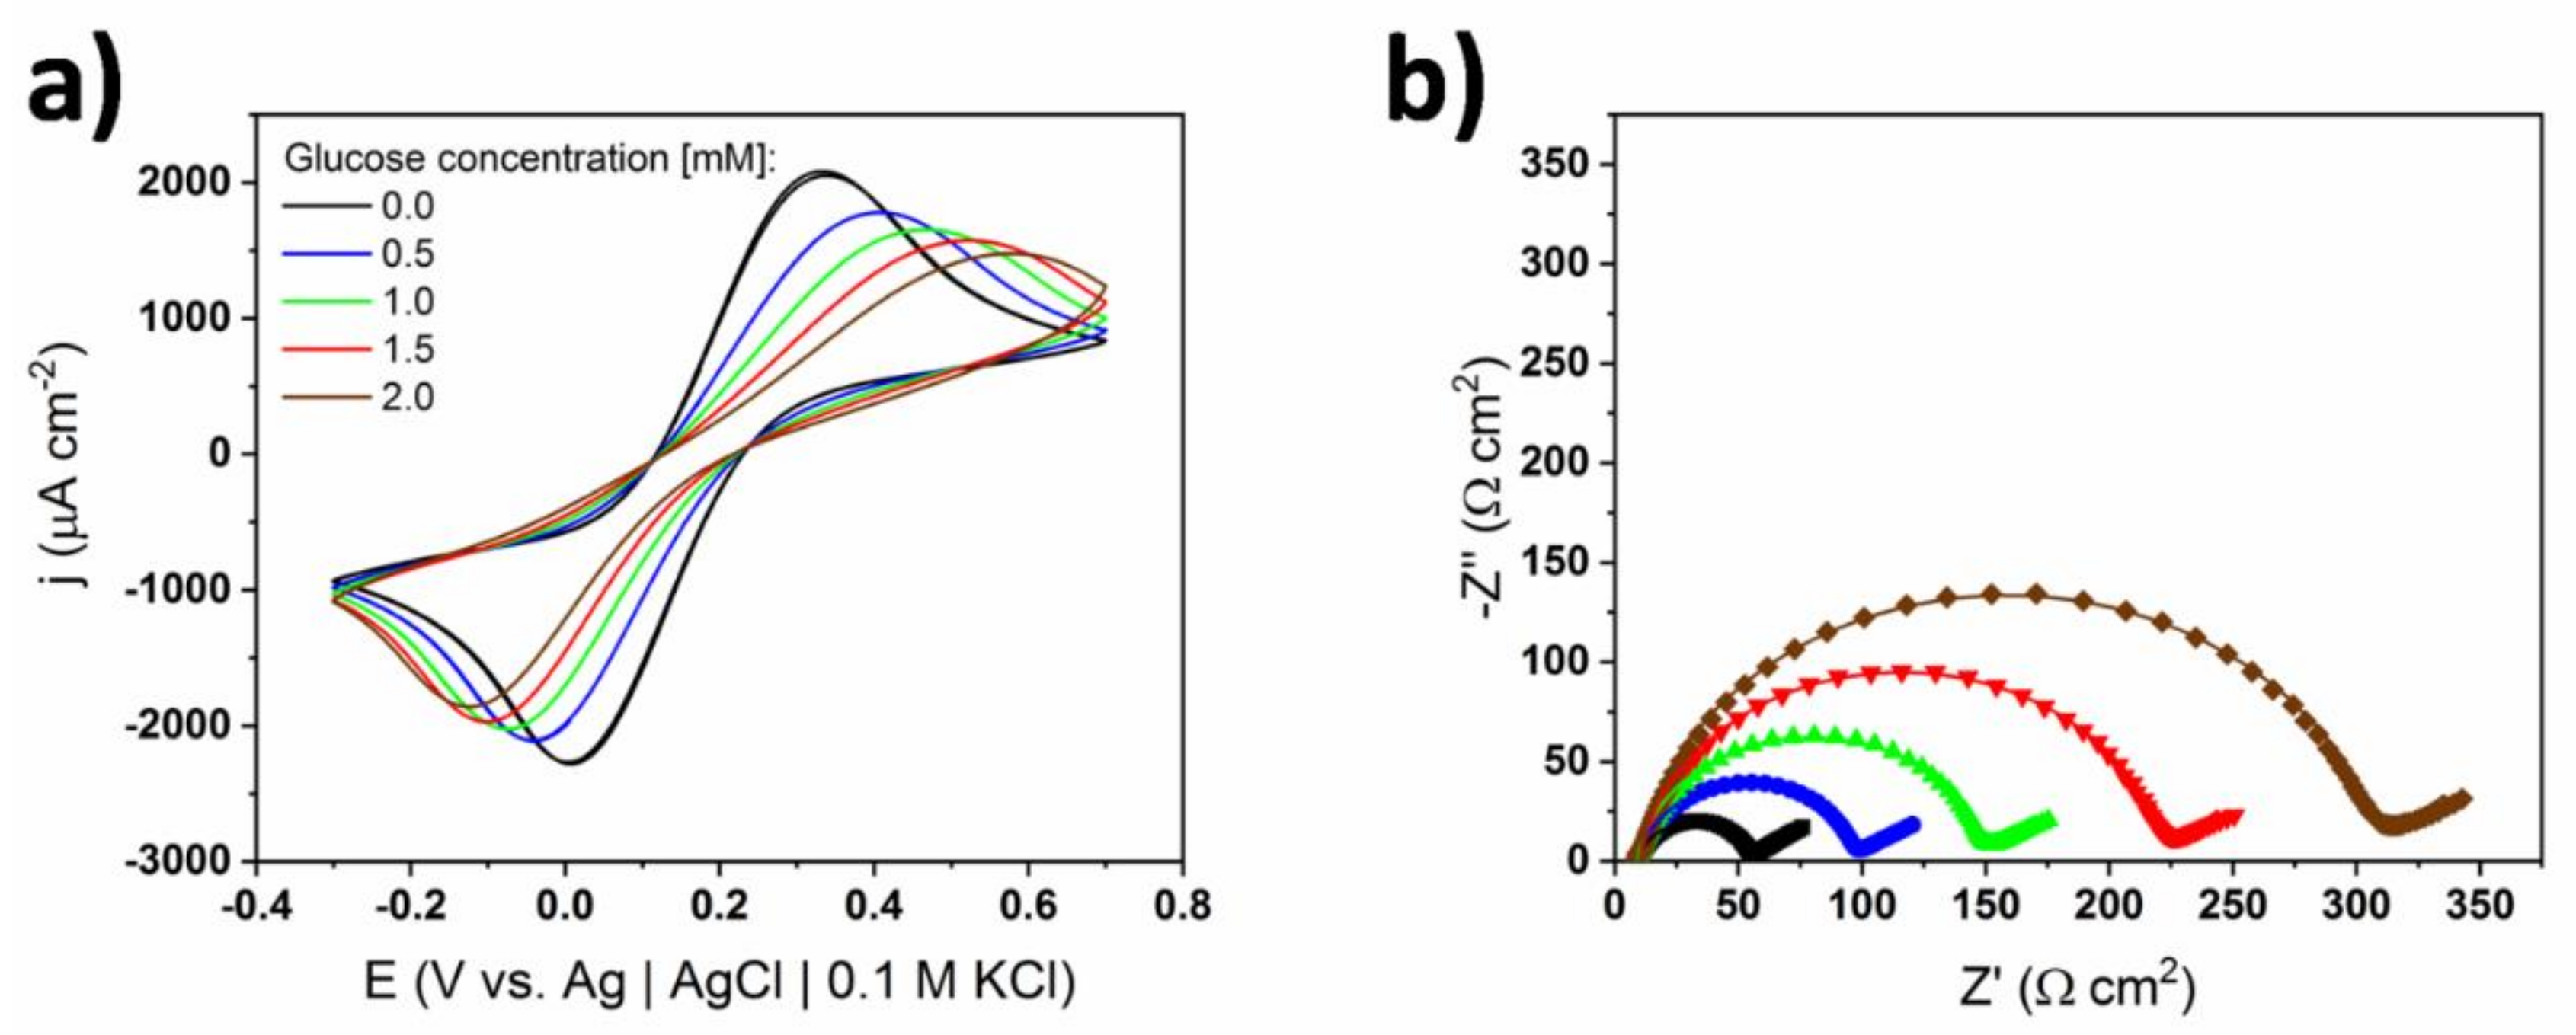
3.2. Electrode Behavior in Commercial and Self-Made PBS
3.3. Influence of Nafion Coating on the Calibration Curve
3.4. Influence of Ionic Conductivity of the Solution on the Electrochemical Response
4. Conclusions
Author Contributions
Funding
Conflicts of Interest
References
- Hwang, D.-W.; Lee, S.; Seo, M.; Chung, T.D. Recent advances in electrochemical non-enzymatic glucose sensors—A review. Anal. Chim. Acta 2018, 1033, 1–34. [Google Scholar] [CrossRef] [PubMed]
- Liu, N.; Xu, Z.; Morrin, A.; Luo, X. Low fouling strategies for electrochemical biosensors targeting disease biomarkers. Anal. Methods 2019, 11, 702–711. [Google Scholar] [CrossRef]
- Park, S.; Song, Y.J.; Han, J.-H.; Boo, H.; Chung, T.D. Structural and electrochemical features of 3D nanoporous platinum electrodes. Electrochim. Acta 2010, 55, 2029–2035. [Google Scholar] [CrossRef]
- Kim, S.H.; Choi, J.B.; Nguyen, Q.N.; Lee, J.M.; Park, S.; Chung, T.D.; Byun, J.-Y. Nanoporous platinum thin films synthesized by electrochemical dealloying for nonenzymatic glucose detection. Phys. Chem. Chem. Phys. 2013, 15, 5782. [Google Scholar] [CrossRef]
- Ding, J.; Li, X.; Zhou, L.; Yang, R.; Yan, F.; Su, B. Electrodeposition of nickel nanostructures using silica nanochannels as confinement for low-fouling enzyme-free glucose detection. J. Mater. Chem. B 2020, 8, 3616–3622. [Google Scholar] [CrossRef]
- Liu, X.; Yang, W.; Chen, L.; Jia, J. Synthesis of copper nanorods for non-enzymatic amperometric sensing of glucose. Microchim. Acta 2016, 183, 2369–2375. [Google Scholar] [CrossRef]
- Toghill, K.E.; Compton, R.G. Electrochemical non-enzymatic glucose sensors: A perspective and an evaluation. Intern. J. Electrochem. Sci. 2010, 5, 1246–1301. [Google Scholar]
- Geelhood, S.J.; Horbett, T.A.; Ward, W.K.; Wood, M.D.; Quinn, M.J. Passivating protein coatings for implantable glucose sensors: Evaluation of protein retention. J. Biomed. Mater. Res. Part B Appl. Biomater. 2007, 81, 251–260. [Google Scholar] [CrossRef]
- Li, L.; Chen, S.; Jiang, S. Protein interactions with oligo(ethylene glycol) (OEG) self-assembled monolayers: OEG stability, surface packing density and protein adsorption. J. Biomater. Sci. Polym. Ed. 2007, 18, 1415–1427. [Google Scholar] [CrossRef]
- Lee, S.; Nam, J.H.; Kim, Y.J.; Cho, Y.J.; Kwon, N.H.; Lee, J.Y.; Kang, H.-J.; Kim, H.T.; Park, H.M.; Kim, S.; et al. Synthesis of PEO-based glucose-sensitive block copolymers and their application for preparation of superparamagnetic iron oxide nanoparticles. Macromol. Res. 2011, 19, 827–834. [Google Scholar] [CrossRef]
- Feng, D.; Wang, F.; Chen, Z. Electrochemical glucose sensor based on one-step construction of gold nanoparticle—chitosan composite film. Sens. Actuators B Chem. 2009, 138, 539–544. [Google Scholar] [CrossRef]
- Cao, H.; Yang, A.; Li, H.; Wang, S.; Li, S.; Kong, J.; Bao, X.; Yang, R. A non-enzymatic glucose sensing based on hollow cuprous oxide nanospheres in a Nafion matrix. Sens. Actuators B Chem. 2015, 214, 169–173. [Google Scholar] [CrossRef]
- Mei, L.; Zhang, P.; Chen, J.; Chen, D.; Quan, Y.; Gu, N.; Zhang, G.; Cui, R. Non-enzymatic sensing of glucose and hydrogen peroxide using a glassy carbon electrode modified with a nanocomposite consisting of nanoporous copper, carbon black and nafion. Microchim. Acta 2016, 183, 1359–1365. [Google Scholar] [CrossRef]
- Hu, Y.; Liang, B.; Fang, L.; Ma, G.; Yang, G.; Zhu, Q.; Chen, S.; Ye, X. Antifouling Zwitterionic Coating via Electrochemically Mediated Atom Transfer Radical Polymerization on Enzyme-Based Glucose Sensors for Long-Time Stability in 37 °C Serum. Langmuir 2016, 32, 11763–11770. [Google Scholar] [CrossRef]
- Yang, W.; Xue, H.; Carr, L.R.; Wang, J.; Jiang, S. Zwitterionic poly(carboxybetaine) hydrogels for glucose biosensors in complex media. Biosens. Bioelectron. 2011, 26, 2454–2459. [Google Scholar] [CrossRef] [PubMed]
- Yang, J.; Liang, X.; Cui, L.; Liu, H.; Xie, J.; Liu, W. A novel non-enzymatic glucose sensor based on Pt3Ru1 alloy nanoparticles with high density of surface defects. Biosens. Bioelectron. 2016, 80, 171–174. [Google Scholar] [CrossRef]
- Kokkindis, G.; Leger, J.; Lamy, C. Structural effects in electrocatalysis: Oxidation of D-glucose on pt (100), (110) and (111) single crystal electrodes and the effect of upd adlayers of Pb, Tl and Bi. J. Electroanal. Chem. Interfacial Electrochem. 1988, 242, 221–242. [Google Scholar] [CrossRef]
- Popović, K.; Marković, N.; Tripković, A.; Adžić, R. Structural effects in electrocatalysis: Oxidation of D-glucose on single crystal platinum electrodes in alkaline solution. J. Electroanal. Chem. Interfacial Electrochem. 1991, 313, 181–199. [Google Scholar] [CrossRef]
- Niu, X.; Lan, M.; Zhao, H.; Chen, C. Well-Dispersed Pt Cubes on Porous Cu Foam: High-Performance Catalysts for the Electrochemical Oxidation of Glucose in Neutral Media. Chem. A Eur. J. 2013, 19, 9534–9541. [Google Scholar] [CrossRef]
- Guo, M.; Hong, H.; Tang, X.; Fang, H.; Xu, X. Ultrasonic electrodeposition of platinum nanoflowers and their application in nonenzymatic glucose sensors. Electrochim. Acta 2012, 63, 1–8. [Google Scholar] [CrossRef]
- Grochowska, K.; Szkoda, M.; Karczewski, J.; Śliwiński, G.; Siuzdak, K. Ordered titanium templates functionalized by gold films for biosensing applications—Towards non-enzymatic glucose detection. Talanta 2017, 166, 207–214. [Google Scholar] [CrossRef] [PubMed]
- Olejnik, A.; Siuzdak, K.; Karczewski, J.; Grochowska, K. A Flexible Nafion Coated Enzyme-free Glucose Sensor Based on Au-dimpled Ti Structures. Electroanalysis 2019, 32, 323–332. [Google Scholar] [CrossRef]
- Olejnik, A.; Karczewski, J.; Dołęga, A.; Siuzdak, K.; Grochowska, K. Novel approach to interference analysis of glucose sensing materials coated with Nafion. Bioelectrochemistry 2020, 135, 107575. [Google Scholar] [CrossRef] [PubMed]
- Vaidya, R.; Atanasov, P.; Wilkins, E. Effect of interference on the performance of glucose enzyme electrodes using Nafion® coatings. Med. Eng. Phys. 1995, 17, 416–424. [Google Scholar] [CrossRef]
- Mauritz, K.A.; Moore, R.B. State of understanding of Nafion. Chem. Rev. 2004, 104, 4535–4586. [Google Scholar] [CrossRef]
- Bondarenko, A.S.; Ragoisha, G.A. In Progress of the in Chemometrics Research. Pomerantsev, A.L., Ed.; Nova Science Publishers: New York, NY, USA, 2005; pp. 89–102. Available online: http://www.abc.chemistry.bsu.by/vi/analyser/ (accessed on 20 August 2020).
- Kim, J.-S.; Pyun, S.-I. Comparison of transmissive permeable and reflective impermeable interfaces between electrode and electrolyte. J. Solid State Electrochem. 2011, 15, 2447–2452. [Google Scholar] [CrossRef]
- Kollath, V.O.; Karan, K. New molecular scale insights into the ?-transition of Nafion® thin films from variable temperature ATR-FTIR spectroscopy. Phys. Chem. Chem. Phys. 2016, 18, 26144–26150. [Google Scholar] [CrossRef]
- Menegazzo, F.; Manzoli, M.; Chiorino, A.; Boccuzzi, F.; Tabakova, T.; Signoretto, M.; Pinna, F.; Pernicone, N. Quantitative determination of gold active sites by chemisorption and by infrared measurements of adsorbed CO. J. Catal. 2006, 237, 431–434. [Google Scholar] [CrossRef]
- Galus, Z. Teoretyczne Podstawy Elektroanalizy Chemicznej; Państwowe Wydawnictwo Naukowe: Warsaw, Poland, 1977. [Google Scholar]
- Bard, A.J.; Faulkner, L.R. Fundamentals and applications. Electrochem. Methods 2001, 2, 580–632. [Google Scholar]
- Lasia, A. Electrochemical impedance spectroscopy and its applications. In Modern Aspects of Electrochemistry; Springer: Boston, MA, USA, 2002; pp. 143–248. [Google Scholar]
- Hsu, C.H.; Mansfeld, F. Technical Note:Concerning the Conversion of the Constant Phase Element Parameter Y0into a Capacitance. Corrosion 2001, 57, 747–748. [Google Scholar] [CrossRef]
- Arjona, N.; Arriaga, L.; Guerra-Balcázar, M.; Trejo, G.; Ledesma-García, J. An electrokinetic-combined electrochemical study of the glucose electro-oxidation reaction: Effect of gold surface energy. RSC Adv. 2016, 6, 15630–15638. [Google Scholar] [CrossRef]
- Xu, X.; Makaraviciute, A.; Pettersson, J.; Zhang, S.-L.; Nyholm, L.; Zhang, Z. Revisiting the factors influencing gold electrodes prepared using cyclic voltammetry. Sens. Actuators B Chem. 2019, 283, 146–153. [Google Scholar] [CrossRef]
- Ugo, P.; Moretto, L.M. Ion Exchange Voltammetry. In Ion Exchange Technology I; Springer Science and Business Media LLC: Berlin/Heidelberg, Germany, 2012; pp. 403–435. [Google Scholar]
- Espenscheid, M.W.; Ghatak-Roy, A.R.; Moore, R.B.; Penner, R.M.; Szentirmay, M.N.; Martin, C.R. Sensors from polymer modified electrodes. J. Chem. Soc. Faraday Trans. 1 Phys. Chem. Condens. Phases 1986, 82, 1051–1070. [Google Scholar] [CrossRef]
- Hannoun, B.J.M.; Stephanopoulos, G. Diffusion coefficients of glucose and ethanol in cell-free and cell-occupied calcium alginate membranes. Biotechnol. Bioeng. 1986, 28, 829–835. [Google Scholar] [CrossRef]
- Nakanishi, K.; Adachi, S.; Yamamoto, S.; Matsuno, R.; Tanaka, A.; Kamikubo, T. Diffusion of Saccharides and Amino Acids in Cross-linked Polymers. Agric. Boil. Chem. 1977, 41, 2455–2462. [Google Scholar] [CrossRef]
- Whiteley, L.D.; Martin, C.R. Fresh look at transport in perfluorosulfonate ionomers: Ultramicroelectrode investigations of Nafion and the Dow ionomers. J. Phys. Chem. 1989, 93, 4650–4658. [Google Scholar] [CrossRef]
- Yaguchi, M.; Uchida, T.; Motobayashi, K.; Osawa, M. Speciation of Adsorbed Phosphate at Gold Electrodes: A Combined Surface-Enhanced Infrared Absorption Spectroscopy and DFT Study. J. Phys. Chem. Lett. 2016, 7, 3097–3102. [Google Scholar] [CrossRef]
- Hsiao, M.; Adzic, R.; Yeager, E. The effects of adsorbed anions on the oxidation of D-glucose on gold single crystal electrodes. Electrochim. Acta 1992, 37, 357–363. [Google Scholar] [CrossRef]


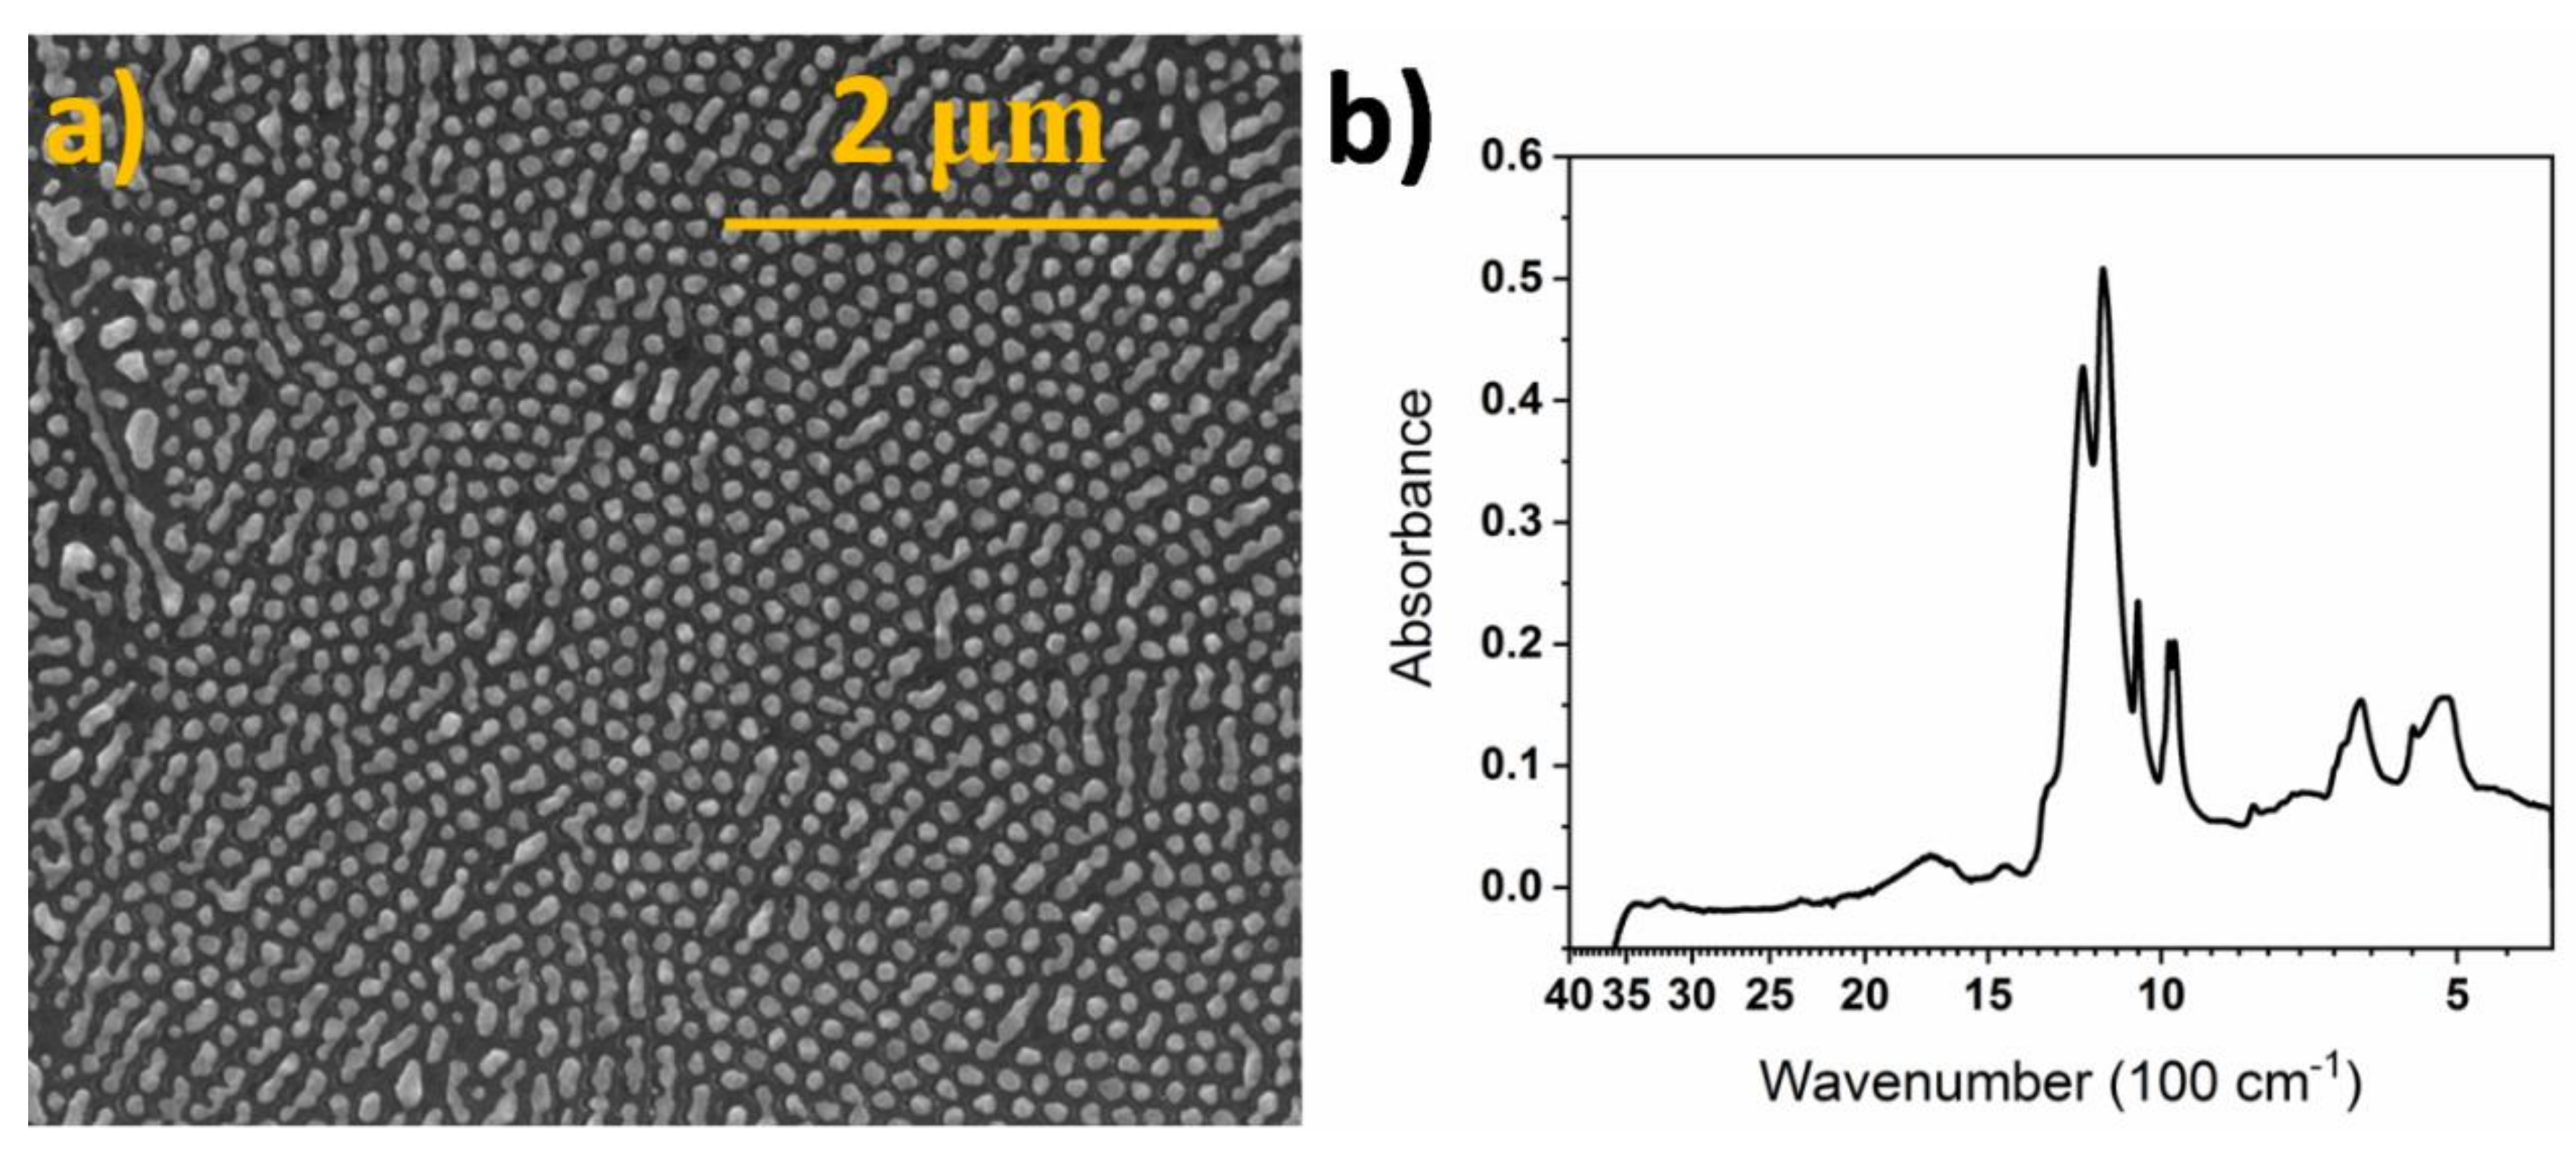
| Wavenumber [cm−1] | Corresponding Vibrations |
|---|---|
| 620 | CF2 wagging |
| 970 | C-O-C symmetric stretching |
| 1060 | SO3− symmetric stretching |
| 1140 | CF2 asymmetric stretching |
| 1200 | SO3− asymmetric stretching and CF2 asymmetric stretching |
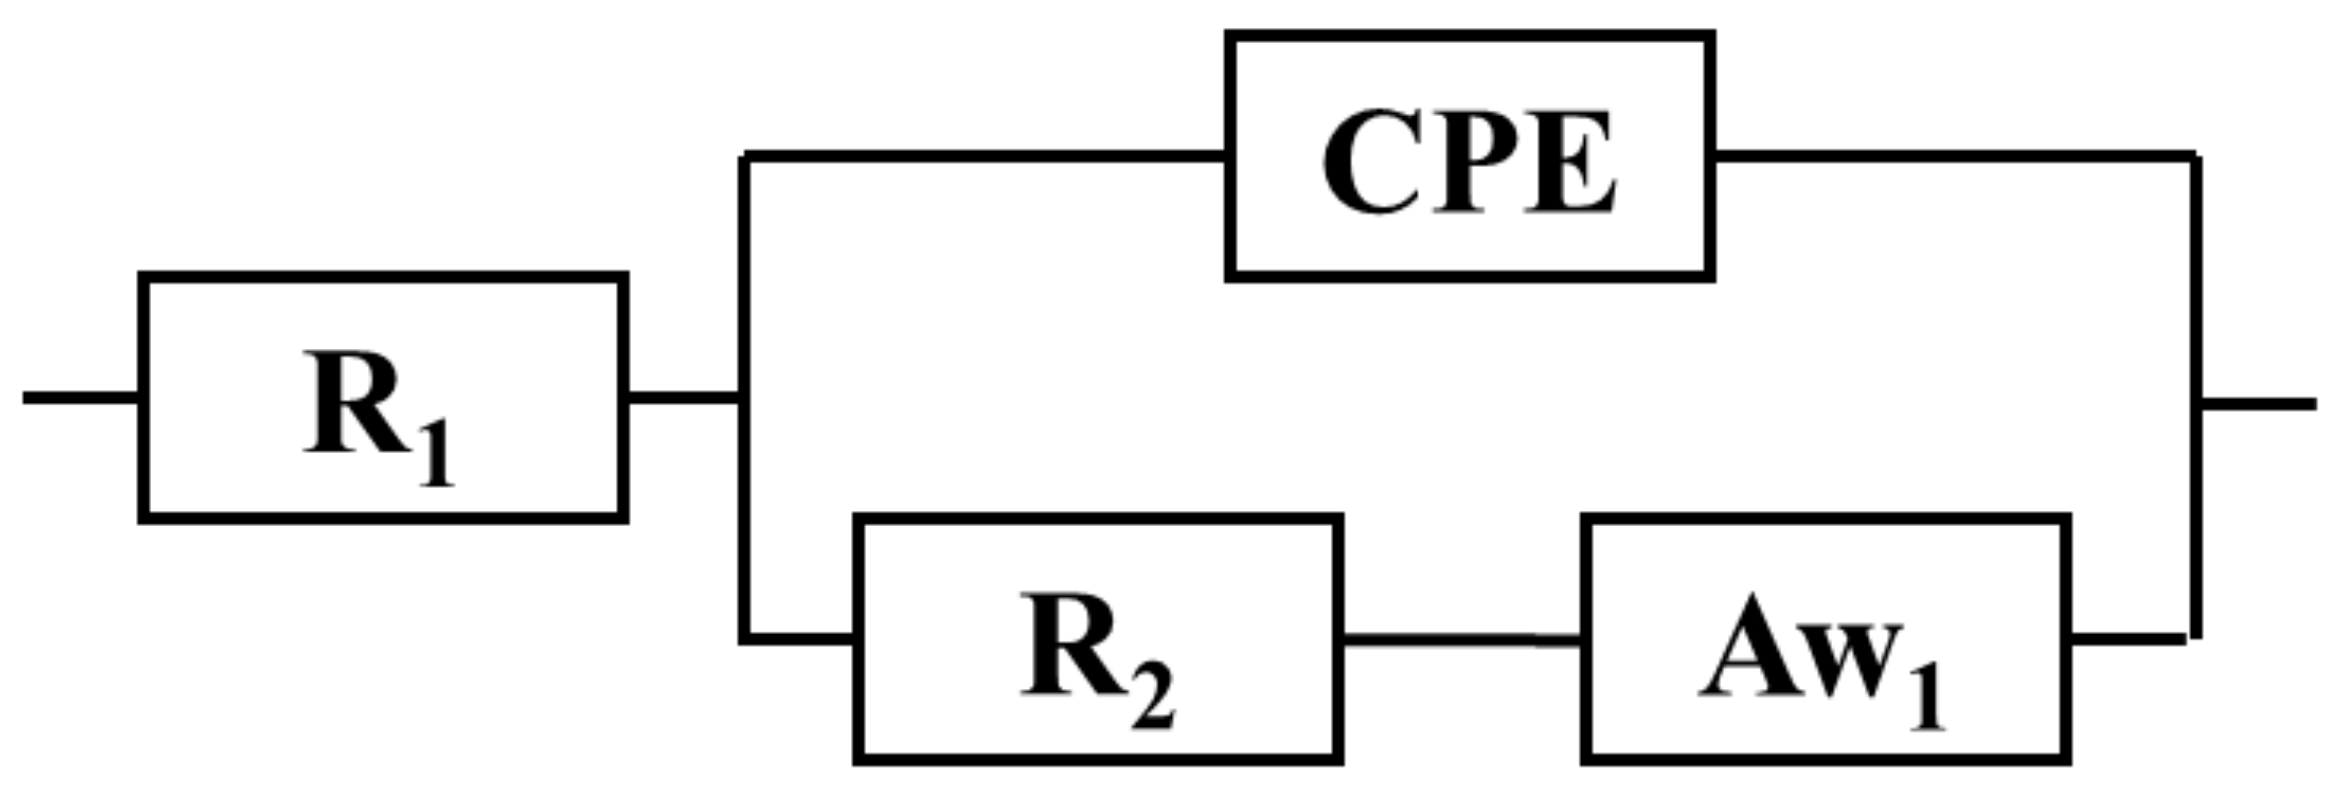
| Parameters | 0.0 mM Glucose | 0.5 mM Glucose | 1.0 mM Glucose | 1.5 mM Glucose | 2.0 mM Glucose |
|---|---|---|---|---|---|
| R1 [Ω cm2] | 11.0 | 10.0 | 9.8 | 9.7 | 9.6 |
| R2 [Ω cm2] | 7.8 | 7.1 | 7.0 | 7.3 | 7.5 |
| Aw1 [Ω cm2 s1/2] | 11.47 | 10.6 | 10.6 | 10.6 | 10.5 |
| Q0 | 134 | 194 | 161 | 144 | 119 |
| n | 0.72 | 0.68 | 0.70 | 0.72 | 0.74 |
| Cdl [μF cm−2] | 9.6 | 9.1 | 9.2 | 9.9 | 10.3 |
| χ2/10−4 | 0.795 | 2.0 | 1.3 | 1.3 | 1.1 |
| Parameters | 0.0 Mm Glucose | 0.5 mM Glucose | 1.0 mM Glucose | 1.5 mM Glucose | 2.0 mM Glucose |
|---|---|---|---|---|---|
| R1 [Ω cm2] | 9.2 | 9.8 | 9.3 | 10.5 | 10.1 |
| R2 [Ω cm2] | 45.8 | 87.0 | 139.0 | 209.0 | 294.3 |
| Aw1 [Ω cm2 s1/2] | 14.7 | 15.8 | 17.3 | 19.5 | 24.5 |
| Q0 | 29.2 | 23.2 | 22.0 | 20.8 | 20.8 |
| n | 0.90 | 0.92 | 0.93 | 0.94 | 0.94 |
| Cdl [μF cm−2] | 14.0 | 13.6 | 14.2 | 14.7 | 15.0 |
| χ2/10−3 | 2.8 | 3.5 | 6.9 | 6.0 | 9.2 |
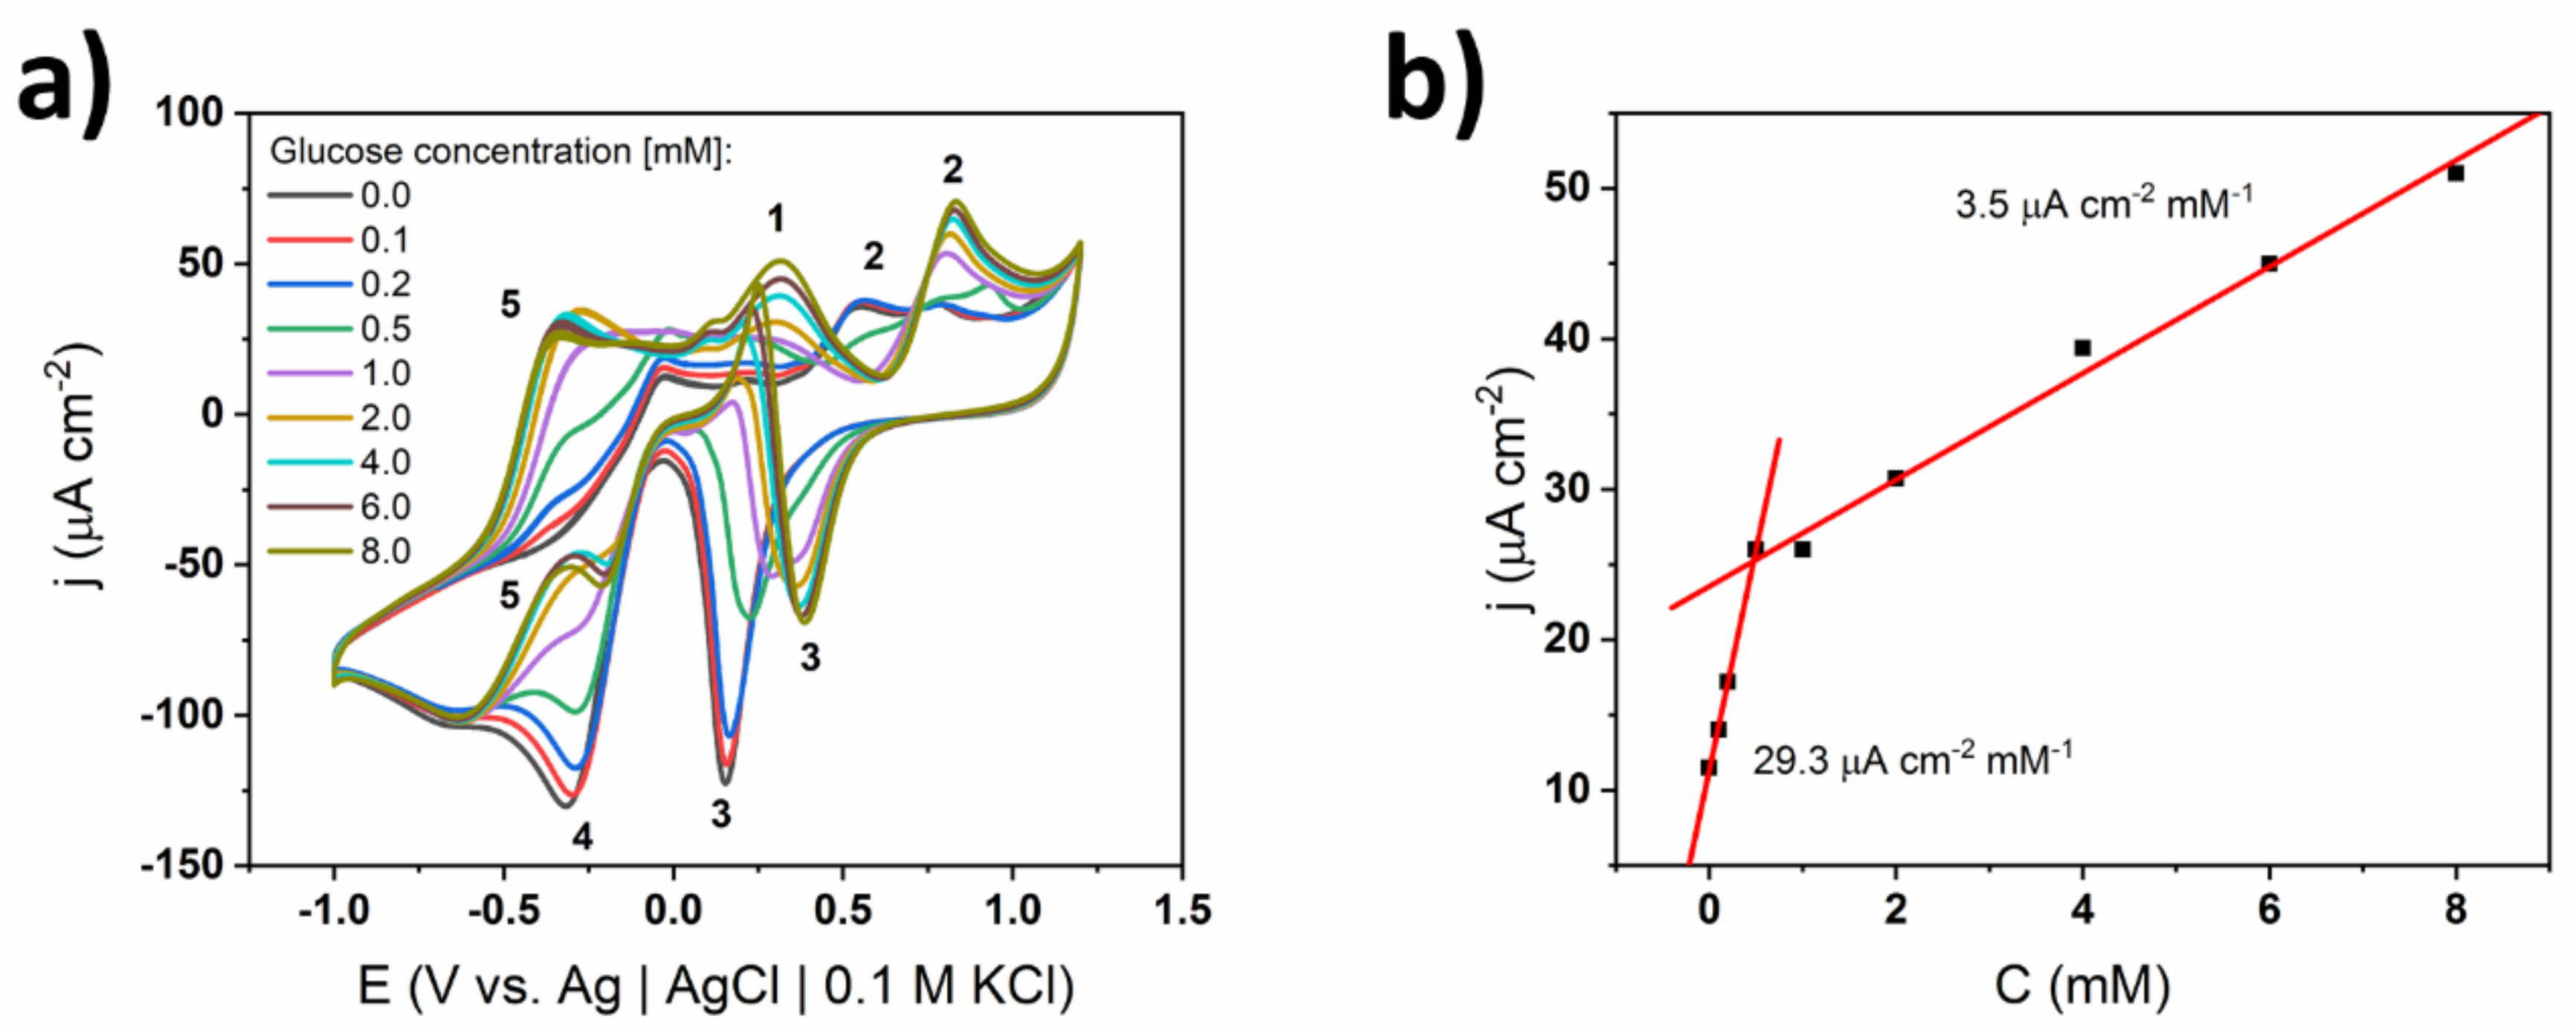
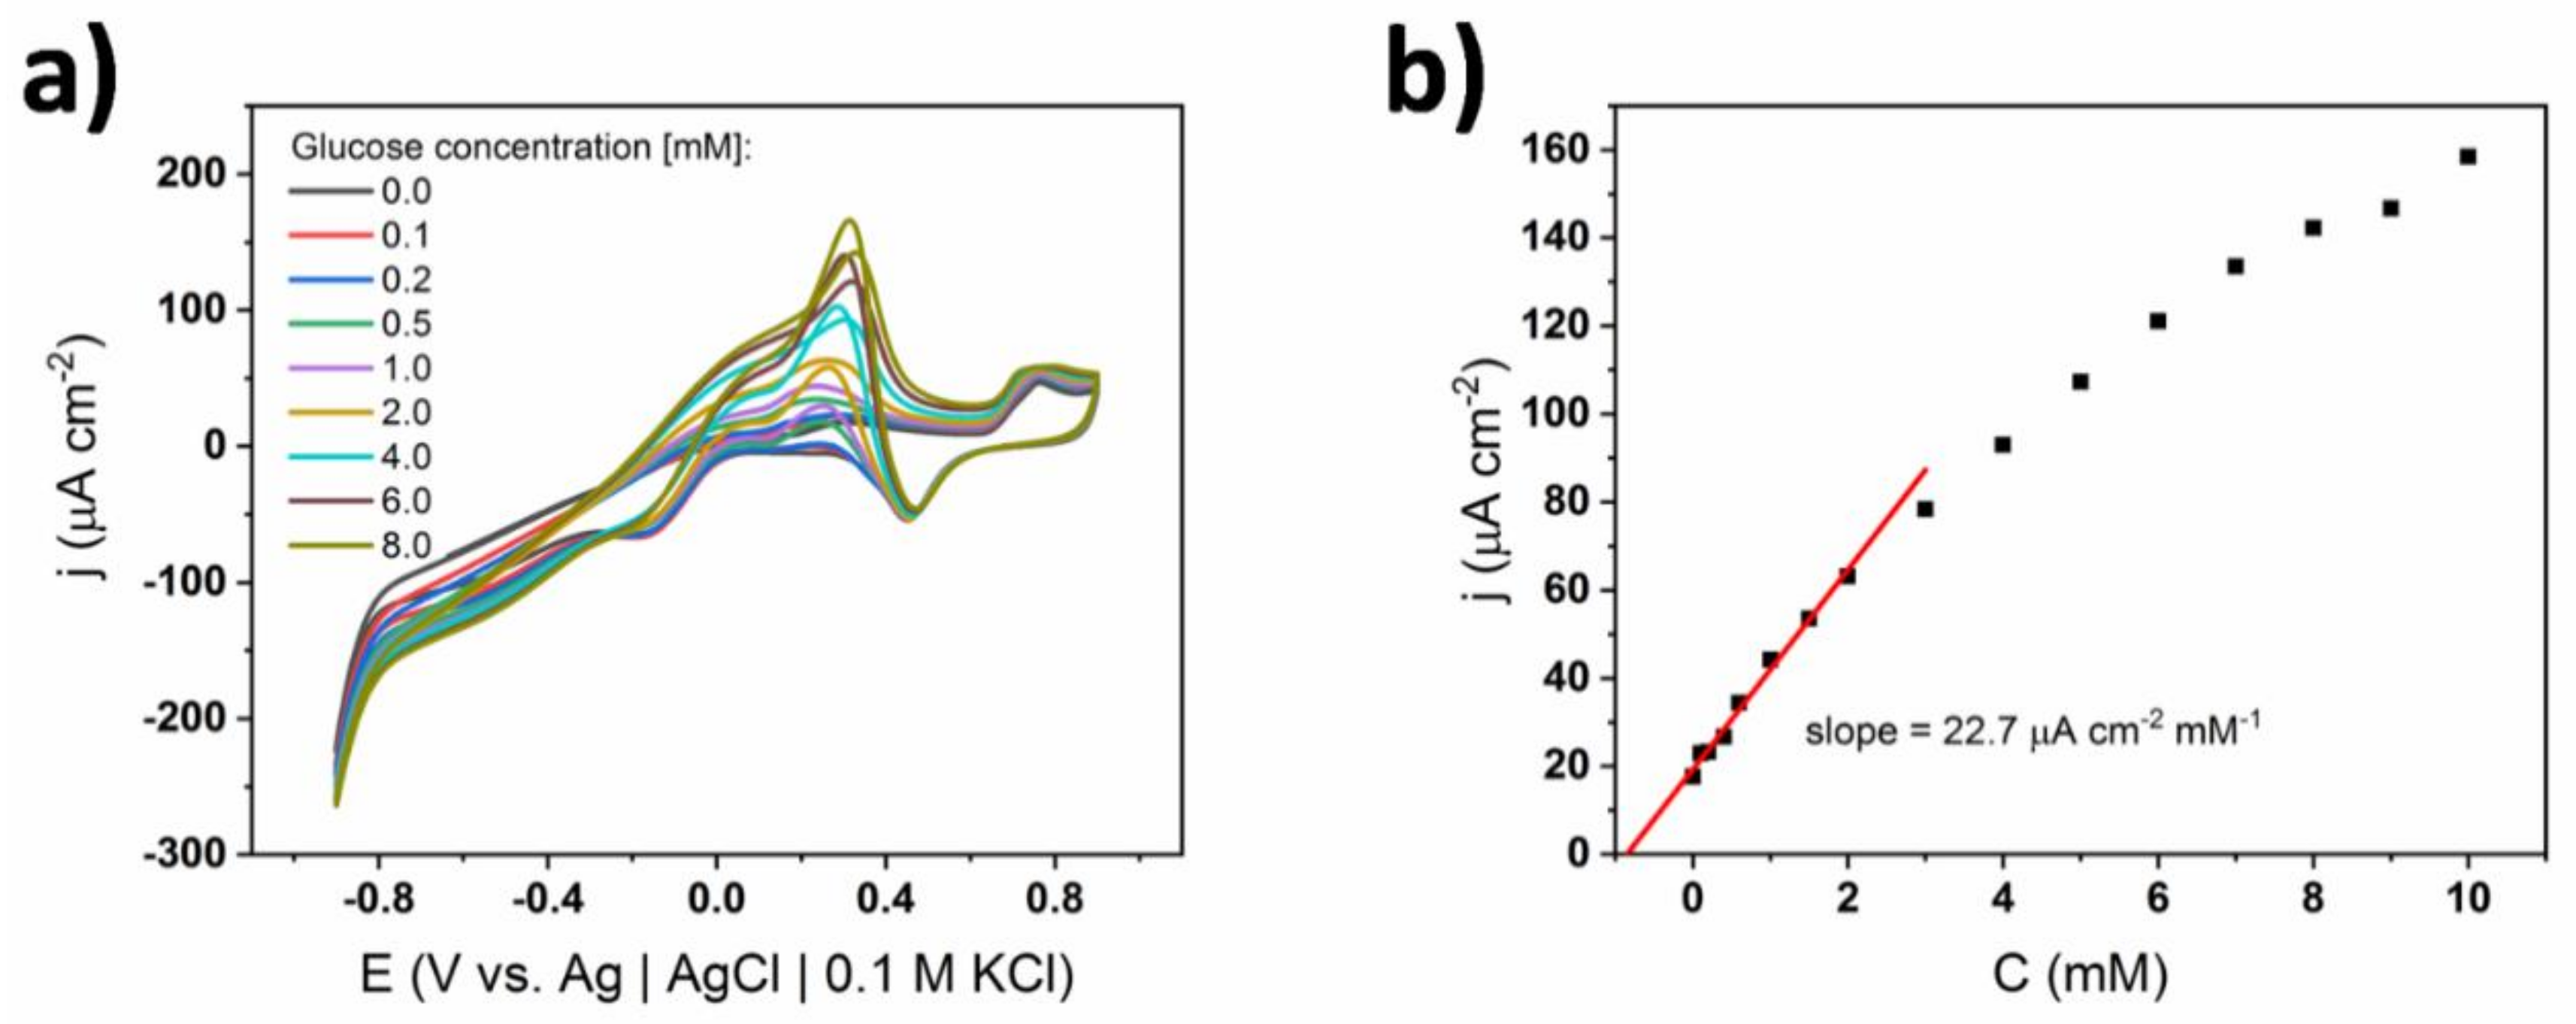
| Electrode | Solution | Slope [μA cm−2 mM−1] | Linear Range [mM] |
|---|---|---|---|
| TiND|AuNP | 0.1 X cPBS | 29.3 | 0.1–0.5 |
| 0.01 M sPBS | 22.7 | 0.1–2.0 | |
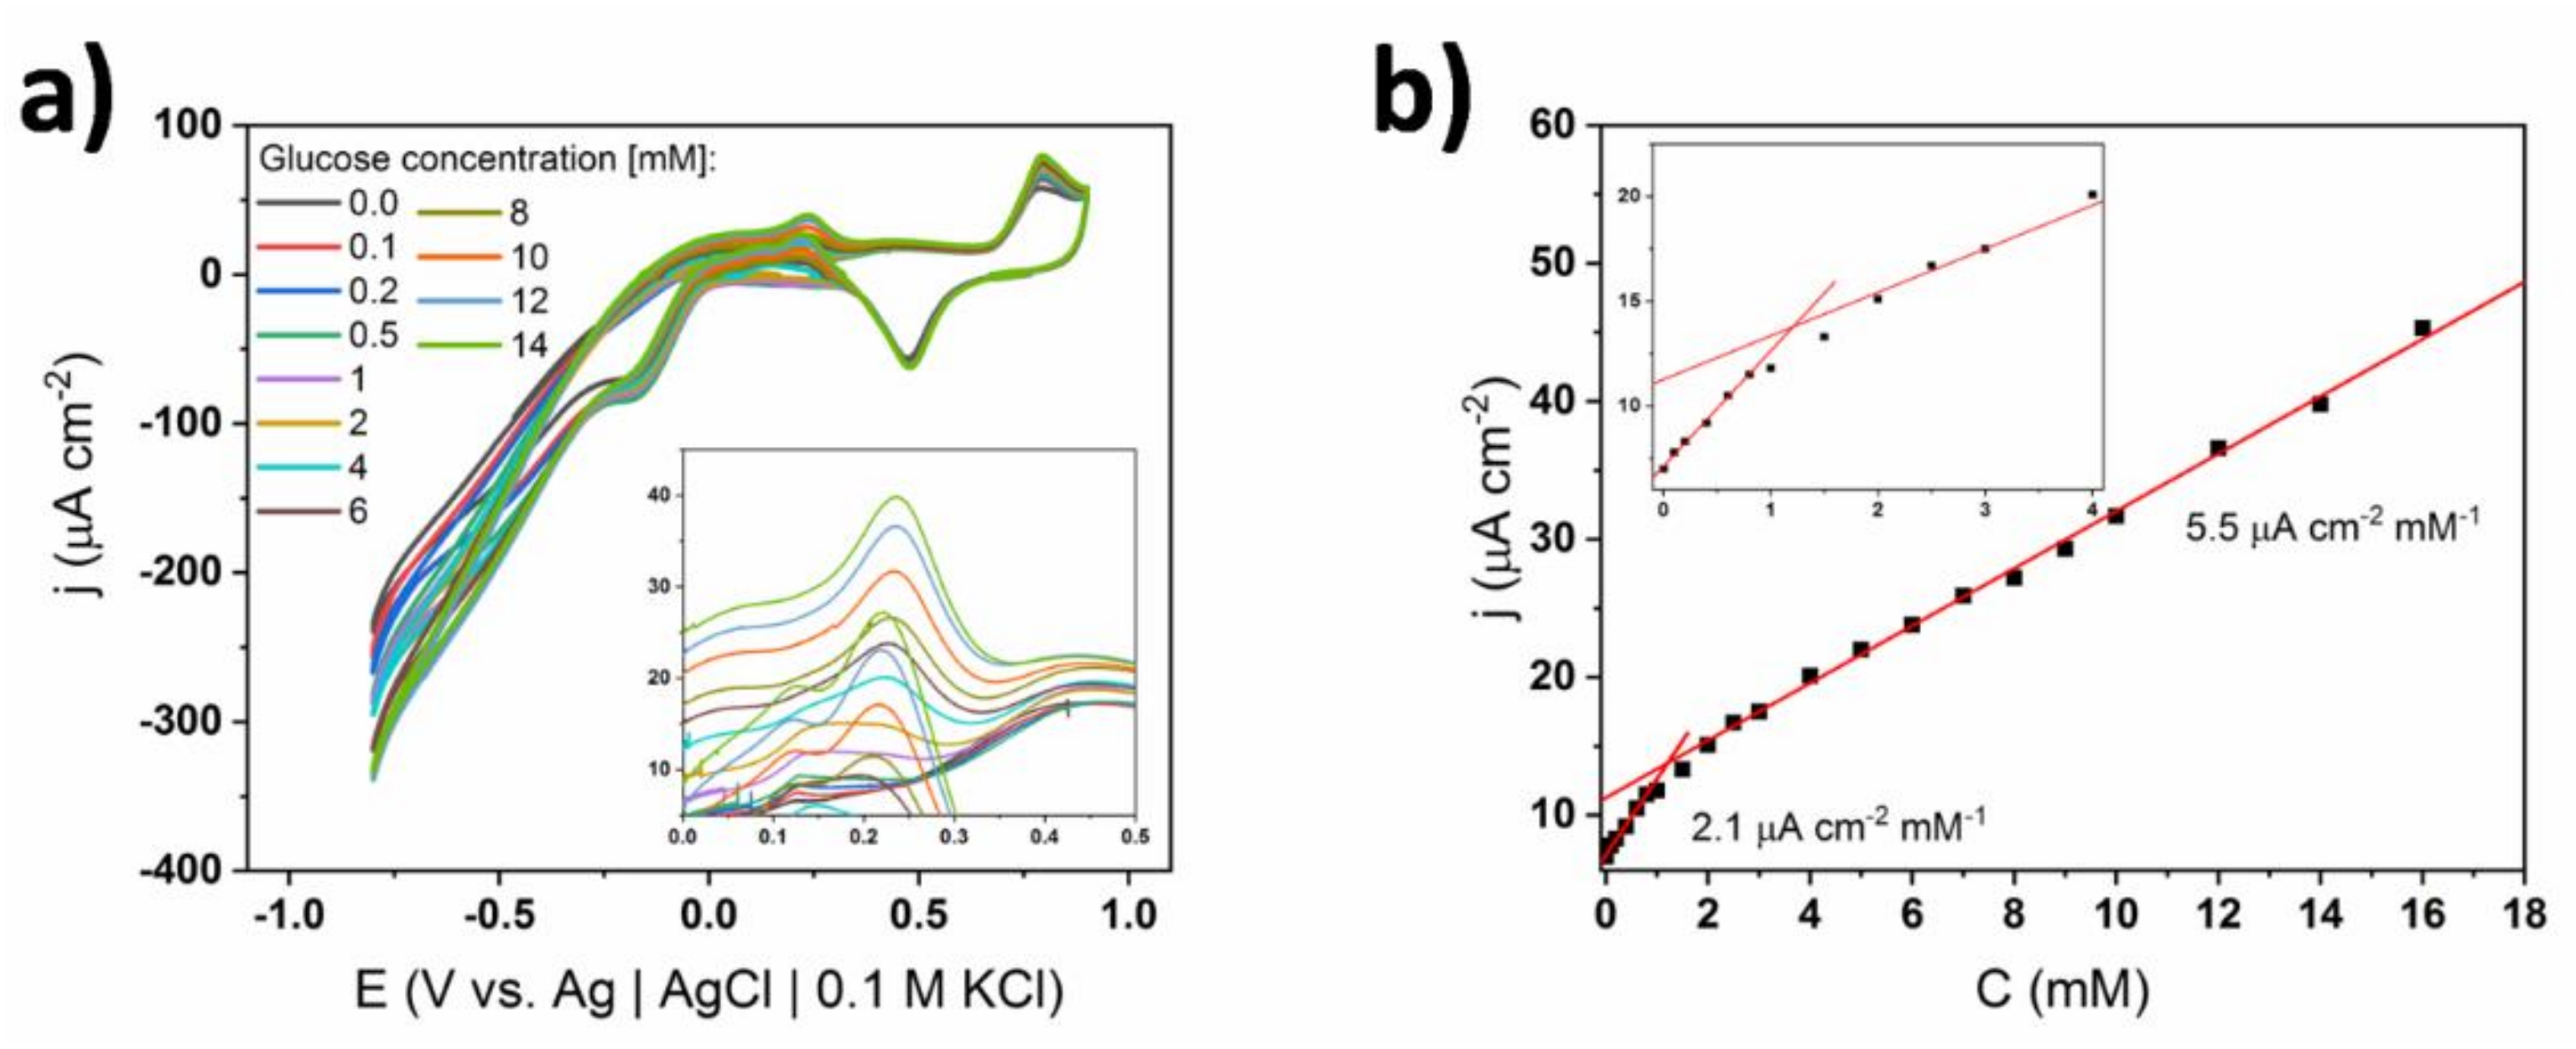
| 0.1 M sPBS | 5.5 | 0.1–0.8 | |
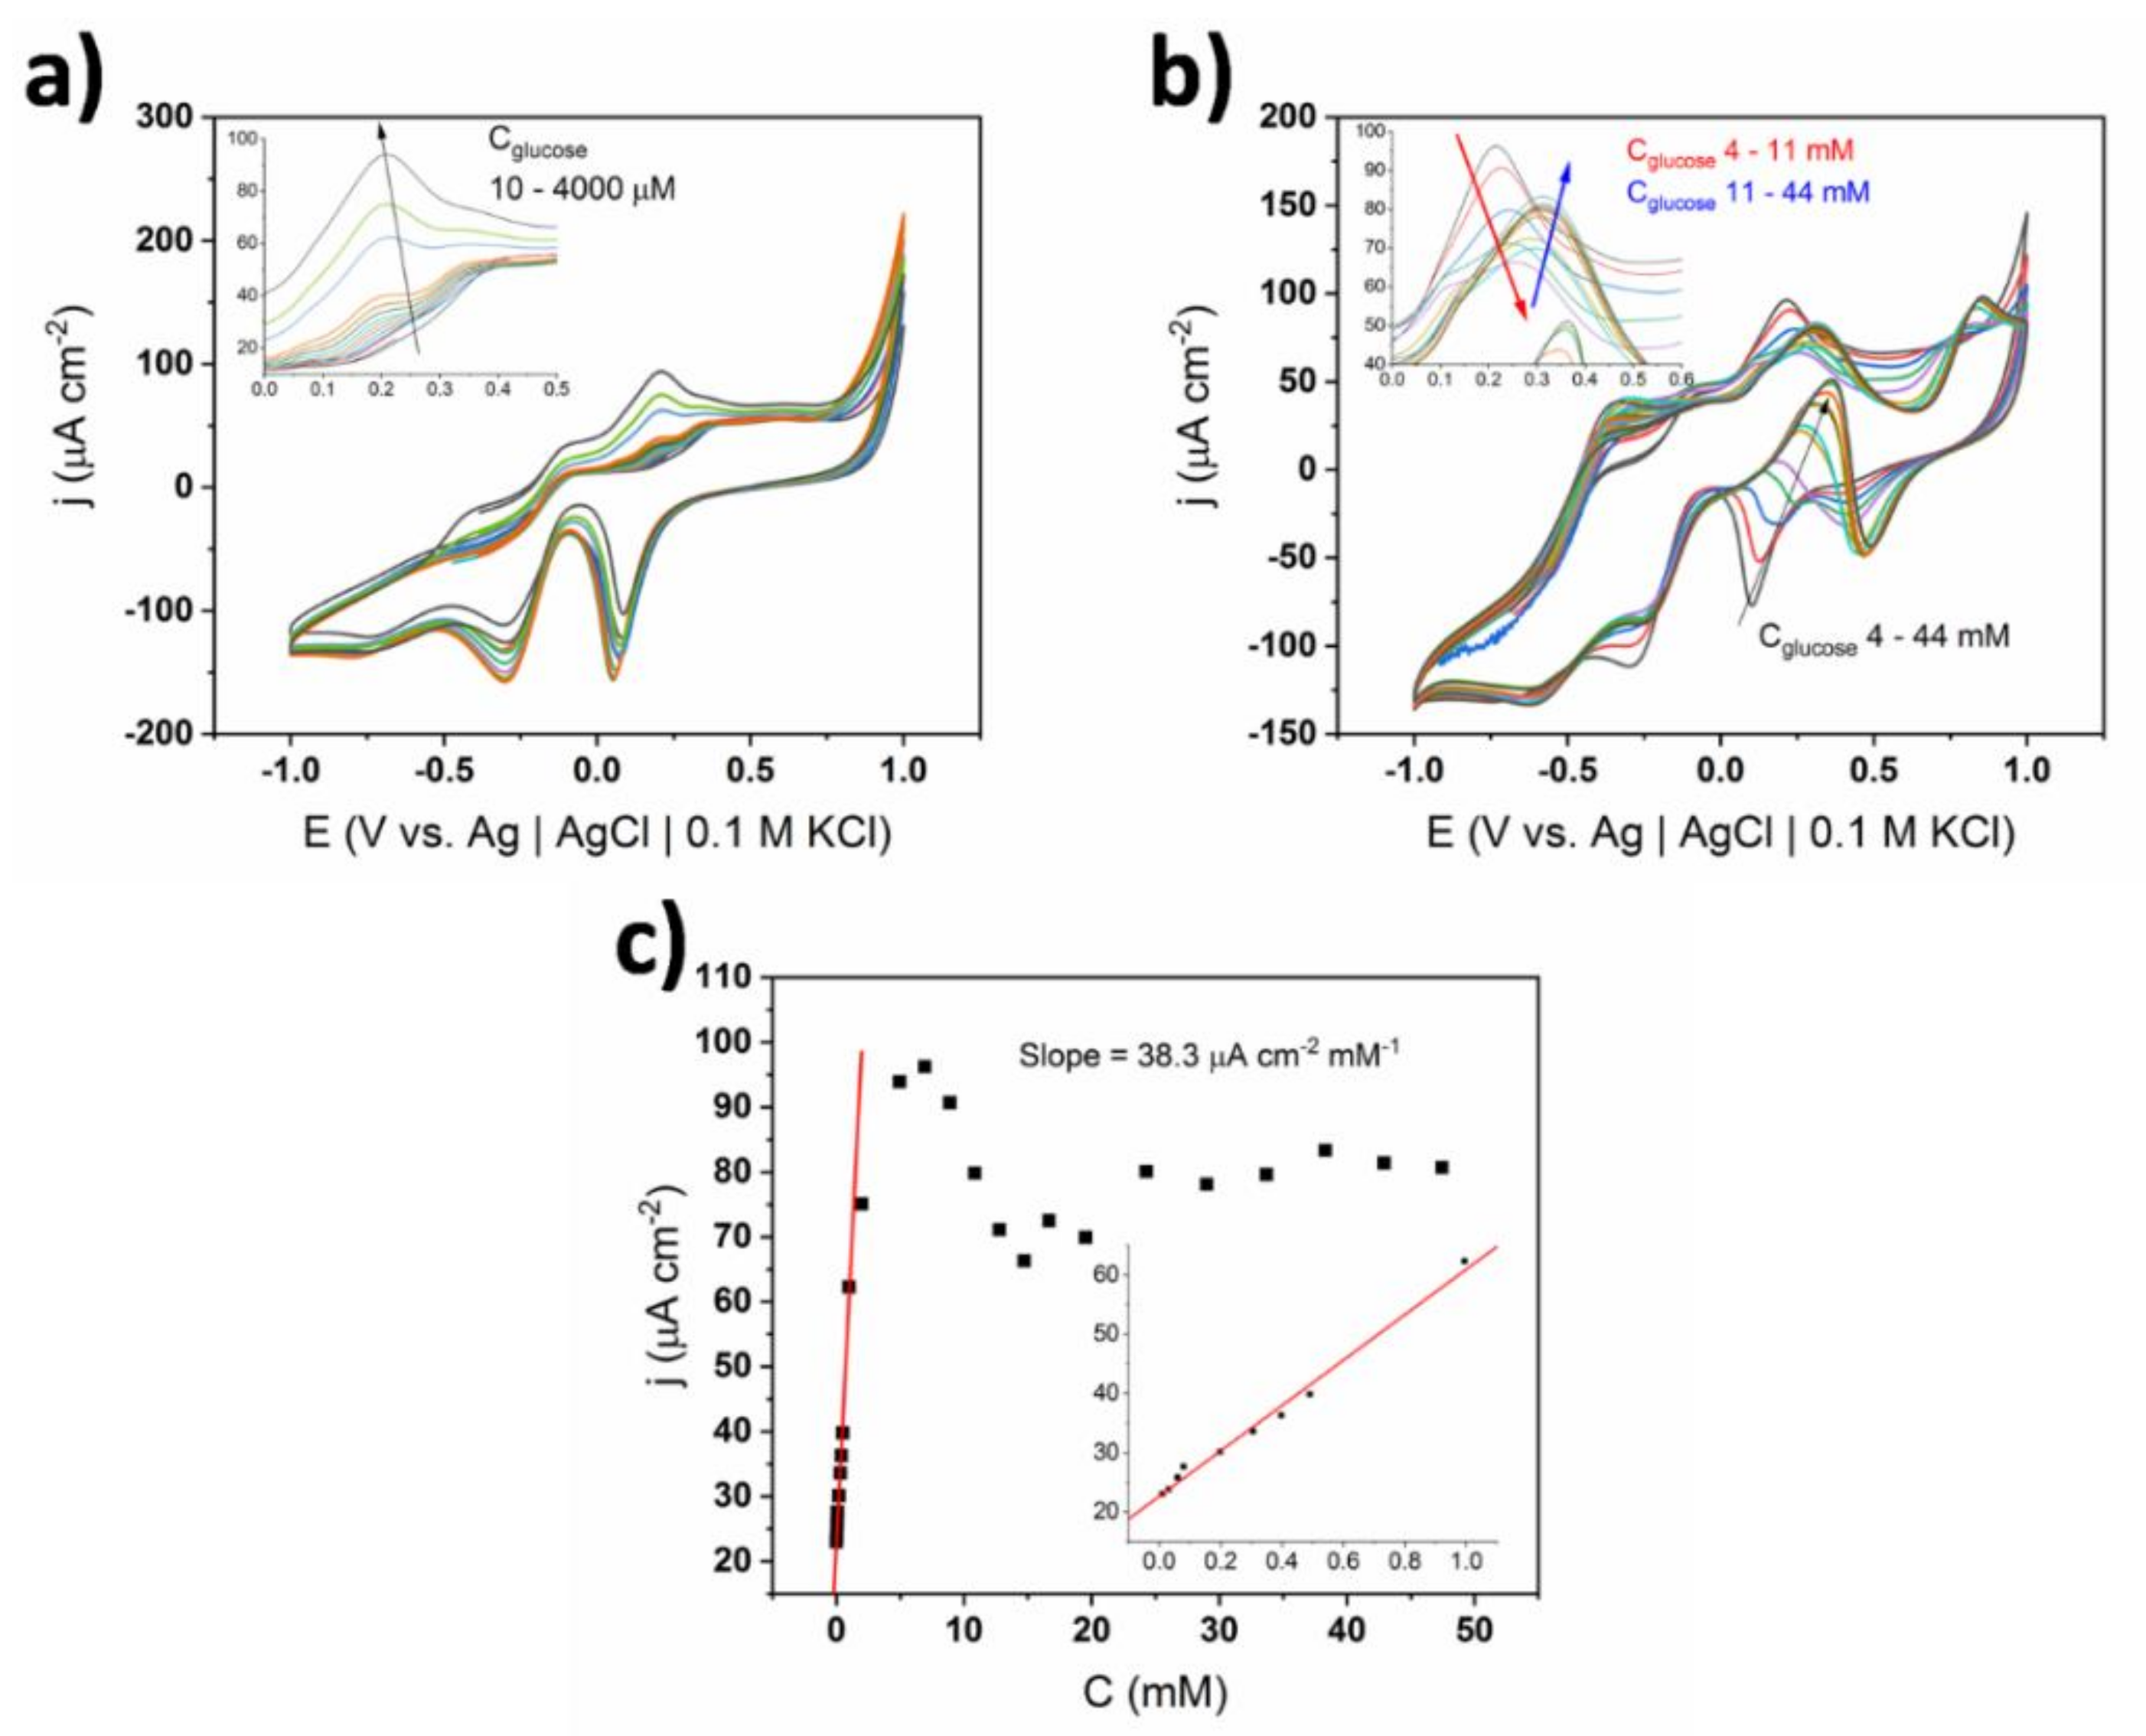
| TiND|AuNP|Nafion | 0.1 X cPBS | 38.3 | 0.1–1.0 |
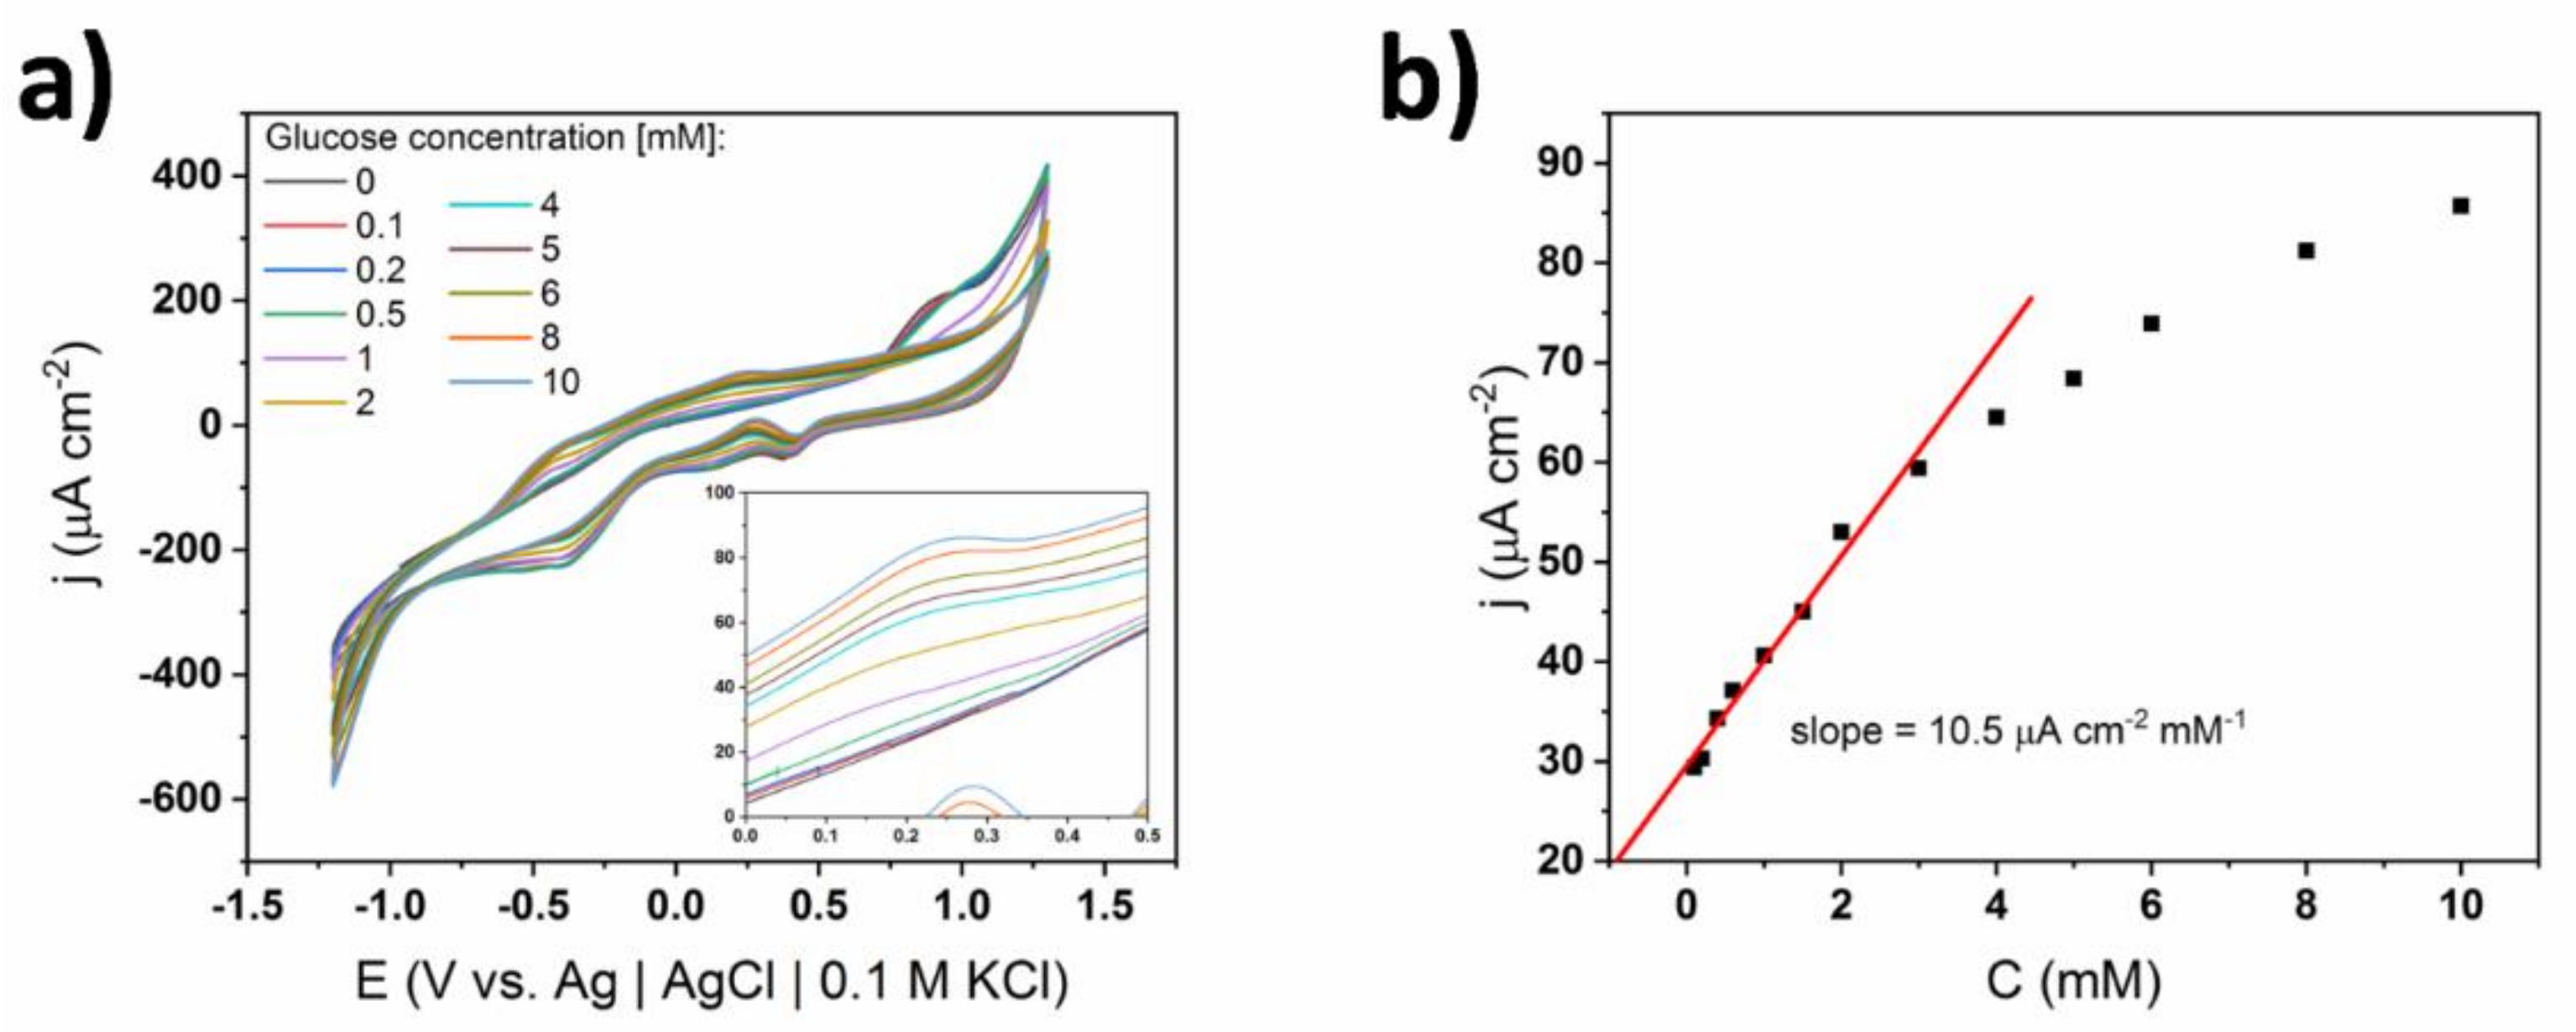
| 0.01 M sPBS | 10.5 | 0.1–3.0 | |
| 0.1 M sPBS | 13.3 | 0.1–5.0 |
© 2020 by the authors. Licensee MDPI, Basel, Switzerland. This article is an open access article distributed under the terms and conditions of the Creative Commons Attribution (CC BY) license (http://creativecommons.org/licenses/by/4.0/).
Share and Cite
Olejnik, A.; Karczewski, J.; Dołęga, A.; Siuzdak, K.; Grochowska, K. Insightful Analysis of Phenomena Arising at the Metal|Polymer Interphase of Au-Ti Based Non-Enzymatic Glucose Sensitive Electrodes Covered by Nafion. Coatings 2020, 10, 810. https://doi.org/10.3390/coatings10090810
Olejnik A, Karczewski J, Dołęga A, Siuzdak K, Grochowska K. Insightful Analysis of Phenomena Arising at the Metal|Polymer Interphase of Au-Ti Based Non-Enzymatic Glucose Sensitive Electrodes Covered by Nafion. Coatings. 2020; 10(9):810. https://doi.org/10.3390/coatings10090810
Chicago/Turabian StyleOlejnik, Adrian, Jakub Karczewski, Anna Dołęga, Katarzyna Siuzdak, and Katarzyna Grochowska. 2020. "Insightful Analysis of Phenomena Arising at the Metal|Polymer Interphase of Au-Ti Based Non-Enzymatic Glucose Sensitive Electrodes Covered by Nafion" Coatings 10, no. 9: 810. https://doi.org/10.3390/coatings10090810
APA StyleOlejnik, A., Karczewski, J., Dołęga, A., Siuzdak, K., & Grochowska, K. (2020). Insightful Analysis of Phenomena Arising at the Metal|Polymer Interphase of Au-Ti Based Non-Enzymatic Glucose Sensitive Electrodes Covered by Nafion. Coatings, 10(9), 810. https://doi.org/10.3390/coatings10090810