Article

An Optical Fiber Fabry–Perot Pressure Sensor with Optimized Thin Microbubble Film Shaping for Sensitivity Enhancement

1
State Key Laboratory of Marine Resource Utilization in South China Sea, Hainan University, Haikou 570228, China
2
Collage of Information and Communication engineering, Hainan University, Haikou 570228, China
3
State Key Laboratory of Electronic Thin Films and Integrated Devices, School of Optoelectronic Science and Engineering, University of Electronic Science and Technology of China (UESTC), Chengdu 610054, China
4
Institute of Laser Engineering, Beijing University of Technology, Beijing 100022, China
5
College of electrical and control engineering, Xi’an University of Science and Technology, Xi’an 710054, China
*
Authors to whom correspondence should be addressed.
Coatings 2020, 10(4), 358; https://doi.org/10.3390/coatings10040358
Submission received: 17 February 2020 / Revised: 30 March 2020 / Accepted: 3 April 2020 / Published: 5 April 2020
(This article belongs to the Special Issue Electrochromic Thin Films and Devices)

Abstract

:
A pressure-assisted arc discharge method of preparing silicon microbubbles with a glass tube was utilized for decreasing the bubble film’s thickness and improving the bubble’s uniformity. By controlling the arc discharge intensity, discharge time and the position of the fiber carefully, the thickness of the microbubble film was reduced to the micrometer scale. Later, the thin film of the microbubble was transferred to the end the single-mode-fiber/glass-tube structure, for forming the FP (Fabry–Perot) interference cavity. As the thin film is sensitive to the outer pressure, such a configuration could be used for a high-sensitive-pressure measurement. Experimental results show that the sensitivity of this FP (Fabry–Perot) cavity was 6790 pm/MPa when the outer pressure ranges from 100 to 1600 kPa, and the relationship between the structural parameters of the thin film and the outer pressure was theoretically analyzed. Moreover, this special structure made of the end silicon film microbubble is more suitable for high-sensitivity applications.

1. Introduction

The Fabry–Perot interferometer (FPI) has the advantages of small size and high sensitivity, and it plays an important role in pressure sensing [1,2,3,4]. The basic principle of the fiber optic fiber sensor is multi-beam interference; since the invention of multi-beam interferometer, many kinds of Fabry–Perot (FP) sensors have been gradually developed. Until now, a variety of micro-optical fiber FP sensors have emerged, among which micro-optical fiber pressure sensors which can be used in aviation, oil fields and other pressure measurement fields have received high attention.
In recent years, interferometric pressure-sensing based on air micro-cavity in fiber is one of the research hotspots. Before that, there were researchers who reported an open micro-cavity at the end of a single-mode optical fiber fusion silicon tube for pressure sensing. The cavity can be compressed by ambient pressure, obtaining a sensitivity greater than 1000 nm/kPa. This is at least an order of magnitude higher than currently reported diaphragm-based fiber optic probe sensors. However, during the measurement, one of the reflecting surfaces in the FP chamber was formed by a liquid, and the difficulty in implementing encapsulation techniques has limited the use of structures in most environments. Therefore, most of the research focuses on the closed FP micro-cavity for pressure sensing. In a closed-cavity structure, the length of the FP cavity varies with the change of pressure [5,6,7,8]. For example, FPI based on a glass tube has a pressure sensitivity of 23.4 pm/MPa [3]. The pressure sensitivity of FPI based on fiber optic microbubbles is 315 pm/MPa [7]. An effective way to improve the pressure sensitivity was to reduce the thickness of the FP cavity wall or diagram, and ultra-high-pressure sensitivity can be up to 39.4 and 70.5 nm/kPa [9]. However, the measuring range of the device is limited, the film attached to the end of the fiber is easy to crack, and the mechanical strength is weak. In 2014, Liao et al. used expansion arc discharge technology to form a bubble micro-cavity with a film thickness of 500 nm on the end face of the fiber and used it for pressure sensing [5]. The mechanical strength was increased due to its spherical structure and submicron film thickness, thus enabling pressure detection with a sensitivity of 1036 pm/MPa in high-pressure environments. However, the sensitivity of the sensor was greatly affected, since the reflective surface of FP cavity of the structure is an uneven spherical microbubble membrane. In 2015, an FPI structure for gas pressure sensing was reported that consists of two fused capillary tubes with different inner diameters. The sensitivity is 4147 pm/MPa in the pressure range of 0~1.52 MPa [10]. In addition, nuclear offset fusion splicing technology was used in the manufacturing process, to reduce the fringe angle, so that the detection limit of sensor parts was lowered to 4.81 kPa.
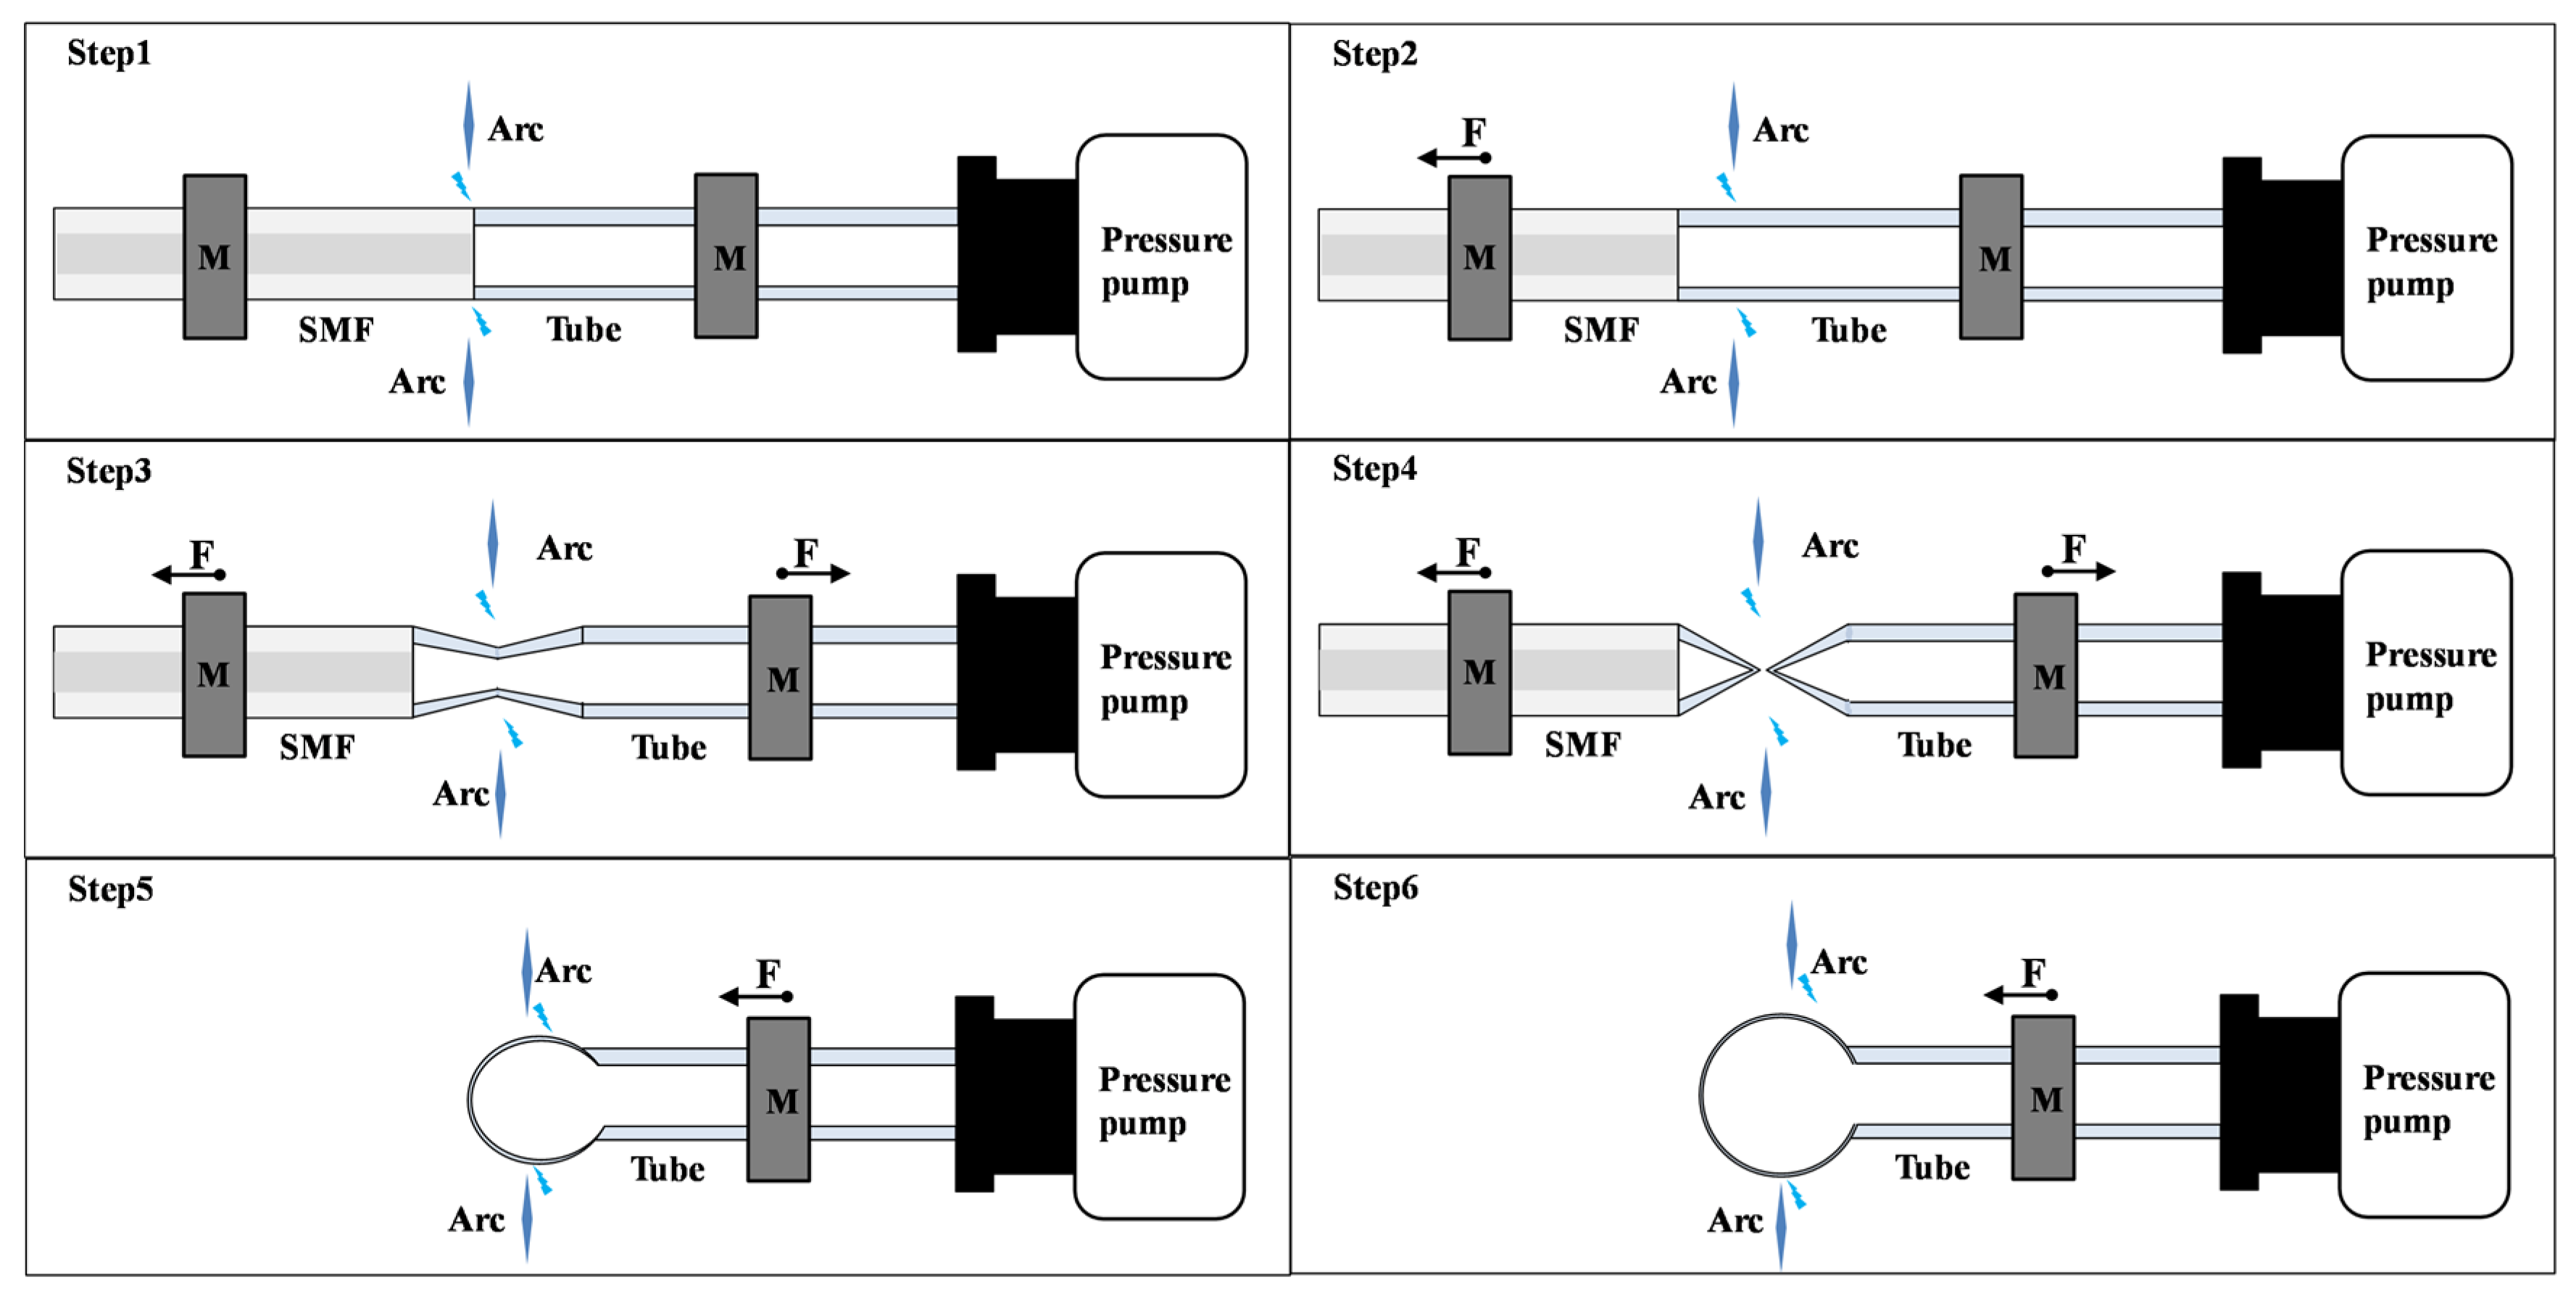
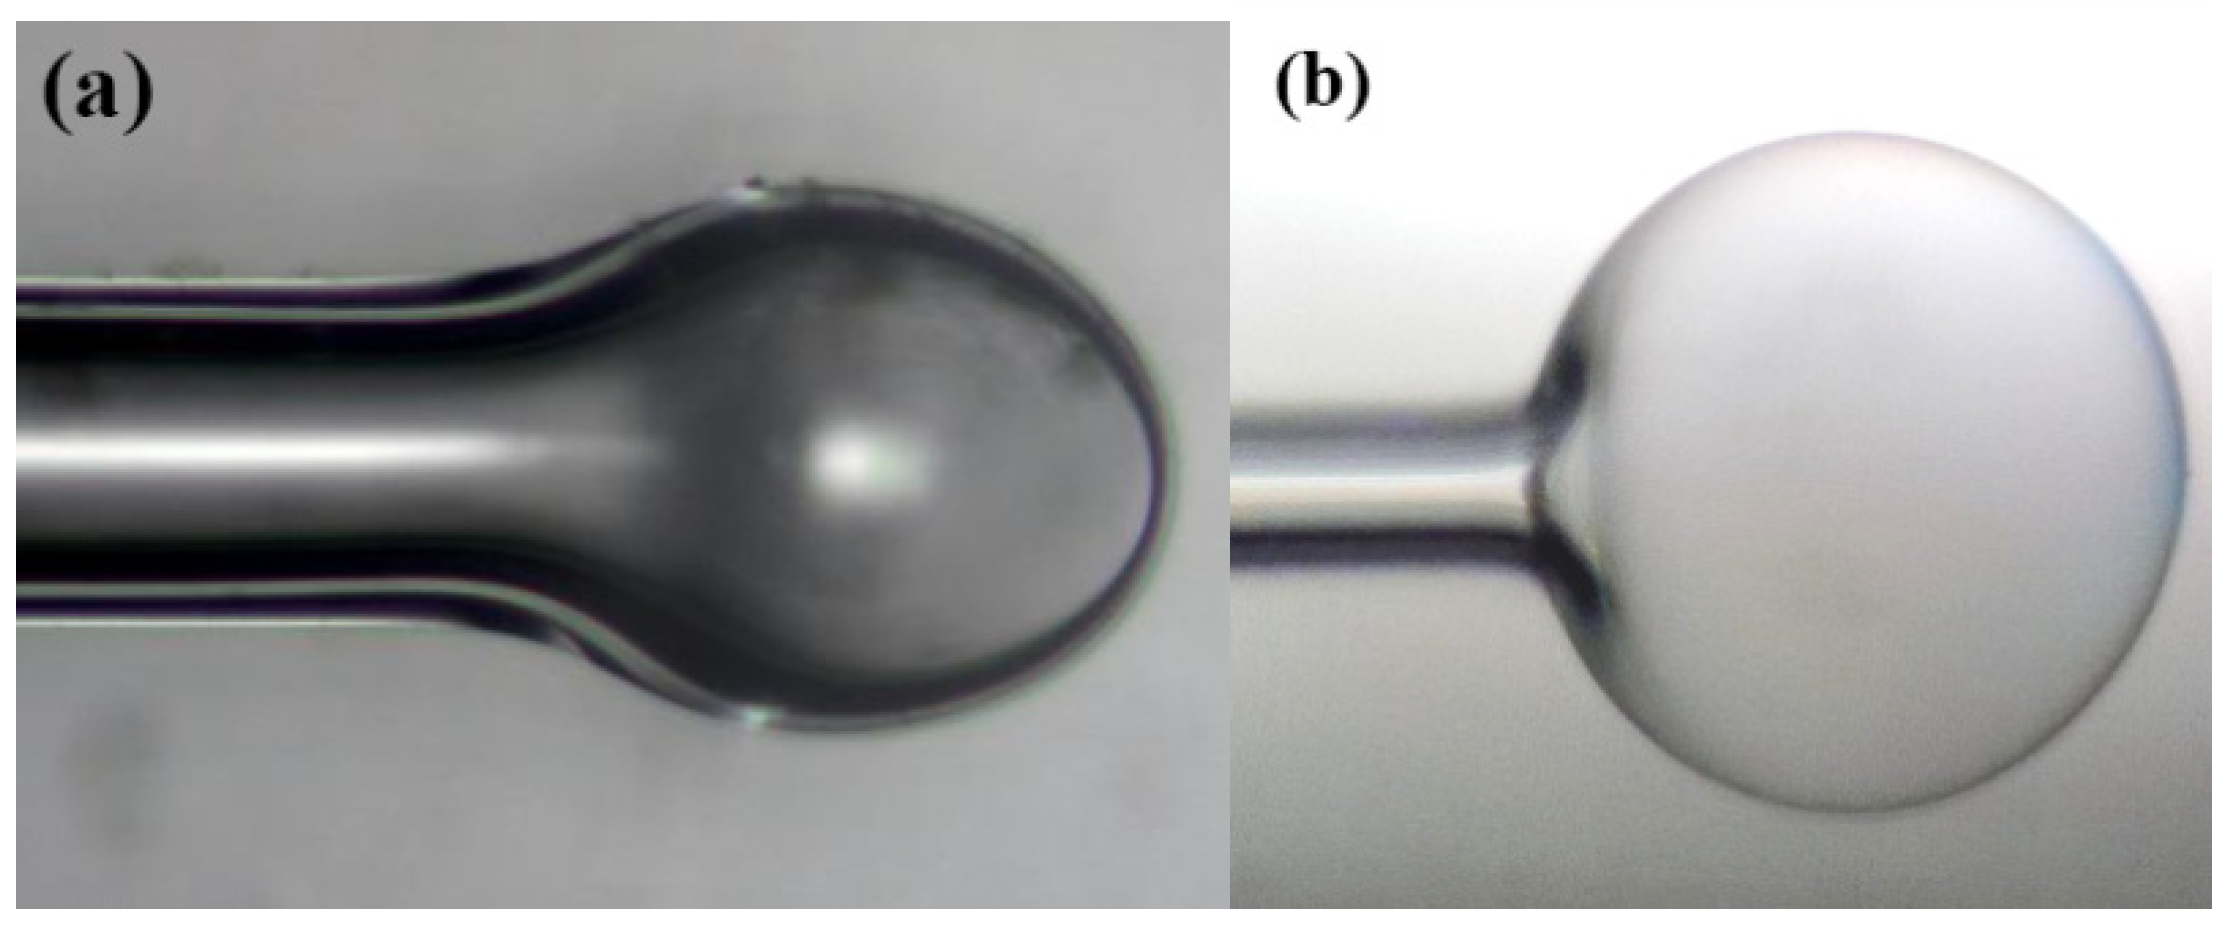
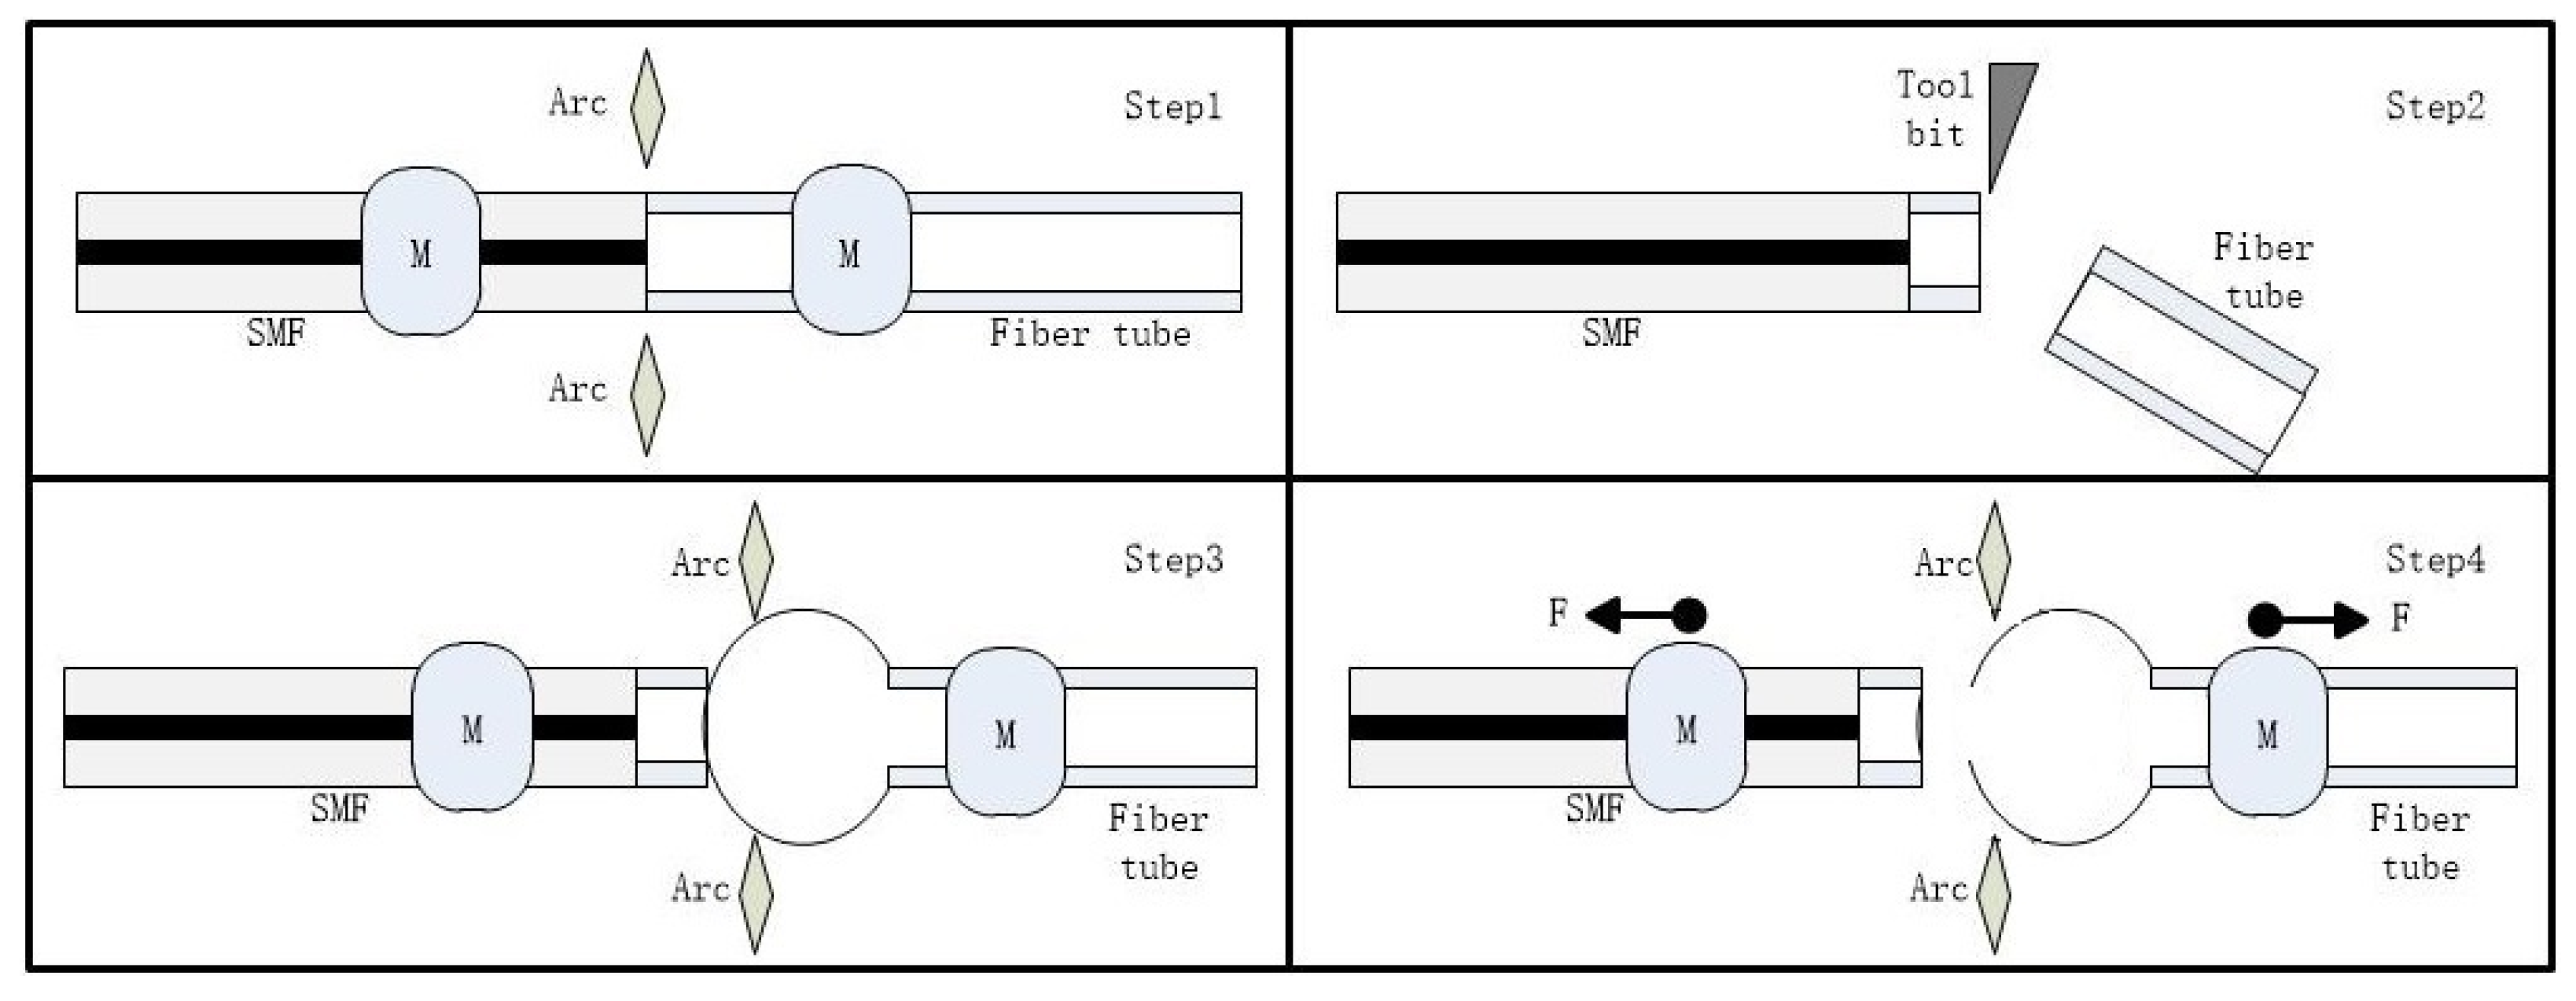
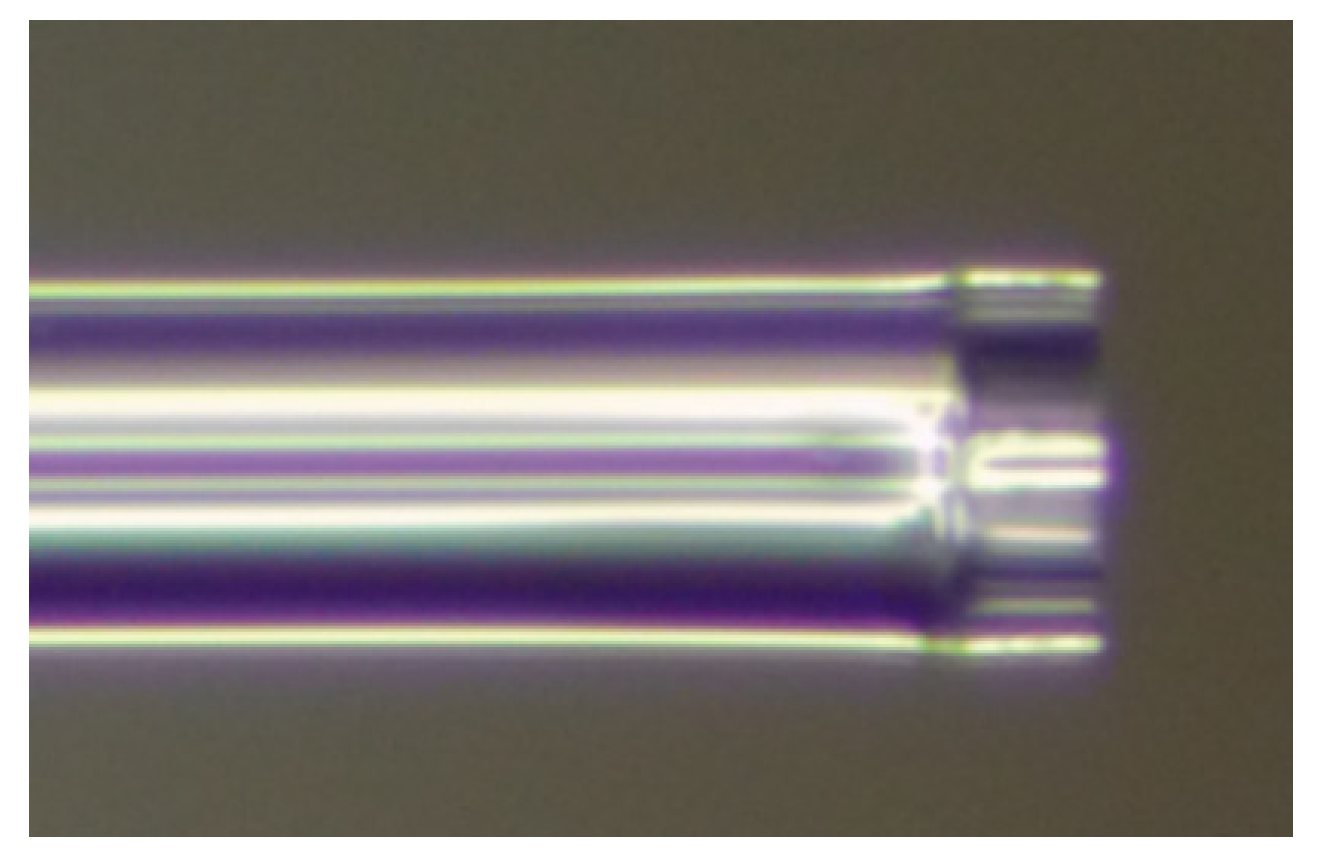
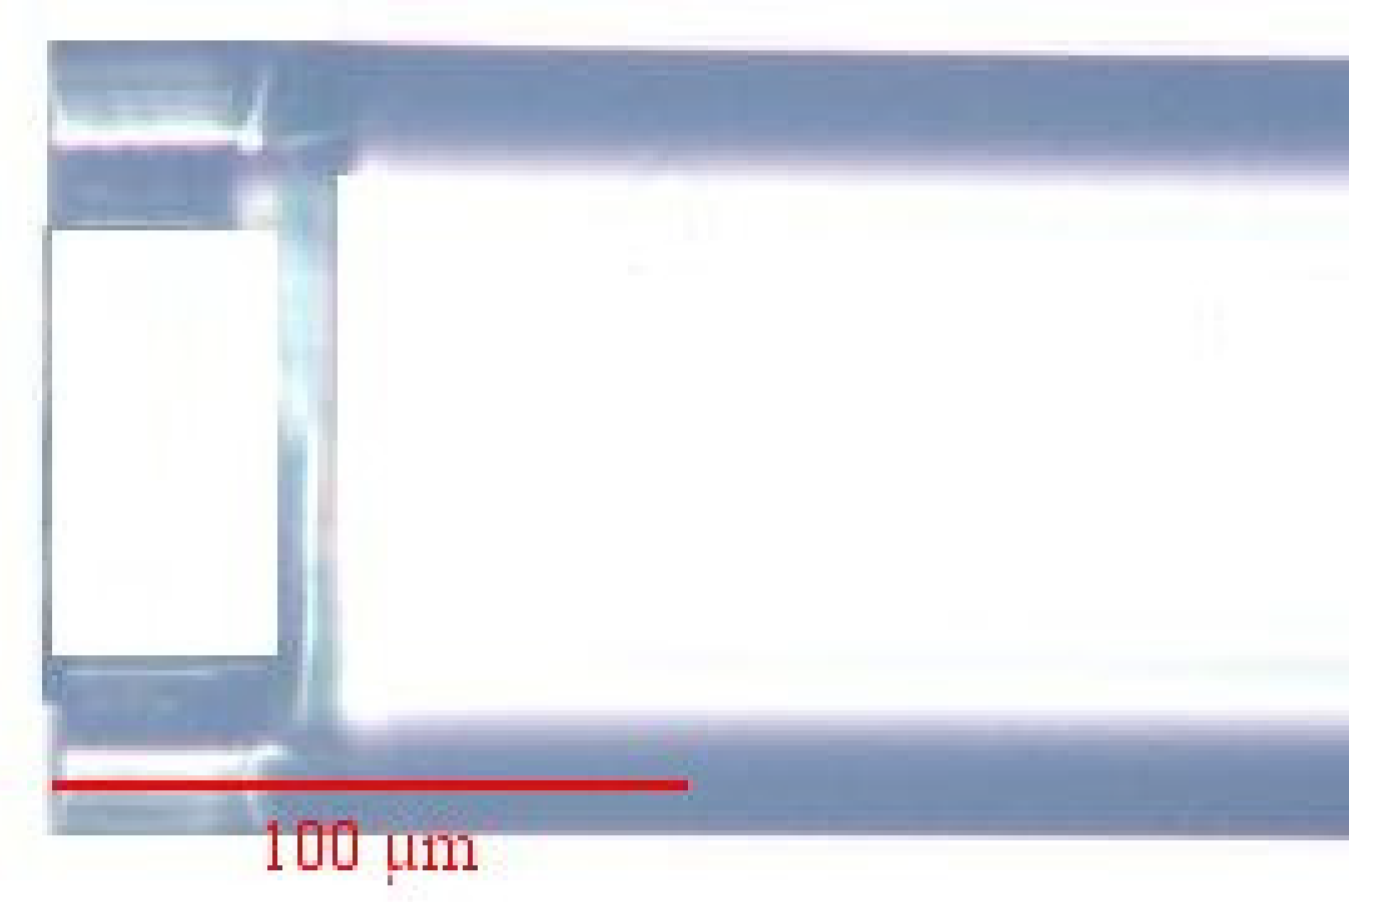
In this study, we used the optimized arc discharge technology to prepare the end-face bubble micro-cavity and prepare the fiber end-face uniform microbubble cavity with a thickness of micrometer scale. Furthermore, the end-face film of the bubble micro-cavity was transferred to the end face of the glass tube, to form the fiber FPI and apply to the field of pressure sensing. Due to the high uniformity of the silicon microbubble cavity prepared by this method, the thickness of the whole film layer can be considered to be the same under certain conditions, which can reduce unnecessary interference in the process of interference with high measurement sensitivity. More importantly, the special stable structure and high temperature stability of the end face bubble micro-cavity make it more suitable for high-pressure applications. The relationship between the structural parameters and the pressure response of thin films is theoretically and experimentally demonstrated.

2. Preparation of Microbubbles and Pressure-Detection Structure

2.1. Fabrication of Microbubble

Microbubble can be divided into double-ended and single-ended structures. At present, hollow microbubbles are mainly obtained by electric arc or CO2 laser discharging or melting hollow glass tubes filled with air pressure. For the double-end structure, Berneschi et al. prepared microbubble structure whispering gallery mode micro-cavity in the middle of a glass tube, using arc discharge technology, and the thickness of the microbubble wall was about 4 microns [11]. In order to improve the symmetry of the microbubbles, Berneschi improved the uniformity of the film layers in the different maximum diameter areas of the microbubbles, by rotating the discharge method, and the quality factor of the microbubbles reached 6 × 10⁷. Yang proposed a two-beam CO2 laser irradiation method to improve the symmetry of microbubbles [12]. The thickness of the prepared microbubbles was reduced to 507.1 nm. The quality factor is 107. For single-ended microbubbles, it is more likely to achieve better results in terms of microbubble thickness, quality factor and dispersion control. However, due to current technical limits, its potential remains to be tapped. Watkins et al. used CO2 laser discharge technology to prepare single-ended microbubbles with a thickness between 4 and 8 microns, at the end of hollow glass tubes [13]. The quality factor of microbubbles is on the order of 105. However, the microbubbles prepared by this method have poor symmetry and uniformity, which restrict the quality factor characteristics of such microbubbles.
The main fabrication process of the microbubble is depicted in Figure 1. The silica hollow core tube used here has a 125 μm diameter, 75 μm inner diameter. The plastic coating of the tube was removed before fusion. An optical fiber fusion splicer (61s, Fujikura, Tokyo, Japan) was adopted to generate the arc discharge. A pressure pump (Kangsite Instrument ConST162, ConST, Beijing, China) was used to produce high-pressure air in the hollow core of the silica tube, as shown in Figure 1. First, one end of the hollow core tube was connected to the pressure pump. The other end was fused with a single-mode fiber. Second, an about 120 kPa atmospheric pressure was delivered from the pressure pump to the tube. Meanwhile, the other end of tube was melted with a discharging time of 300 ms and a discharging intensity of -5 bits. Under a certain tension, two triangular tips were formed. Third, we moved the triangle and re-discharged several times, again, under the condition of filling the tube with high-pressure air. A microbubble with a relatively thick wall was generated at the end of the silica tube. Finally, the position of microbubble was slightly moved to the heating region, and then it was discharged, again, under the condition of filling the tube with high-pressure air. After being discharged a few times, the microbubble experienced more expansion and possessed a uniform feature at the same time [14,15].
In the above method, two microbubbles of different structures were made. Figure 2a is a picture of the egg-shaped microbubble with the thinnest end. As shown in Figure 2a, the spherical microbubble has the characteristics of good thinness, evenness and symmetry.

2.2. Preparation of Pressure-Detection Structure

A diaphragm fiber optic sensor is a kind of sensor based on the Fabry–Perot interferometer structure. Due to the advantages of high sensitivity and high-frequency response, the sensor is widely used in the measurement of pressure, acoustic wave and other physical parameters.
In this paper, we describe the fabrication technology of a silicon diaphragm miniature fiber FP (Fabry–Perot) cavity sensor. As shown in Figure 3, the FP (Fabry–Perot) interference cavity is directly made at the end of the single-mode fiber, through the method of welding, cutting, welding and fusing, and pressure demodulation is realized by accurately measuring the peak spectral movement due to diaphragm deformation under the action of external pressure.
First, we fused the single-mode fiber and fiber glass tube and reserved the fiber glass tube by cutting 50 μm at the end of the fiber, on the precision-cutting platform, as shown in Figure 4. After that, the microbubble cavity prepared above was fused with the glass tube at the end of the above structure, so that the uniform film at the end of the microbubble cavity was completely transferred to the glass tube.
Finally, the discharge intensity, discharge time and tension were reasonably controlled, to separate the membrane from the microbubble cavity. As shown in Figure 5, we have thus achieved the transfer of the thin film with good thinness and evenness from the microbubble cavity to the end of the fiber optic glass tube, where an FP micro-cavity is formed.

3. Sensor Structure Principle Analysis and Model Simulation

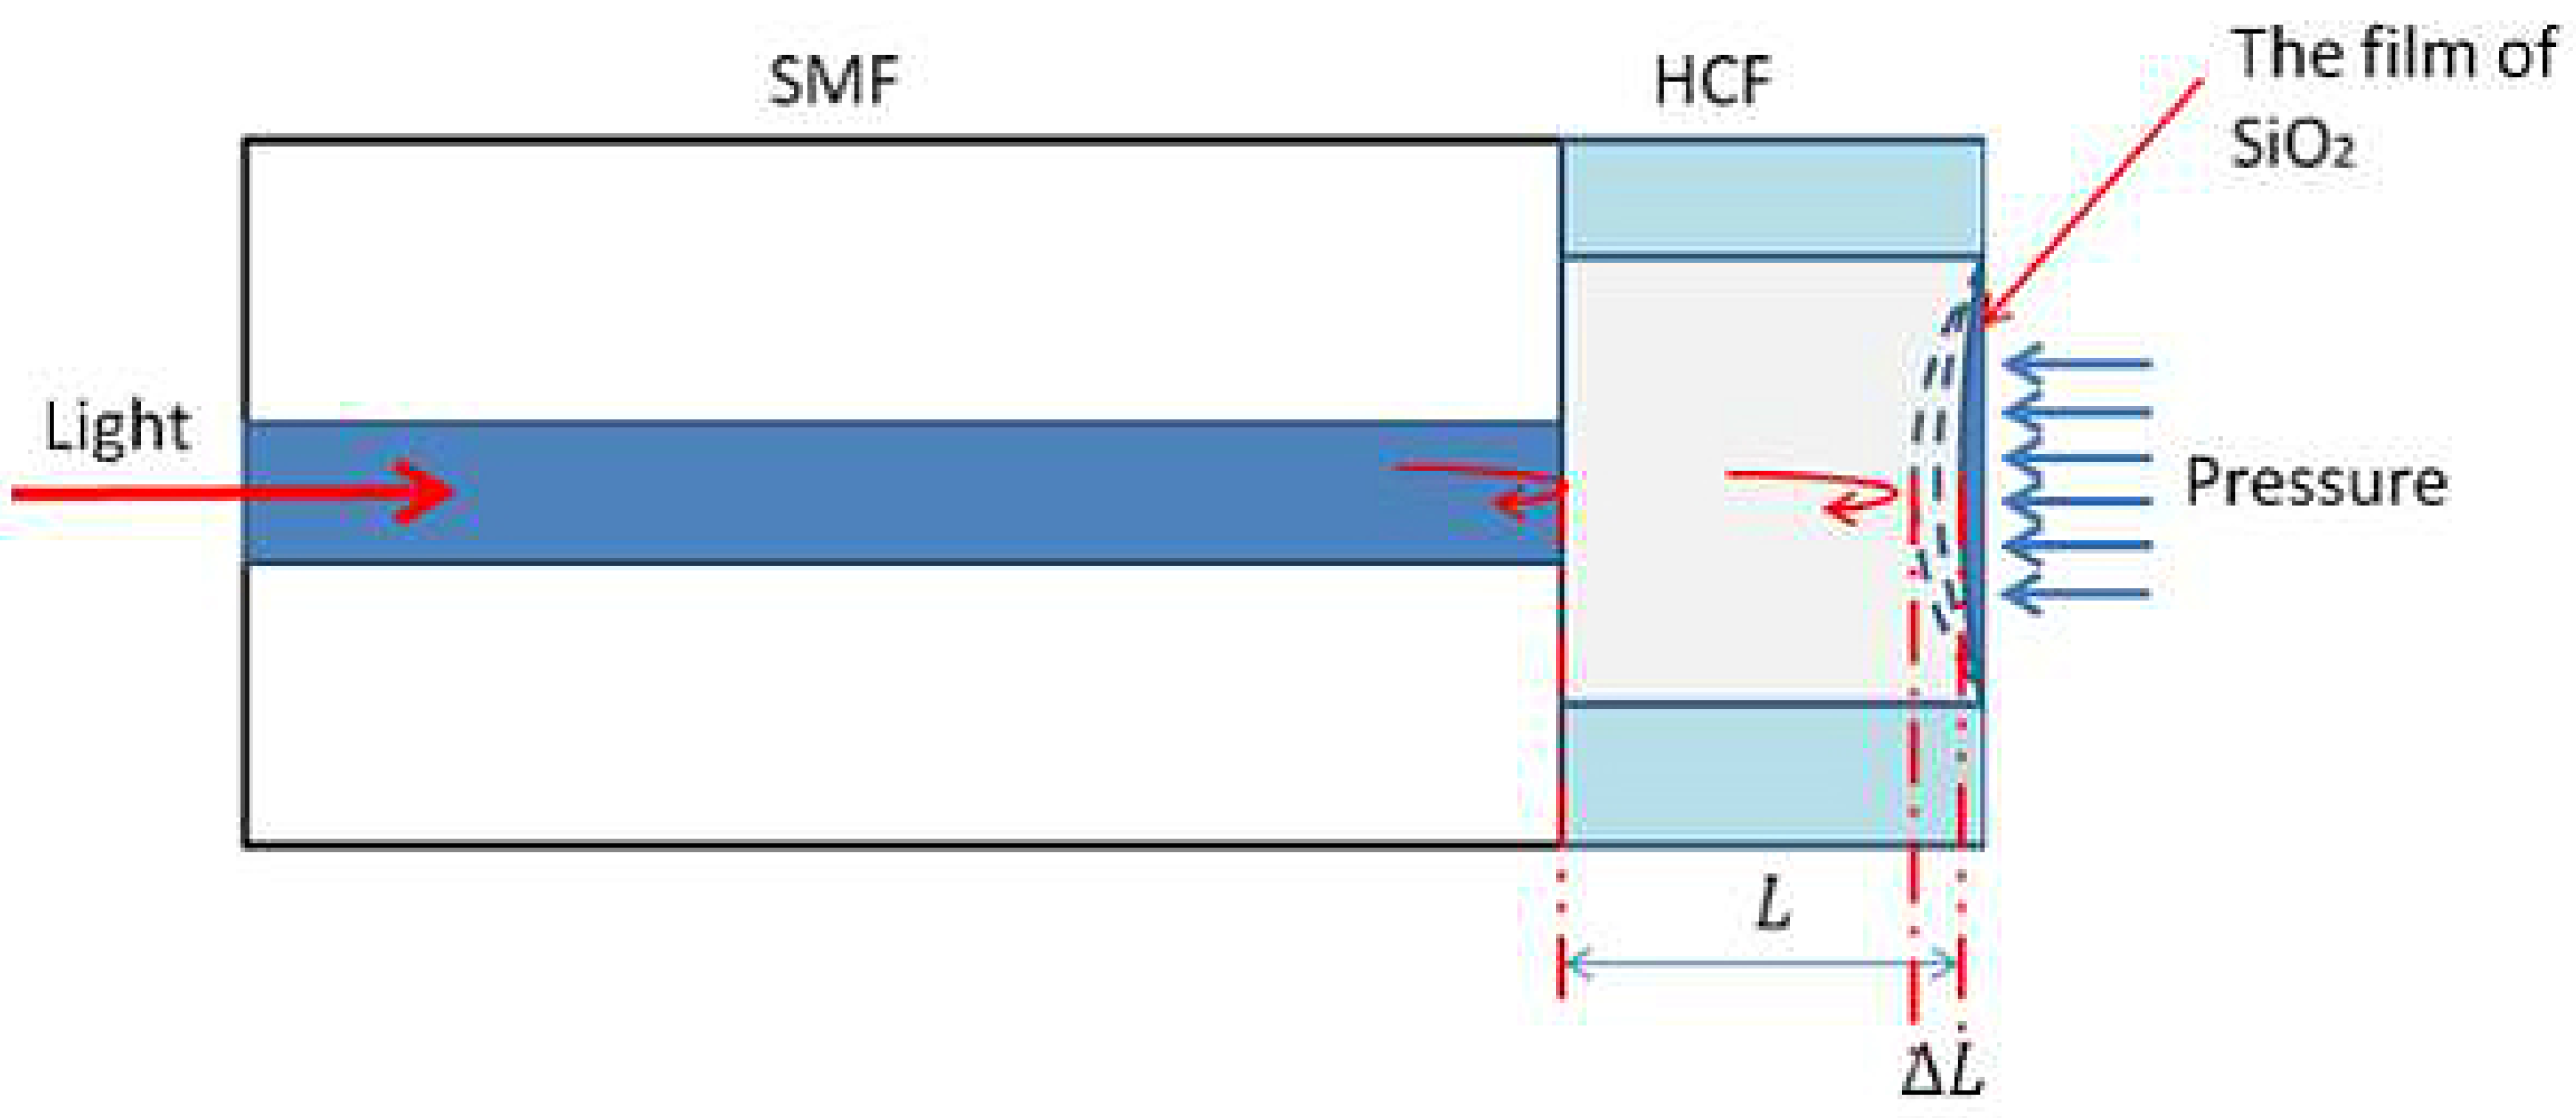
The basic structure of the fiber optic FP pressure sensor is a low fineness Fabry–Perot interferometer. The inner surface of the diaphragm and the end face of the single-mode fiber constitute two cavity surfaces of the Fabry–Perot cavity. The light emitted by the laser source is coupled into the fiber core and is partially reflected when it reaches the two cavity surfaces of the diaphragm sensor, and it forms a dual-beam FP interference. The schematic diagram of the sensor probe structure is shown in Figure 6.
According to the elastic deformation principle of thin film, pressure-sensitive film deforms under the action of external pressure, thus changing the length of FP cavity and causing the change of interference spectrum. By measuring the interference spectrum and demodulating the interference spectrum, the pressure change acting on the thin film can be obtained. The relationship between pressure change and cavity-length change can be expressed by the following formula:
Δ L = 3 16 ( 1 μ 2 ) r 4 E h 3 Δ P
where ΔP is the change of pressure difference between inside and outside the diaphragm; h is the thickness of the film; r is the effective radius of the thin film, that is, the inner radius of the capillary silicon tube; ΔL is the variation of cavity length; μ is the Poisson ratio of the thin film; and E is the Young’s modulus of the thin film.
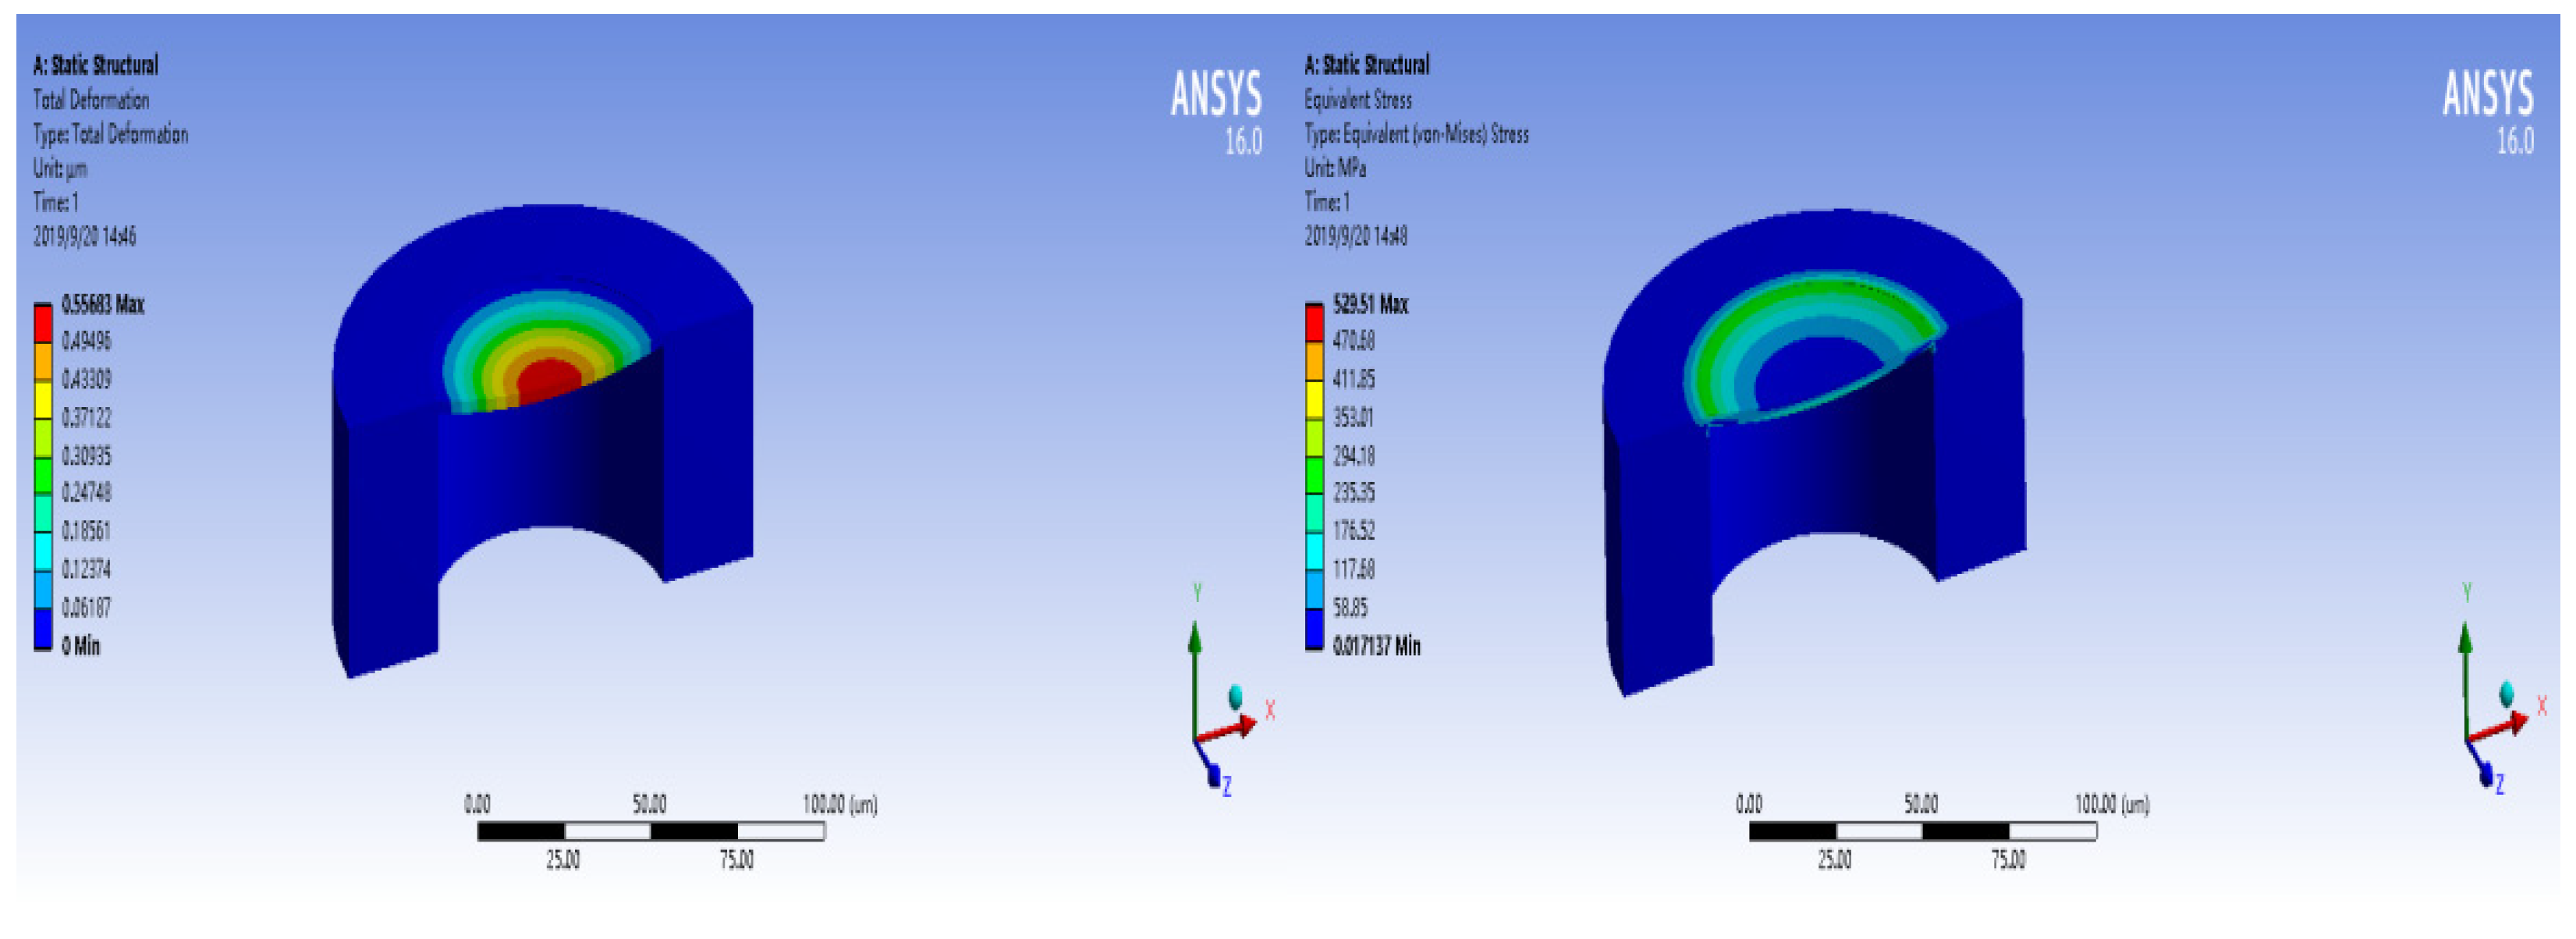
We used the ANSYS16.0, according to the above theory and Equation (1); the deformation of thin films is studied in the software. Here, ΔP was set to 1000 kPa, h to 0.8 μm, r to 30 μm, Poisson’s ratio μ to 0.17 and E to 73,000 MPa (see Figure 7). It seems that the central position of the membrane is most affected by air pressure. As the membrane is derived from the microbubble cavity, its structural characteristics also determine if the thickness of the central position of the membrane is relatively thinner, enabling the measurement of higher sensitivity.
The two-beam interference equation is expressed as follows:
I r e = I 1 + I 2 + 2 I 1 I 2 cos ( Δ φ + φ 0 )
where I 1 and I 2 are the intensities reflected by the glass–air interface and air–glass interface; φ 0 represents the initial phase, and φ 0 is the optical phase difference between the two reflected light beams, which can be described as follows:
Δ φ = 4 π n L λ
where n is the refractive index of air, L is the length of the air-cavity and λ is the optical wavelength in vacuum.
At positions of dips in the interference spectrum, the phase difference between the two reflected light beams meets the following condition:
φ = φ 0 + Δ φ = φ 0 + 4 π n L λ m = ( 2 m + 1 ) π ,   m = 1 , 2 , 3 ,
where m is the integer, and λm is the wavelength of the m-th order interference dip. When axial contact force is applied to the FPI, the air-cavity length decreases, generating a wavelength shift of the interference dip. The wavelength shift amount of the m-th order interference dip can be expressed as follows:
Δ λ m = λ m Δ L L

4. Sensitivity characterization and Analysis

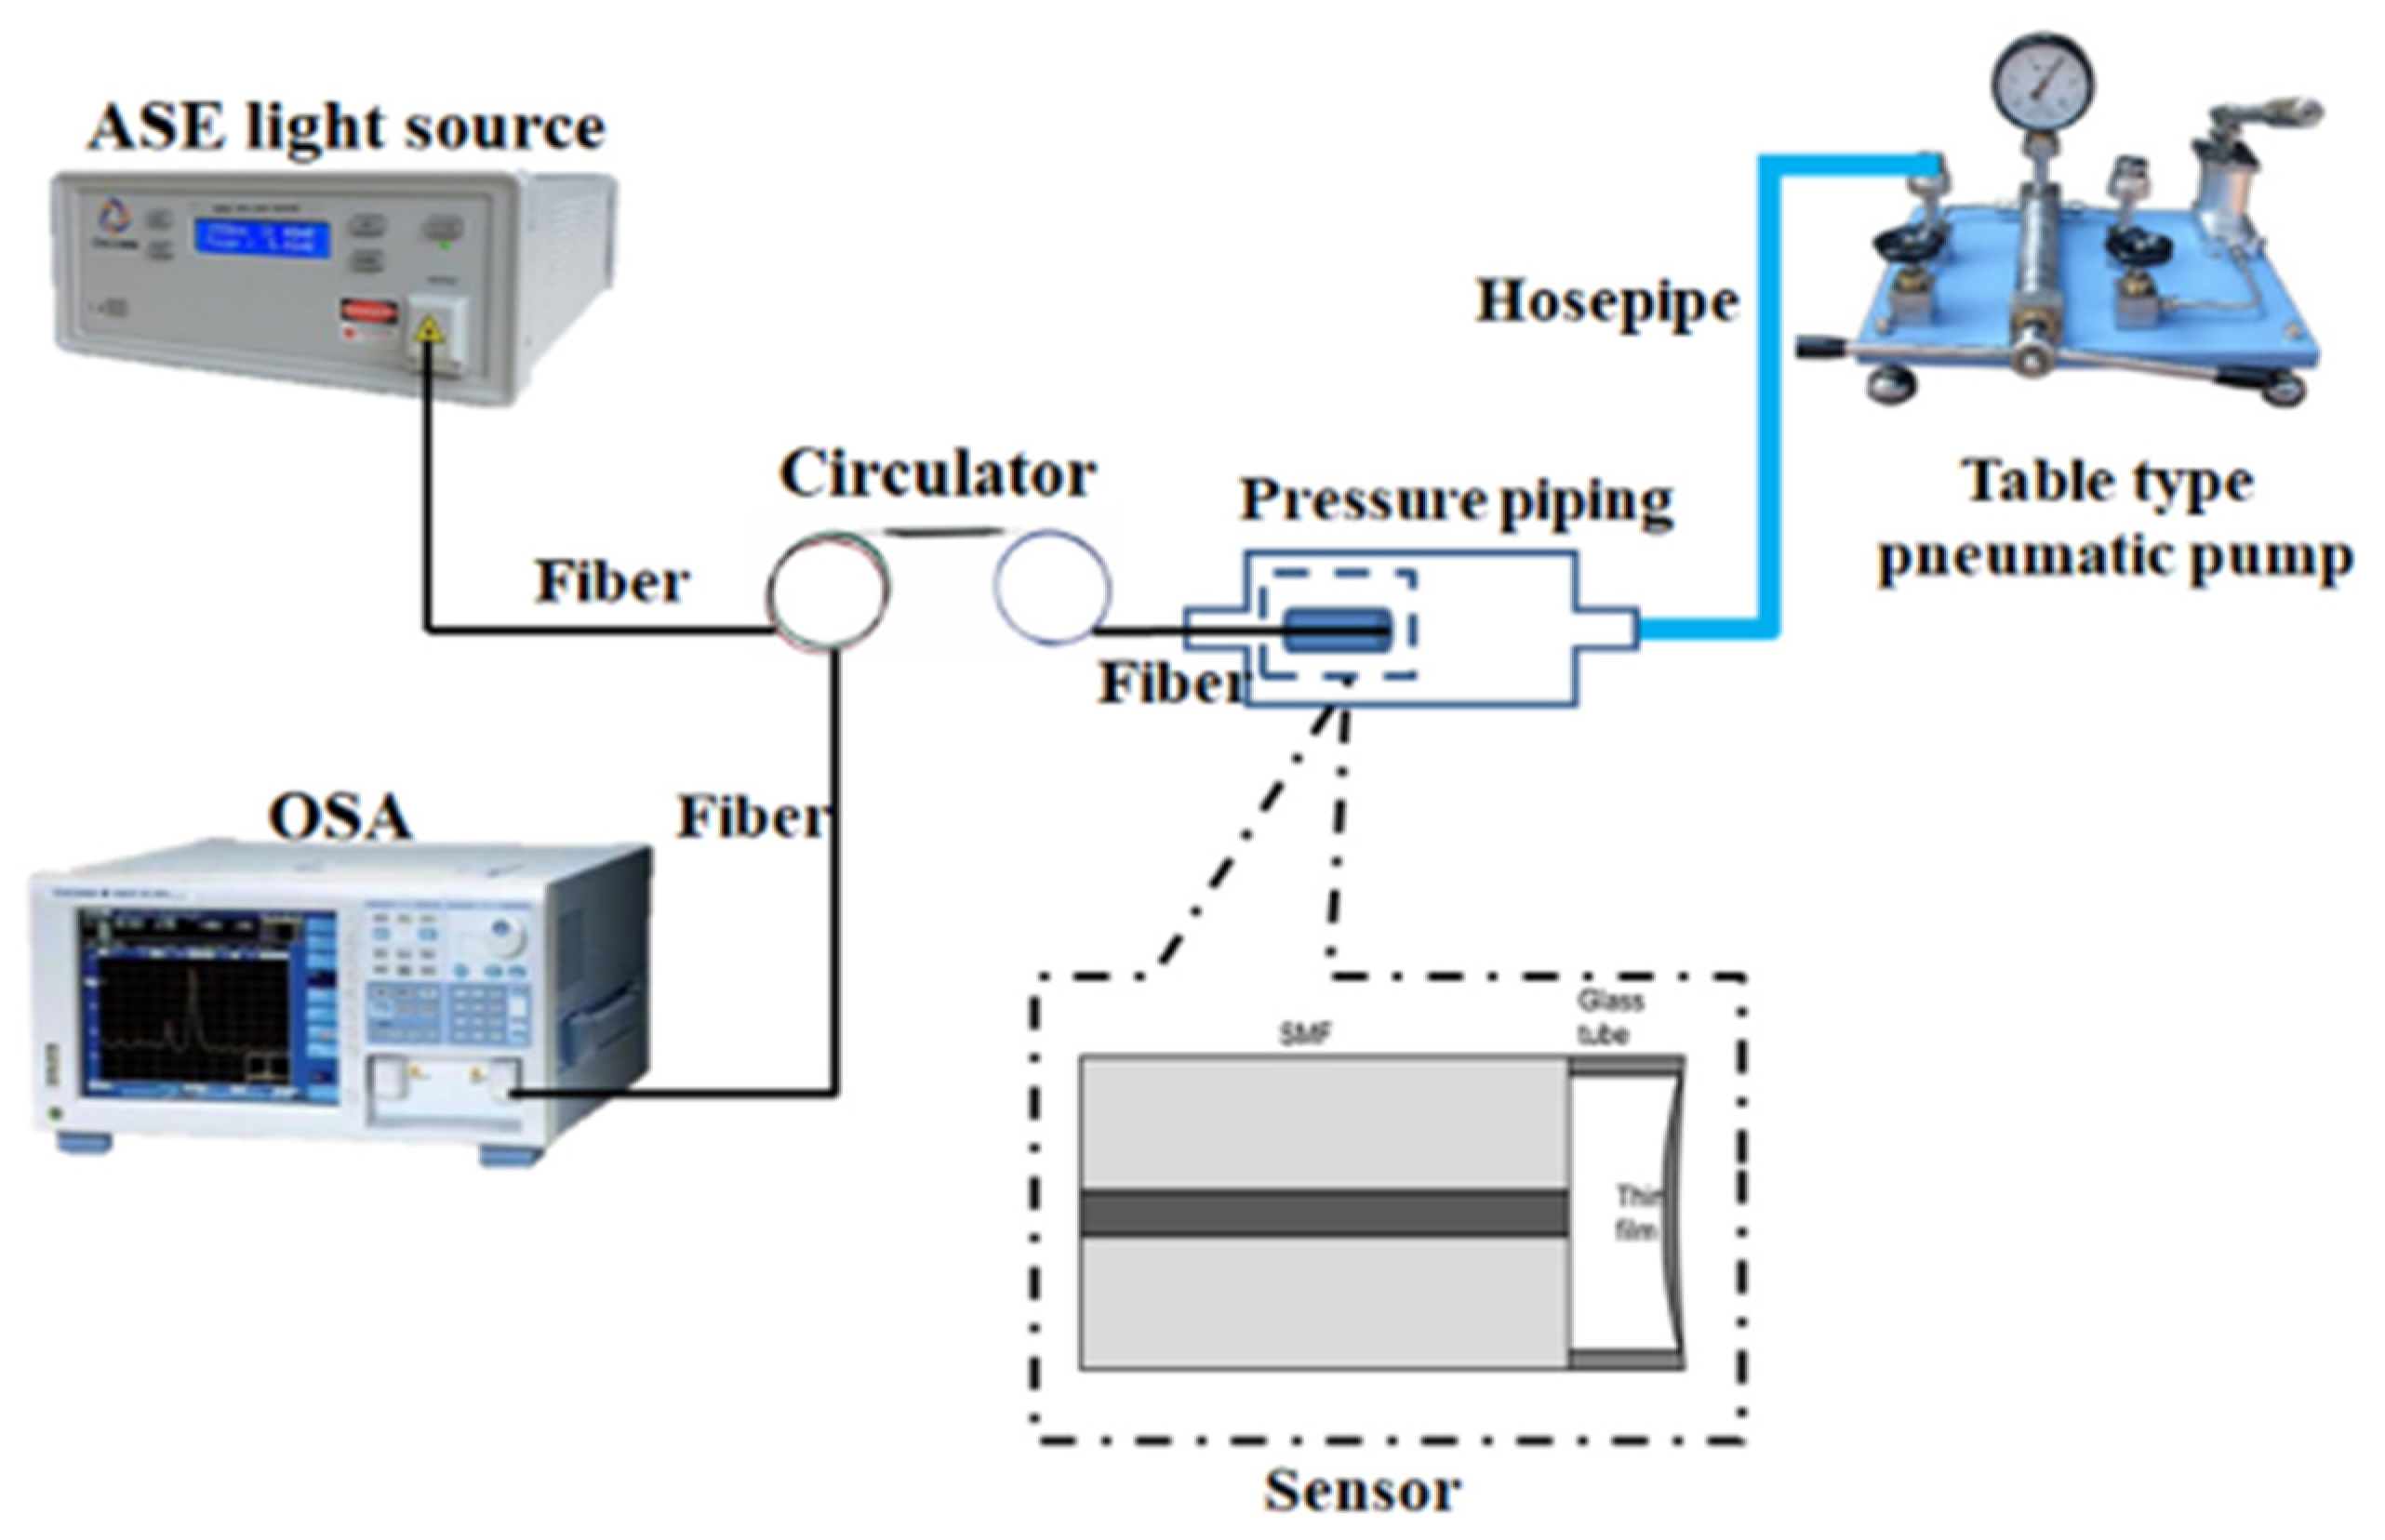
After the preparation of the sensor structure, the sensor performance was characterized and analyzed. The experimental instruments in this experiment include the table pressure pump with high-precision barometer, optical fiber welding machine, ASE (Amplified Spontaneous Emission) broadband light source and optical spectrum analyzer (OSA). An experimental test schematic diagram is shown in Figure 8. An ASE (Amplified Spontaneous Emission) light source was used to provide incident light, with a wavelength range from 1525 to 1610 nm for the FP interference chamber. Pressure table pumps and high-precision gauges provided and calibrated pressure changes. In this way, we could provide a linearly varying pressure value with a resolution of 10 Pa. The interference spectrum signal was demodulated by OSA (Optical spectrum analyzer).
In the experiment, OSA (Optical spectrum analysis) adopted AQ6370D of Yokogawa company, with the spectral measurement range of 600~1750 nm and the minimum measurement resolution of 20 pm. BBS (broadband source) is the KG-ASE series from Beijing, Beijing KangGuan century photoelectric technology co., LTD. The spectral width was 1525~1610 nm. In the experiment, 3–5 obvious interference peaks were formed in the broadband spectral range of 85 nm. With the change of pressure, the interference peak moved toward to the longer wave direction.
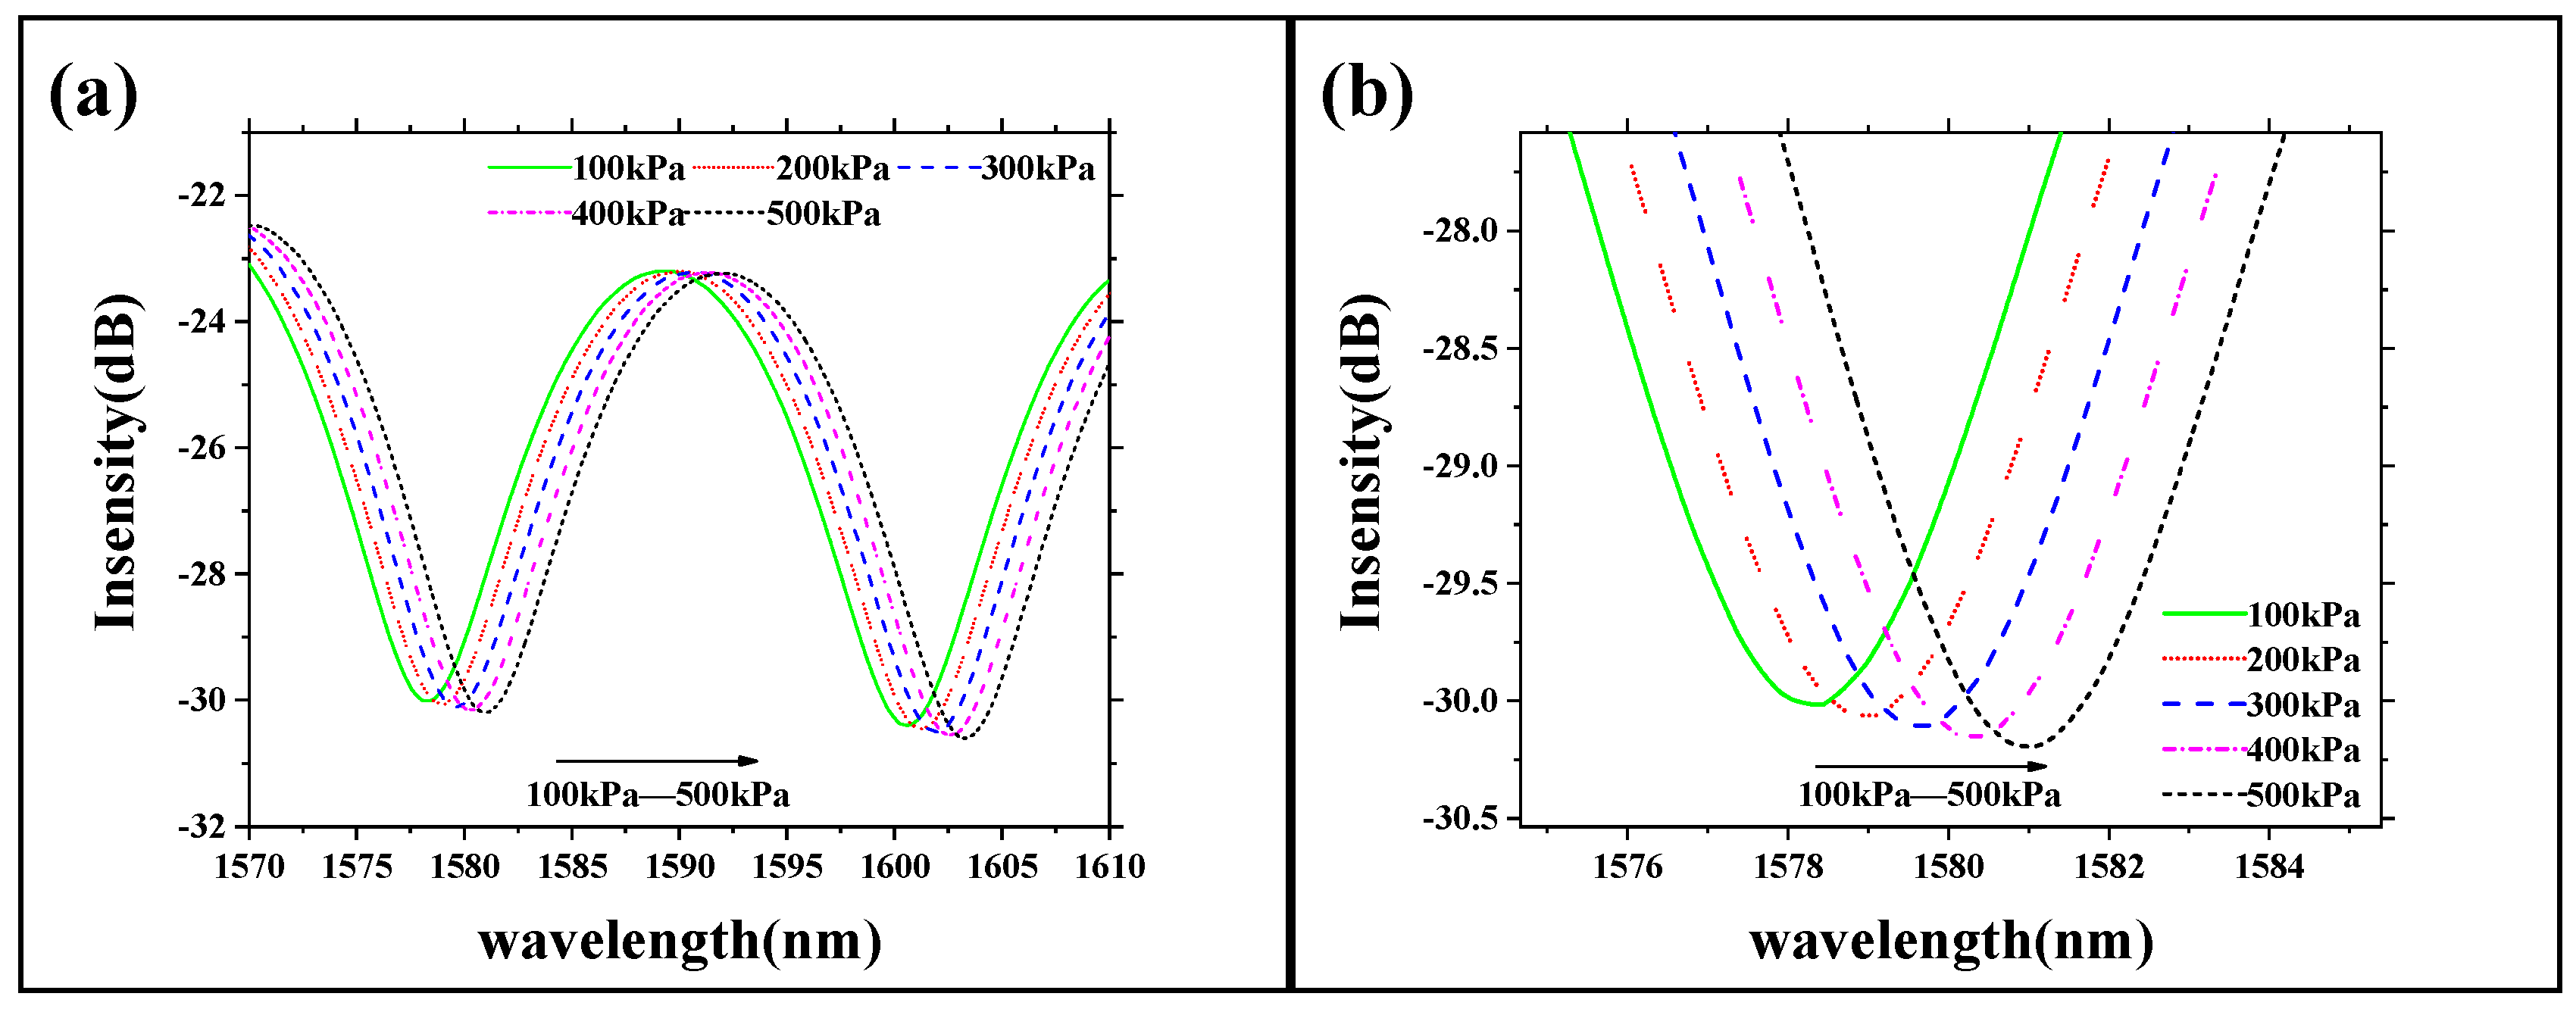
As shown in Figure 9b, with the increase of pump pressure, the peak value of the interference spectrum showed a redshift state. When the applied pressure increased from 100.0 to 500.0 kPa, the peak value was offset by 2.7 nm.
We define the sensitivity as α:
α = Δλp
where Δλ is the offset of the spectral peak from the spectrometer measurement, and
Δp is the change in pressure from the precision barometer measurement. According to the test data, the peak value offset-pressure sensitivity was calculated to be about 6750 pm/MPa.
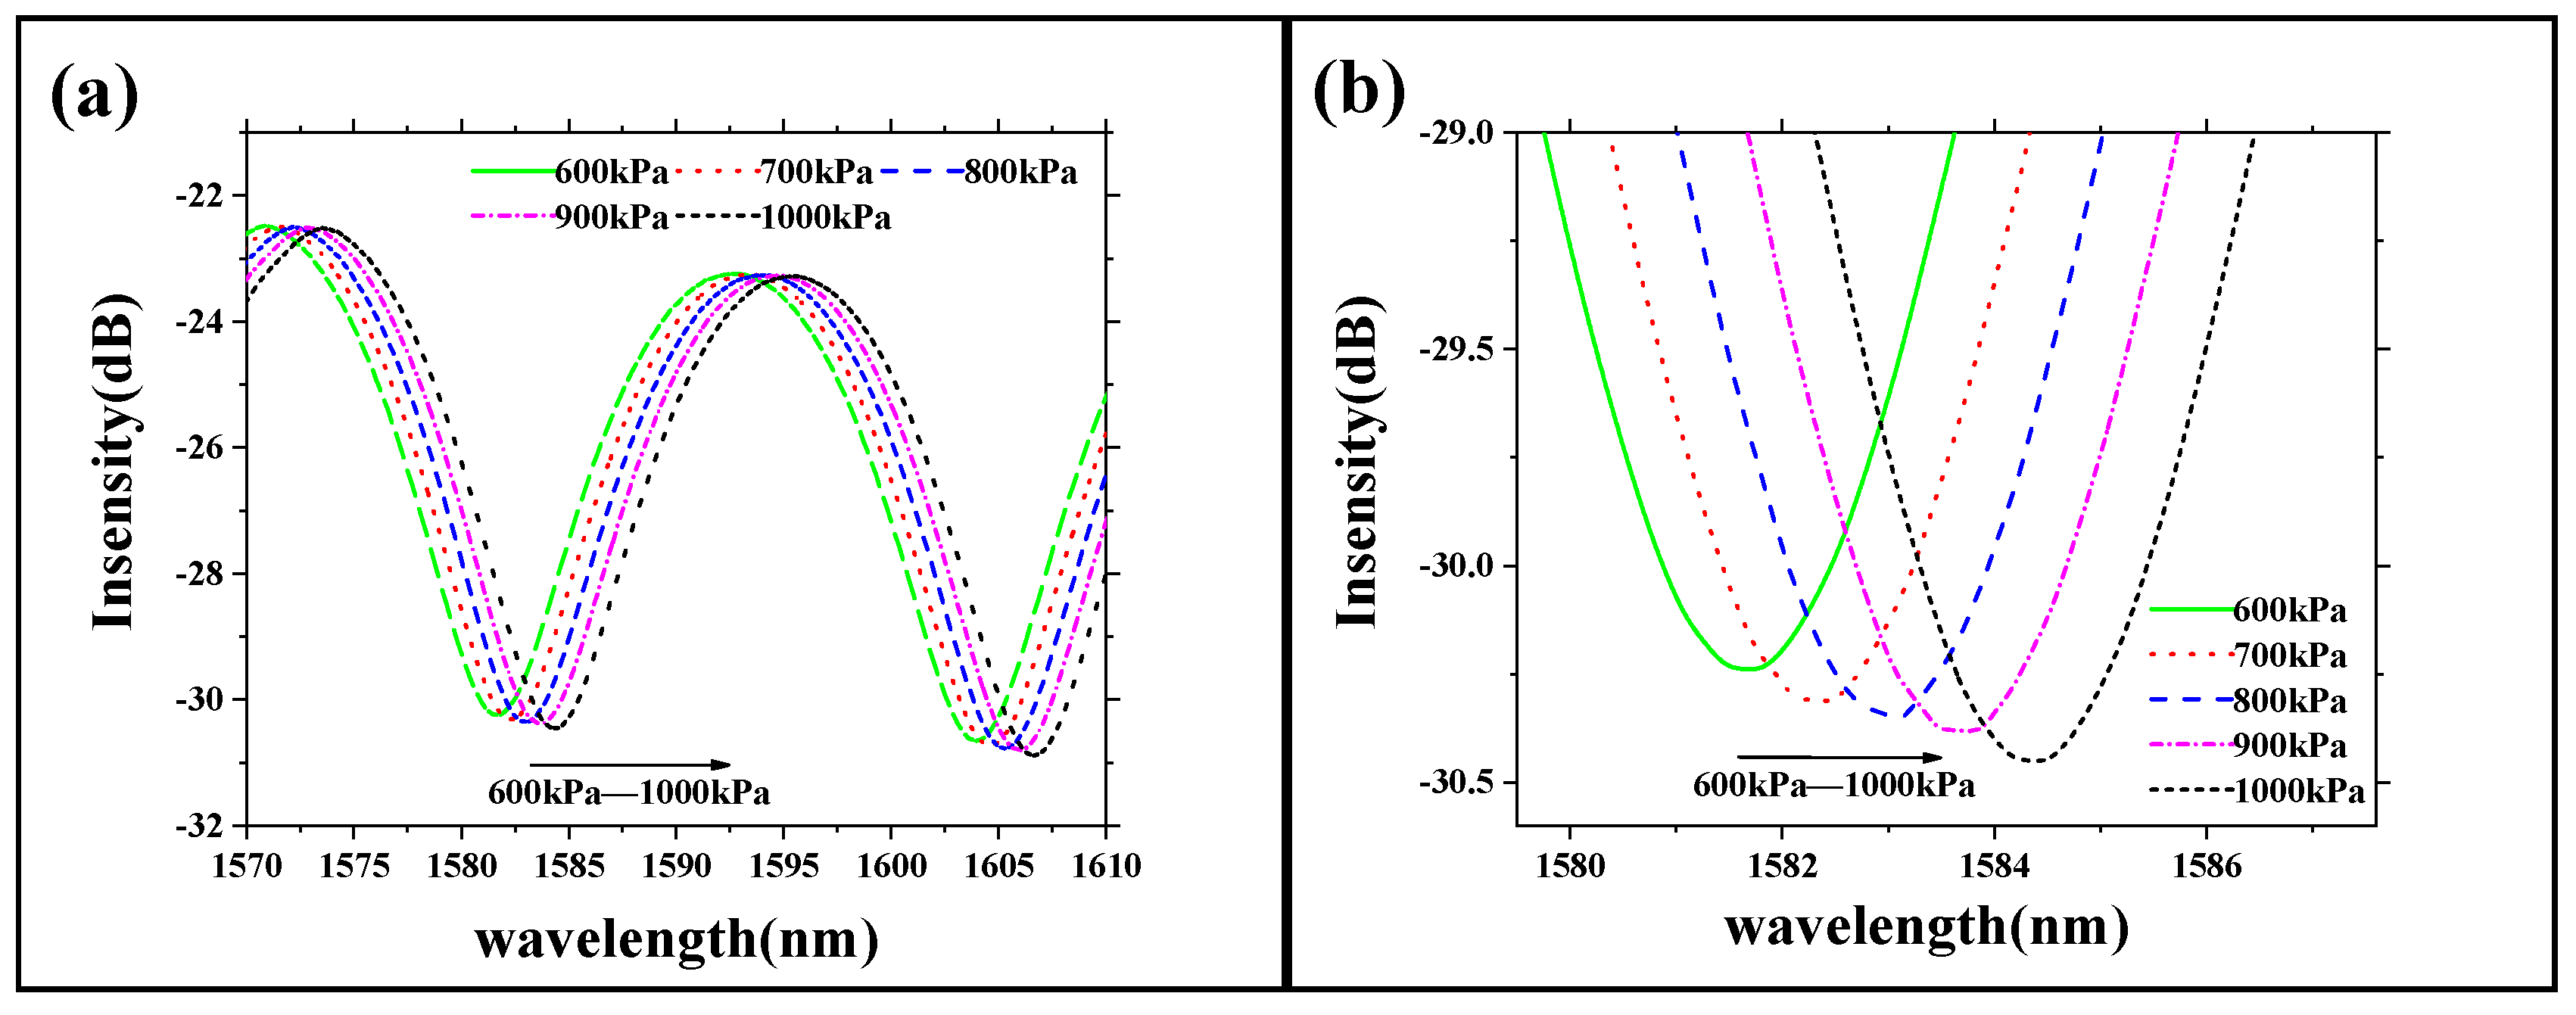
We attempted to conduct a pressure test on it in the range of 600 to 1000 kPa, and we obtained the results shown in Figure 10a. We enlarged the local spectrogram to get Figure 10b, in which we observed an obvious spectral redshift, with a shift of 2.89 nm, and calculated that its peak offset-pressure sensitivity was about 7225 pm/MPa. These results show that we can apply it to the detection of pressure change in high-pressure environments.
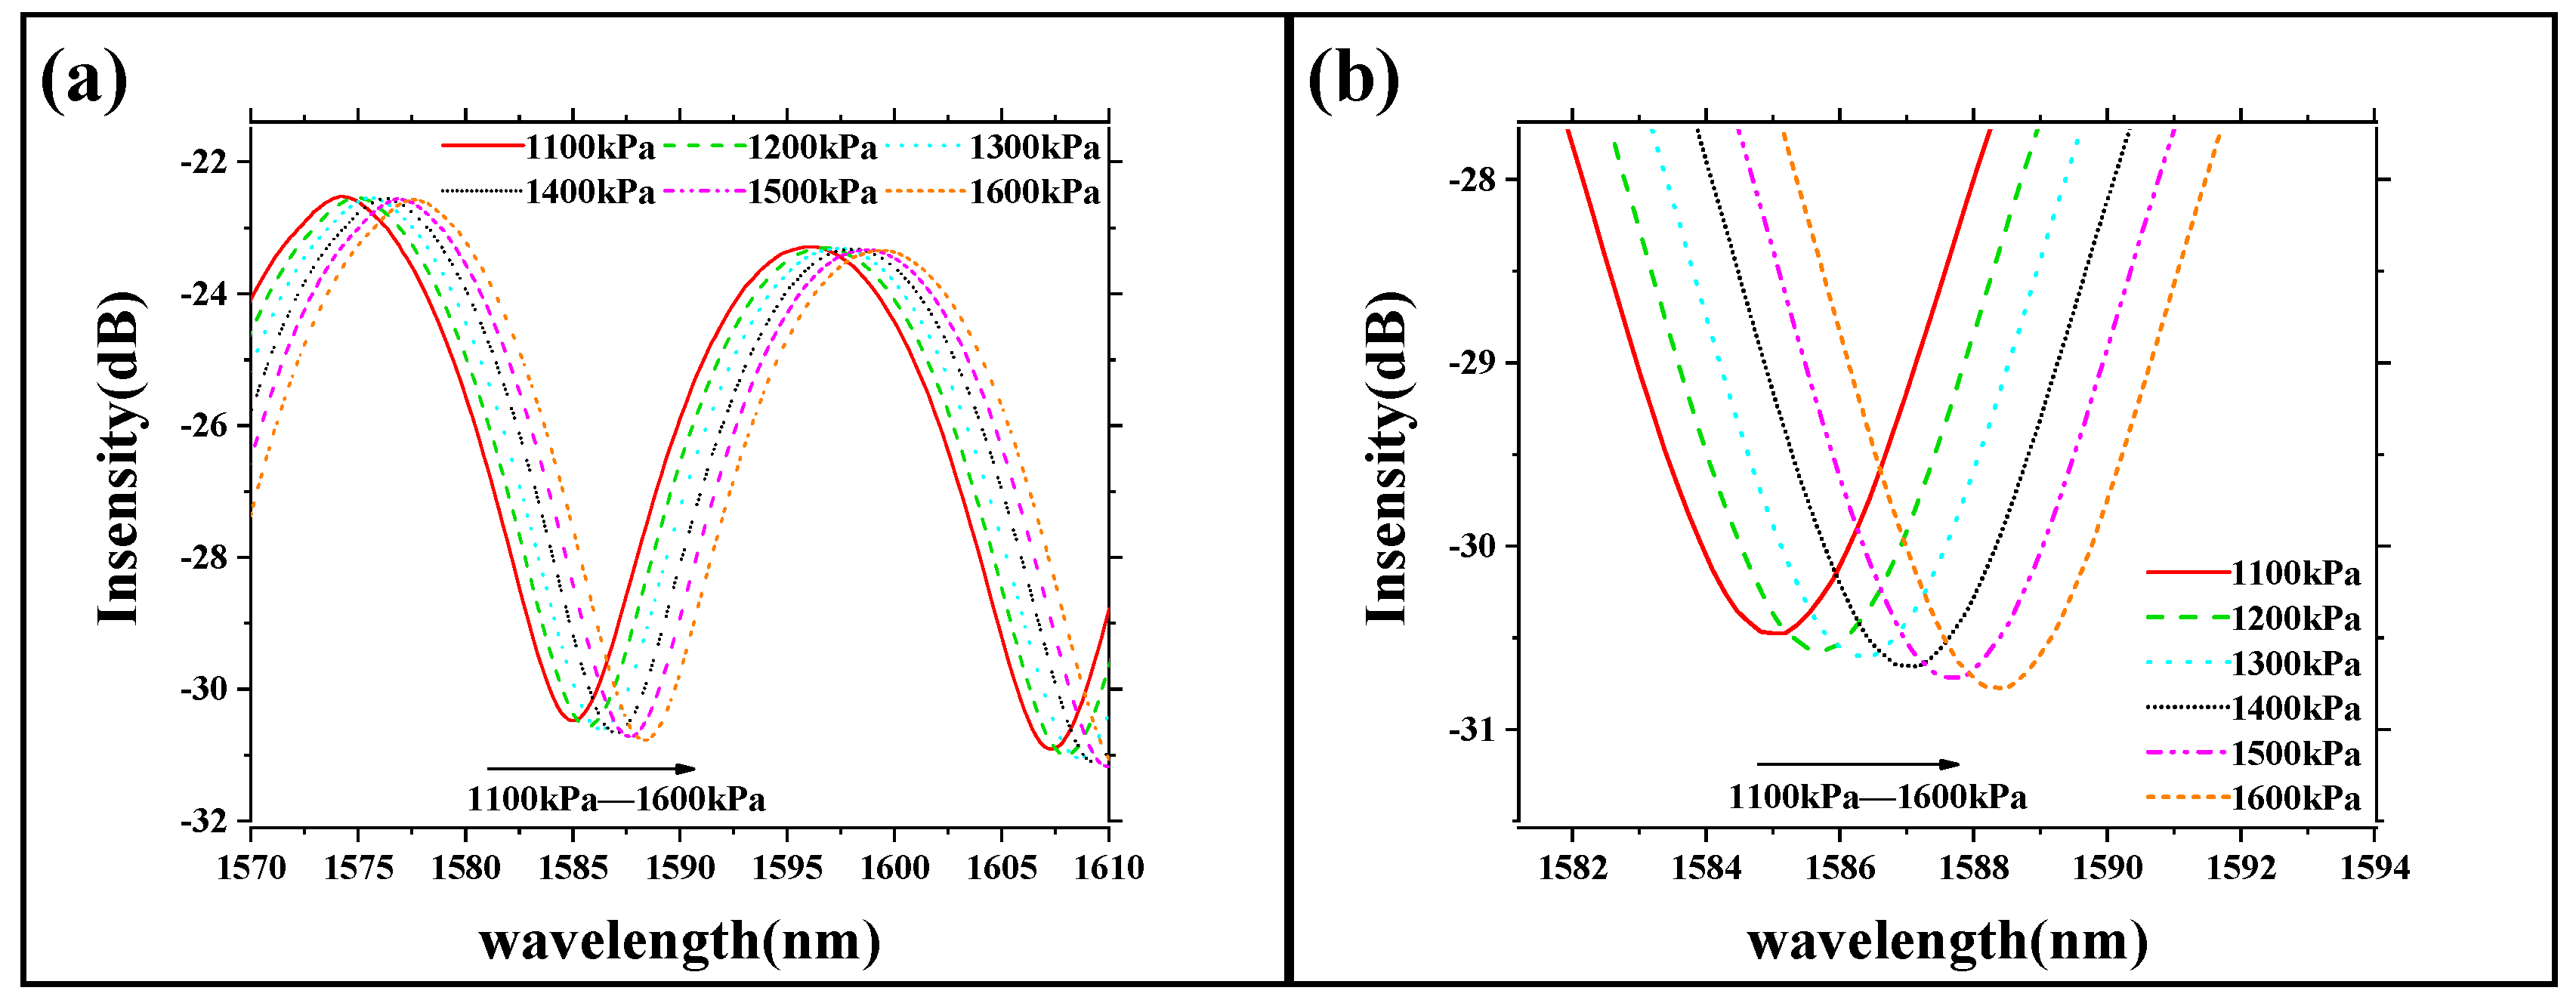
According to the data analysis of the upper experiments, it is believed that that fabricated sensor will perform well in the high-pressure environment. The results of the prepared sensor in the pressure range of 1100 to 1600 kPa were obtained, as shown in Figure 11b. When the pressure increased by 100 kPa, spectral peak was also redshifted at an offset of 6.66 pm. The calculated sensitivity was 6660 pm/MPa.
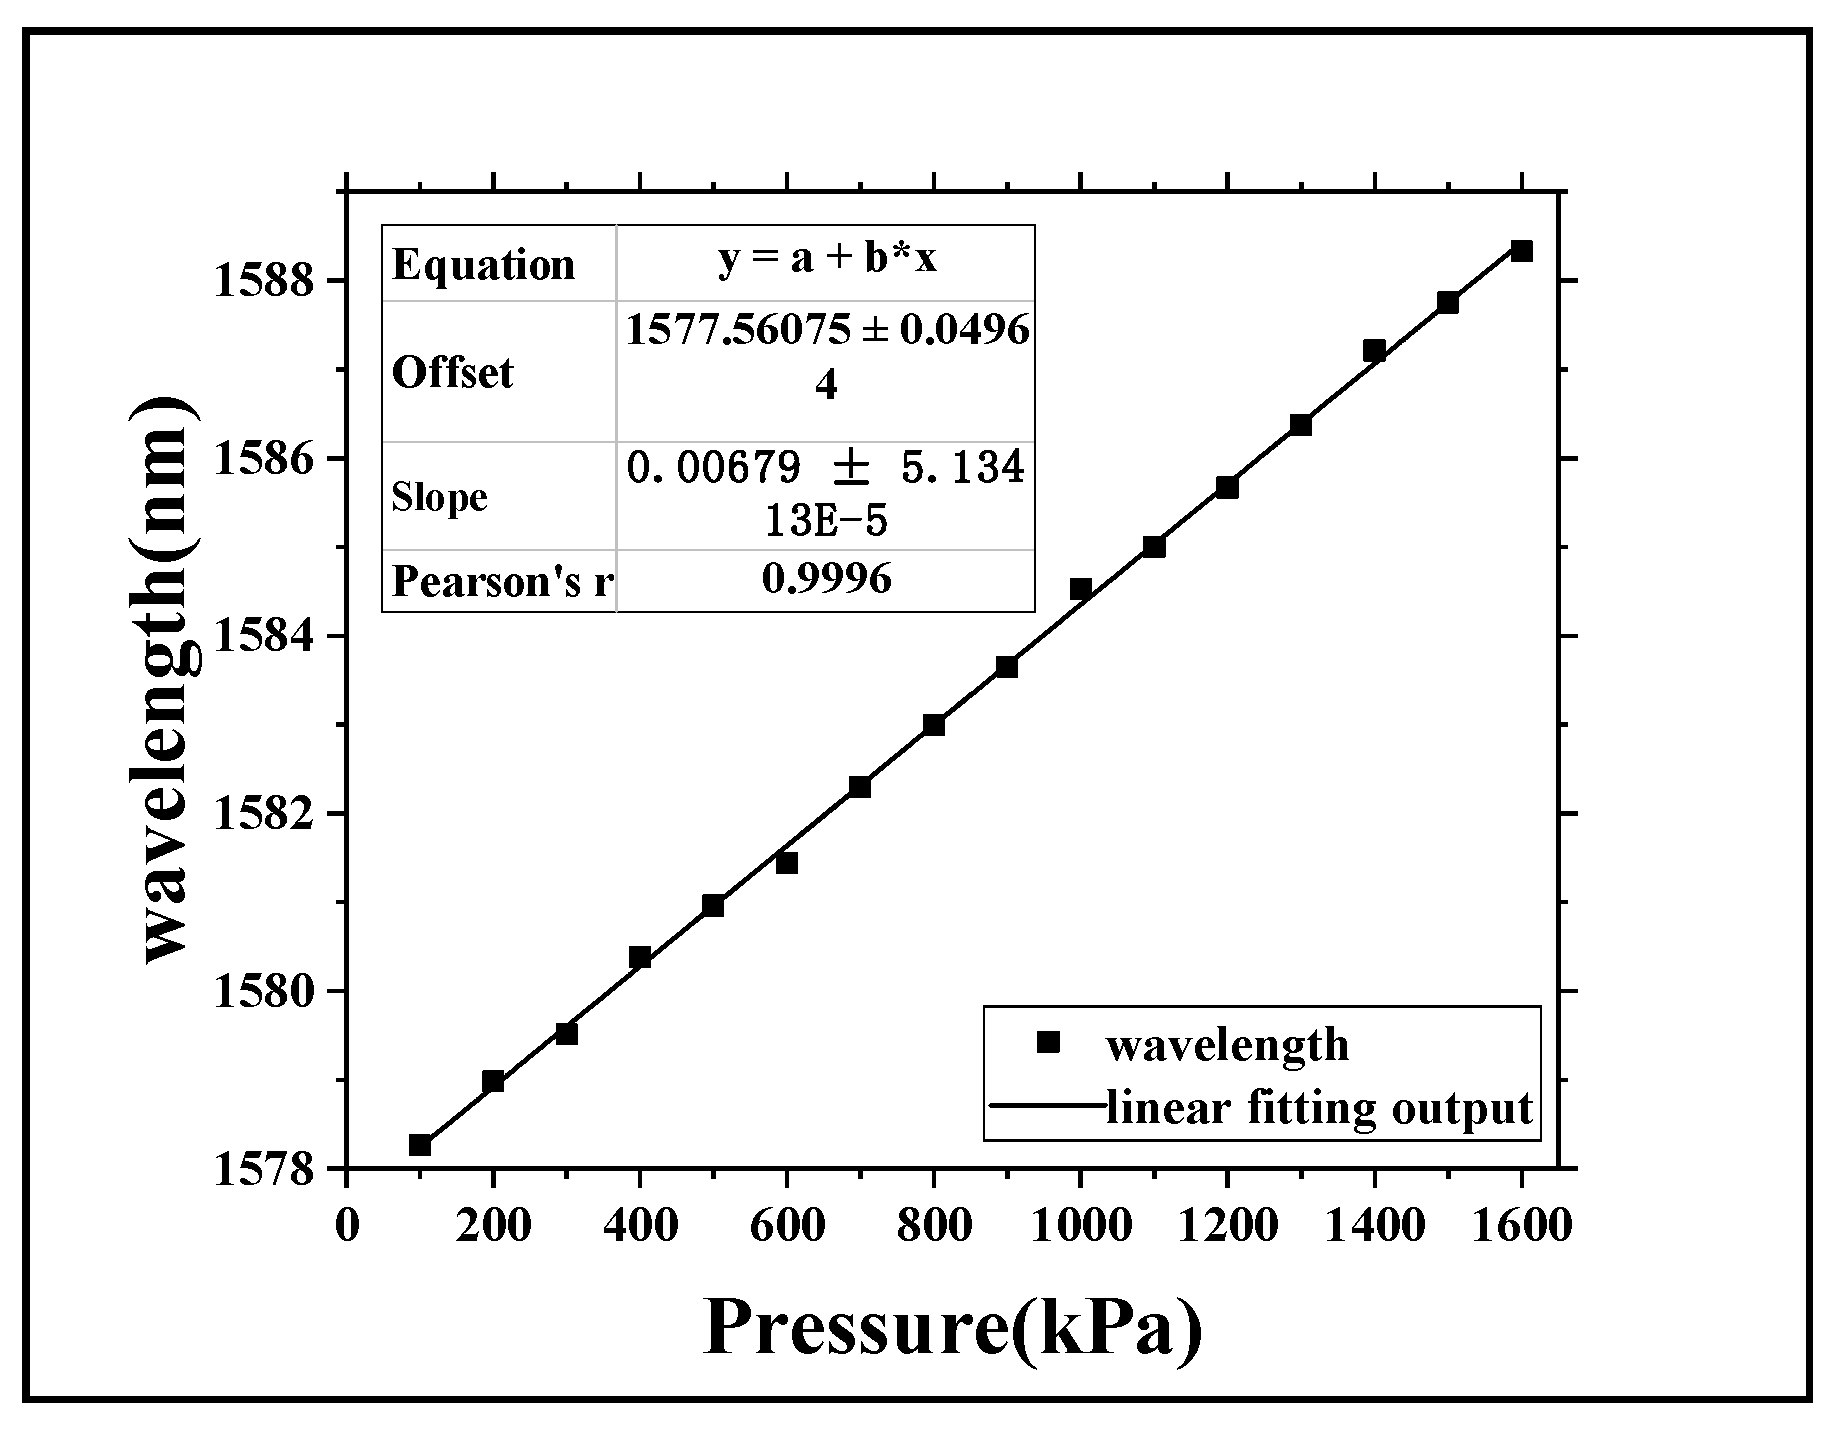
We analyzed the offset of the wavelength of the central interference peak in the case that the pressure variation ranged from 100 to 1600 kPa. The image was fitted linearly. As shown in Figure 12, we calculated that the slope of the curve is 0.00679, which means that our sensor’s pressure sensitivity was 6790 pm/MPa.
The detection limit (η) is determined by the smallest detectable wavelength shift of the reflection spectrum (m), and the sensitivity (α) by η = m/α. m can be assumed to be the standard deviation of the total noise (σ) of the output signal resulting from amplitude noise, thermal noise and OSA spectrum resolution, which can be expressed as follows:
m = 3 σ
In this paper, m can be calculated to be ~22.55 pm, and hence the detection limit η is ~3.21 kPa.
In Table 1, we compare the sensitivity of pressure sensors of the same material and similar structure in recent years. Using the sensor preparation method in this paper, the sensitivity of the fabricated sensor was nearly doubled, compared with the recent research. The curve shows good linearity, and we can think that our sensor structure has good test performance under high-pressure environments.

5. Conclusions

In this paper, an improved method of preparing microbubbles based on pressure-assisted discharge method was studied. By controlling the arc discharge intensity, time and fiber position, to reduce the thickness of the microbubble film, the micrometer-scale all-silicon film was prepared. By controlling arc discharge and tension, the end film of the bubble micro-cavity was transferred to the structure of fusing single-mode fiber and a glass tube. The FP interference cavity at the end of the fiber could be formed. The structure was applied in the field of air-pressure sensing, and the sensitivity of the structure to air-pressure response was tested up to 6790 pm/MPa. Our structure showed great potential in the pressure environment. Further optimization of the thickness and surface area of the membrane, as well as the length of the FP cavity, is expected to achieve higher sensitivity. In this way, we can provide more sensitive structures and methods for pressure monitoring.

Author Contributions

Conceptualization, G.W. and M.H.; Formal analysis, G.W.; Investigation, S.Z. and Z.S.; Methodology, J.S.; Supervision, G.W. and M.H.; Validation, S.Z.; Data curation, M.Z.; Writing—Original Draft, S.Z.; Writing—Review & Editing, S.Z., J.L. and H.G. All authors have read and agreed to the published version of the manuscript.

Funding

This work was financially supported by Hainan Key R&D Program (No. ZDYF2019115), National Natural Science Foundation of China (Nos. 61865005 and 61762033), Shaanxi Province Science Foundation for Youths (No. 2018JQ6076), Natural Science Foundation of Hainan Province (Nos. 2019CXTD400 and 617079), National Key Technology Support Program (Nos. 2018YFB1404400, 2015BAH55F04 and 2015BAH55F01), Major Science and Technology Project of Hainan province (No. ZDKJ2016015), Scientific Research Staring Foundation of Hainan University (No. KYQD(ZR)1882) and Joint innovation Research Fund of TJU&HNU. The data that support the findings of this study are available from the corresponding author, upon reasonable request.

Acknowledgments

The authors are grateful for the assistance provided by Yiping Wang (Shenzhen University).

Conflicts of Interest

The authors declare no conflict of interest.

References

  1. Liu, Y.; Zhang, T.; Wang, Y.; Yang, D.; Liu, X.; Fu, H.; Jia, Z. Simultaneous measurement of gas pressure and temperature with integrated optical fiber FPI sensor based on in-fiber micro-cavity and fiber-tip. Opt. Fiber Technol. 2018, 46, 77–82. [Google Scholar] [CrossRef]
  2. Wang, W.; Wu, W.; Wu, S.; Li, Y.; Huang, C.; Tian, X.; Huang, J. Adhesive-free bonding homogenous fused-silica Fabry–Perot optical fiber low pressure sensor in harsh environments by CO2 laser welding. Opt. Commun. 2019, 435, 97–101. [Google Scholar] [CrossRef]
  3. Yan, L.; Gui, Z.; Wang, G.; An, Y.; Gu, J.; Zhang, M.; Liu, X.; Wang, Z.; Wang, G.; Jia, P. A microbubble structure based Fabry-Perot optical fiber strain sensor with high sensitivity and low cost characters. Sensors 2017, 173, 555. [Google Scholar] [CrossRef] [PubMed] [Green Version]
  4. Luo, C.; Liu, X.; Liu, J.; Shen, J.; Li, H.; Zhang, S.; Huang, M. An optimized PDMS thin film immersed fabry-perot fiber optic pressure sensor for sensitivity enhancement. Coatings 2019, 9, 290. [Google Scholar] [CrossRef] [Green Version]
  5. Liao, C.; Liu, S.; Xu, L.; Wang, C.; Wang, Y.; Li, Z.; Wang, Q.; Wang, D. Sub-micron silica diaphragm-based fiber-tip fabry–perot interferometer for pressure measurement. Opt. Lett. 2014, 39, 2827–2830. [Google Scholar] [CrossRef] [PubMed] [Green Version]
  6. Ma, J.; Jin, W.; Ho, H.; Dai, J. High-sensitivity fiber-tip pressure sensor with graphene diaphragm. Opt. Lett. 2012, 37, 2493–2495. [Google Scholar] [CrossRef] [PubMed] [Green Version]
  7. Xu, F.; Ren, D.; Shi, X.; Li, C.; Lu, W.; Lu, L.; Lu, L.; Yu, B. High-sensitivity fabry–perot interferometric pressure sensor based on a nanothick silver diaphragm. Opt. Lett. 2012, 37, 133–135. [Google Scholar] [PubMed]
  8. Islam, M.; Ali, M.; Lai, M.; Lim, K.; Ahmad, H. Chronology of fabry-perot interferometer fiber-optic sensors and their applications: A review. Sensors 2014, 14, 7451–7488. [Google Scholar] [CrossRef] [PubMed] [Green Version]
  9. Wang, Y.; Wang, D.; Wang, C.; Hu, T. Compressible fiber optic micro-fabry-pérot cavity with ultra-high pressure sensitivity. Opt. Express 2013, 21, 14084–14089. [Google Scholar] [CrossRef] [PubMed] [Green Version]
  10. Xu, B.; Wang, C.; Wang, D.; Liu, Y.; Li, Y. Fiber-tip gas pressure sensor based on dual capillaries. Opt. Express 2015, 23, 23484–23492. [Google Scholar] [CrossRef] [PubMed]
  11. Berneschi, S.; Farnesi, D.; Cosi, F.; Conti, G.N.; Pelli, S.; Righini, G.C.; Soria, S. High Q silica microbubble resonators fabricated by arc discharge. Opt. Lett. 2011, 36, 3521–3523. [Google Scholar] [CrossRef] [PubMed]
  12. Yang, Y.; Saurabh, S.; Ward, J.M.; Chormaic, S.N. High-Q, ultrathin-walled microbubble resonator for aerostatic pressure sensing. Opt. Express 2016, 24, 294–299. [Google Scholar] [CrossRef] [Green Version]
  13. Watkins, A.; Ward, J.; Wu, Y.; Chormaic, S.N. Single-input spherical microbubble resonator. Opt. Lett. 2011, 36, 2113–2115. [Google Scholar] [CrossRef] [PubMed]
  14. Wang, G.; Liu, X.; Gui, Z.; An, Y.; Gu, J.; Zhang, M.; Yan, L.; Wang, G.; Wang, Z. A high-sensitive pressure sensor using a single-mode fiber embedded microbubble with thin film characteristics. Sensors 2017, 17, 1192. [Google Scholar] [CrossRef] [PubMed] [Green Version]
  15. Guo, W.; Liu, J.; Liu, J.; Wang, G.; Wang, G.; Huang, M. A Single-ended ultra-thin spherical microbubble based on the improved critical-state pressure-assisted arc discharge method. Coatings 2019, 9, 144. [Google Scholar] [CrossRef] [Green Version]
Figure 1. Fabrication process of microbubble.
Coatings 10 00358 g001
Figure 2. Fabricated microbubbles: (a) egg-shaped microbubble; and (b) spherical micobubble.
Coatings 10 00358 g002
Figure 3. Fabrication of silicon diaphragm miniature fiber Fabry–Perot (FP) cavity sensor.
Coatings 10 00358 g003
Figure 4. Welding and cutting of fiber glass tubes.
Coatings 10 00358 g004
Figure 5. Structure diagram of sensor.
Coatings 10 00358 g005
Figure 6. Schematic diagram of sensor probe structure.
Coatings 10 00358 g006
Figure 7. Stress and deformation of thin film under external pressure.
Coatings 10 00358 g007
Figure 8. Schematic diagram of experimental test.
Coatings 10 00358 g008
Figure 9. Interference spectrum movement under pressure change of 100~500 kPa: (a) interference spectra at the 40 nm band; and (b) local enlargement of one interference spectrum.
Coatings 10 00358 g009
Figure 10. (a) The movement of the interference spectrum under pressure changes of 600~1000kPa. (b) Local amplification of interference peak.
Coatings 10 00358 g010
Figure 11. (a) The movement of the interference spectrum under pressure change of 1000~1600 kPa; (b) local amplification of interference peak.
Coatings 10 00358 g011
Figure 12. Wavelength deviation of central interference peak under pressure change.
Coatings 10 00358 g012
Table 1. The sensitivity of optical fiber Fabry–Perot pressure sensor.
Source (Time, Literature)2012, Xu F et al.2014, Liao et al. [5]2015, Ben X et al.This Paper
The sensitivity315 pm/MPa1036 pm/MPa4147 pm/MPa6790 pm/MPa
The boundary of measurement0~50 kPa0~2 MPa0 ~ 1.52 MPa0 ~ 1.6 MPa
The resolution————4.81 kPa3.21 kPa

