
Impact of Erythromycin as a Prokinetic on the Gut Microbiome in Children with Feeding Intolerance—A Pilot Study †

 , ,
, , 
Abstract
:1. Introduction
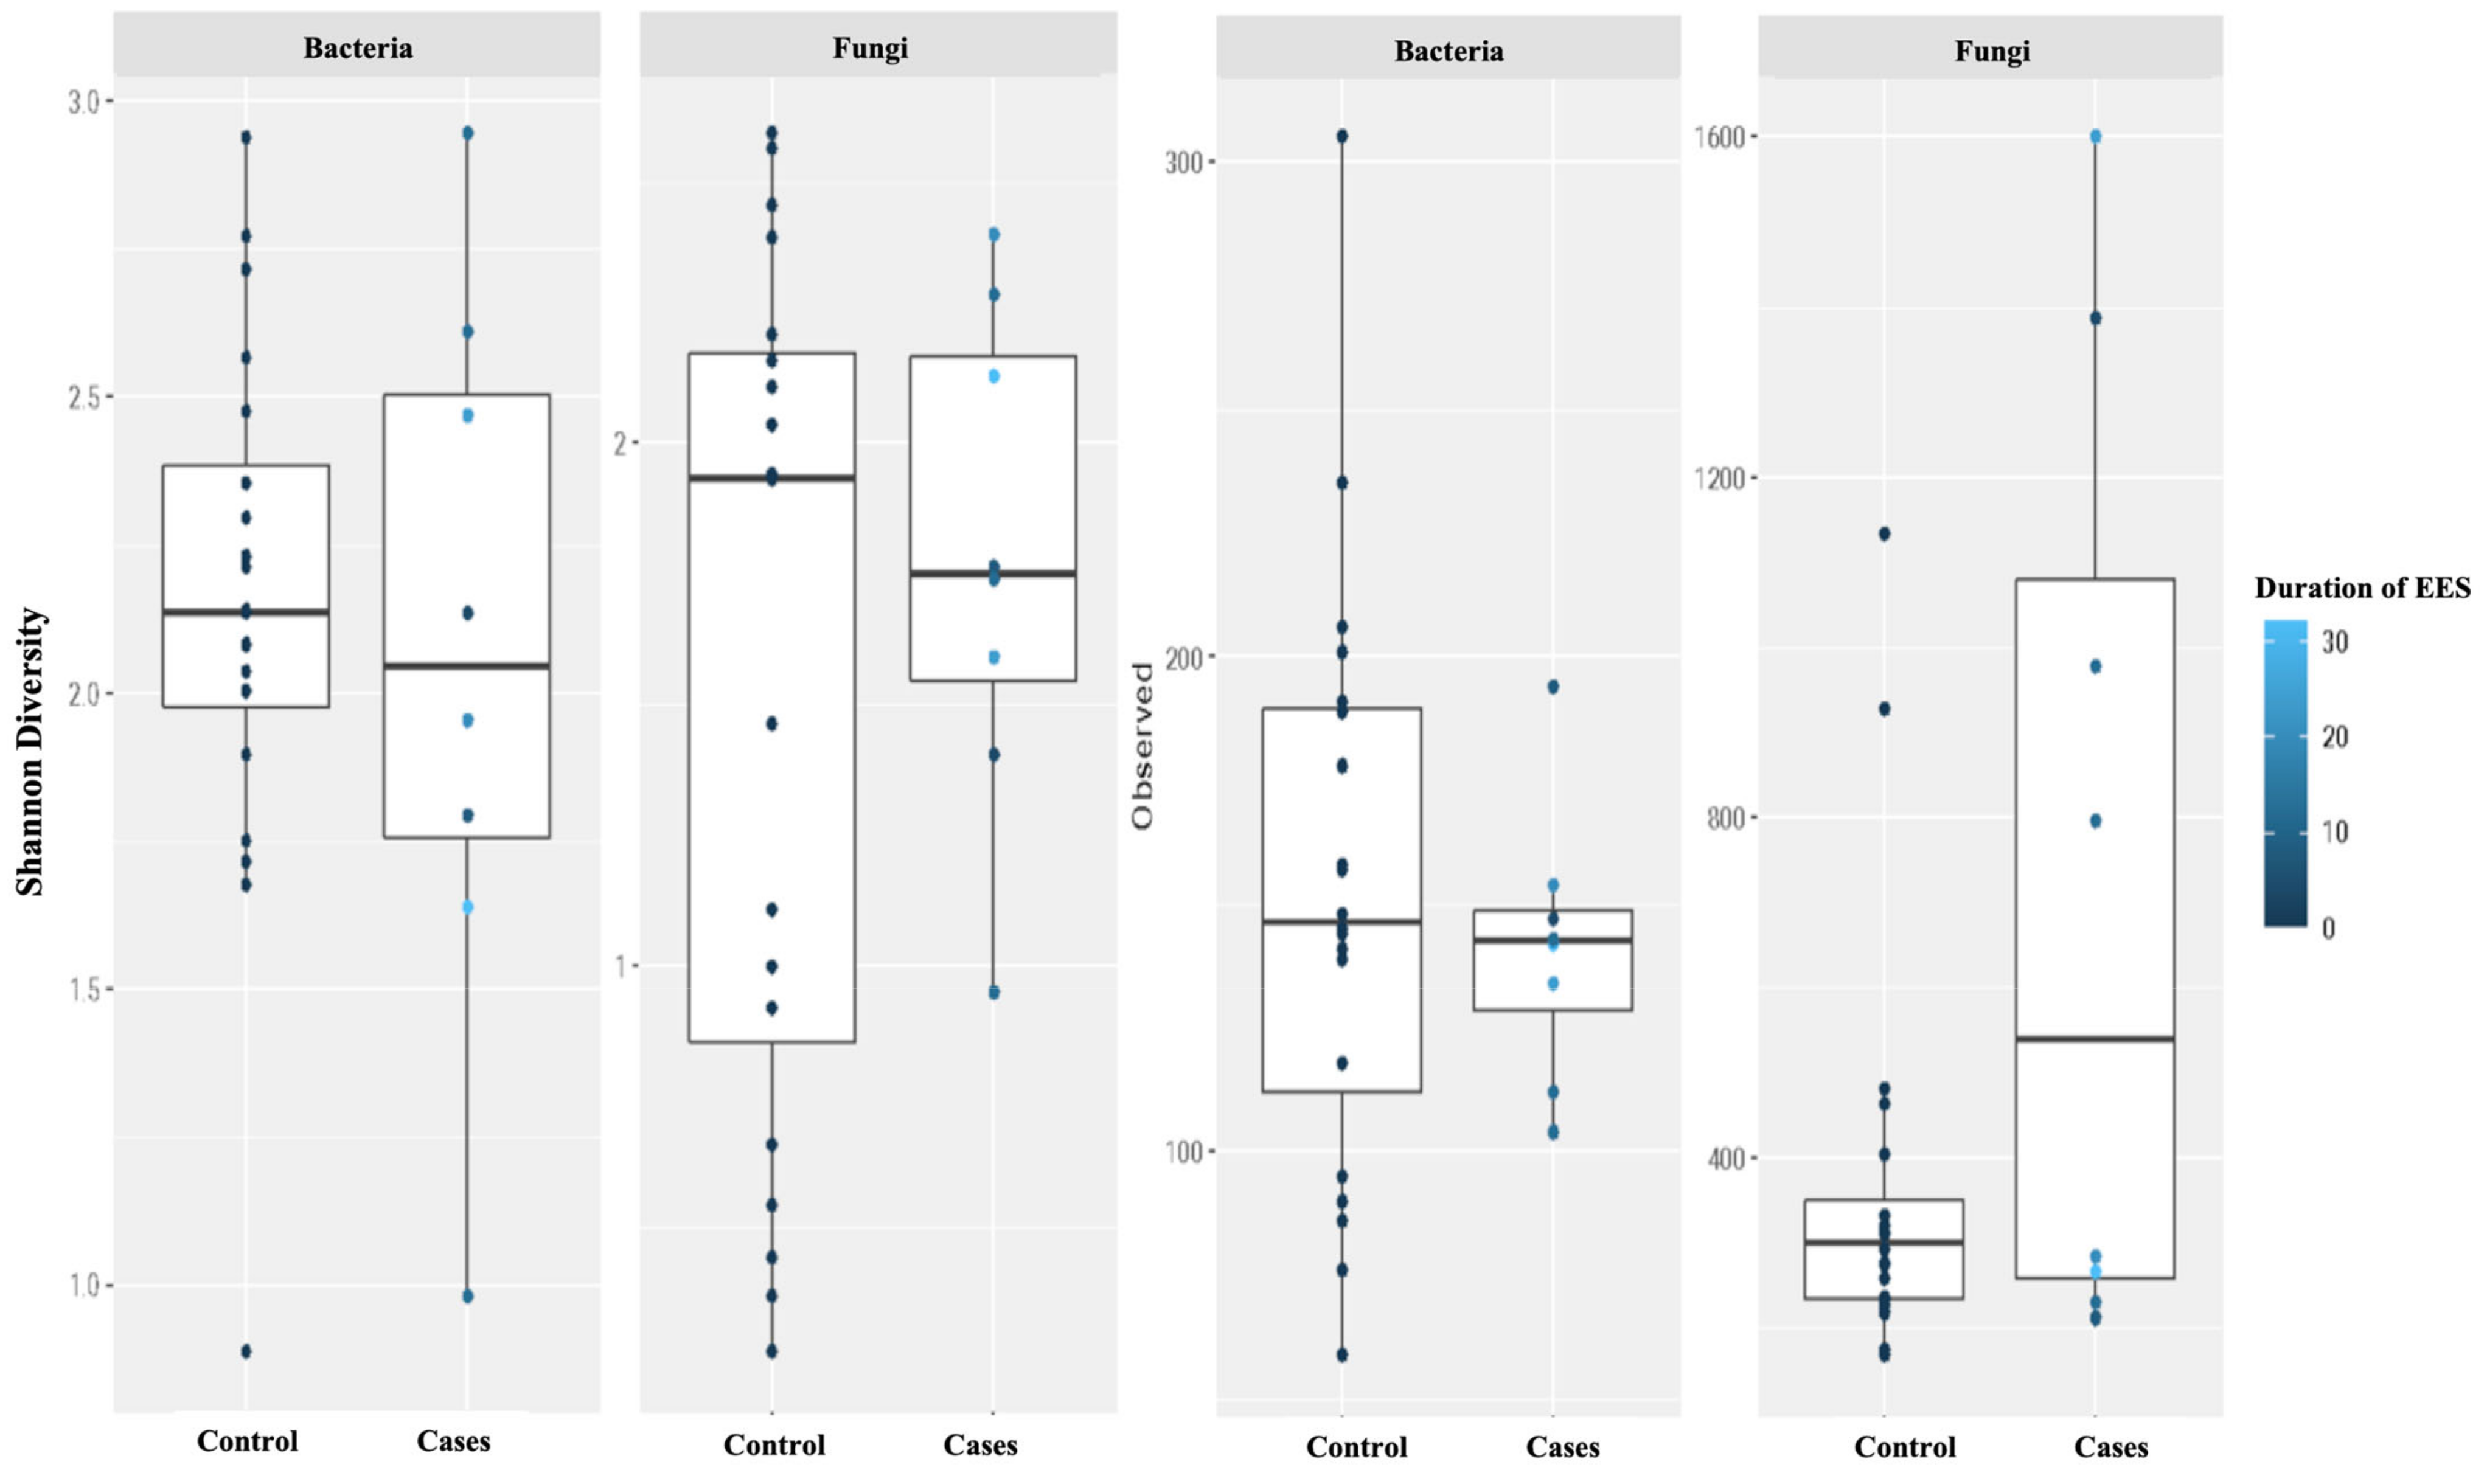
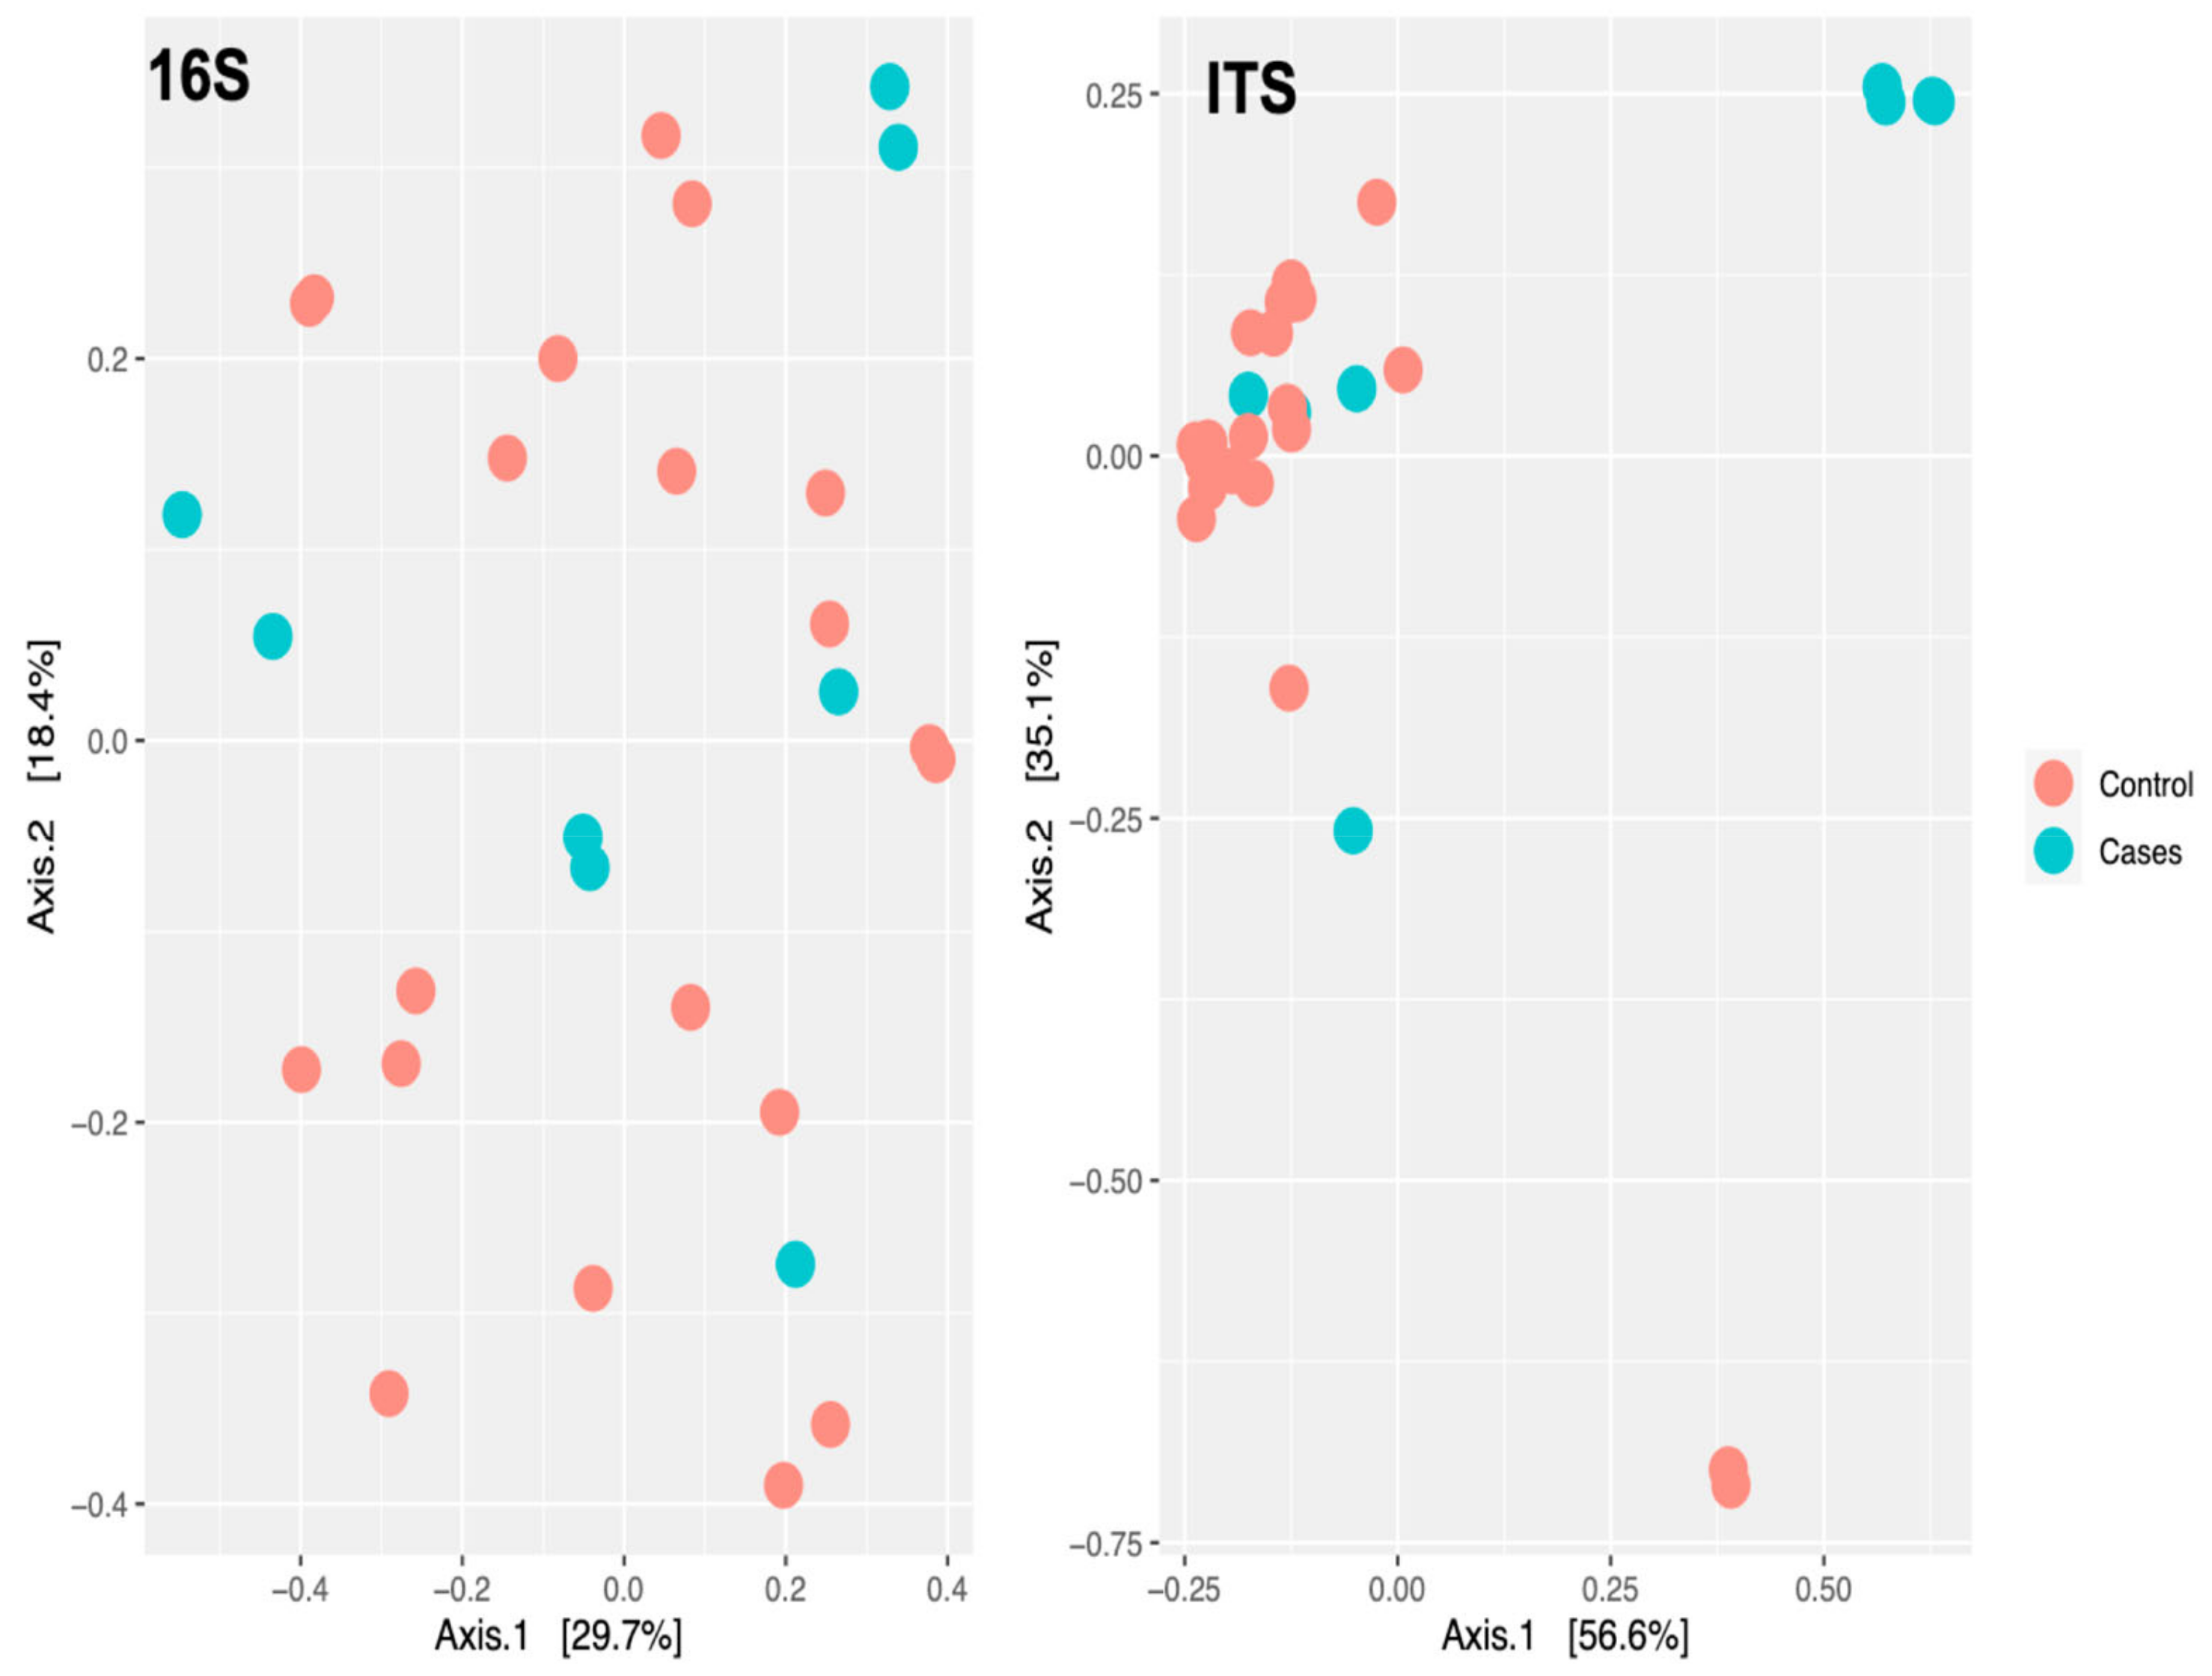
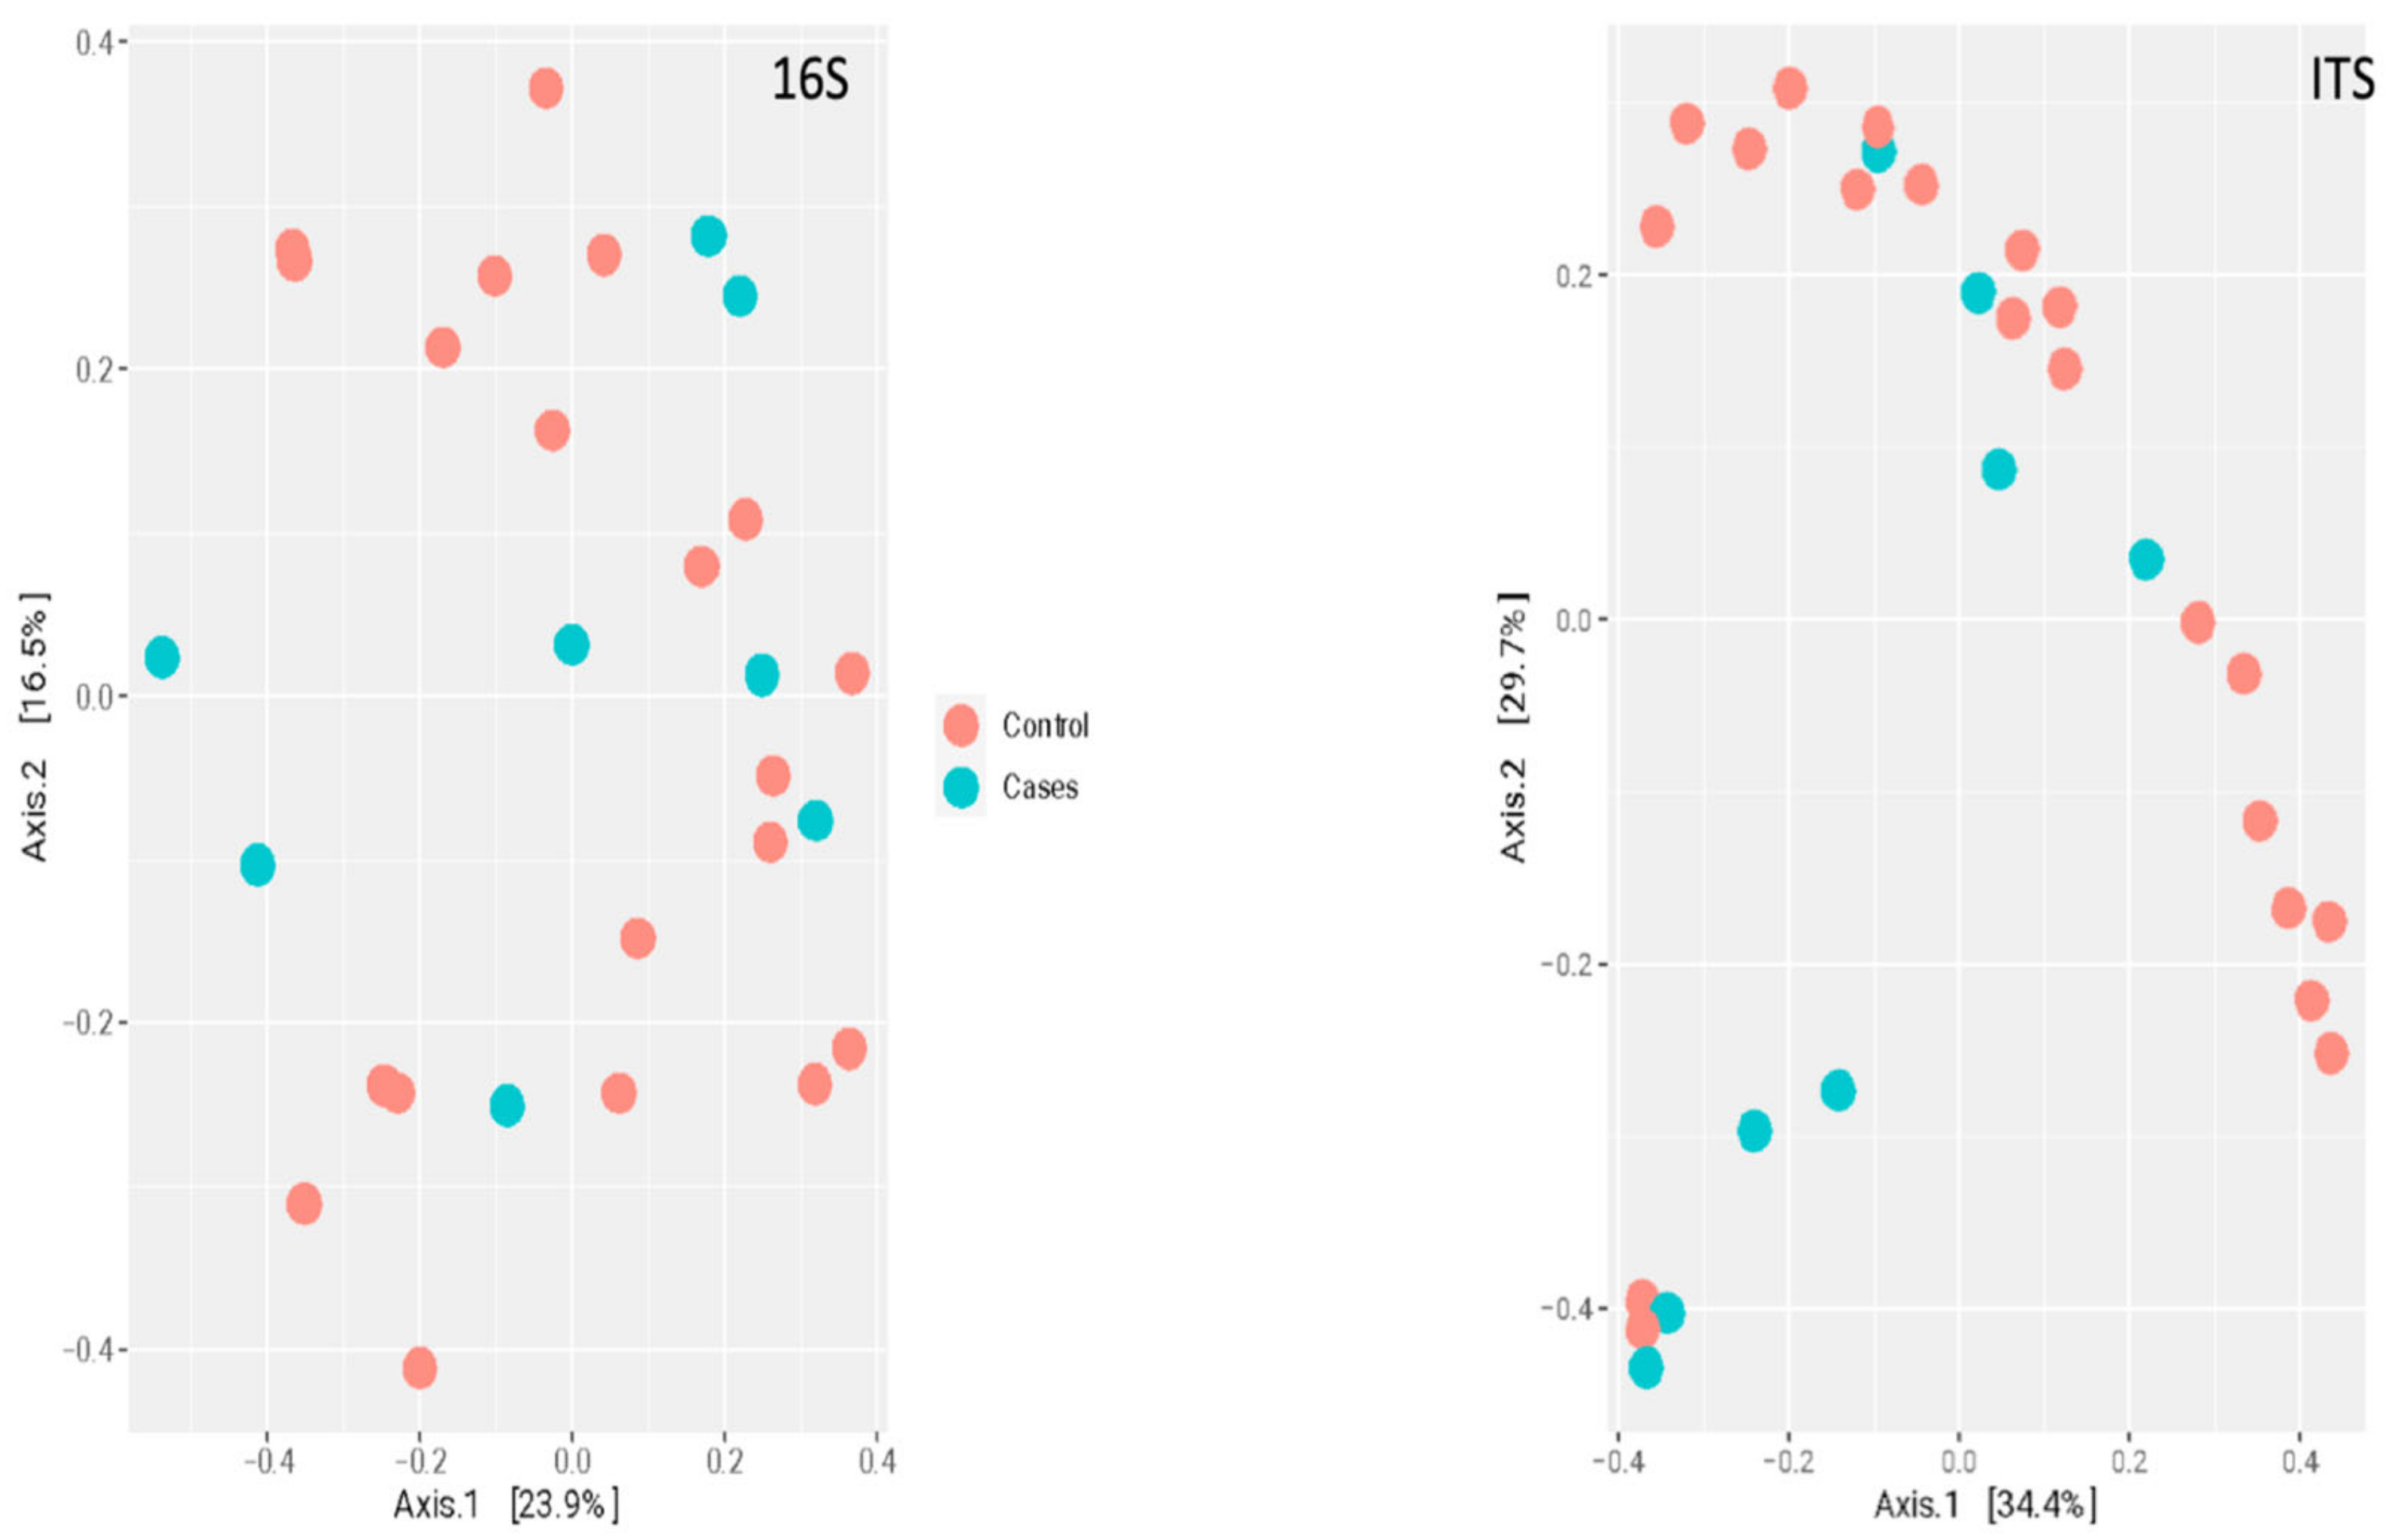
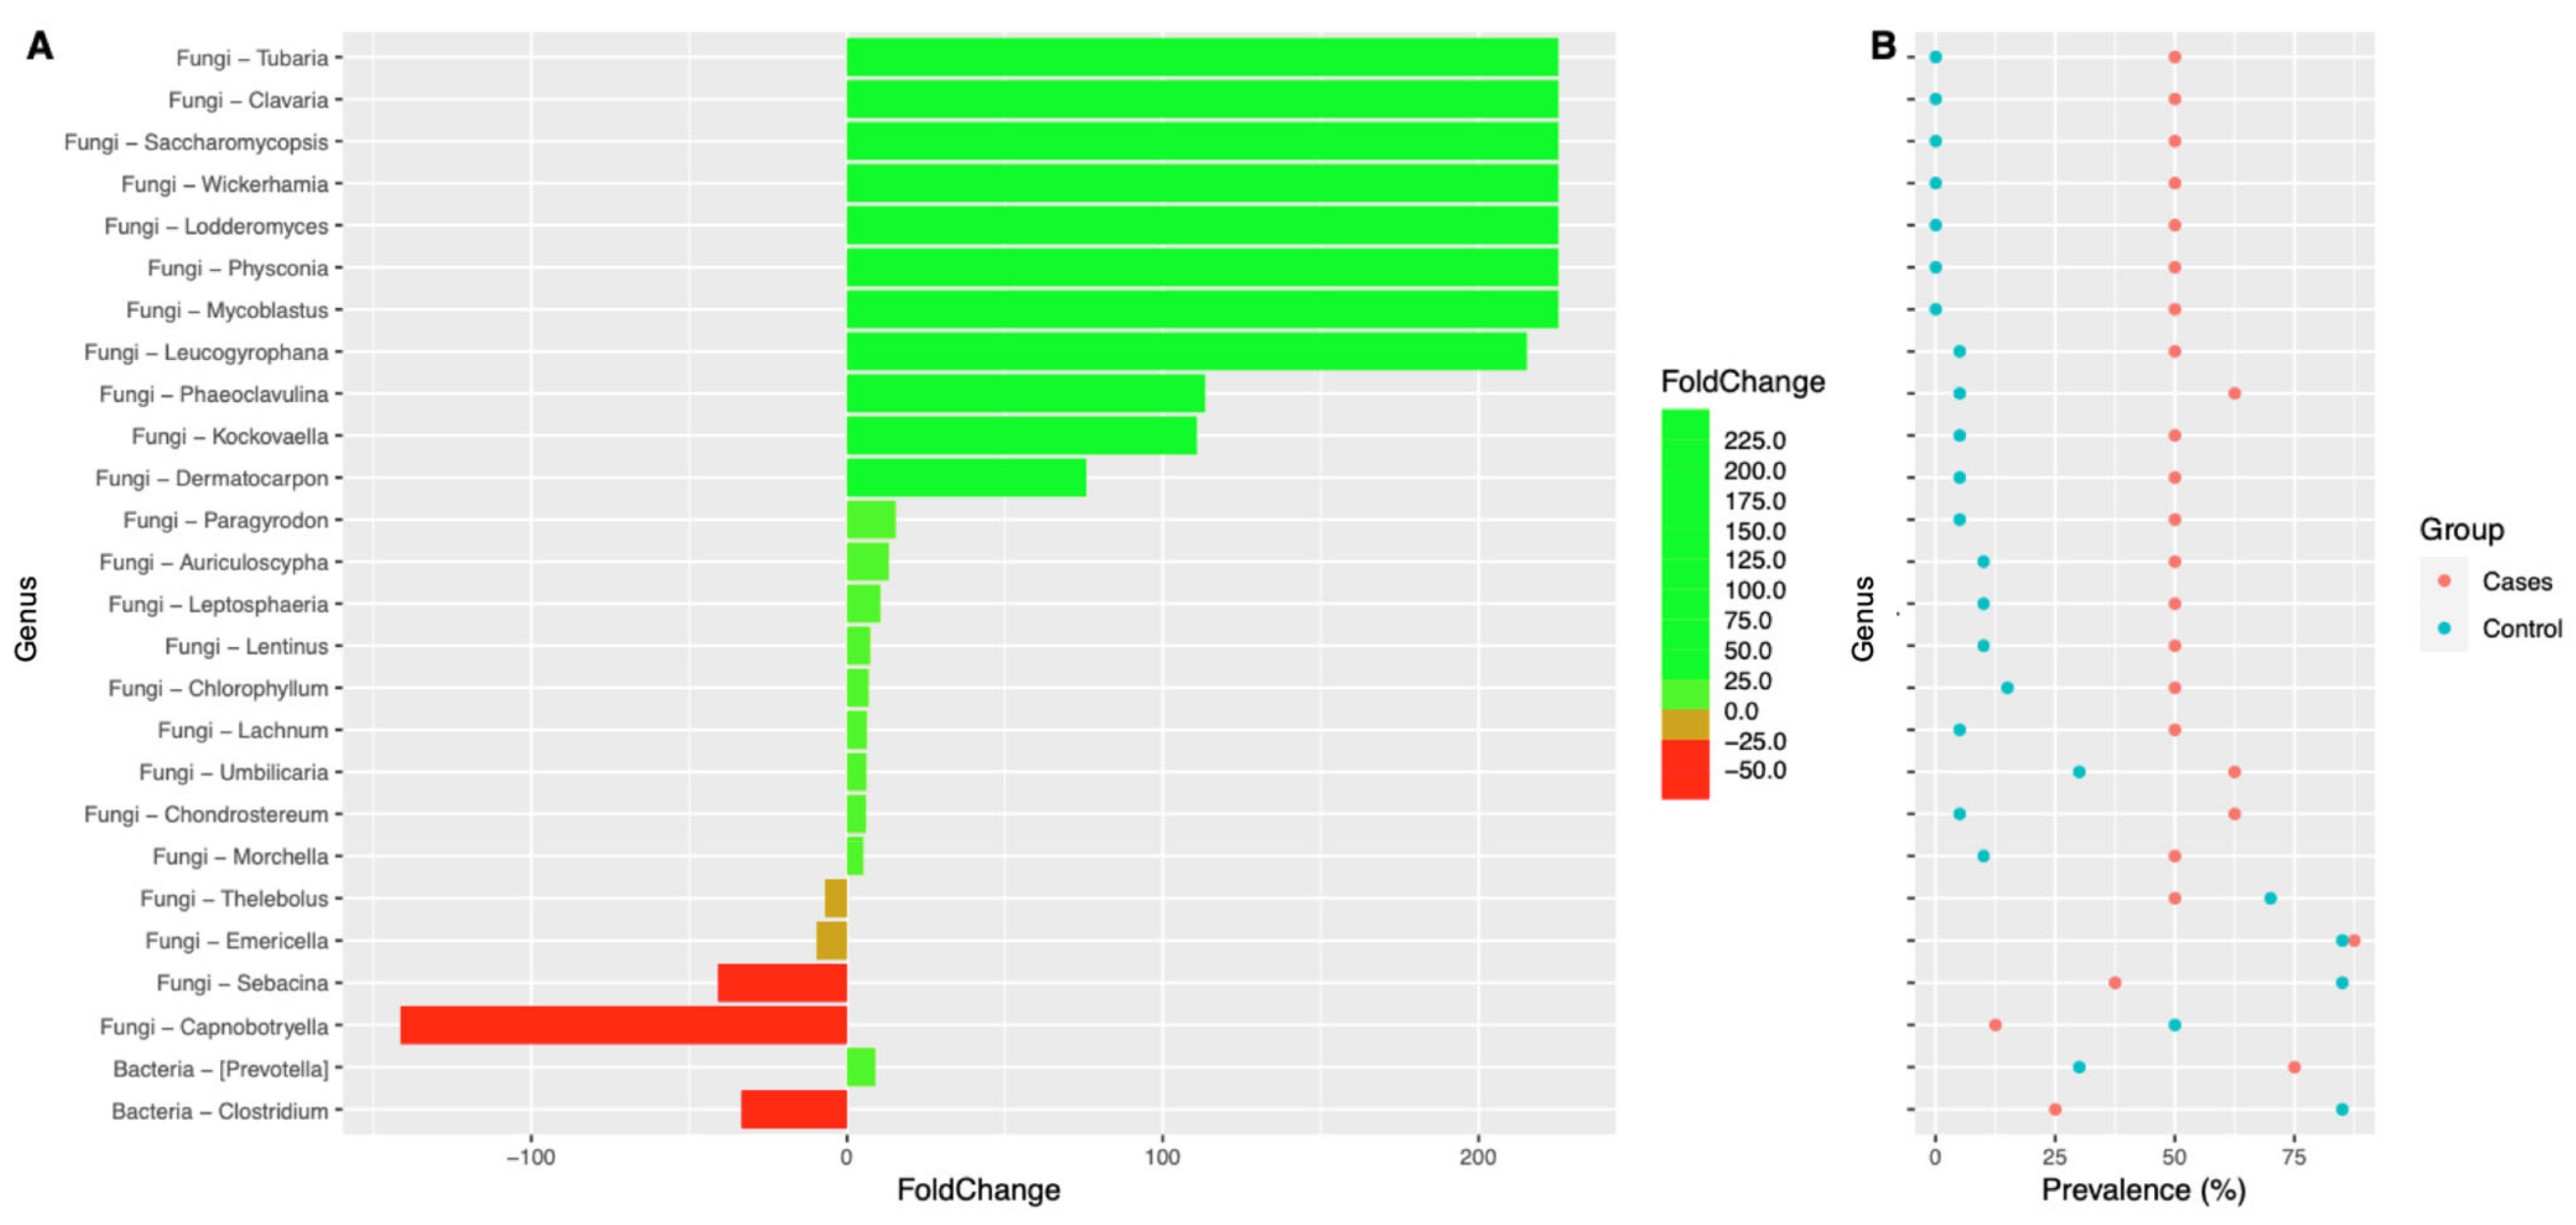
2. Results
3. Discussion
4. Materials and Methods
4.1. Sample Collection and Processing
4.2. Bioinformatic Analysis
4.3. Pre-Processing and Quality Control
4.4. Data Exploration and Data Analysis
5. Conclusions
Supplementary Materials
Author Contributions
Funding
Institutional Review Board Statement
Informed Consent Statement
Data Availability Statement
Acknowledgments
Conflicts of Interest
Appendix A. Detailed Explanation of DNA Extraction, PCR Amplification, and Sequencing
Appendix A.1. DNA Extraction
Appendix A.2. PCR Amplification
Appendix A.3. Library Preparation and Sequencing
References
- Davies, J.; Davies, D. Origins and evolution of antibiotic resistance. Microbiol. Mol. Biol. Rev. 2010, 74, 417–433. [Google Scholar] [CrossRef] [PubMed]
- Jakobsson, H.E.; Jernberg, C.; Andersson, A.F.; Sjölund-Karlsson, M.; Jansson, J.K.; Engstrand, L. Short-term antibiotic treatment has differing long-term impacts on the human throat and gut microbiome. PLoS ONE 2010, 5, e9836. [Google Scholar] [CrossRef] [PubMed]
- Subirats, J.; Domingues, A.; Topp, E. Does dietary consumption of antibiotics by humans promote antibiotic resistance in the gut microbiome? J. Food Prot. 2019, 82, 1636–1642. [Google Scholar] [CrossRef] [PubMed]
- Azad, M.; Bridgman, S.; Becker, A.; Kozyrskyj, A. Infant antibiotic exposure and the development of childhood overweight and central adiposity. Int. J. Obes. 2014, 38, 1290–1298. [Google Scholar] [CrossRef] [PubMed]
- Cox, L.M.; Yamanishi, S.; Sohn, J.; Alekseyenko, A.V.; Leung, J.M.; Cho, I.; Kim, S.G.; Li, H.; Gao, Z.; Mahana, D. Altering the intestinal microbiota during a critical developmental window has lasting metabolic consequences. Cell 2014, 158, 705–721. [Google Scholar] [CrossRef] [PubMed]
- Bokulich, N.A.; Chung, J.; Battaglia, T.; Henderson, N.; Jay, M.; Li, H.; Lieber, A.D.; Wu, F.; Perez-Perez, G.I.; Chen, Y. Antibiotics, birth mode, and diet shape microbiome maturation during early life. Sci. Transl. Med. 2016, 8, 343ra82. [Google Scholar] [CrossRef] [PubMed]
- Azad, M.B.; Konya, T.; Persaud, R.R.; Guttman, D.S.; Chari, R.S.; Field, C.J.; Sears, M.R.; Mandhane, P.; Turvey, S.; Subbarao, P. Impact of maternal intrapartum antibiotics, method of birth and breastfeeding on gut microbiota during the first year of life: A prospective cohort study. BJOG Int. J. Obstet. Gynaecol. 2016, 123, 983–993. [Google Scholar] [CrossRef]
- Ramirez, J.; Guarner, F.; Fernandez, L.B.; Maruy, A.; Sdepanian, V.L.; Cohen, H. Antibiotics as major disruptors of gut microbiota. Front. Cell. Infect. Microbiol. 2020, 10, 572912. [Google Scholar] [CrossRef]
- Mikkelsen, K.H.; Frost, M.; Bahl, M.I.; Licht, T.R.; Jensen, U.S.; Rosenberg, J.; Pedersen, O.; Hansen, T.; Rehfeld, J.F.; Holst, J.J. Effect of antibiotics on gut microbiota, gut hormones and glucose metabolism. PLoS ONE 2015, 10, e0142352. [Google Scholar] [CrossRef]
- Feng, Y.; Huang, Y.; Wang, Y.; Wang, P.; Song, H.; Wang, F. Antibiotics induced intestinal tight junction barrier dysfunction is associated with microbiota dysbiosis, activated NLRP3 inflammasome and autophagy. PLoS ONE 2019, 14, e0218384. [Google Scholar] [CrossRef]
- Zimmermann, P.; Curtis, N. The effect of antibiotics on the composition of the intestinal microbiota—A systematic review. J. Infect. 2019, 79, 471–489. [Google Scholar] [CrossRef] [PubMed]
- Lange, K.; Buerger, M.; Stallmach, A.; Bruns, T. Effects of antibiotics on gut microbiota. Dig. Dis. 2016, 34, 260–268. [Google Scholar] [CrossRef] [PubMed]
- Ianiro, G.; Tilg, H.; Gasbarrini, A. Antibiotics as deep modulators of gut microbiota: Between good and evil. Gut 2016, 65, 1906–1915. [Google Scholar] [CrossRef]
- Ponziani, F.R.; Scaldaferri, F.; Petito, V.; Sterbini, F.P.; Pecere, S.; Lopetuso, L.R.; Palladini, A.; Gerardi, V.; Masucci, L.; Pompili, M. The role of antibiotics in gut microbiota modulation: The eubiotic effects of rifaximin. Dig. Dis. 2016, 34, 269–278. [Google Scholar] [CrossRef]
- Ponziani, F.R.; Zocco, M.A.; D’Aversa, F.; Pompili, M.; Gasbarrini, A. Eubiotic properties of rifaximin: Disruption of the traditional concepts in gut microbiota modulation. World J. Gastroenterol. 2017, 23, 4491–4499. [Google Scholar] [CrossRef] [PubMed]
- Basu, S.; Smith, S. Macrolides for the prevention and treatment of feeding intolerance in preterm low birth weight infants: A systematic review and meta-analysis. Eur. J. Pediatr. 2021, 180, 353–378. [Google Scholar] [CrossRef] [PubMed]
- Patel, A.; Meesters, K. Macrolides in children: Judicious use, avoiding resistance and reducing adverse effects. Arch. Dis. Child. Educ. Pract. 2021, 106, 216–219. [Google Scholar] [CrossRef]
- Jaggi, P.; Hamdy, R.F.; Lee, B.; Hersh, A.L.; Gerber, J.S.; Sharland, M.; Terrill, C.; Newland, J.G. Use of antimicrobial agents in hospitalized children for noninfectious indications. J. Pediatr. Infect. Dis. Soc. 2020, 9, 490–493. [Google Scholar] [CrossRef] [PubMed]
- Costalos, C.; Gounaris, A.; Varhalama, E.; Kokori, F.; Alexiou, N.; Kolovou, E. Erythromycin as a prokinetic agent in preterm infants. J. Pediatr. Gastroenterol. Nutr. 2002, 34, 23–25. [Google Scholar] [CrossRef] [PubMed]
- Peeters, T.; Matthijs, G.; Depoortere, I.; Cachet, T.; Hoogmartens, J.; Vantrappen, G. Erythromycin is a motilin receptor agonist. Am. J. Physiol. Gastrointest. Liver Physiol. 1989, 257, G470–G474. [Google Scholar] [CrossRef]
- Curry, J.; Lander, T.; Stringer, M. Erythromycin as a prokinetic agent in infants and children. Aliment. Pharmacol. Ther. 2001, 15, 595–603. [Google Scholar] [CrossRef] [PubMed]
- Patole, S.; Rao, S.; Doherty, D. Erythromycin as a prokinetic agent in preterm neonates: A systematic review. Arch. Dis. Child. Fetal Neonatal Ed. 2005, 90, F301–F306. [Google Scholar] [CrossRef]
- Mougey, E.B.; Saunders, M.; Franciosi, J.P.; Gomez-Suarez, R.A. Comparative Effectiveness of Intravenous Azithromycin versus Erythromycin Stimulating Antroduodenal Motility in Children. J. Pediatr. Gastroenterol. Nutr. 2022, 74, 25–32. [Google Scholar] [CrossRef] [PubMed]
- Mondal, S.; Khuntdar, B.K. Is Erythromycin Useful for Dysmotility of Prematurity?: A Randomised Controlled Trial in a Neonatal Unit of a Rural Medical College, India. Int. J. Sci. Res. 2020, 9, 1011–1013. [Google Scholar]
- Rodriguez, L.; Irani, K.; Jiang, H.; Goldstein, A.M. Clinical presentation, response to therapy, and outcome of gastroparesis in children. J. Pediatr. Gastroenterol. Nutr. 2012, 55, 185–190. [Google Scholar] [CrossRef] [PubMed]
- Ng, Y.-Y.; Su, P.-H.; Chen, J.-Y.; Quek, Y.-W.; Hu, J.-M.; Lee, I.-C.; Lee, H.-S.; Chang, H.-P. Efficacy of intermediate-dose oral erythromycin on very low birth weight infants with feeding intolerance. Pediatr. Neonatol. 2012, 53, 34–40. [Google Scholar] [CrossRef] [PubMed]
- Ng, P.; So, K.; Fung, K.; Lee, C.; Fok, T.; Wong, E.; Wong, W.; Cheung, K.; Cheng, A. Randomised controlled study of oral erythromycin for treatment of gastrointestinal dysmotility in preterm infants. Arch. Dis. Child. Fetal Neonatal Ed. 2001, 84, F177–F182. [Google Scholar] [CrossRef]
- Chicella, M.F.; Batres, L.A.; Heesters, M.S.; Dice, J.E. Prokinetic drug therapy in children: A review of current options. Ann. Pharmacother. 2005, 39, 706–711. [Google Scholar] [CrossRef] [PubMed]
- di Lorenzo, C.; Flores, A.F.; Tomomasa, T.; Hyman, P.E. Effect of erythromycin on antroduodenal motility in children with chronic functional gastrointestinal symptoms. Dig. Dis. Sci. 1994, 39, 1399–1404. [Google Scholar] [CrossRef]
- Aanpreung, P.; Vajaradul, C. Clinical use of erythromycin in children with gastrointestinal dysmotility. J. Med. Assoc. Thail.–Chotmaihet Thangphaet 2001, 84, 1021–1026. [Google Scholar]
- Benninga, M.A.; Nurko, S.; Faure, C.; Hyman, P.E.; Roberts, I.S.J.; Schechter, N.L. Childhood functional gastrointestinal disorders: Neonate/toddler. Gastroenterology 2016, 150, 1443–1455.e2. [Google Scholar] [CrossRef]
- Chumpitazi, B.; Nurko, S. Pediatric gastrointestinal motility disorders: Challenges and a clinical update. Gastroenterol. Hepatol. 2008, 4, 140. [Google Scholar]
- Turunen, J.; Paalanne, N.; Reunanen, J.; Tapiainen, T.; Tejesvi, M.V. Development of gut mycobiome in infants and young children: A prospective cohort study. Pediatr. Res. 2023, 94, 486–494. [Google Scholar] [CrossRef] [PubMed]
- Haak, B.W.; Argelaguet, R.; Kinsella, C.M.; Kullberg, R.F.; Lankelma, J.M.; Deijs, M.; Klein, M.; Jebbink, M.F.; Hugenholtz, F.; Kostidis, S. Integrative transkingdom analysis of the gut microbiome in antibiotic perturbation and critical illness. mSystems 2021, 6, e01148-20. [Google Scholar] [CrossRef]
- Van Zyl, K.N.; Matukane, S.R.; Hamman, B.L.; Whitelaw, A.C.; Newton-Foot, M. Effect of antibiotics on the human microbiome: A systematic review. Int. J. Antimicrob. Agents 2022, 59, 106502. [Google Scholar] [CrossRef] [PubMed]
- Chin, V.K.; Yong, V.C.; Chong, P.P.; Nordin, S.A.; Basir, R.; Abdullah, M. Mycobiome in the gut: A multiperspective review. Mediat. Inflamm. 2020, 2020, 9560684. [Google Scholar] [CrossRef]
- Boutin, R.C.; Sbihi, H.; McLaughlin, R.J.; Hahn, A.S.; Konwar, K.M.; Loo, R.S.; Dai, D.; Petersen, C.; Brinkman, F.S.; Winsor, G.L. Composition and associations of the infant gut fungal microbiota with environmental factors and childhood allergic outcomes. Mbio 2021, 12, e03396-20. [Google Scholar] [CrossRef] [PubMed]
- Nash, A.K.; Auchtung, T.A.; Wong, M.C.; Smith, D.P.; Gesell, J.R.; Ross, M.C.; Stewart, C.J.; Metcalf, G.A.; Muzny, D.M.; Gibbs, R.A. The gut mycobiome of the Human Microbiome Project healthy cohort. Microbiome 2017, 5, 153. [Google Scholar] [CrossRef]
- Gamal, A.; Elshaer, M.; Alabdely, M.; Kadry, A.; McCormick, T.S.; Ghannoum, M. The mycobiome: Cancer pathogenesis, diagnosis, and therapy. Cancers 2022, 14, 2875. [Google Scholar] [CrossRef]
- Mishra, K.; Bukavina, L.; Ghannoum, M. Symbiosis and dysbiosis of the human mycobiome. Front. Microbiol. 2021, 12, 636131. [Google Scholar] [CrossRef] [PubMed]
- Hu, X.; Chang, Y.; Wang, Z.; Bao, W.; Li, Z. Altered gut microbiota is associated with feeding intolerance in preterm infants. Turk. J. Pediatr. 2021, 63, 206–217. [Google Scholar] [CrossRef] [PubMed]
- Yuan, Z.; Yan, J.; Wen, H.; Deng, X.; Li, X.; Su, S. Feeding intolerance alters the gut microbiota of preterm infants. PLoS ONE 2019, 14, e0210609. [Google Scholar] [CrossRef] [PubMed]
- Fishbein, S.R.; Mahmud, B.; Dantas, G. Antibiotic perturbations to the gut microbiome. Nat. Rev. Microbiol. 2023, 1–17. [Google Scholar] [CrossRef] [PubMed]
- McDonnell, L.; Gilkes, A.; Ashworth, M.; Rowland, V.; Harries, T.H.; Armstrong, D.; White, P. Association between antibiotics and gut microbiome dysbiosis in children: Systematic review and meta-analysis. Gut Microbes 2021, 13, 1870402. [Google Scholar] [CrossRef]
- Jin, Y.; Wu, Y.; Zeng, Z.; Jin, C.; Wu, S.; Wang, Y.; Fu, Z. From the cover: Exposure to oral antibiotics induces gut microbiota dysbiosis associated with lipid metabolism dysfunction and low-grade inflammation in mice. Toxicol. Sci. 2016, 154, 140–152. [Google Scholar] [CrossRef] [PubMed]
- Burr, L.D.; Taylor, S.L.; Richard, A.; Schreiber, V.; Lingman, S.; Martin, M.; Papanicolas, L.E.; Choo, J.M.; Rogers, G.B. Assessment of Long-Term Macrolide Exposure on the Oropharyngeal Microbiome and Macrolide Resistance in Healthy Adults and Consequences for Onward Transmission of Resistance. Antimicrob. Agents Chemother. 2022, 66, e02246-21. [Google Scholar] [CrossRef]
- Hofman, D.; Kudla, U.; Miqdady, M.; Nguyen, T.V.H.; Morán-Ramos, S.; Vandenplas, Y. Faecal microbiota in infants and young children with functional gastrointestinal disorders: A systematic review. Nutrients 2022, 14, 974. [Google Scholar] [CrossRef] [PubMed]
- Rizzatti, G.; Lopetuso, L.; Gibiino, G.; Binda, C.; Gasbarrini, A. Proteobacteria: A common factor in human diseases. BioMed Res. Int. 2017, 2017, 9351507. [Google Scholar] [CrossRef] [PubMed]
- Shin, N.-R.; Whon, T.W.; Bae, J.-W. Proteobacteria: Microbial signature of dysbiosis in gut microbiota. Trends Biotechnol. 2015, 33, 496–503. [Google Scholar] [CrossRef] [PubMed]
- Bradley, P.H.; Pollard, K.S. Proteobacteria explain significant functional variability in the human gut microbiome. Microbiome 2017, 5, 36. [Google Scholar] [CrossRef]
- Bai, J.; Hu, Y.; Bruner, D. Composition of gut microbiota and its association with body mass index and lifestyle factors in a cohort of 7–18 years old children from the American Gut Project. Pediatr. Obes. 2019, 14, e12480. [Google Scholar] [CrossRef] [PubMed]
- Litvak, Y.; Byndloss, M.X.; Tsolis, R.M.; Bäumler, A.J. Dysbiotic Proteobacteria expansion: A microbial signature of epithelial dysfunction. Curr. Opin. Microbiol. 2017, 39, 1–6. [Google Scholar] [CrossRef]
- Yoon, J.B.; Hwang, S.; Yang, J.H.; Lee, S.; Bang, W.Y.; Moon, K.H. Dynamics of the gut microbiome and transcriptome in Korea native ricefish (Oryzias latipes) during chronic antibiotic exposure. Genes 2022, 13, 1243. [Google Scholar] [CrossRef]
- Santiago, G.L.D.S.; Brusselle, G.; Dauwe, K.; Deschaght, P.; Verhofstede, C.; Vaneechoutte, D.; Deschepper, E.; Jordens, P.; Joos, G.; Vaneechoutte, M. Influence of chronic azithromycin treatment on the composition of the oropharyngeal microbial community in patients with severe asthma. BMC Microbiol. 2017, 17, 109. [Google Scholar] [CrossRef]
- Taylor, S.L.; Leong, L.E.; Mobegi, F.M.; Choo, J.M.; Wesselingh, S.; Yang, I.A.; Upham, J.W.; Reynolds, P.N.; Hodge, S.; James, A.L. Long-term azithromycin reduces Haemophilus influenzae and increases antibiotic resistance in severe asthma. Am. J. Respir. Crit. Care Med. 2019, 200, 309–317. [Google Scholar] [CrossRef] [PubMed]
- Segal, L.N.; Clemente, J.C.; Wu, B.G.; Wikoff, W.R.; Gao, Z.; Li, Y.; Ko, J.P.; Rom, W.N.; Blaser, M.J.; Weiden, M.D. Randomised, double-blind, placebo-controlled trial with azithromycin selects for anti-inflammatory microbial metabolites in the emphysematous lung. Thorax 2017, 72, 13–22. [Google Scholar] [CrossRef] [PubMed]
- Deering, K.E.; Devine, A.; O’Sullivan, T.A.; Lo, J.; Boyce, M.C.; Christophersen, C.T. Characterizing the composition of the pediatric gut microbiome: A systematic review. Nutrients 2019, 12, 16. [Google Scholar] [CrossRef] [PubMed]
- Hill, C.J.; Lynch, D.B.; Murphy, K.; Ulaszewska, M.; Jeffery, I.B.; O’Shea, C.A.; Watkins, C.; Dempsey, E.; Mattivi, F.; Tuohy, K. Evolution of gut microbiota composition from birth to 24 weeks in the INFANTMET Cohort. Microbiome 2017, 5, 4. [Google Scholar] [CrossRef]
- Penders, J.; van Best, N. The Development of the Gut Microbiota in Childhood and Its Distortion by Lifestyle Changes. In Evolution, Biodiversity and a Reassessment of the Hygiene Hypothesis. Progress in Inflammation Research; Rook, G.A.W., Lowry, C.A., Eds.; Springer: Cham, Switzerland, 2022; Volume 89, pp. 197–219. [Google Scholar] [CrossRef]
- Seelbinder, B.; Chen, J.; Brunke, S.; Vazquez-Uribe, R.; Santhaman, R.; Meyer, A.-C.; de Oliveira Lino, F.S.; Chan, K.-F.; Loos, D.; Imamovic, L. Antibiotics create a shift from mutualism to competition in human gut communities with a longer-lasting impact on fungi than bacteria. Microbiome 2020, 8, 133. [Google Scholar] [CrossRef]
- Belvoncikova, P.; Splichalova, P.; Videnska, P.; Gardlik, R. The human mycobiome: Colonization, composition and the role in health and disease. J. Fungi 2022, 8, 1046. [Google Scholar] [CrossRef]
- Schei, K.; Avershina, E.; Øien, T.; Rudi, K.; Follestad, T.; Salamati, S.; Ødegård, R.A. Early gut mycobiota and mother-offspring transfer. Microbiome 2017, 5, 107. [Google Scholar] [CrossRef] [PubMed]
- Li, Q.; Wang, C.; Tang, C.; He, Q.; Li, N.; Li, J. Dysbiosis of gut fungal microbiota is associated with mucosal inflammation in Crohn’s disease. J. Clin. Gastroenterol. 2014, 48, 513–523. [Google Scholar] [CrossRef]
- Richard, M.L.; Sokol, H. The gut mycobiota: Insights into analysis, environmental interactions and role in gastrointestinal diseases. Nat. Rev. Gastroenterol. Hepatol. 2019, 16, 331–345. [Google Scholar] [CrossRef] [PubMed]
- Chehoud, C.; Albenberg, L.G.; Judge, C.; Hoffmann, C.; Grunberg, S.; Bittinger, K.; Baldassano, R.N.; Lewis, J.D.; Bushman, F.D.; Wu, G.D. Fungal signature in the gut microbiota of pediatric patients with inflammatory bowel disease. Inflamm. Bowel Dis. 2015, 21, 1948–1956. [Google Scholar] [CrossRef]
- Kumamoto, C.A. Inflammation and gastrointestinal Candida colonization. Curr. Opin. Microbiol. 2011, 14, 386–391. [Google Scholar] [CrossRef] [PubMed]
- Sokol, H.; Leducq, V.; Aschard, H.; Pham, H.-P.; Jegou, S.; Landman, C.; Cohen, D.; Liguori, G.; Bourrier, A.; Nion-Larmurier, I. Fungal microbiota dysbiosis in IBD. Gut 2017, 66, 1039–1048. [Google Scholar] [CrossRef] [PubMed]
- Proctor, D.M.; Drummond, R.A.; Lionakis, M.S.; Segre, J.A. One population, multiple lifestyles: Commensalism and pathogenesis in the human mycobiome. Cell Host Microbe 2023, 31, 539–553. [Google Scholar] [CrossRef] [PubMed]
- Ventin-Holmberg, R.; Saqib, S.; Korpela, K.; Nikkonen, A.; Peltola, V.; Salonen, A.; de Vos, W.M.; Kolho, K.-L. The effect of antibiotics on the infant gut fungal microbiota. J. Fungi 2022, 8, 328. [Google Scholar] [CrossRef]
- Mason, K.L.; Downward, J.R.E.; Mason, K.D.; Falkowski, N.R.; Eaton, K.A.; Kao, J.Y.; Young, V.B.; Huffnagle, G.B. Candida albicans and bacterial microbiota interactions in the cecum during recolonization following broad-spectrum antibiotic therapy. Infect. Immun. 2012, 80, 3371–3380. [Google Scholar] [CrossRef]
- Hani, U.; Shivakumar, H.G.; Vaghela, R.; Osmani, A.M.; Shrivastava, A. Candidiasis: A fungal infection-current challenges and progress in prevention and treatment. Infect. Disord. Drug Targets (Former. Curr. Drug Targets-Infect. Disord.) 2015, 15, 42–52. [Google Scholar] [CrossRef] [PubMed]
- Seelig, M.S. Mechanisms by which antibiotics increase the incidence and severity of candidiasis and alter the immunological defenses. Bacteriol. Rev. 1966, 30, 442–459. [Google Scholar] [CrossRef]
- Samonis, G.; Gikas, A.; Anaissie, E.; Vrenzos, G.; Maraki, S.; Tselentis, Y.; Bodey, G. Prospective evaluation of effects of broad-spectrum antibiotics on gastrointestinal yeast colonization of humans. Antimicrob. Agents Chemother. 1993, 37, 51–53. [Google Scholar] [CrossRef] [PubMed]
- Nguyen, L.N.; Lopes, L.C.L.; Cordero, R.J.; Nosanchuk, J.D. Sodium butyrate inhibits pathogenic yeast growth and enhances the functions of macrophages. J. Antimicrob. Chemother. 2011, 66, 2573–2580. [Google Scholar] [CrossRef] [PubMed]
- Guinan, J.; Wang, S.; Hazbun, T.R.; Yadav, H.; Thangamani, S. Antibiotic-induced decreases in the levels of microbial-derived short-chain fatty acids correlate with increased gastrointestinal colonization of Candida albicans. Sci. Rep. 2019, 9, 8872. [Google Scholar] [CrossRef] [PubMed]
- Kennedy, M.J.; Volz, P.A. Effect of various antibiotics on gastrointestinal colonization and dissemination by Candida albicans. Sabouraudia J. Med. Vet. Mycol. 1985, 23, 265–273. [Google Scholar] [CrossRef] [PubMed]
- Ghannoum, M. Cooperative evolutionary strategy between the bacteriome and mycobiome. Mbio 2016, 7, e01951-16. [Google Scholar] [CrossRef]
- Hoarau, G.; Mukherjee, P.; Gower-Rousseau, C.; Hager, C.; Chandra, J.; Retuerto, M.; Neut, C.; Vermeire, S.; Clemente, J.; Colombel, J.-F. Bacteriome and mycobiome interactions underscore microbial dysbiosis in familial Crohn’s disease. Mbio 2016, 7, e01250-16. [Google Scholar] [CrossRef]
- Alharfi, S.; Furey, N.; Al-Shakhshir, H.; Ghannoum, M.; Cooper, G.S. Fecal Microbiome Associated with Both Colon Adenomas and Lifetime Colorectal Cancer Risk. Dig. Dis. Sci. 2022, 68, 1492–1499. [Google Scholar] [CrossRef]
- Mohamed, A.; Asa, S.L.; McCormick, T.; Al-Shakhshir, H.; Dasari, A.; Mauricio, R.; Salem, I.; Ocuin, L.M.; Bajor, D.; Lee, R.T. The Role of the Microbiome in Gastroentero-Pancreatic Neuroendocrine Neoplasms (GEP-NENs). Curr. Issues Mol. Biol. 2022, 44, 2015–2028. [Google Scholar] [CrossRef]
- Consortium, H.M.P. Structure, function and diversity of the healthy human microbiome. Nature 2012, 486, 207–214. [Google Scholar]
- White, T.J.; Bruns, T.; Lee, S.; Taylor, J. Amplification and direct sequencing of fungal ribosomal RNA genes for phylogenetics. In PCR Protocols: A Guide to Methods and Applications; Academic Press: New York, NY, USA, 1990; Volume 18, pp. 315–322. [Google Scholar]


| Variables at the Time of Enrollment | EES Group (N = 8) | Control Group (N = 20) | p-Value |
|---|---|---|---|
| Age (in months) | 20 (14, 42) | 18 (9, 27) | 0.28 |
| Gender | |||
| Female | 4 (50%) | 5 (25%) | 0.20 |
| Male | 4 (50%) | 15 (75%) | |
| Weight (in Kg) | 11.2 (9.1, 13.6) | 9.8 (8.6, 11.2) | 0.42 |
| Length/height (in cm) | 82 (73, 100) | 79 (71, 86) | 0.33 |
| Malnutrition | 1 (12%) | 3 (15%) | 0.17 |
| Acid suppression therapy | 4 (50%) | 6 (30%) | 0.10 |
| Length of EES therapy (in weeks) | |||
| 4 | 1 (12%) | ||
| 8 | 1 (12%) | ||
| 12 | 3 (38%) | ||
| 20 | 1 (12%) | ||
| 24 | 1 (12%) | ||
| 32 | 1 (12%) | ||
Disclaimer/Publisher’s Note: The statements, opinions and data contained in all publications are solely those of the individual author(s) and contributor(s) and not of MDPI and/or the editor(s). MDPI and/or the editor(s) disclaim responsibility for any injury to people or property resulting from any ideas, methods, instructions or products referred to in the content. |
© 2023 by the authors. Licensee MDPI, Basel, Switzerland. This article is an open access article distributed under the terms and conditions of the Creative Commons Attribution (CC BY) license (https://creativecommons.org/licenses/by/4.0/).
Share and Cite
Thavamani, A.; Sankararaman, S.; Al-Shakhshir, H.; Retuerto, M.; Velayuthan, S.; Sferra, T.J.; Ghannoum, M. Impact of Erythromycin as a Prokinetic on the Gut Microbiome in Children with Feeding Intolerance—A Pilot Study. Antibiotics 2023, 12, 1606. https://doi.org/10.3390/antibiotics12111606
Thavamani A, Sankararaman S, Al-Shakhshir H, Retuerto M, Velayuthan S, Sferra TJ, Ghannoum M. Impact of Erythromycin as a Prokinetic on the Gut Microbiome in Children with Feeding Intolerance—A Pilot Study. Antibiotics. 2023; 12(11):1606. https://doi.org/10.3390/antibiotics12111606
Chicago/Turabian StyleThavamani, Aravind, Senthilkumar Sankararaman, Hilmi Al-Shakhshir, Mauricio Retuerto, Sujithra Velayuthan, Thomas J. Sferra, and Mahmoud Ghannoum. 2023. "Impact of Erythromycin as a Prokinetic on the Gut Microbiome in Children with Feeding Intolerance—A Pilot Study" Antibiotics 12, no. 11: 1606. https://doi.org/10.3390/antibiotics12111606
APA StyleThavamani, A., Sankararaman, S., Al-Shakhshir, H., Retuerto, M., Velayuthan, S., Sferra, T. J., & Ghannoum, M. (2023). Impact of Erythromycin as a Prokinetic on the Gut Microbiome in Children with Feeding Intolerance—A Pilot Study. Antibiotics, 12(11), 1606. https://doi.org/10.3390/antibiotics12111606