Abstract
Exhaled breath analysis is emerging as one of the most promising non-invasive strategies for the early detection of life-threatening diseases, especially lung cancer, where rapid and reliable diagnosis remains a major clinical challenge. In this study, we designed and optimized an electronic nose (e-nose) platform composed of quantum resistive vapor sensors (vQRSs) engineered by polymer-carbon nanotube nanocomposites via spray layer-by-layer assembly. Each sensor was tailored through specific polymer functionalization to tune selectivity and enhance sensitivity toward volatile organic compounds (VOCs) of medical relevance. The sensor array, combined with linear discriminant analysis (LDA), demonstrated the ability to accurately discriminate between cancer-related biomarkers in synthetic blends, even when present at trace concentrations within complex volatile backgrounds. Beyond artificial mixtures, the system successfully distinguished real exhaled breath samples collected under challenging conditions, including before and after smoking and alcohol consumption. These results not only validate the robustness and reproducibility of the vQRS-based array but also highlight its potential as a versatile diagnostic tool. Overall, this work underscores the relevance of nanocomposite chemo-resistive arrays for breathomics and paves the way for their integration into future portable e-nose devices dedicated to telemedicine, continuous monitoring, and early-stage disease diagnosis.
1. Introduction
Human exhaled breath analysis is an effective method for the early diagnosis of various fatal diseases [] and has been gaining popularity over the past ten years. This approach was first introduced by Pauling et al. [], who detected more than two hundred VOCs in human breath. Some of these VOCs have been identified as disease biomarkers, sometimes specific to certain pathologies. Precise detection of VOCs in exhaled breath can lead to early-stage identification of diseases and could potentially replace or precede existing clinical diagnostic tools. Human exhaled breath provides information about the condition and health of the body [,,]. The detection of biomarkers in exhaled breath remains a challenge at the clinical level, but it offers one of the simplest methods for the early detection of lung cancer [,,,,]. It has many advantages, including low cost, painless procedures, ease of operation, repeatability, and most importantly, non-invasiveness [,,,], i.e., gas-phase testing is easier than the examination of biological tissue or blood [,]. Most VOCs present in breath are exogenous, meaning that they result from environmental exposure. For diagnostic purposes, endogenous VOCs (produced as by-products of the body’s metabolic activities, such as pentane, isoprene, ketones, aldehydes, mercaptans, and amines) have been listed as important targets []. However, exhaled breath contains very low amounts of these biomarkers, typically at ppb or ppt levels []. This low concentration range depends on the body’s condition, as sick individuals generally show higher biomarker levels compared to healthy ones. In the literature, several biomarkers have been identified as related to specific diseases, some of which are listed in Figure 1 [,,,,,,]. For instance, diabetes patients have acetonic breath [,], toluene is a biomarker for lung cancer [,,,,], ammonia and nitrogen oxide are related to kidney failure [,] and asthma [,], respectively, ascorbic acid (AA) and uric acid (UA) are biomarkers of Parkinson’s and Alzheimer’s disease [,], and finally, heart disease increases the level of pentane in the breath []. Among these diseases, lung cancer is one of the most fatal, causing millions of deaths each year. One remaining challenge is the difficulty of detecting its initial stages with current diagnostic tools, whereas early detection could save 60–80% of lung cancer patients. Presently, only about 15% of patients are diagnosed at an early stage [,,], enabling appropriate care. In addition, current methods are sometimes painful, invasive, and unreliable, strengthening the idea that volatolomics is a relevant tool for lung cancer detection through exhaled breath analysis [,,,,,,] or even urine volatiles [].
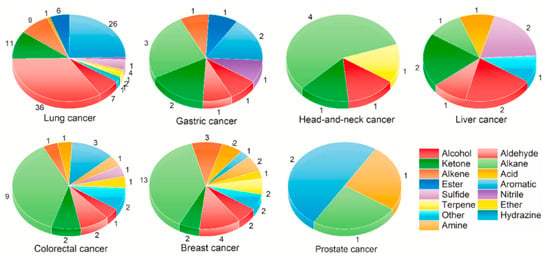
Figure 1.
Summary of some cancer volatile biomarkers from urine [].
The analysis of breath can be performed using chemo-resistive, conducting polymer nanocomposite-based sensors. This type of sensor, made of an electrically conducting nanocarbon architecture functionalized and stabilized within an amorphous polymer matrix, has been widely studied for vapor and gas sensing. The performance of these sensors, including their sensitivity and selectivity towards specific vapors, has been continuously improved by researchers [,,,,,,].
Quantum resistive vapor sensors (vQRSs) are synthesized by dispersing nanocarbons within various polymer matrices. These polymers simultaneously impart selectivity toward the target analytes and stabilize the conductive architecture responsible for the chemo-resistive response. Consequently, the resulting conductive polymer nanocomposite (CPC)-based transducers can be readily tailored in terms of molecular interactions, predominantly governed by van der Waals forces. vQRSs are based on multilayered transducers composed of conductive polymer nanocomposites obtained through the solution-phase assembly of carbon nanofillers—such as carbon nanotubes [], graphene [], fullerenes [], carbon nano-onions [], and their possible hybrids []—with various polymers. The resulting conductive network forms a random architecture comprising billions of interconnections that can be disrupted by the diffusion of only a few parts per million of volatile compounds through the transducer. The disruption of carbon–carbon junctions induces a pronounced change in electrical resistance, as charge transport in these materials is governed by quantum tunneling (an effect exponentially dependent on the inter-filler distance). Even a separation of a few nanometres significantly alters the energy required for electrons to tunnel across the gap. This tunneling-based conduction mechanism is the origin of the sensor’s name. Furthermore, the nano-assembly process employed (spray layer-by-layer deposition (sLbL)) enables precise tuning of the electrical resistance and offers fine control over the structural organization from the nanoscale to the microscale. Owing to their mechanical compliance, these transducers can be deposited onto flexible substrates, including textiles, which is particularly advantageous for wearable electronic applications. In addition, CPC-based transducers do not require heating for moisture desorption, unlike most metal oxide sensors. As a result, their power consumption remains very low, paving the way for autonomous electronic noses powered by printable photovoltaic or piezoelectric energy-harvesting devices.
As breath is a very complex blend of dozens of volatile biomarkers, a set of chemo-resistive sensors with different selectivities towards VOCs of interest is therefore required for a complete analysis. This set of sensors is usually referred to as an electronic nose or e-nose. The data obtained by the e-nose can be analyzed with different statistical methods such as principal component analysis (PCA), linear discriminant analysis (LDA), and artificial neural networks (ANNs) [,,,,,,,,,,]. The aim of processing the chemo-resistive responses is to provide a “breath print” of each human exhaled sample to allow precise classification. Finally, after performing the learning step of the e-nose, a proper algorithm must distinguish healthy from cancerous breath prints [,,,,,,].
In the present study, an e-nose was assembled using nine different optimized nanocomposite sensors. The selectivity of each sensor was modified by the non-covalent functionalization of carbon nanotubes with different polymer matrices of complementary chemical properties during formulation. The selected sensors were then exposed to the targeted biomarker VOC present in blends as well as to exhaled breath samples. Biomarker concentrations (ppm) were varied across low, medium, and high levels in a background composed of several other VOCs. Up to three biomarkers were mixed in the background to observe the ability of the e-nose to discriminate target molecules from interfering compounds. In the second part of this study, the same e-nose was tested with real human exhaled breath collected under different environmental conditions, i.e., before and after smoking, as well as before and after alcohol consumption. The exhaled breath tests were repeated to evaluate the reproducibility of the results.
2. Experimental
2.1. Materials
NC7000 multiwalled carbon nanotubes (CNTs) were kindly provided by Nanocyl S A, (Sambreville, Belgium). CNTs were produced by a catalytic carbon vapor deposition (CCVD) method. The NC700 grade has a purity of 90%, an average diameter of 9.5 nm and an average length of 1.5 µm. CNTs were used as received without any further purification. Poly(styrene-co-[propyl methacryl hepta isobutyl]), abbreviated PS-co-POSS, and Poly(methyl methacrylate-co-[propyl methacryl hepta isobutyl]), abbreviated PMMA-co-POSS, were procured from Sigma-Aldrich (Evry, France). Both random copolymers contain 45 wt.% of POSS. Poly(caprolactone), PCL, had an average molar mass in number of Mn = 80,000 g·mol−1, poly(ethylene glycol), PEG, had an average molar mass in number of Mn = 10,000 g·mol−1, and poly(methyl methacrylate), PMMA, had an average molar mass in weight of Mw = 120,000 g·mol−1. These polymers were purchased from Sigma-Aldrich, France. Poly(vinyl pyrrolidone), PVP, had an average molar mass in weight of Mw = 1,300,000 g·mol−1, and poly(styrene), PS, had an average molar mass in weight of Mw = 250,000 g·mol−1. These polymers were obtained from Acros Organics (Illkirch, France). Poly(lactic acid), PLA, had a melt flow index range of MFI = 15–30 g·10 min−1, and poly(styrene-co-acrylonitrile), SAN, had a molar composition of 75% styrene and 25% acrylonitrile. They were obtained from NatureWorks (Naarden, The Netherlands) and PolyScience Inc. (Issy les Moulineaux, France), respectively. All solvents used in the blends (chloroform, ethanol, propanol, toluene, xylene, octane, trimethyl benzene (TMB) and benzaldehyde) and for calibration (propanol, ethanol, methanol, acetone, toluene, xylene, 2 ethyl 1 hexanol, cyclohexanone, hexene, 2 methyl 1 propanol, isopropanol) were purchased from Sigma-Aldrich and used as such without any further purification. Tedlar® bags (Kiel, Germany) for gas sampling (2 dm3 volume) with septum and screw cap valve were also purchased by Sigma-Aldrich (Evry, France) for VOC blend preparation and exhaled breath collection.
2.2. Transducers’ Nano-Assembly by sLbL
From the above materials, vQRSs were fabricated by spraying layer-by-layer (sLbL) dispersions, prepared by adding 2 wt.% of CNTs to the polymer (i.e., 200 mg of CPC) in 20 cm3 of chloroform under ultrasonication for 6 h at 50 °C using a Branson 3510 operating at 100 W and 40 kHz. Nine different polymers were used. Four layers of each were sprayed over home-made interdigitated electrodes (IDEs) composed of Ag (25%)/Pd (75%) tracks, separated by a 15 µm ceramic gap, and prepared by cleaving 22 nF capacitors. The electrodes were polished and then cleaned with ethanol to remove any surface contamination.
The sLbL device consisted of a nozzle mounted on a 3D printer frame to control x/y movement, operated with a Valve Mate 8040 (Nordson, Westlake, OH, USA) at a scan speed of Vs = 50 mm·s−1, a flow rate index of 2, a target-to-nozzle distance of 8 cm, and an air pressure of ps = 0.1 MPa. After fabrication, vQRSs were conditioned at 30 °C in a controlled atmosphere overnight. The initial resistance (R0) and the composition of the sensors are given in Table 1. The e-nose was assembled from the nine sensors listed in Table 1.

Table 1.
e-nose composition, sensor abbreviations, and initial resistance.
2.3. Transducers’ Calibration
The nine different transducers assembled into the e-nose were selected thanks to their affinity to a set of calibration vapors (propanol, ethanol, methanol, acetone, toluene, xylene, 2 ethyl 1 hexanol, cyclohexanone, hexene, 2 methyl 1 propanol, isopropanol) chosen for their differences in hydrophilic/hydrophobic balance and nature of interactions evaluated by their Flory Huggins c12 parameter, as already detailed in previous study [,]. Figure 2 shows typical responses of two transducers, i.e., PS-co-POSS/CNT and PMMA-co-POSS/CNT, when exposed to calibration vapors. The response times are very quick, usually less than one second, and the baseline shows minimal drift. The amplitude (AR) defined in Equation (1) can be very large (more than 60 in the case of PS-co-POSS/CNT exposed to 1-hexene or acetone), sometimes compromising reproducibility.
where R0 is initial resistance of sensors under a dry nitrogen stream, and R is the resistance measured in the presence of the bag output.
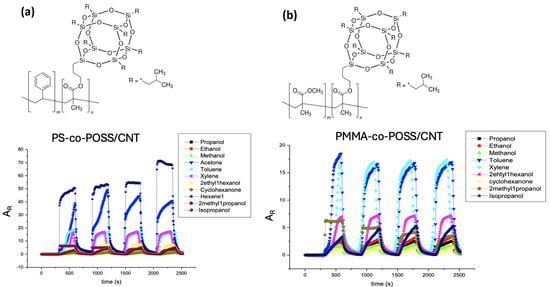
Figure 2.
Example of (a) PS-co-POSS/CNT and (b) PMMA-co-POSS/CNT sensors’ chemo-resistive responses (AR) to the set of calibration vapors.
However, in most cases, when AR was less than 20, the signals were very reproducible and stable, despite the large number of VOCs delivered to the CPC transducers. After sorption, vQRSs returned to their initial resistance (R0) upon desorption, which suggests that almost all molecules were released from the nanocomposite sensitive films. Nevertheless, some cycles were atypical and were therefore excluded from the calculation of the average chemo-resistive amplitude. In the following part of the study, the VOC concentrations used were hundreds of times lower than under saturated conditions (i.e., from several hundred to a thousand ppm), and thus, all responses were below 5 and reproducible.
Once the sensitivity of all sensors chosen to integrate the e-nose is checked, the device can be exposed to the different samples of breath, artificial and human.
2.4. Artificial Breath Samples’ Preparation
VOC blends were prepared using Tedlar® gas sampling bags. The bags were equipped with screw-cap valves and septa. The desired number of VOCs was injected through the septum in the bag. After adding all VOCs in a particular blend, the bag was flushed with dry air. Blown bags were given some time to reach equilibrium. Four different blends were prepared. The first one was background blend (B0) including water, ethanol, propanol, toluene, and xylene. A total of 1 cm3 of each was injected into the bag, and at room temperature, VOCs evaporated according to their partial pressure in the headspace. The second blend (B1) was prepared by adding one cancer biomarker (octane) to B0. Octane was added in three different volumes: 0.25 cm3 (low), 0.5 cm3 (medium), and 1 cm3 (high) to B0. In this case, the blends were named B1L, B1M, and B1H, respectively. The concentration variation was implemented to check the ability of the e-nose to detect low ppm of biomarkers in large numbers of background VOCs. Similarly, two other cancer biomarker blends were selected and called B2 and B3, containing, respectively, two (octane, TMB) and three biomarkers (octane, TMB, benzaldehyde) added to B0. Further concentration of biomarkers was increased to make low (0.25 cm3 of each), medium (0.5 cm3 of each), and high (1 cm3 of each) variations of B2 and B3, as shown in Figure 3.
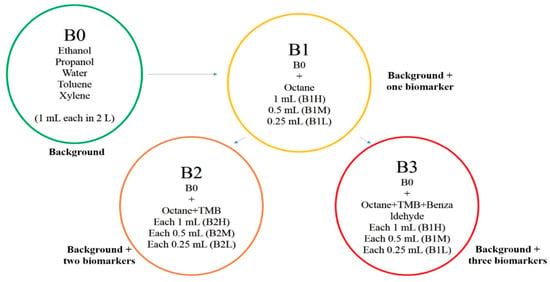
Figure 3.
Preparation of blends and their variations for e-nose analysis.
Table 2 gives more details on VOC concentrations and designations in each blend.

Table 2.
Composition of background vapors (bold) and other blends with cancer biomarkers (italics).
The number of VOCs present inside the bag was calculated by the following Equation (2):
where ppmblend is the concentration (in ppm) of each vapor in each blend, the mole fraction of VOC represents the fraction of each vapor (in mole) in each blend, and ppmsaturated condition is the concentration of each vapor at the saturated state.
2.5. Human Breath Samples’ Collection
Exhaled breath of two volunteers was collected in fresh Tedlar® bags (Kiel, Germany). For the first volunteer (V1), samples were collected before and after smoking. This breath test was repeated three times within a single week. Exhaled breath from the second volunteer (V2) was collected before and after alcohol consumption, and this test was repeated twice. The exhaled breath was collected in the bag through a screw-cap valve. Specifically, alveolar breath was collected; i.e., volunteers were instructed to blow only the last part of their exhaled breath into the bag. Accordingly, both volunteers exhaled into the bag via a mouthpiece after a 5 s nasal exhalation. This process was repeated until the bag was filled nearly to its full capacity. Condensation of water and other VOCs was avoided by analysing all bags immediately after collection. All tests were conducted at room temperature (25 °C). First, the standardization of breath collection and analysis is crucial. However, it was underlined that the results of breath testing depend on several factors related to the method of sample collection, patients’ physiologic condition, and test environment []. The two volunteers were explained the ahead protocol of breath collection before obtaining their consent. Then, the protocol was validated by the Scientific and Ethical Committee of the University of South Brittany.
2.6. Breath Samples’ Analysis
The Tedlar® bags containing exhaled breath and VOC blend samples were characterized by analyzing the chemo-resistive responses of the e-nose (array of nine sensors). The testing cell is a rectangular cavity of 100 mm × 10 mm × 3 mm, in which the nine sensors are arranged in an array (e-nose). Dynamic testing of breath and VOC blends was performed using mass flow controllers, electrically controlled valves, and a homemade compression apparatus with a flow meter to ensure controlled output from the bags, as shown in Figure 4.
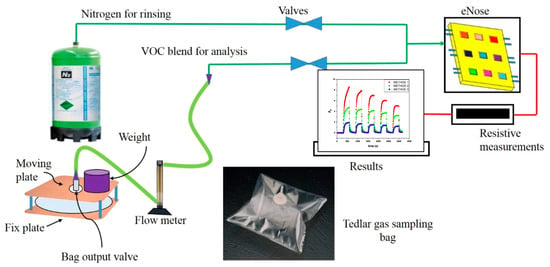
Figure 4.
Tedlar® bag and device to obtain a controlled output to the e-nose.
A Keithley 6517 (Tektronix Inc., Les Ulis, France) was used to measure the change in sensor resistance, and LabVIEW 2018 software was used to record the data. Alternate cycles of nitrogen at a flow rate of 500 cm3·min−1 were applied during the cleaning cycle, and bag output was set at 100 cm3·min−1 for 5 min cycle. Twelve cycles were tested for each bag. As expected, the electrical resistance of sensors was increased in presence of VOC or breath samples. Therefore, relative resistance of each cycle was calculated by Equation (1).
For each bag (blends and breath test), all the AR values (for the nine sensors and twelve cycles each) were obtained and analyzed by a data analysis tool. The discrimination ability of e-nose was tested by the data analysis tool for a given set of cancer biomarker blends and breath samples.
2.7. Data Analysis: Feature Extraction
During the gas/breath testing stage, the chemo-resistive responses are recorded, and the extracted features are assembled into a multidimensional matrix (sensors × cycles × gas/breath) for further analysis with classification algorithms. Different kinds of features can be extracted as described in Figure 5, such as amplitude, slopes, or area.
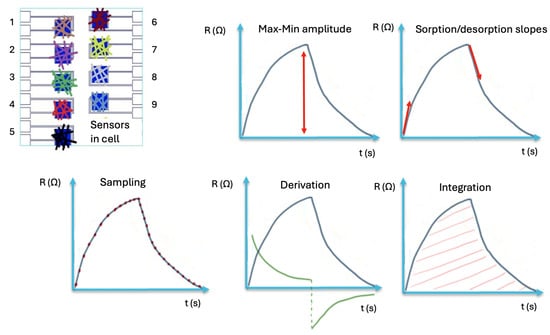
Figure 5.
Example of feature extraction from sensors’ chemo-resistive signals: maximum amplitude, sorption/desoption slopes, sampling, derivation, integration [].
The primary features have a physical significance, such as signal amplitude and normalized sensors’ response. The secondary features, referred to as mapping features, are obtained from primary data, which can help to characterize the effectiveness of e-nose []. Both types of features are required for accurate interpretation of the e-nose data. From these features, the most effective ones (those associated with the lowest error rates) were selected for analysis using a pattern recognition algorithm. Pattern recognition represents the final step in e-nose data processing, allowing the classification of distinct olfactory prints.
In this study, the selected method was linear discriminant analysis (LDA), a form of discriminant function analysis (DFA) originally introduced by Fisher [,]. LDA is a supervised feature extraction technique that maintains a linear relationship with the original data points. By doing so, it minimizes within-group scattering of the data, thereby improving class separability. Here, the relative electrical responses (AR) from twelve successive cycles were processed with LDA to compare the different VOC blends and exhaled breath samples.
3. Results and Discussion
3.1. Analysis of VOC Blends
The sensor array (e-nose), composed of nine different sensors, was employed to detect and analyze various types of VOCs present in both synthetic blends and exhaled human breath. The selectivity of the transducers was tuned by the non-covalent functionalization of CNTs with polymer matrices of different chemical natures. The polymer-functionalized CNTs were then deposited using a layer-by-layer spraying (sLbL) process, forming a random conducting network less than 1 µm thick. In a previous study, Chatterjee et al. used six different transducers to detect eighteen VOCs under saturated conditions, demonstrating that PS, PLA, PCL, and PMMA are promising candidates for detecting a wide range of both polar and non-polar vapors []. Therefore, these four sensors were selected to integrate the array. PS- and PCL-based sensors were chosen for their ability to detect organic vapors such as toluene [,], whereas PMMA, PCL, and PLA were selected for their sensitivity to vapors such as ethanol, isopropanol, cyclohexane, and water []. PMMA was identified as a good candidate for the detection of alcohol and polar vapors []. Additional amorphous matrices, such as PVP, SAN, and PEG, were used to fabricate sensors sensitive to both polar and non-polar VOC molecules. Moreover, POSS copolymers of PS and PMMA were employed to enhance sensor sensitivity, in line with the findings of NAG et al. [], who reported that the presence of POSS molecules at conducting junctions significantly increases the sensitivity of sensors, a result later confirmed by the work of Sachan et al. [].
Figure 6 provides an overview of the different blends and their biomarker concentrations (in ppm). The average VOC concentration across all blends was 3367 ± 157 ppm. Within this large background of molecules (B0), the cancer biomarkers represented only a small fraction, decreasing from 5.8% to 3% and 1.5%, and were labeled as high, medium, and low in the respective blends. The e-nose was successively exposed to twelve cycles of each vapor blend, and AR was recorded for each of the nine sensors and each cycle. The resulting data matrix thus contained (9 × 12 × 4) values, corresponding to the AR of all sensors across twelve cycles and four blends, which were then used for LDA treatment.
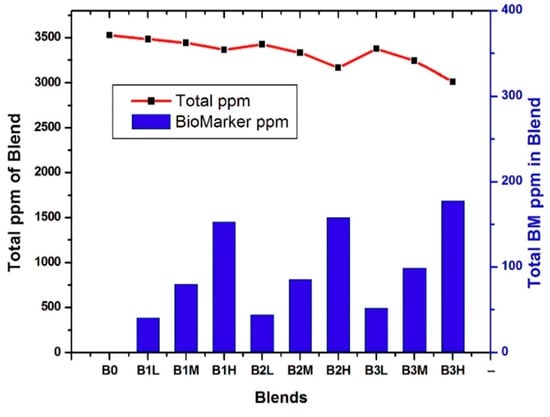
Figure 6.
Overall concentration and lung cancer biomarkers (BM) concentration of each blend.
Initially, each blend containing cancer biomarkers was individually compared with B0 on an LDA map. Figure 7 illustrates the influence of both the concentration of biomarkers and their number on clusters’ separation. For the B1 blends (Figure 7a), the clusters corresponding to B1H, B1M, and B1L were well separated from B0. The B1L data appears slightly scattered, as it contains only 40 ppm of octane within a 3500-ppm background. In contrast, B1M (80 ppm) and B1H (153 ppm) exhibit denser clusters. These results show that the e-nose was able to discriminate concentration variations of a single biomarker relative to B0. For the B2 blends (B2L, B2M, and B2H), a second biomarker (TMB) was added to 4, 8, and 15 ppm of octane. As shown in Figure 7b, the B0 data cluster remained nearly identical to the B1 case, but the addition of small amounts of TMB reduced the scattering of data points for each blend. The B2 clusters were clearly separated, confirming that the e-nose detected even slight changes in the blend composition. For the B3 blends, benzaldehyde was added together with octane and TMB and compared to B0 (Figure 7c). The B3 cluster was less scattered compared to those of B1 and B2. These results demonstrate that the successive addition of three volatile biomarkers densified the clusters without reducing the discrimination ability of the vQRS-based e-nose. Interestingly, increasing the biomarkers’ concentration in blends tended to shift the cluster closer to B0.
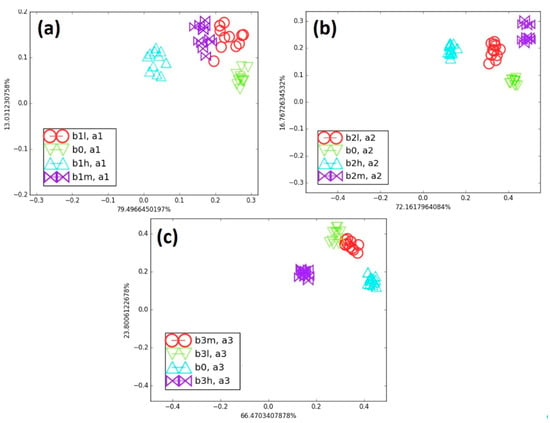
Figure 7.
(a) Comparison of all B1 category blends with B0, (b) comparison of all B2 category blends with B0, and (c) comparison of all B3 category blends with B0 on LDA map.
Figure 8 shows the effect of biomarker type at the same concentration on cluster discrimination. The blends were compared with B0 at low (L), medium (M), and high (H) concentrations of cancer biomarkers, which also makes it possible to assess the effect of biomarker number on the e-nose discrimination ability. For instance, in Figure 8a, the clusters of B1L, B2L, and B3L show increasing separation from B0 as their biomarker concentration rises from 41 to 44 and 52 ppm, respectively.
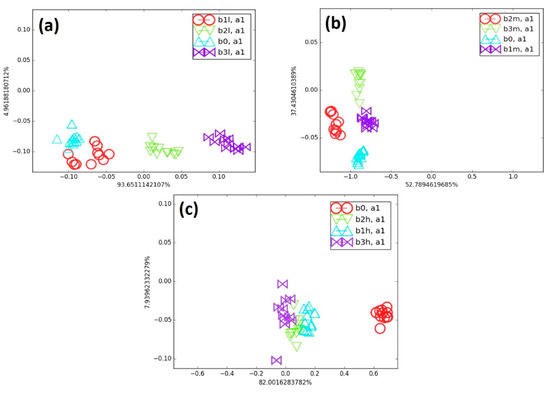
Figure 8.
(a) Comparison of all low cancer biomarker blends with B0, (b) comparison of all medium cancer blends with B0, and (c) comparison of all high cancer blends with B0 on LDA map.
The total amount of biomarkers increased only slightly (from about 1 to 1.5% of the total concentration of the blend) as their number increased in B0. Since the change in AR across all sensors collectively determined the position of the points on the LDA map, the presence of a higher number of biomarkers was clearly detected by the sensor array. Accordingly, the sensor responses shifted progressively, leading to a gradual separation from B0. In Figure 8b, all medium-concentration blends (B1M, B2M, and B3M) were well separated from the background (B0). In these blends, the biomarker concentrations were nearly twice those in the low-concentration blends, representing approximately 2.5 to 3% of the total blend. As biomarker concentration increased, the blend clusters shifted progressively, and their distance from B0 also increased. The high-concentration blends (B1H, B2H, and B3H) contained roughly three times more biomarkers than the low-concentration blends. All these high-concentration blends were clearly separated from B0 on the LDA map, as shown in Figure 8c. However, the e-nose encountered greater difficulty in differentiating the clusters of B1H, B2H, and B3H. At this concentration range, the AR values (chemo-resistive responses) were nearly similar across all sensors, likely due to the faster saturation of the polymer matrix adsorption sites at such high biomarker content. Despite this limitation, the e-nose was still able to detect small amounts of cancer biomarkers in the presence of a large background of VOC and to effectively discriminate clusters in the low-concentration blends, using only one axis that accounted for nearly 94% of the total variance. Overall, the discrimination ability of the e-nose decreased as the biomarker concentration in the blends increased, as observed using the LDA algorithm.
3.2. Analysis of Exhaled Breath
The same e-nose, assembled from the nine vQRSs selected in the previous study on cancer biomarkers, was also tested with exhaled human breath under different conditions, to move closer to healthcare monitoring applications using vQRS-based e-noses. The first volunteer (V1) was a smoker, and his exhaled breath was analyzed before and one hour after smoking a cigarette. This test was repeated three times on consecutive days. The resulting breath map for the first volunteer is shown in Figure 9 after an LDA treatment of the data set.
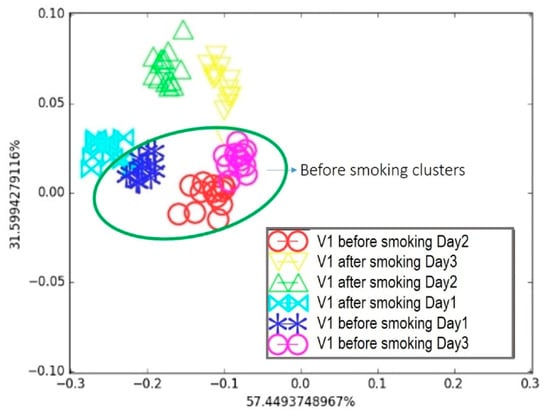
Figure 9.
Breath testing of Volunteer 1 for three days: Comparison of breath before and after smoking on LDA breath map.
It appears in Figure 9 that, considering the day-by-day tests, the “after smoking” and “before smoking” clusters on Day 1 were separated but very close to each other. This was later attributed to the volunteer’s morning routine, which was not controlled during the first test. The breath samples were collected regardless of the volunteer’s food habits, since a person’s daily routine can affect the composition of exhaled breath, as observed in the breath map. For Day 2 and Day 3, the two “before smoking” clusters were in a similar area, whereas they were farther from their associated “after smoking” clusters compared to Day 1. This highlights that breath sample collection is delicate and sensitive to the volunteer’s behaviour prior to exhalation, emphasizing the need for a strict collection protocol. Nevertheless, the proposed e-nose was able to discriminate between the two samples under real conditions. The second breath condition involved alcohol consumption. The second volunteer (V2) provided breath samples before and after drinking a glass of wine. This test was repeated twice on consecutive days. Following the same procedure and data treatment as before, the resulting breath map is presented in Figure 10.
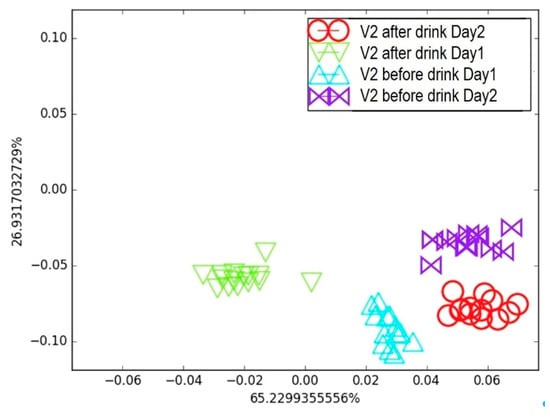
Figure 10.
Breath testing of Volunteer 2 for two days: Comparison of breath before and after alcohol consumption on LDA breath map.
Interestingly, the LDA map generated from clusters of breath samples collected “before” and “after” wine consumption on Days 1 and 2 effectively discriminated the effects of alcohol and the time elapsed after consumption. The e-nose was able to detect changes in the breath samples resulting from alcohol intake; however, the “before” clusters did not overlap across the two consecutive days, and the same was true for the “after” clusters. This indicates that factors other than alcohol consumption can influence the VOC composition in exhaled breath, highlighting the need for a strict sample collection protocol combined with a well-defined training procedure. Nevertheless, these two simple experiments demonstrate that the e-nose is sufficiently sensitive to detect variations in breath prints caused by smoke and alcohol, which is very encouraging for future healthcare applications based on volatolomics.
4. Conclusions
This work clearly demonstrates that nanocomposite vQRS arrays, when combined with advanced data analysis techniques, represent a powerful and reliable approach for capturing and classifying olfactory signatures associated with disease biomarkers. The developed system successfully detected lung cancer-related volatile compounds at concentrations as low as 1% of the total vapor mixture while maintaining discriminative power in the presence of complex and fluctuating backgrounds.
Furthermore, the tests conducted with real human breath revealed that, despite the inherent variability of exhaled samples and the need for a carefully standardized collection protocol, the e-nose retained sufficient sensitivity to identify subtle changes induced by lifestyle factors such as smoking and alcohol consumption. These findings validate the robustness of the vQRS concept under both controlled and realistic conditions, bridging the gap between laboratory-scale proof-of-concept and potential clinical translation.
In the broader perspective, such technology offers several decisive advantages (non-invasiveness, rapid analysis, portability, and compatibility with machine-learning-based pattern recognition) that make it highly attractive for integration into next-generation healthcare systems. By enabling continuous, accessible, and early screening of patients through a simple breath test, vQRS-based e-noses could become a disruptive tool in preventive medicine, improving patient outcomes while reducing the burden on healthcare infrastructures.
Author Contributions
Conceptualization, J.-F.F. and M.C.; methodology, J.-F.F. and M.C.; validation, J.-F.F., M.C. and A.S.; formal analysis, A.S.; investigation, J.-F.F., M.C. and A.S.; resources, J.-F.F.; data curation, A.S.; writing—original draft preparation, A.S.; writing—review and editing, J.-F.F. and M.C.; visualization, A.S.; supervision, J.-F.F. and M.C.; project administration, J.-F.F.; funding acquisition, J.-F.F. All authors have read and agreed to the published version of the manuscript.
Funding
This research received no external funding.
Institutional Review Board Statement
The study was conducted in accordance with the Declaration of Helsinki and approved by the Institutional Ethics Committee of the University of South Brittany (protocol code BC01-10/2017 of 10 October 2020).
Informed Consent Statement
Informed consent was obtained from all subjects involved in the study.
Data Availability Statement
The original contributions presented in this study are included in the article. Further inquiries can be directed to the corresponding author.
Acknowledgments
We are grateful to Hervé Bellegou, Isabelle Pillin, and Veena Chouhary for their contribution to this work, and the University of South Brittany (UBS) of Lorient and the Indian Institute of Technology (IIT) of Delhi for providing resources.
Conflicts of Interest
The authors declare no conflicts of interest.
References
- Scheideler, L.; Manke, H.G.; Schwulera, U.; Inacker, O.; Hämmerle, H. Detection of Nonvolatile Macromolecules in Breath. A Possible Diagnostic Tool? Am. Rev. Respir. Dis. 1993, 148, 778–784. [Google Scholar] [CrossRef]
- Pauling, L.; Robinson, A.B.; Teranishi, R.; Cary, P. Quantitative Analysis of Urine Vapor and Breath by Gas-Liquid Partition Chromatography. Proc. Natl. Acad. Sci. USA 1971, 68, 2374–2376. [Google Scholar] [CrossRef] [PubMed]
- Cheng, W.-H.; Lee, W.-J. Technology Development in Breath Microanalysis for Clinical Diagnosis. J. Lab. Clin. Med. 1999, 133, 218–228. [Google Scholar] [CrossRef]
- Miekisch, W.; Sukul, P.; Schubert, J.K. Diagnostic Potential of Breath Analysis—Focus on the Dynamics of Volatile Organic Compounds. TrAC Trends Anal. Chem. 2024, 180, 117977. [Google Scholar] [CrossRef]
- Miekisch, W.; Schubert, J.K.; Noeldge-Schomburg, G.F.E. Diagnostic Potential of Breath Analysis—Focus on Volatile Organic Compounds. Clin. Chim. Acta 2004, 347, 25–39. [Google Scholar] [CrossRef]
- Cikach, F.S., Jr.; Dweik, R.A. Cardiovascular Biomarkers in Exhaled Breath. Prog. Cardiovasc. Dis. 2012, 55, 34–43. [Google Scholar] [CrossRef]
- Dummer, J.; Storer, M.; Swanney, M.; McEwan, M.; Scott-Thomas, A.; Bhandari, S.; Chambers, S.; Dweik, R.; Epton, M. Analysis of Biogenic Volatile Organic Compounds in Human Health and Disease. TrAC Trends Anal. Chem. 2011, 30, 960–967. [Google Scholar] [CrossRef]
- Chen, K.; Liu, L.; Nie, B.; Lu, B.; Fu, L.; He, Z.; Li, W.; Pi, X.; Liu, H. Recognizing Lung Cancer and Stages Using a Self-Developed Electronic Nose System. Comput. Biol. Med. 2021, 131, 104294. [Google Scholar] [CrossRef] [PubMed]
- Einoch Amor, R.; Nakhleh, M.K.; Barash, O.; Haick, H. Breath Analysis of Cancer in the Present and the Future. Eur. Respir. Rev. 2019, 28, 190002. [Google Scholar] [CrossRef] [PubMed]
- Broza, Y.Y.; Kremer, R.; Tisch, U.; Gevorkyan, A.; Shiban, A.; Best, L.A.; Haick, H. A Nanomaterial-Based Breath Test for Short-Term Follow-up after Lung Tumor Resection. Nanomedicine 2013, 9, 15–21. [Google Scholar] [CrossRef]
- Tisch, U.; Haick, H. Chemical Sensors for Breath Gas Analysis: The Latest Developments at the Breath Analysis Summit 2013. J. Breath Res. 2014, 8, 27103. [Google Scholar] [CrossRef] [PubMed]
- Kim, K.H.; Jahan, S.A.; Kabir, E. A Review of Breath Analysis for Diagnosis of Human Health. TrAC Trends Anal. Chem. 2012, 33, 1–8. [Google Scholar] [CrossRef]
- Arasaradnam, R.P.; Covington, J.A.; Harmston, C.; Nwokolo, C.U. Review Article: Next Generation Diagnostic Modalities in Gastroenterology—Gas Phase Volatile Compound Biomarker Detection. Aliment. Pharmacol. Ther. 2014, 39, 780–789. [Google Scholar] [CrossRef]
- Eckel, S.P.; Baumbach, J.; Hauschild, A.C. On the Importance of Statistics in Breath Analysis—Hope or Curse? J. Breath Res. 2014, 8, 12001. [Google Scholar] [CrossRef]
- Wallace, L.A.; Pellizzari, E.D. Recent Advances in Measuring Exhaled Breath and Estimating Exposure and Body Burden for Volatile Organic Compounds (VOCs). Environ. Health Perspect. 1995, 103, 95–98. [Google Scholar] [CrossRef] [PubMed]
- Wallace, L.; Buckley, T.; Pellizzari, E.; Gordon, S. Breath Measurements as Volatile Organic Compound Biomarkers. Environ. Health Perspect. 1996, 104, 861–869. [Google Scholar] [CrossRef]
- Pleil, J.D.; Lindstrom, A.B. Exhaled Human Breath Measurement Method for Assessing Exposure to Halogenated Volatile Organic Compounds. Clin. Chem. 1997, 43, 723–730. [Google Scholar] [CrossRef]
- Di Natale, C.; Paolesse, R.; Martinelli, E.; Capuano, R. Solid-State Gas Sensors for Breath Analysis: A Review. Anal. Chim. Acta 2014, 824, 1–7. [Google Scholar] [CrossRef]
- Broza, Y.Y.; Haick, H. Nanomaterial-Based Sensors for Detection of Disease by Volatile Organic Compounds. Nanomedicine 2013, 8, 785–806. [Google Scholar] [CrossRef]
- Buszewski, B.; Kęsy, M.; Ligor, T.; Amann, A. Human Exhaled Air Analytics: Biomarkers of Diseases. Biomed. Chromatogr. 2007, 21, 553–566. [Google Scholar] [CrossRef]
- Mazzatenta, A.; Di Giulio, C.; Pokorski, M. Pathologies Currently Identified by Exhaled Biomarkers. Respir. Physiol. Neurobiol. 2013, 187, 128–134. [Google Scholar] [CrossRef] [PubMed]
- O’Neill, H.J.; Gordon, S.M.; O’Neill, M.H.; Gibbons, R.D.; Szidon, J.P. A Computerized Classification Technique for Screening for the Presence of Breath Biomarkers in Lung Cancer. Clin. Chem. 1988, 34, 1613–1618. [Google Scholar] [CrossRef]
- Liang, Y.; Yeligar, S.M.; Brown, L.A.S. Exhaled Breath Condensate: A Promising Source for Biomarkers of Lung Disease. Sci. World J. 2012, 2012, 217518. [Google Scholar] [CrossRef]
- Qu, D.; Liu, T.; Cheng, Y.; Du, T.; Cheng, B.; Zhang, Y.; Su, C.; Zheng, Y.; Xu, X.; Wang, G.; et al. Volatilomics in Diseases Odour and Electronic Nose Diagnosis. TrAC Trends Anal. Chem. 2025, 193, 118440. [Google Scholar] [CrossRef]
- Esfahani, S.; Sagar, N.; Kyrou, I.; Mozdiak, E.; O’Connell, N.; Nwokolo, C.; Bardhan, K.D.; Arasaradnam, R.; Covington, J. Variation in Gas and Volatile Compound Emissions from Human Urine as It Ages, Measured by an Electronic Nose. Biosensors 2016, 6, 4. [Google Scholar] [CrossRef] [PubMed]
- Galassetti, P.R.; Novak, B.; Nemet, D.; Rose-Gottron, C.; Cooper, D.M.; Meinardi, S.; Newcomb, R.; Zaldivar, F.; Blake, D.R. Breath Ethanol and Acetone as Indicators of Serum Glucose Levels: An Initial Report. Diabetes Technol. Ther. 2005, 7, 115–123. [Google Scholar] [CrossRef] [PubMed]
- Peng, G.; Hakim, M.; Broza, Y.Y.; Billan, S.; Abdah-Bortnyak, R.; Kuten, A.; Tisch, U.; Haick, H. Detection of Lung, Breast, Colorectal, and Prostate Cancers from Exhaled Breath Using a Single Array of Nanosensors. Br. J. Cancer 2010, 103, 542–551. [Google Scholar] [CrossRef]
- Mazzone, P. Sniffing out Lung Cancer. Nat. Nanotechnol. 2009, 4, 621–622. [Google Scholar] [CrossRef]
- Amann, A.; Corradi, M.; Mazzone, P.; Mutti, A. Lung Cancer Biomarkers in Exhaled Breath. Expert Rev. Mol. Diagn. 2011, 11, 207–217. [Google Scholar] [CrossRef]
- Peng, G.; Tisch, U.; Adams, O.; Hakim, M.; Shehada, N.; Broza, Y.Y.; Billan, S.; Abdah-Bortnyak, R.; Kuten, A.; Haick, H. Diagnosing Lung Cancer in Exhaled Breath Using Gold Nanoparticles. Nat. Nanotechnol. 2009, 4, 669–673. [Google Scholar] [CrossRef]
- Freddi, S.; Emelianov, A.V.; Bobrinetskiy, I.I.; Drera, G.; Pagliara, S.; Kopylova, D.S.; Chiesa, M.; Santini, G.; Mores, N.; Moscato, U.; et al. Development of a Sensing Array for Human Breath Analysis Based on SWCNT Layers Functionalized with Semiconductor Organic Molecules. Adv. Health Mater. 2020, 9, e2000377. [Google Scholar] [CrossRef] [PubMed]
- Selby, A.; Clayton, B.; Grundy, J.; Pike, K.; Drew, K.; Raza, A.; Kurukulaaratchy, R.; Arshad, S.H.; Roberts, G. Are Exhaled Nitric Oxide Measurements Using the Portable NIOX MINO Repeatable? Respir. Res. 2010, 11, 43. [Google Scholar] [CrossRef] [PubMed]
- Meinardi, S.; Jin, K.B.; Barletta, B.; Blake, D.R.; Vaziri, N.D. Exhaled Breath and Fecal Volatile Organic Biomarkers of Chronic Kidney Disease. Biochim. Biophys. Acta Gen. Subj. 2013, 1830, 2531–2537. [Google Scholar] [CrossRef]
- Dragonieri, S.; Schot, R.; Mertens, B.J.A.; Le Cessie, S.; Gauw, S.A.; Spanevello, A.; Resta, O.; Willard, N.P.; Vink, T.J.; Rabe, K.F.; et al. An Electronic Nose in the Discrimination of Patients with Asthma and Controls. J. Allergy Clin. Immunol. 2007, 120, 856–862. [Google Scholar] [CrossRef]
- Montuschi, P.; Santonico, M.; Mondino, C.; Pennazza, G.; Maritini, G.; Martinelli, E.; Capuano, R.; Ciabattoni, G.; Paolesse, R.; Di Natale, C.; et al. Diagnostic Performance of an Electronic Nose, Fractional Exhaled Nitric Oxide, and Lung Function Testing in Asthma. Chest 2010, 137, 790–796. [Google Scholar] [CrossRef]
- Pasinszki, T.; Krebsz, M.; Tung, T.T.; Losic, D. Carbon Nanomaterial Based Biosensors for Non-Invasive Detection of Cancer and Disease Biomarkers for Clinical Diagnosis. Sensors 2017, 17, 1919. [Google Scholar] [CrossRef]
- Tisch, U.; Schlesinger, I.; Ionescu, R.; Nassar, M.; Axelrod, N.; Robertman, D.; Tessler, Y.; Azar, F.; Marmur, A.; Aharon-Peretz, J.; et al. Detection of Alzheimer‘s and Parkinson‘s Disease from Exhaled Breath Using Nanomaterial-Based Sensors. Nanomedicine 2013, 8, 43–56. [Google Scholar] [CrossRef]
- Samara, M.A.; Tang, W.H.W.; Cikach, F.; Gul, Z.; Tranchito, L.; Paschke, K.M.; Viterna, J.; Wu, Y.; Laskowski, D.; Dweik, R.A. Single Exhaled Breath Metabolomic Analysis Identifies Unique Breathprint in Patients with Acute Decompensated Heart Failure. J. Am. Coll. Cardiol. 2013, 61, 1463–1464. [Google Scholar] [CrossRef] [PubMed]
- Alberg, A.J.; Ford, J.G.; Samet, J.M. Epidemiology of Lung Cancer: ACCP Evidence-Based Clinical Practice Guidelines (2nd Edition). Chest 2007, 132, 29–55. [Google Scholar] [CrossRef]
- Siegel, R.L.; Miller, K.D.; Jemal, A. Cancer Statistics 2015. CA Cancer J. Clin. 2015, 65, 5–29. [Google Scholar] [CrossRef] [PubMed]
- Dominioni, L.; Imperatori, A.; Rovera, F.; Ochetti, A.; Torrigiotti, G.; Paolucci, M. Stage I Non-Small Cell Lung Carcinoma: Analysis of Survival and Implications for Screening. Cancer 2000, 89, 2334–2344. [Google Scholar] [CrossRef]
- Mashir, A.; Dweik, R.A. Exhaled Breath Analysis: The New Interface between Medicine and Engineering. Adv. Powder Technol. 2009, 20, 420–425. [Google Scholar] [CrossRef]
- Ionescu, R.; Broza, Y.; Shaltieli, H.; Sadeh, D.; Zilberman, Y.; Feng, X.; Glass-Marmor, L.; Lejbkowicz, I.; Müllen, K.; Miller, A.; et al. Detection of Multiple Sclerosis from Exhaled Breath Using Bilayers of Polycyclic Aromatic Hydrocarbons and Single-Wall Carbon Nanotubes. ACS Chem. Neurosci. 2011, 2, 687–693. [Google Scholar] [CrossRef]
- Santonico, M.; Lucantoni, G.; Pennazza, G.; Capuano, R.; Galluccio, G.; Roscioni, C.; La Delfa, G.; Consoli, D.; Martinelli, E.; Paolesse, R.; et al. In Situ Detection of Lung Cancer Volatile Fingerprints Using Bronchoscopic Air-Sampling. Lung Cancer 2012, 77, 46–50. [Google Scholar] [CrossRef]
- Turner, C.; Knobloch, H.; Richards, J.; Richards, P.; Mottram, T.T.F.; Marlin, D.; Chambers, M.A. Development of a Device for Sampling Cattle Breath. Biosyst. Eng. 2012, 112, 75–81. [Google Scholar] [CrossRef]
- Wlodzimirow, K.A.; Abu-Hanna, A.; Schultz, M.J.; Maas, M.A.W.; Bos, L.D.J.; Sterk, P.J.; Knobel, H.H.; Soers, R.J.T.; Chamuleau, R.A.F.M. Exhaled Breath Analysis with Electronic Nose Technology for Detection of Acute Liver Failure in Rats. Biosens. Bioelectron. 2014, 53, 129–134. [Google Scholar] [CrossRef] [PubMed]
- Hu, W.; Wu, W.; Jian, Y.; Haick, H.; Zhang, G.; Qian, Y.; Yuan, M.; Yao, M. Volatolomics in Healthcare and Its Advanced Detection Technology. Nano Res. 2022, 15, 8185–8213. [Google Scholar] [CrossRef] [PubMed]
- Haick, H.; Broza, Y.Y.; Mochalski, P.; Ruzsanyi, V.; Amann, A. Assessment, Origin, and Implementation of Breath Volatile Cancer Markers. Chem. Soc. Rev. 2014, 43, 1423–1449. [Google Scholar] [CrossRef]
- Latif, U.; Dickert, F. Graphene Hybrid Materials in Gas Sensing Applications. Sensors 2015, 15, 30504–30524. [Google Scholar] [CrossRef]
- Huang, X.-J.; Choi, Y.-K. Chemical Sensors Based on Nanostructured Materials. Sens. Actuators B Chem. 2007, 122, 659–671. [Google Scholar] [CrossRef]
- Wang, J.; Musameh, M. Carbon Nanotube/Teflon Composite Electrochemical Sensors and Biosensors. Anal. Chem. 2003, 75, 2075–2079. [Google Scholar] [CrossRef]
- Rajesh; Ahuja, T.; Kumar, D. Recent Progress in the Development of Nano-Structured Conducting Polymers/Nanocomposites for Sensor Applications. Sens. Actuators B Chem. 2009, 136, 275–286. [Google Scholar] [CrossRef]
- Yun, Y.; Dong, Z.; Shanov, V.; Heineman, W.R.; Halsall, H.B.; Bhattacharya, A.; Conforti, L.; Narayan, R.K.; Ball, W.S.; Schulz, M.J. Nanotube Electrodes and Biosensors. Nano Today 2007, 2, 30–37. [Google Scholar] [CrossRef]
- Parvin, N.; Joo, S.W.; Jung, J.H.; Mandal, T.K. Unlocking the Future: Carbon Nanotubes as Pioneers in Sensing Technologies. Chemosensors 2025, 13, 225. [Google Scholar] [CrossRef]
- Lawaniya, S.D.; Awasthi, A.; Kuznetsova, I.; Kolesov, V.; Awasthi, K. Polymer Hybrid Based Nanomaterials for Next-Generation Sensing Technologies. Sens. Actuators B Chem. 2025, 442, 138162. [Google Scholar] [CrossRef]
- Feller, J.F.; Castro, M.; Kumar, B. Polymer-Carbon Nanotube Conductive Nanocomposites for Sensing. In Polymer-Carbon Nanotube Composites: Preparation, Properties & Applications; McNally, T., Pötschke, P., Eds.; Woodhead Publishing Limited: Cambridge, UK, 2011; pp. 760–803. ISBN 9781845697617. [Google Scholar]
- Tung, T.T.; Castro, M.; Kim, T.Y.; Suh, K.S.; Feller, J.F. Graphene Quantum Resistive Sensing Skin for the Detection of Alteration Biomarkers. J. Mater. Chem. 2012, 22, 21754–21766. [Google Scholar] [CrossRef]
- Nag, S.; Castro, M.; Choudhary, V.; Feller, J.F. Boosting Selectivity and Sensitivity to Biomarkers of Quantum Resistive Vapour Sensors Used for Volatolomics with Nanoarchitectured Carbon Nanotubes or Graphene Platelets Connected by Fullerene Junctions. ChemoSensors 2021, 9, 66. [Google Scholar] [CrossRef]
- Nag-Chowdhury, S.; Tung, T.T.; Ta, Q.T.H.; Kumar, G.; Castro, M.; Feller, J.F.; Sonkar, S.K.; Tripathi, K.M. Upgrading of Diesel Engine Exhaust Waste into Onion-like Carbon Nanoparticles for Integrated Degradation Sensing in Nano-Biocomposites. New J. Chem. 2021, 45, 3675–3682. [Google Scholar] [CrossRef]
- Tung, T.T.; Tran, M.T.; Feller, J.F.; Castro, M.; Van Ngo, T.; Hassan, K.; Nine, M.J.; Losic, D. Graphene and Metal Organic Frameworks (MOFs) Hybridization for Tunable Chemoresistive Sensors for Detection of Volatile Organic Compounds (VOCs) Biomarkers. Carbon 2020, 159, 333–344. [Google Scholar] [CrossRef]
- Scott, S.M.; James, D.; Ali, Z. Data Analysis for Electronic Nose Systems. Microchim. Acta 2006, 156, 183–207. [Google Scholar] [CrossRef]
- Ferreiro-González, M.; Barbero, G.F.; Palma, M.; Ayuso, J.; Álvarez, J.A.; Barroso, C.G. Determination of Ignitable Liquids in Fire Debris: Direct Analysis by Electronic Nose. Sensors 2016, 16, 695. [Google Scholar] [CrossRef]
- Mertens, B.; Thompson, M.; Fearn, T. Principal Component Outlier Detection and SIMCA: A Synthesis. Analyst 1994, 119, 2777–2784. [Google Scholar] [CrossRef]
- Amari, A.; Bari, N.E.; Bouchikhi, B. Electronic Nose for Anchovy Freshness Monitoring Based on Sensor Array and Pattern Recognition Methods: Principal Components Analysis, Linear Discriminant Analysis and Support Vector Machine. Int. J. Comput. 2007, 6, 61–67. [Google Scholar] [CrossRef]
- Hai, Z.; Wang, J. Electronic Nose and Data Analysis for Detection of Maize Oil Adulteration in Sesame Oil. Sens. Actuators B Chem. 2006, 119, 449–455. [Google Scholar] [CrossRef]
- Campbell, M.G.; Liu, S.F.; Swager, T.M.; Dincă, M. Chemiresistive Sensor Arrays from Conductive 2D Metal-Organic Frameworks. J. Am. Chem. Soc. 2015, 137, 13780–13783. [Google Scholar] [CrossRef] [PubMed]
- Qiu, S.; Wang, J.; Gao, L. Discrimination and Characterization of Strawberry Juice Based on Electronic Nose and Tongue: Comparison of Different Juice Processing Approaches by LDA, PLSR, RF, and SVM. J. Agric. Food Chem. 2014, 62, 6426–6434. [Google Scholar] [CrossRef]
- Bishop, C.M. Neural Networks for Pattern Recognition; Oxford University Press: Oxford, UK, 1995. [Google Scholar]
- Tan, Y.; Chen, Y.; Zhao, Y.; Liu, M.; Wang, Z.; Du, L.; Wu, C.; Xu, X. Recent Advances in Signal Processing Algorithms for Electronic Noses. Talanta 2025, 283, 127140. [Google Scholar] [CrossRef] [PubMed]
- Chen, P.; Yin, Z.; Xu, S.; Wang, P.; Yang, L.; Lv, Y. Structure Design and Performance Study of Bionic Electronic Nasal Cavity. Biomimetics 2025, 10, 555. [Google Scholar] [CrossRef]
- Pannone, A.; Raj, A.; Ravichandran, H.; Das, S.; Chen, Z.; Price, C.A.; Sultana, M.; Das, S. Robust Chemical Analysis with Graphene Chemosensors and Machine Learning. Nature 2024, 634, 572–578. [Google Scholar] [CrossRef]
- Hesjedal, D.V.R. and M.J.B. and R.M.I. and J.A.M. and T. Development of an Electronic Nose Sensing Platform for Undergraduate Education in Nanotechnology. Eur. J. Phys. 2011, 32, 675. [Google Scholar]
- Burl, M.C.; Doleman, B.J.; Schaffer, A.; Lewis, N.S. Assessing the Ability to Predict Human Percepts of Odor Quality from the Detector Responses of a Conducting Polymer Composite-Based Electronic Nose. Sens. Actuators B Chem. 2001, 72, 149–159. [Google Scholar] [CrossRef]
- Wang, X.; Zhou, Y.; Zhao, Z.; Feng, X.; Wang, Z.; Jiao, M. Advanced Algorithms for Low Dimensional Metal Oxides-Based Electronic Nose Application: A Review. Crystals 2023, 13, 615. [Google Scholar] [CrossRef]
- Wilson, A.D.; Baietto, M. Applications and Advances in Electronic-Nose Technologies. Sensors 2009, 9, 5099–5148. [Google Scholar] [CrossRef]
- Aina, O.E.; Zine, N.; Raffin, G.; Jaffrezic-Renault, N.; Elaissari, A.; Errachid, A. Integrated Breath Analysis Technologies: Current Advances and Future Prospects. TrAC Trends Anal. Chem. 2024, 181, 118048. [Google Scholar] [CrossRef]
- Lee, B.; Lee, J.; Lee, J.O.; Hwang, Y.; Bahn, H.K.; Park, I.; Jheon, S.; Lee, D.-S. Breath Analysis System with Convolutional Neural Network (CNN) for Early Detection of Lung Cancer. Sens. Actuators B Chem. 2024, 409, 135578. [Google Scholar] [CrossRef]
- Vanstraelen, S.; Jones, D.R.; Rocco, G. Breathprinting Analysis and Biomimetic Sensor Technology to Detect Lung Cancer. J. Thorac. Cardiovasc. Surg. 2023, 166, 357–361.e1. [Google Scholar] [CrossRef] [PubMed]
- Feller, J.F.; Grohens, Y. Evolution of Electrical Properties of Some Conductive Polymer Composite Textiles with Organic Solvent Vapours Diffusion. Sens. Actuators B Chem. 2004, 97, 231–242. [Google Scholar] [CrossRef]
- Sachan, A.; Castro, M.; Choudhary, V.; Feller, J.F. Giant Chemo-Resistive Response of POSS Nano-Spacers in PS and PMMA-Based Quantum Resistive Vapour Sensors (VQRS) Used for Cancer Biomarker Analysis. ChemoSensors 2025, 13, 226. [Google Scholar] [CrossRef]
- Hanna, G.B.; Boshier, P.R.; Markar, S.R.; Romano, A. Accuracy and Methodologic Challenges of Volatile Organic Compound–Based Exhaled Breath Tests for Cancer Diagnosis. JAMA Oncol. 2019, 5, e182815. [Google Scholar] [CrossRef]
- Laquintinie, P.S.; Sachan, A.; Feller, J.F.; Lahuec, C.; Castro, M.; Seguin, F.; Dupont, L. An Electronic Nose Prototype for the On-Field Detection of Nerve Agents. In Proceedings of the IEEE Sensors, New Delhi, India, 28–31 October 2018; IEEE: Piscataway, NJ, USA, 2018; pp. 1–4. [Google Scholar]
- Fisher, R.A. The Use of Multiple Measurements in Taxonomic Problems. Ann. Eugen. 1936, 7, 179–188. [Google Scholar] [CrossRef]
- Fisher, R.A. The Statistical Utilization of Multiple Measurements. Ann. Eugen. 1938, 8, 376–386. [Google Scholar] [CrossRef]
- Chatterjee, S.; Castro, M.; Feller, J.F. An E-Nose Made of Carbon Nanotube Based Quantum Resistive Sensors for the Detection of Eighteen Polar/Nonpolar VOC Biomarkers of Lung Cancer. J. Mater. Chem. B 2013, 1, 4563–4575. [Google Scholar] [CrossRef]
- Feller, J.F.; Grohens, Y. Electrical Response of Poly(Styrene)/Carbon Black Conductive Polymer Composites (CPC) to Methanol, Toluene, Chloroform and Styrene Vapors as a Function of Filler Nature and Matrix Tacticity. Synth. Met. 2005, 154, 193–196. [Google Scholar] [CrossRef]
- Castro, M.; Lu, J.; Bruzaud, S.; Kumar, B.; Feller, J.F. Carbon Nanotubes/Poly(ε-Caprolactone) Composite Vapour Sensors. Carbon 2009, 47, 1930–1942. [Google Scholar] [CrossRef]
- Castro, M.; Kumar, B.; Feller, J.F.; Haddi, Z.; Amari, A.; Bouchikhi, B. Novel E-Nose for the Discrimination of Volatile Organic Biomarkers with an Array of Carbon Nanotubes (CNT) Conductive Polymer Nanocomposites (CPC) Sensors. Sens. Actuators B Chem. 2011, 159, 213–219. [Google Scholar] [CrossRef]
- Feller, J.F.; Lu, J.; Zhang, K.; Kumar, B.; Castro, M.; Gatt, N.; Choi, H.J. Novel Architecture of Carbon Nanotube Decorated Poly(Methyl Methacrylate) Microbead Vapour Sensors Assembled by Spray Layer by Layer. J. Mater. Chem. 2011, 21, 4142. [Google Scholar] [CrossRef]
- Nag, S.; Sachan, A.; Castro, M.; Choudhary, V.; Feller, J.F. Spray Layer-by-Layer Assembly of POSS Functionalized CNT Quantum Chemo-Resistive Sensors with Tuneable Selectivity and Ppm Resolution to VOC Biomarkers. Sens. Actuators B Chem. 2016, 222, 362–373. [Google Scholar] [CrossRef]
Disclaimer/Publisher’s Note: The statements, opinions and data contained in all publications are solely those of the individual author(s) and contributor(s) and not of MDPI and/or the editor(s). MDPI and/or the editor(s) disclaim responsibility for any injury to people or property resulting from any ideas, methods, instructions or products referred to in the content. |
© 2025 by the authors. Licensee MDPI, Basel, Switzerland. This article is an open access article distributed under the terms and conditions of the Creative Commons Attribution (CC BY) license (https://creativecommons.org/licenses/by/4.0/).