Flow-Based CL-SMIA for the Quantification of Protein Biomarkers from Nasal Secretions in Comparison with Sandwich ELISA

 and
and
Abstract
1. Introduction
2. Materials and Methods
2.1. Material and Buffers
2.2. Collection of Real Nasal Mucosal Lining Fluid Samples
2.3. Sandwich ELISA
Assay
2.4. Flow-Based CL-SMIA
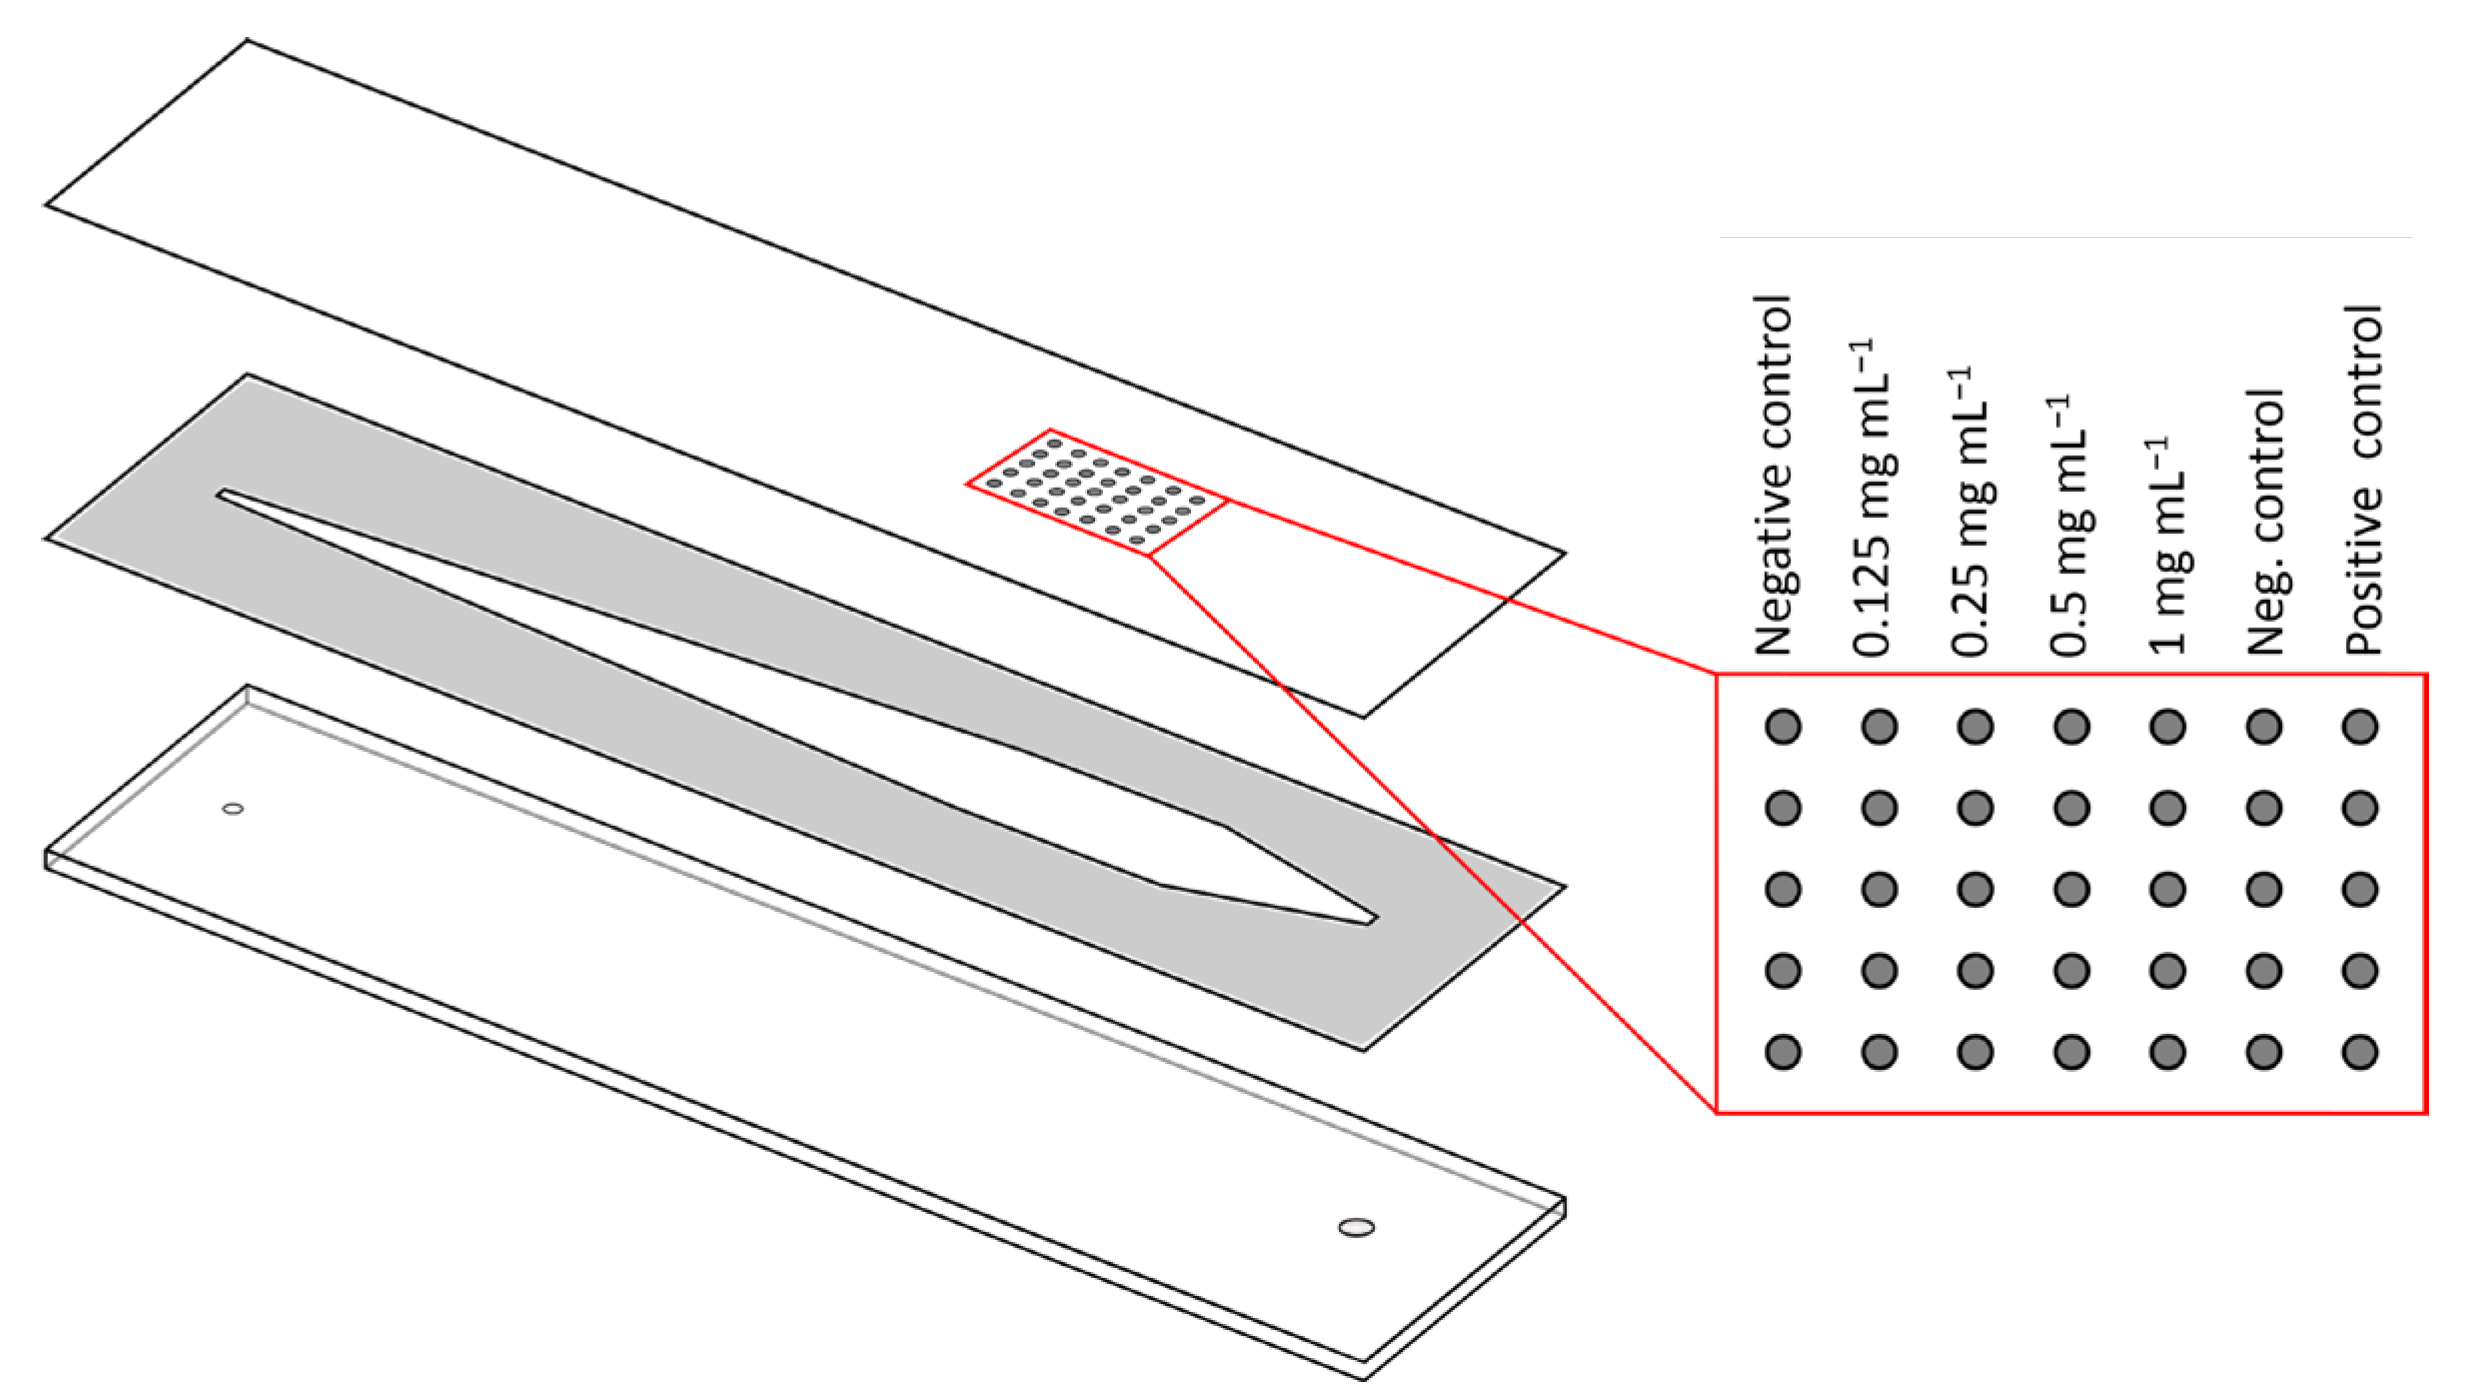
2.4.1. Preparation of Microarray Chips
2.4.2. Measurements with Flow-Based CL-SMIA
2.5. Data Evaluation
3. Results and Discussion
3.1. ELISA
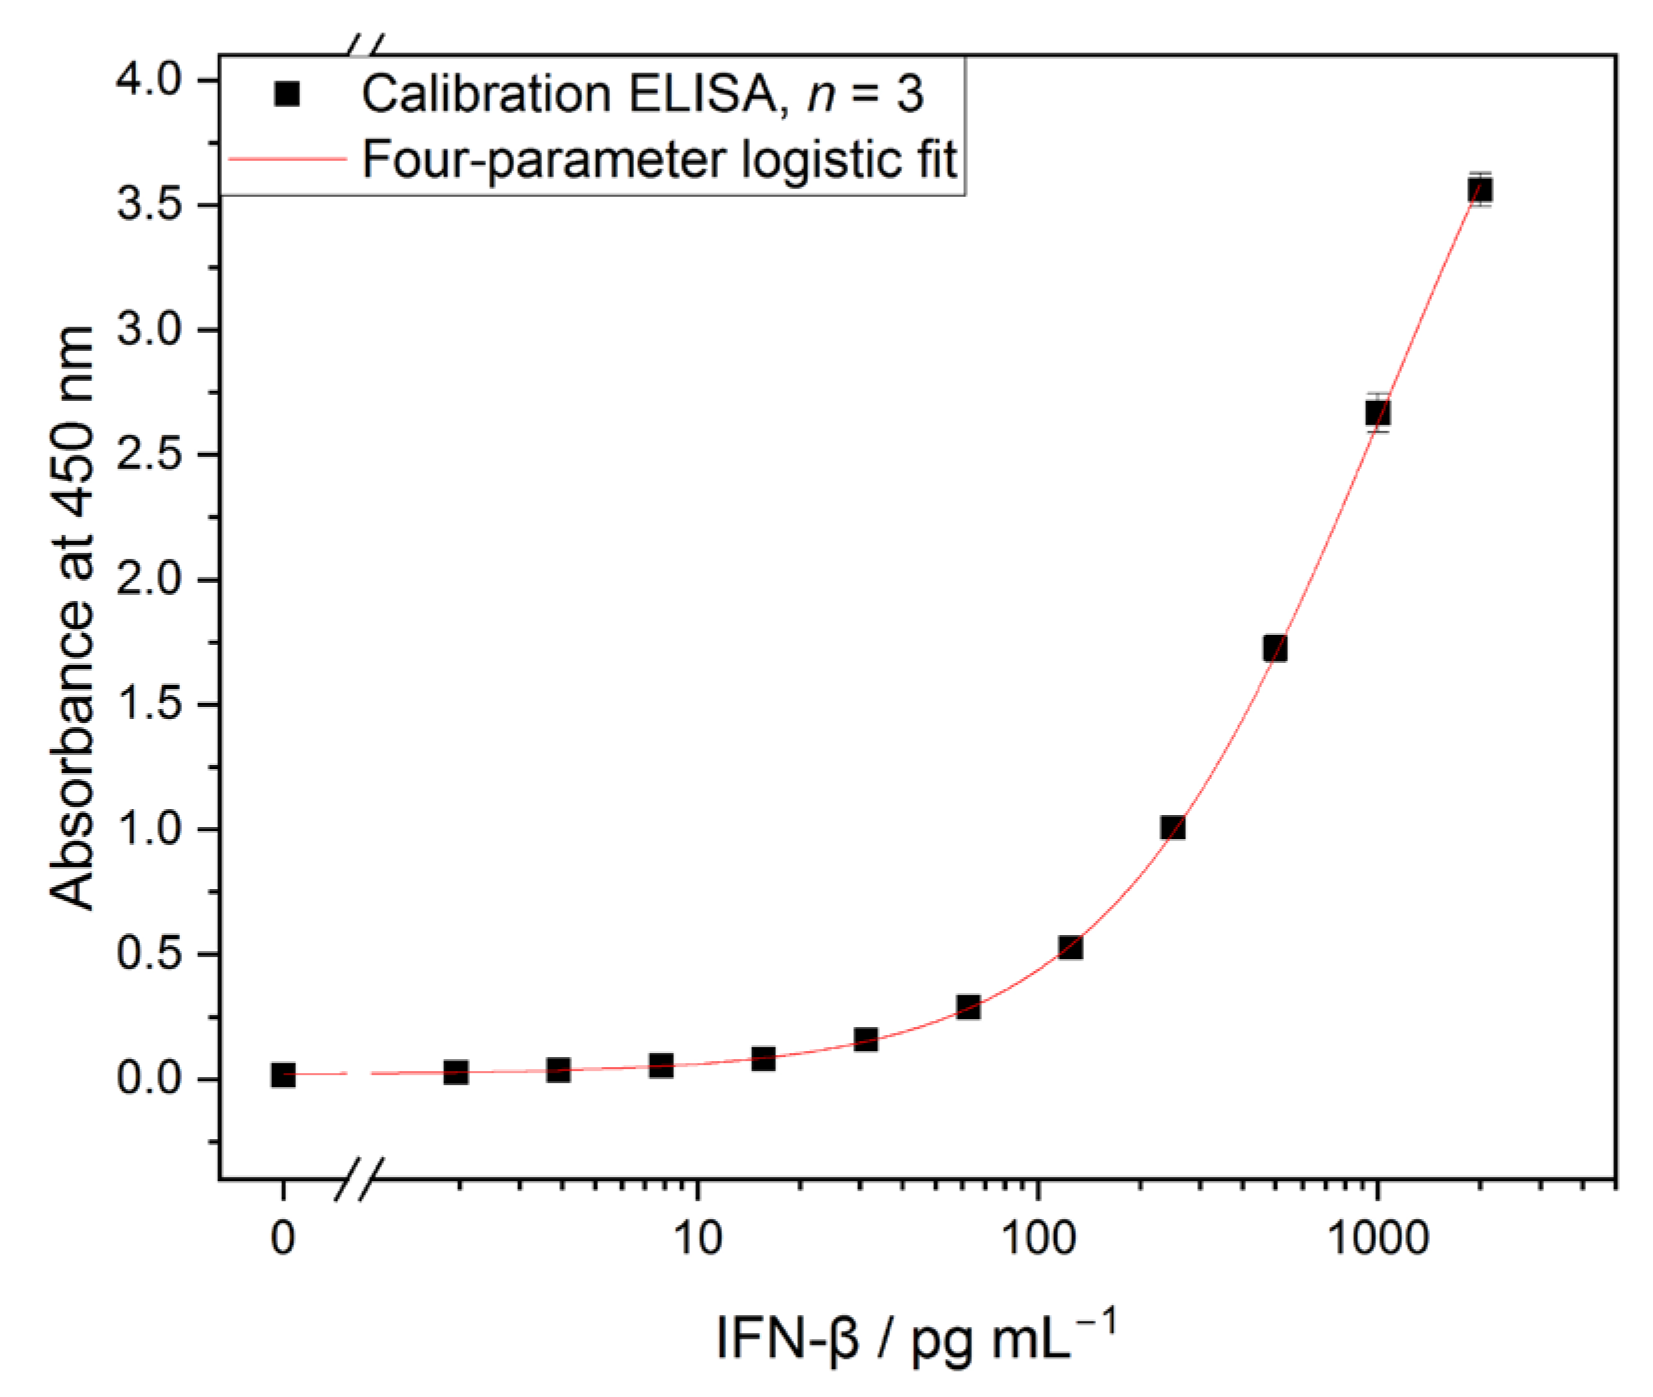
Calibration Curve

3.2. Flow-Based CL-SMIA
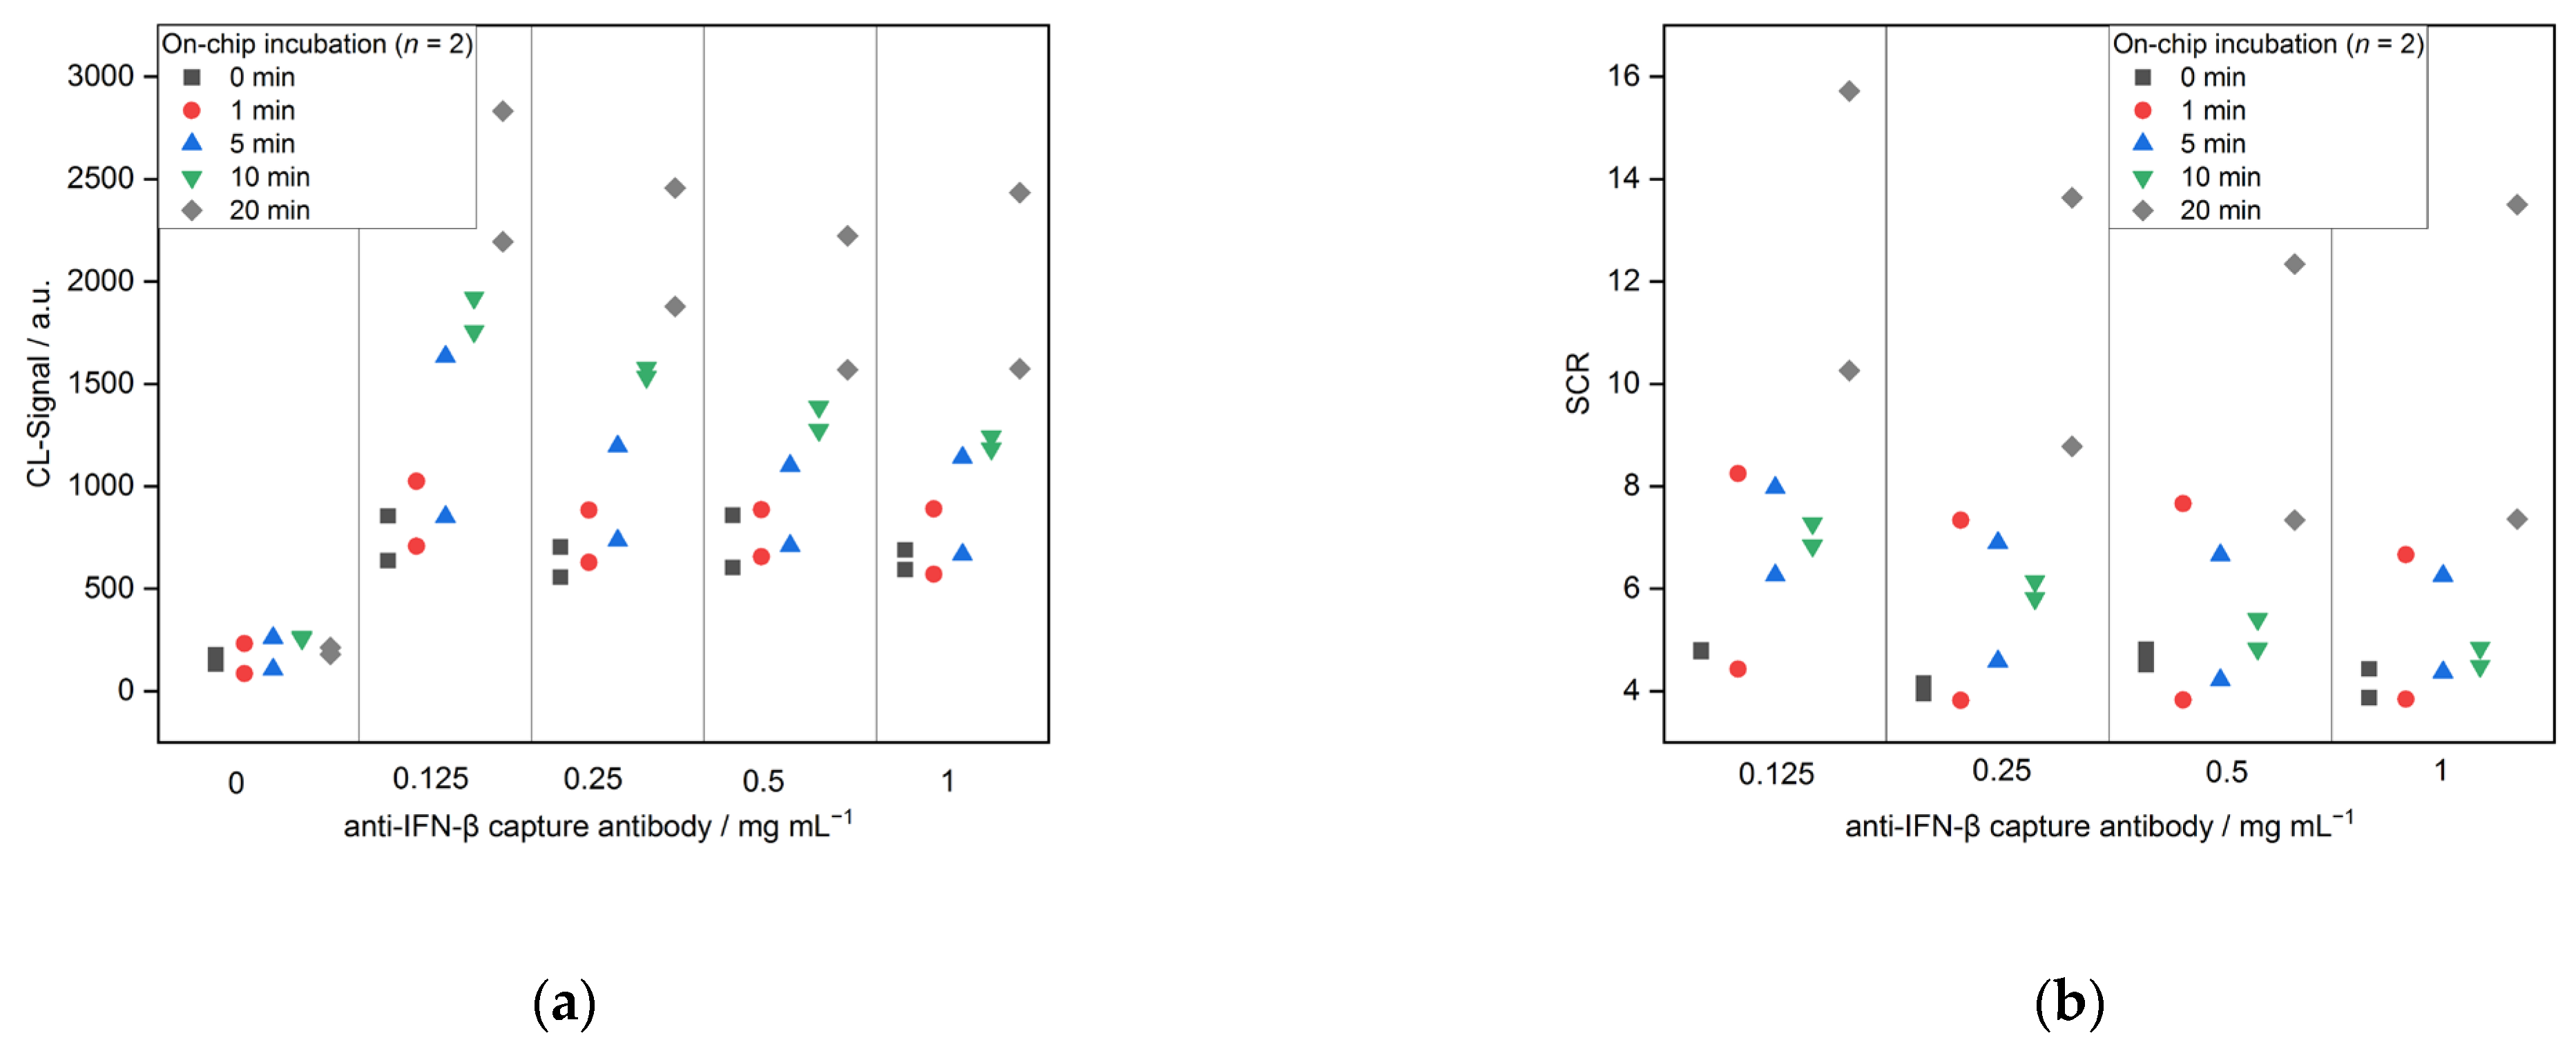
3.2.1. Optimization
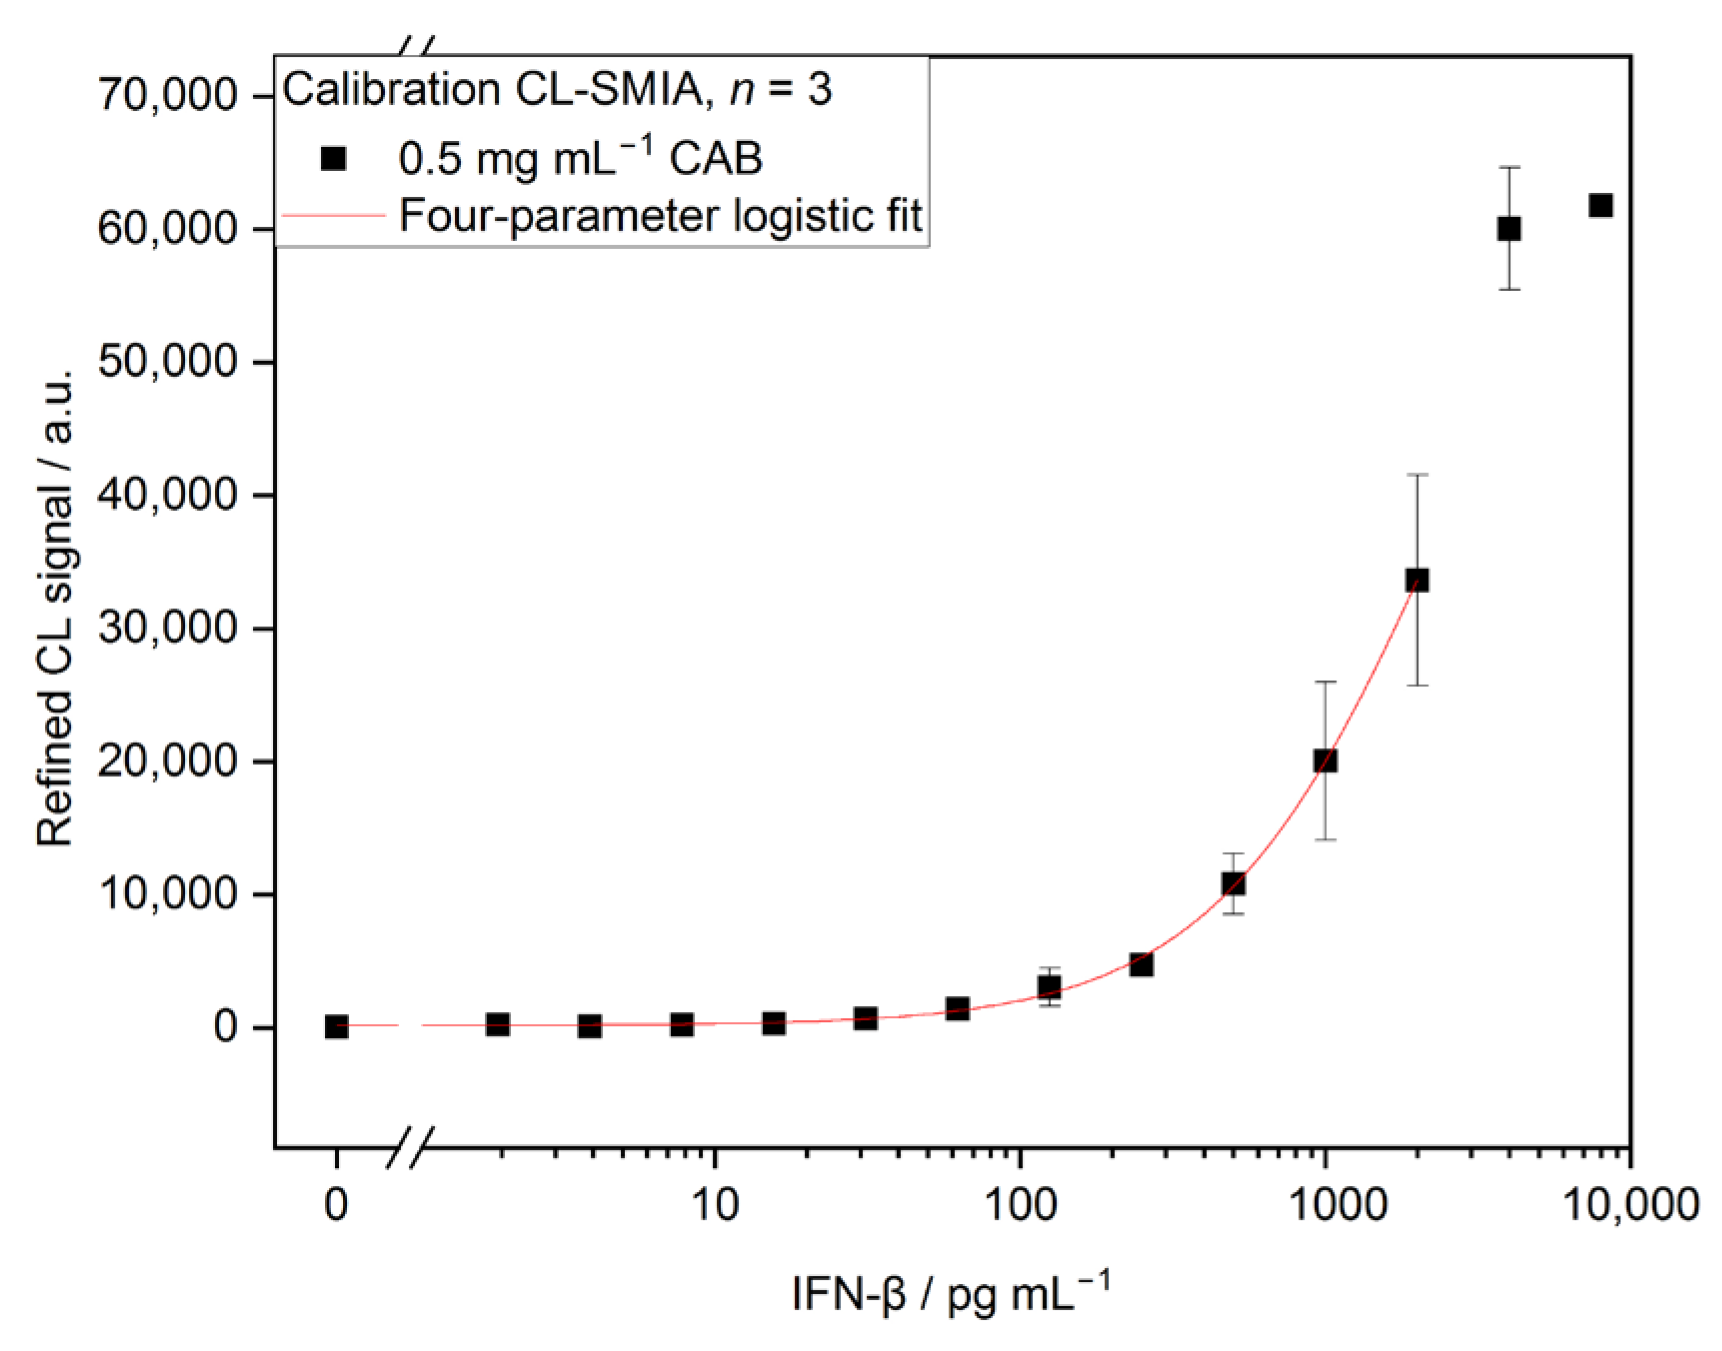
3.2.2. Calibration
3.3. Measurements in Nasal Samples
3.4. Comparison of ELISA and CL-SMIA
4. Conclusions
Supplementary Materials
Author Contributions
Funding
Institutional Review Board Statement
Informed Consent Statement
Data Availability Statement
Acknowledgments
Conflicts of Interest
References
- Califf, R.M. Biomarker definitions and their applications. Exp. Biol. Med. 2018, 243, 213–221. [Google Scholar] [CrossRef] [PubMed]
- Rifai, N.; Gillette, M.A.; Carr, S.A. Protein biomarker discovery and validation: The long and uncertain path to clinical utility. Nat. Biotechnol. 2006, 24, 971–983. [Google Scholar] [CrossRef] [PubMed]
- Ahn, S.-M.; Simpson, R.J. Body fluid proteomics: Prospects for biomarker discovery. Proteomics Clin. Appl. 2007, 1, 1004–1015. [Google Scholar] [CrossRef] [PubMed]
- Riechelmann, H.; Deutschle, T.; Rozsasi, A.; Keck, T.; Polzehl, D.; Bürner, H. Nasal biomarker profiles in acute and chronic rhinosinusitis. Clin. Exp. Allergy 2005, 35, 1186–1191. [Google Scholar] [CrossRef]
- Zissler, U.M.; Ulrich, M.; Jakwerth, C.A.; Rothkirch, S.; Guerth, F.; Weckmann, M.; Schiemann, M.; Haller, B.; Schmidt-Weber, C.B.; Chaker, A.M. Biomatrix for upper and lower airway biomarkers in patients with allergic asthma. J. Allergy Clin. Immunol. 2018, 142, 1980–1983. [Google Scholar] [CrossRef]
- Randall, R.E.; Goodbourn, S. Interferons and viruses: An interplay between induction, signalling, antiviral responses and virus countermeasures. J. Gen. Virol. 2008, 89, 1–47. [Google Scholar] [CrossRef]
- Rebuli, M.E.; Speen, A.M.; Clapp, P.W.; Jaspers, I. Novel applications for a noninvasive sampling method of the nasal mucosa. Am. J. Physiol. Lung Cell. Mol. Physiol. 2017, 312, L288–L296. [Google Scholar] [CrossRef]
- Hansel, T.T.; Tunstall, T.; Trujillo-Torralbo, M.-B.; Shamji, B.; Del-Rosario, A.; Dhariwal, J.; Kirk, P.D.W.; Stumpf, M.P.H.; Koopmann, J.; Telcian, A.; et al. A Comprehensive Evaluation of Nasal and Bronchial Cytokines and Chemokines Following Experimental Rhinovirus Infection in Allergic Asthma: Increased Interferons (IFN-γ and IFN-λ) and Type 2 Inflammation (IL-5 and IL-13). EBioMedicine 2017, 19, 128–138. [Google Scholar] [CrossRef]
- Guthrie, J.W.; Hamula, C.L.A.; Zhang, H.; Le, X.C. Assays for cytokines using aptamers. Methods 2006, 38, 324–330. [Google Scholar] [CrossRef]
- Krueger, A.; Stoll, T.; Shah, A.K.; Sinha, R.; Frazer, I.H.; Hill, M.M. Antibody-Free Multiplex Measurement of 23 Human Cytokines in Primary Cell Culture Secretome Using Targeted Mass Spectrometry. Anal. Chem. 2020, 92, 3742–3750. [Google Scholar] [CrossRef]
- Kim, S.T.; Muñoz-Grajales, C.; Dunn, S.E.; Schneider, R.; Johnson, S.R.; Touma, Z.; Ahmad, Z.; Bonilla, D.; Atenafu, E.G.; Hiraki, L.T.; et al. Interferon and interferon-induced cytokines as markers of impending clinical progression in ANA+ individuals without a systemic autoimmune rheumatic disease diagnosis. Arthritis Res. Ther. 2023, 25, 21. [Google Scholar] [CrossRef] [PubMed]
- Scavuzzo, M.C.; Rocchi, V.; Fattori, B.; Ambrogi, F.; Carpi, A.; Ruffoli, R.; Manganelli, S.; Giannessi, F. Cytokine secretion in nasal mucus of normal subjects and patients with allergic rhinitis. Biomed. Pharmacother. 2003, 57, 366–371. [Google Scholar] [CrossRef] [PubMed]
- Khalifian, S.; Raimondi, G.; Brandacher, G. The use of luminex assays to measure cytokines. J. Investig. Dermatol. 2015, 135, 1–5. [Google Scholar] [CrossRef] [PubMed]
- Battaglia, T.M.; Masson, J.-F.; Sierks, M.R.; Beaudoin, S.P.; Rogers, J.; Foster, K.N.; Holloway, G.A.; Booksh, K.S. Quantification of cytokines involved in wound healing using surface plasmon resonance. Anal. Chem. 2005, 77, 7016–7023. [Google Scholar] [CrossRef]
- Rahimian, A.; Siltanen, C.; Feyzizarnagh, H.; Escalante, P.; Revzin, A. Microencapsulated Immunoassays for Detection of Cytokines in Human Blood. ACS Sens. 2019, 4, 578–585. [Google Scholar] [CrossRef]
- Joung, H.-A.; Hong, D.-G.; Kim, M.-G. A high sensitivity chemiluminescence-based CMOS image biosensor for the detection of human interleukin 5 (IL-5). In Proceedings of the 2012 IEEE Sensors, Taipei, Taiwan, 28–31 October; Staff, I., Ed.; IEEE: Piscataway, NJ, USA, 2012; pp. 1–3, ISBN 978-1-4577-1767-3. [Google Scholar]
- Seidel, M.; Niessner, R. Automated analytical microarrays: A critical review. Anal. Bioanal. Chem. 2008, 391, 1521–1544. [Google Scholar] [CrossRef]
- Boehm, N.; Riechardt, A.I.; Wiegand, M.; Pfeiffer, N.; Grus, F.H. Proinflammatory cytokine profiling of tears from dry eye patients by means of antibody microarrays. Investig. Ophthalmol. Vis. Sci. 2011, 52, 7725–7730. [Google Scholar] [CrossRef]
- Thwaites, R.S.; Ito, K.; Chingono, J.M.S.; Coates, M.; Jarvis, H.C.; Tunstall, T.; Anderson-Dring, L.; Cass, L.; Rapeport, G.; Openshaw, P.J.; et al. Nasosorption as a Minimally Invasive Sampling Procedure: Mucosal Viral Load and Inflammation in Primary RSV Bronchiolitis. J. Infect. Dis. 2017, 215, 1240–1244. [Google Scholar] [CrossRef]
- Knight, P.R.; Sreekumar, A.; Siddiqui, J.; Laxman, B.; Copeland, S.; Chinnaiyan, A.; Remick, D.G. Development of a sensitive microarray immunoassay and comparison with standard enzyme-linked immunoassay for cytokine analysis. Shock 2004, 21, 26–30. [Google Scholar] [CrossRef]
- Chen, P.; Chung, M.T.; McHugh, W.; Nidetz, R.; Li, Y.; Fu, J.; Cornell, T.T.; Shanley, T.P.; Kurabayashi, K. Multiplex serum cytokine immunoassay using nanoplasmonic biosensor microarrays. ACS Nano 2015, 9, 4173–4181. [Google Scholar] [CrossRef]
- Matson, R.S. Lateral Flow Microarray-Based ELISA for Cytokines. Methods Mol. Biol. 2023, 2612, 141–155. [Google Scholar] [CrossRef] [PubMed]
- Seidel, M.; Niessner, R. Chemiluminescence microarrays in analytical chemistry: A critical review. Anal. Bioanal. Chem. 2014, 406, 5589–5612. [Google Scholar] [CrossRef] [PubMed]
- Klüpfel, J.; Paßreiter, S.; Weidlein, N.; Knopp, M.; Ungerer, M.; Protzer, U.; Knolle, P.; Hayden, O.; Elsner, M.; Seidel, M. Fully Automated Chemiluminescence Microarray Analysis Platform for Rapid and Multiplexed SARS-CoV-2 Serodiagnostics. Anal. Chem. 2022, 94, 2855–2864. [Google Scholar] [CrossRef] [PubMed]
- Bemetz, J.; Kober, C.; Meyer, V.K.; Niessner, R.; Seidel, M. Succinylated Jeffamine ED-2003 coated polycarbonate chips for low-cost analytical microarrays. Anal. Bioanal. Chem. 2019, 411, 1943–1955. [Google Scholar] [CrossRef]
- Bose, I.; Ohlander, A.; Kutter, C.; Russom, A. An integrated all foil based micro device for point of care diagnostic applications. Sens. Actuators B Chem. 2018, 259, 917–925. [Google Scholar] [CrossRef]
- Thwaites, R.S.; Jarvis, H.C.; Singh, N.; Jha, A.; Pritchard, A.; Fan, H.; Tunstall, T.; Nanan, J.; Nadel, S.; Kon, O.M.; et al. Absorption of Nasal and Bronchial Fluids: Precision Sampling of the Human Respiratory Mucosa and Laboratory Processing of Samples. J. Vis. Exp. 2018, 131, e56413. [Google Scholar] [CrossRef]
- Klüpfel, J.; Paßreiter, S.; Rumpf, M.; Christa, C.; Holthoff, H.-P.; Ungerer, M.; Lohse, M.; Knolle, P.; Protzer, U.; Elsner, M.; et al. Automated detection of neutralizing SARS-CoV-2 antibodies in minutes using a competitive chemiluminescence immunoassay. Anal. Bioanal. Chem. 2023, 415, 391–404. [Google Scholar] [CrossRef]
- Neumair, J.; Elsner, M.; Seidel, M. Flow-Based Chemiluminescence Microarrays as Screening Platform for Affinity Binders to Capture and Elute Bacteria. Sensors 2022, 22, 8606. [Google Scholar] [CrossRef]
- Sollweck, K.; Streich, P.; Elsner, M.; Seidel, M. A Chip-Based Colony Fusion Recombinase Polymerase Amplification Assay for Monitoring of Antimicrobial Resistance Genes and Their Carrying Species in Surface Water. ACS EST Water 2021, 1, 584–594. [Google Scholar] [CrossRef]


| Optimization of | Pre-Incubation/min | Incubation Chip/min | DAB /ng mL−1 | Sample Delivery /μL s−1 | Dilution Strep-HRP |
|---|---|---|---|---|---|
| Strep-HRP | 30 | 5 | 625.0 | 0.5 | 1:1500, 1:2000, 1:2500 |
| Pre-incubation | 15, 30, 45, 60 | 5 | 625.0 | 0.5 | 1:2500 |
| Incubation chip | 45 | 0, 1, 5, 10, 20 | 625.0 | 0.5 | 1:2500 |
| Sample delivery | 45 | 20 | 625.0 | 0.5, 1.0, 2.0, 4.0, 8.0 | 1:2500 |
| DAB concentration | 45 | 20 | 312.5, 625.0, 937.5, 1250, 1875 | 0.5 | 1:2500 |
| Final | 45 | 20 | 312.5 | 0.5 | 1:2500 |
| Process | Volume/μL | Time/min | Comments |
|---|---|---|---|
| Pre-incubation | Sample 50 | 45 | |
| DAB 1.25 | |||
| BSA 6.9 | |||
| Injection into chip | 60 | 20 | With pipette |
| Insert chip into device | |||
| Volume/μL | Flow rate/μL s−1 | ||
| Direct sample over chip | 50 | 0.5 | |
| Wash chip | 1500 | 325 | 2 increments, pause 1 s |
| Incubate strep-HRP | 160 | 50 | |
| 600 | 2 | ||
| Wash chip | 1500 | 325 | 2 increments, pause 1 s |
| Add CL reagents | 400 | 100 | Mixture 1:1 |
| Take image | 60 s exposure | ||
| Flush device | 2500 | 500 | Sample loop |
| 2500 | 500 | Sample way | |
| 2500 | 500 | Chip (extra washing chip) |
| Cost | Comments | |
|---|---|---|
| PC-chip surface | 0.21 € | PC foil and coating |
| Spotting | 0.002 € | Spotting buffer and CAB antibody |
| Assembly of microarray chip | 1.38 € | POM carrier and adhesive |
| Total | 1.60 € |
| Assay Step | ELISA | CL-SMIA | |
|---|---|---|---|
| Sample incubation | 2 h | (2) 20 min on-chip | |
| Blocking | 1 h | - | |
| DAB incubation | 2 h | (1) 45 min pre-incubation | |
| Detection | 40 min | 10 min | |
| Total | 1 measurement | 5 h 40 min | 1 h 15 min |
| Duplicate | 5 h 40 min | 1 h 30 min | |
| 96 measurements | 5 h 40 min | 25 h | |
Disclaimer/Publisher’s Note: The statements, opinions and data contained in all publications are solely those of the individual author(s) and contributor(s) and not of MDPI and/or the editor(s). MDPI and/or the editor(s) disclaim responsibility for any injury to people or property resulting from any ideas, methods, instructions or products referred to in the content. |
© 2023 by the authors. Licensee MDPI, Basel, Switzerland. This article is an open access article distributed under the terms and conditions of the Creative Commons Attribution (CC BY) license (https://creativecommons.org/licenses/by/4.0/).
Share and Cite
Neumair, J.; Kröger, M.; Stütz, E.; Jerin, C.; Chaker, A.M.; Schmidt-Weber, C.B.; Seidel, M. Flow-Based CL-SMIA for the Quantification of Protein Biomarkers from Nasal Secretions in Comparison with Sandwich ELISA. Biosensors 2023, 13, 670. https://doi.org/10.3390/bios13070670
Neumair J, Kröger M, Stütz E, Jerin C, Chaker AM, Schmidt-Weber CB, Seidel M. Flow-Based CL-SMIA for the Quantification of Protein Biomarkers from Nasal Secretions in Comparison with Sandwich ELISA. Biosensors. 2023; 13(7):670. https://doi.org/10.3390/bios13070670
Chicago/Turabian StyleNeumair, Julia, Marie Kröger, Evamaria Stütz, Claudia Jerin, Adam M. Chaker, Carsten B. Schmidt-Weber, and Michael Seidel. 2023. "Flow-Based CL-SMIA for the Quantification of Protein Biomarkers from Nasal Secretions in Comparison with Sandwich ELISA" Biosensors 13, no. 7: 670. https://doi.org/10.3390/bios13070670
APA StyleNeumair, J., Kröger, M., Stütz, E., Jerin, C., Chaker, A. M., Schmidt-Weber, C. B., & Seidel, M. (2023). Flow-Based CL-SMIA for the Quantification of Protein Biomarkers from Nasal Secretions in Comparison with Sandwich ELISA. Biosensors, 13(7), 670. https://doi.org/10.3390/bios13070670