Abstract
Copper ferrites containing Cu+ ions can be highly active heterogeneous Fenton catalysts due to synergic effects between Fe and Cu ions. Therefore, a method of copper ferrite nanosphere (CFNS) synthesis was selected that also permits the formation of cuprite, obtaining a CFNS composite that was subsequently calcined up to 400 °C. Composites were tested as Fenton catalysts in the mineralization of phenol (PHE), p-nitrophenol (PNP) and p-aminophenol (PAP). Catalysts were characterized by transmission electron microscopy (TEM), scanning electron microscopy (SEM), X-ray diffraction (XRD), Fourier transform infrared spectroscopy (FTIR), X-ray photoelectron spectroscopy (XPS) and magnetic measurements. Degradation of all phenols was practically complete at 95% total organic carbon (TOC) removal. Catalytic activity increased in the order PHE < PNP < PAP and decreased when the calcination temperature was raised; this order depended on the electronic effects of the substituents of phenols. The as-prepared CFNS showed the highest catalytic activity due to the presence of cubic copper ferrite and cuprite. The Cu+ surface concentration decreased after calcination at 200 °C, diminishing the catalytic activity. Cuprite alone showed a lower activity than the CFNS composite and the homogeneous Fenton reaction had almost no influence on its overall activity. CFNS activity decreased with its reutilization due to the disappearance of the cuprite phase. Degradation pathways are proposed for the phenols.
1. Introduction
The Fenton reaction is an advanced oxidation process (AOP) widely used to remove recalcitrant or non-biodegradable organic pollutants from waters, thanks to the formation of hydroxyl radicals (HO•) [1], which are powerful oxidants (E0 = 2.8 V). They are produced at acid pHs according to Equation (1).
Fe2+ + H2O2 → Fe3+ + OH− + HO•
Then Fe2+ ions are regenerated according to Equation (2)
Fe3+ + H2O2 → Fe2+ + H+ + HO2•
Basically, Equations (1) and (2) describe the Fenton process, although it includes other reactions [1,2]. The reaction rate constants of Equations (1) and (2) are 70 and ~10−2–10−3 M−1 s−1, respectively [3]. Equation (2) has the lowest reaction rate and is the rate determining step in HO• generation [3,4]. Therefore, the reaction given by Equation (2) must be accelerated to increase the activity of heterogeneous Fenton catalysts based on Fe ions (2). One option is to introduce Cu+ ions that generate hydroxyl radicals according to Equation (3).
Cu+ + H2O2 → Cu2+ + OH− + HO•
Then Cu2+ ions are reduced by hydrogen peroxide [5,6,7] according to Equation (4).
Cu2+ + H2O2 → Cu+ + H+ + HO2•
The reaction rate constants of Equations (3) and (4) are 1.0 × 10⁴ and 4.6 × 10² M−1 s−1, respectively [7], higher than those observed for Fe ions in Equations (1) and (2). Importantly, however, Fe and Cu ions may interact in bimetallic catalysts and in some copper ferrite catalysts, thus increasing their activity. This interaction has been attributed to a synergic effect between Cu+/Cu2+ and Fe2+/Fe3+ redox pairs [3,7], which can be expressed by the reaction given in Equation (5)
Fe3+ + Cu+ → Fe2+ + Cu2+
The rate constant of this reaction is 1.3 × 10⁷ M−1 s−1, which is much faster than reaction (2), producing a rapid reduction in Fe3+ [3]. According to these results, copper ferrites that contain Cu+ ions may be good heterogeneous Fenton catalysts. For this reason, the first objective of this work was to prepare copper ferrite nanosphere (CFNS) composites using a synthesis method that produces a mixture of copper ferrite and cuprite. This can be achieved by including as an ingredient ethylene glycol, which can partially reduce the cupric salt used to prepare the copper ferrite. Different portions of the as-prepared CFNS composite were calcined at 200 and 400 °C. All samples were characterized to determine their morphology, surface area, phase composition and size as well as the oxidation of the metal ions, their distribution and their magnetic properties.
The second objective was to study the activity of the CFNS composites in the mineralization of three phenols (phenol (PHE), p-nitrophenol (PNP), and p-aminophenol (PAP)) that contain substituents in their aromatic rings that possess different electron-donating and -withdrawing properties against electrophilic attacks, e.g., by hydroxyl radicals. These properties were related to the activity of the catalysts. The phenols used in this work are common water pollutants and can also be considered as model molecules for other pollutants.
2. Materials and Methods
2.1. Synthesis of CFNS Composites
A CFNS composite was prepared using a solvothermal method [8,9]. Briefly, CuCl2·2H2O (3.13 mmol) and FeCl3·6H2O (6.26 mmol) were dissolved in ethylene glycol (50 mL) followed by the addition of 4.5 g sodium acetate and 2.0 g polyethylene glycol. The mixture was vigorously stirred for 30 min and then sealed in a 125 mL Teflon-lined stainless-steel autoclave, which was heated to 200 °C and kept at this temperature for 12 h before cooling to room temperature. The black solid was centrifuged and washed several times with ethanol and finally dried at 60 °C for 8 h. It was then calcined in an air-oven at 200 and 400 °C for 3 h. Samples were kept in a desiccator until their use and were identified by adding a number to CFNS that indicated their treatment temperature (e.g., CFNS400).
2.2. Characterization Methods
The morphology was examined by TEM and SEM using a JEOL JEM-1010 microscope (JEOL Europe SAS, Croissy, France) and a Carl Zeiss SMT equipment (Carl Zeiss SMT, Oberkochen, Germany), respectively. Brunauer-Emmett-Teller (BET) surface area, SBET, was determined with N2 at −196 °C using an Autosorb 1 from Quantachrome (Boyton Beach, FL, USA). XPS was performed using an Escalab 200R system (Thermo Fisher Scientific, East Grinstead, UK) equipped with MgKα X-ray source as described elsewhere [6]. Previously, samples were outgassed at room temperature and 10−7 Pa. The crystalline structure of catalysts was examined by XRD collected on an X-ray Empyrean diffractometer with PIXcel-3D detector (Empyrean, PANanalytical, Almelo, The Netherlands) under the same experimental conditions described elsewhere [6].
FTIR spectra were collected with a Bruker Vertex 70 spectrometer (Bruker, Ettlingen, Germany) and were recorded in the range of 1800–400 cm−1 with 2 cm−1 resolution in transmission mode, at room temperature and with attenuated total reflectance accessories.
The magnetization (M) of catalysts versus the magnetic field applied (H) at room temperature were collected with a SQUID magnetometer (Quantum Design model MPMS-XL, San Diego, CA, USA). The saturation and remnant magnetization, MS and MR, respectively, and the coercivity, HC, of the bulk samples were obtained from the M–H curves.
2.3. Fenton Reaction
The Fenton reaction was carried out at 35 °C and pH 3 using different conical flasks containing 0.1 L of reaction solution and 100 mg L−1 of catalyst that were shaken at 300 rpm. The concentration of the phenolic compounds was always 0.107 mM and that of the H2O2 was 1.50, 1.45 and 1.40 mM for PHE, PNP and PAP, respectively, and these concentrations correspond to the stoichiometric mineralization of the phenolic compound used according to Equations (6)–(8).
C6H6O + 14H2O2 → 6CO2 + 17H2O
2C6H5NO3 + 27H2O2 → 12CO2 + 32H2O + 2NO2
C6H7NO + 13H2O2 → 6CO2 + 15H2O + NH3
The experimental procedure was similar to that described elsewhere [10]. Phenol compound concentrations in solution were determined using a Thermo-Fisher HPLC equipped with an UV8000 photodiode detector, and a Hypersil Gold chromatographic column (250 × 4.6 mm). The mobile phase for PHE and PNP was a mixture of 60% HPLC grade methanol and 40% ultrapure water in isocratic mode with an elution flow rate of 0.8 mL min−1; in the case of PAP, the mobile phase was a mixture of 48% HPLC grade methanol and 52% ultrapure water in isocratic mode (0.5% formic acid) with an elution flow rate of 1 mL min−1. The injection volume was 20 μL in all samples. The detector wavelength was 269, 318 and 220 nm for PHE, PNP and PAP, respectively. The TOC was measured with a TOC-5000A model Shimadzu analyzer, considering the average of at least three measurements with an accuracy of ±5%.
The residual H2O2 concentration in solution and the leaching of copper and iron from the catalysts was determined as described elsewhere [6]. Concentrations of NO2−, NO3− and NH4+ ions in solution were determined with Specific Merck Spectroquant kits, based on the formation of a red-violet azo dye for NO2− ions (Test kit 1.14776), a red nitro compound for NO3− ions (Test kit 1.14773) and an indophenol blue derivative for NH4+ ions (Test kit 1.14752). These compounds were determined photometrically with a Palintest 7100 Photometer at 542, 330 and 690 nm, for NO2−, NO3− and NH4+ ions, respectively.
3. Results and Discussion
3.1. Characteristics of the Catalysts
Figure 1 depicts TEM and SEM micrographs, showing that all CFNS samples are composed of nanospheric particles. The CFNS and CFNS200 samples consisted of numerous well-distributed heterojunction nanocrystals with a dandelion-like structure. This structure disappeared in sample CFNS400 because the increase in calcination temperature sintered the nanocrystals, smoothing the surface of the nanospheres. However, the size of the CFNS was not affected by calcination. Thus, the mean diameter of all samples, based on at least 200 particles from different images, was around 150 nm. Sintering of the nanocrystals on the surface of the nanospheres at higher temperatures reduced the SBET from 47 m2 g−1 in CFNS to 38 and 12 m2 g−1 in CFNS200 and CFNS400, respectively.

Figure 1.
TEM micrographs of (A) copper ferrite nanosphere (CFNS); (B) CFNS200; (C) CFNS400 and SEM micrograph of (D) CFNS400.
Figure 2 depicts the XRD patterns of the fresh catalysts, and Table 1 exhibits the results obtained. CFNS and CFNS200 showed the same phases: c-CuFe2O4, Cu2O and Cu. The presence of metallic Cu and Cu+ ions in CFNS was due to the reduction by ethylene glycol of some Cu2+ ions present in the solution. CFNS200 showed similar spinel content and crystallite size to those of CFNS but a higher Cu2O content and lower Cu content, due to the oxidation of part of the metallic Cu during calcination at 200 °C [11,12], which also increased the crystallite size. Cuprite and metallic copper were oxidized to tenorite at 400 °C (CFNS400). The phase percentage of c-CuFe2O4 slightly decreased from CNFS to CNFS400 but the crystallite size remained unchanged.
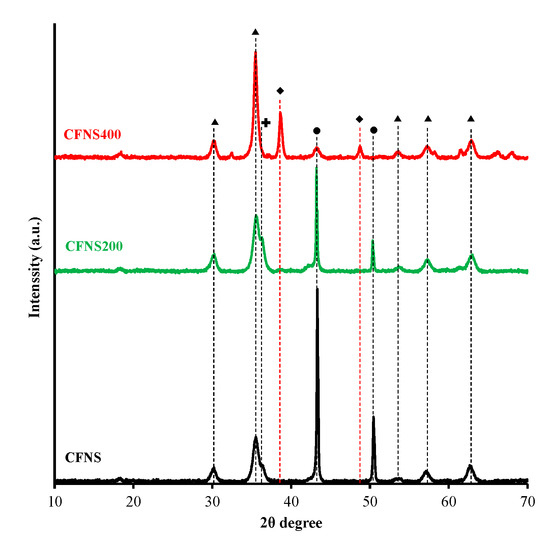
Figure 2.
XRD patterns of CFNS composites. (▲) cubic spinel; (♦) tenorite; (●) copper; (✚) cuprite.

Table 1.
Crystalline phases and percentages, and crystallite sizes of the catalysts from XRD patterns.
FTIR spectra between 1800 and 400 cm−1 for the CFNS sample and its calcined derivatives are depicted in Figure 3. CFNS shows a broad absorption band at ~1600 cm−1, assigned to the bending mode of remaining H2O molecules and OH groups [13,14]; the spectrum also shows a band at ~1440 cm−1, assigned to C–H bending of methylene groups from the compounds used to prepare this sample and at ~1070 cm−1, attributed to O–H stretching modes [15]. All of these bands disappeared in the calcined samples demonstrating the complete removal of organic residues and water.
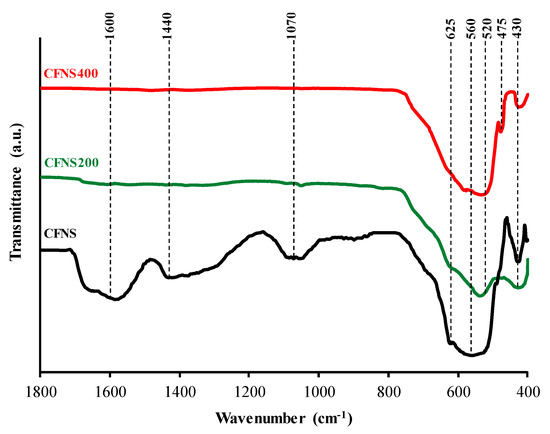
Figure 3.
FTIR spectra of CFNS composites.
FTIR spectra of the original and calcined CNFS samples showed principal absorption bands in the range of ~600 and ~400 cm−1, typical of ferrites and corresponding to the intrinsic lattice vibration of tetrahedral A sites (lesser bond length of oxygen-metal ions) and octahedral B sites (greater bond length), respectively [16,17,18]. In inverse ferrites, such as copper ferrite, the tetrahedral and octahedral sites would be occupied by Fe3+ and Cu2+ ions, respectively.
CFNS shows vibration bands at 625 and 560 cm−1, assigned to Cu2+–O2− and Fe3+–O2− vibrations in tetrahedral sites, respectively, and also at 430 cm−1, assigned to Cu2+ –O2− vibrations in octahedral sites [19,20]. Therefore, Cu2+ ions occupy both octahedral and tetrahedral sites. Sample CFNS200 also shows bands at 625, 530 and 430 cm−1. On the other hand, the band at 625 cm−1 might also be attributed to Cu+–O2− vibrations in Cu2O [21,22], which was shown by XRD to be present in CNFS and CNFS200 (Table 1).
In CFNS400 the band at 625 cm−1 disappears, the band assigned to Fe3+–O2− vibrations in tetrahedral sites is shifted to 520 cm−1, and the band at 430 cm−1 did not vary. XRD revealed that CFNS400 contained CuO, which shows peaks at 588, 530, 480 and 430 cm−1 [21,22]. Some of them overlapped with other peaks assigned to the spinel.
Figure 4A,B depicts the XP spectra of Fe and Cu 2p core level regions, respectively, and the results are compiled in Table 2. Deconvolution of the broad Fe 2p3/2 peak showed two more peaks: the first at a BE of 709.8 eV accompanied by a satellite peak at 718.5 eV, indicating the presence of Fe3+ cations [6,23]; and the second at 711.3 eV indicating the presence of Fe3+ cations in two different coordinations, i.e., tetrahedral sites at higher BE (second peak) and octahedral sites at lower BE (first peak) [24].
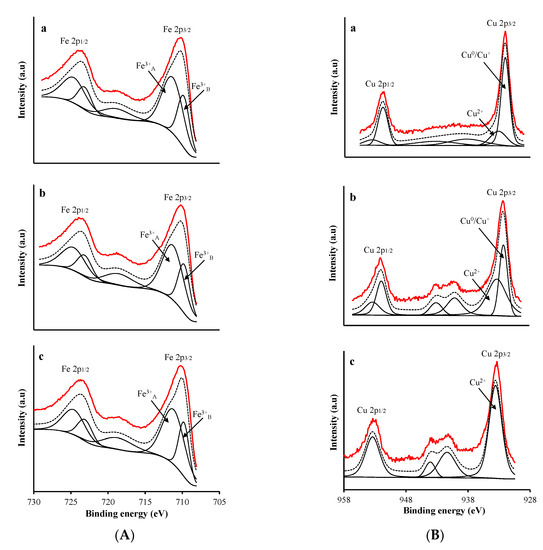
Figure 4.
XPS profiles of (A) Fe 2p and (B) Cu 2p region in: (a) CFNS; (b) CFNS200; (c) CFNS400. Continuous red line: experimental profile; discontinuous black line: fitted profile.
Table 2.
Binding energy (eV) of the main XPS peaks with percentage (in parentheses) and Cu/Fe surface atomic ratio.
The Cu 2p3/2 spectra of CFNS and CFNS200 showed two peaks at 932.3 and 933.5 eV, assigned to reduced copper species (Cu0/Cu+) and Cu2+, respectively, and a shake-up satellite at around 942 eV [25,26]. The Cu+ surface concentration was lower on CFNS200 than on CFNS (Table 2), consistent with the larger crystallite size of Cu2O measured by XRD in the former. The Cu 2p3/2 spectra of CFNS400 had only one peak at 933.6 eV, corresponding to Cu2+.
Figure 5 depicts the room temperature M–H curves, which have a normal S-shape, suggesting a significant content of ferrimagnetic materials. Table 3 displays the results derived from these curves. All samples can be considered superparamagnetic due to their very low MR/MS ratio [27]. The saturation magnetization is influenced by the crystallite size of the ferrimagnetic phase and the distribution of Cu2+ ions between B and A sites, i.e., the inversion degree of the spinel. Thus, an increase in crystallite size and inversion degree increases the MS value [27,28]. CFNS and CFNS200 showed similar MS values because they have a similar percentage and crystallite size of the ferrimagnetic spinel phase. CFNS400 showed a lower MS value due to a decrease in the percentage of the spinel phase.
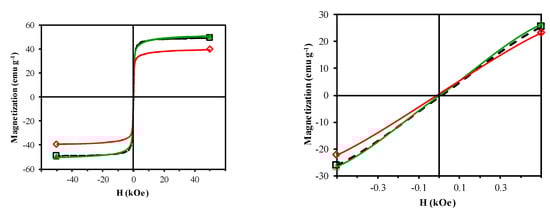
Figure 5.
Magnetization versus applied magnetic field for: (□) CFNS; (△) CFNS200; (◇) CFNS400.
Table 3.
Saturation magnetization (MS), remnant magnetization (MR), and coercivity (HC) values of the catalysts.
3.2. Fenton Reaction
Figure 6 depicts the PHE, PNP and PAP degradation kinetics curves obtained with different catalysts. Similar curves were obtained for TOC removal (Figure 7A) and H2O2 decomposition (Figure 7B). Figure 8 plots the Cu ions leached from the catalysts against reaction time. Table 4 exhibits the results obtained from these curves when 95% TOC removal was reached. The degradation of phenols using H2O2 alone, with no catalyst, was 1.9%, 2.5% and 7.5% for PHE, PNP and PAP, respectively, indicating the poor oxidation power of H2O2 against these phenols. In addition, blank experiments in the absence of H2O2 showed no adsorption of PHE or PAP on the catalyst and only a slight adsorption of PNP (~1.4%), demonstrating that the adsorption of phenols on these catalysts is negligible.

Figure 6.
Degradation kinetics of phenols: (◇) phenol (PHE); (△) p-nitrophenol (PNP); (○) p-aminophenol (PAP). Reaction conditions: T = 35 °C; Mass of catalyst = 100 mg L−1, Cphenols = 0.107 mM, CH2O2(PHE) = 1.50 mM, CH2O2(PNP) = 1.45 mM, CH2O2(PAP) = 1.40 mM, pH 3, V = 0.1 L.

Figure 7.
(A) Kinetics of total organic carbon (TOC) removal and (B) kinetics of H2O2 decomposition: (◇) PHE; (△) PNP; (○) PAP. Reaction conditions: T = 35 °C; Mass of catalyst = 100 mg L−1, Cphenols = 0.107 mM, CH2O2(PHE) = 1.50 mM, CH2O2(PNP) = 1.45 mM, CH2O2(PAP) = 1.40 mM, pH 3, V = 0.1 L.
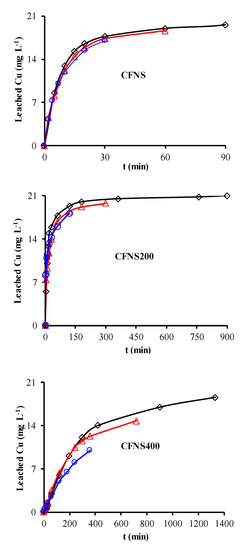
Figure 8.
Variations in the concentration of leached Cu ions at 35 °C from CFNS composites for different phenols: (◇) PHE; (△) PNP; (○) PAP.
Table 4.
Results obtained at the time needed to reach 95% TOC removal (t), percentage of PHE, PNP and PAP degraded, pseudo-first order rate constant for degradation (kd), TOCremoved/H2O2decomposed weight ratio (TOC/H2O2), Cu ion leaching (Culeac.) and concentration of NO3−, NO2− and NH4+ ions.
According to the results in Table 4, degradation of the phenols was practically complete at 95% TOC removal. The activity of the catalysts, given by the values of t and kd, depended on the type of phenol and the calcination temperature, increasing in the order PHE < PNP < PAP and decreasing at higher calcination temperatures. This order can be explained by the electron-donating (–OH and –NH2) or –withdrawing properties (–NO2) of the substituents of the phenols against electrophilic attack, e.g., by hydroxyl radicals. Thus, two, four and six positions of the aromatic ring are activated in PHE; two and six positions are doubly activated, and the fourth position is singly in PNP; and all positions are activated in PAP. Therefore, the above order of catalytic activity matches the order of increase in the number of activated aromatic ring positions.
CFNS has the highest catalytic activity due to the presence of cuprite together with cubic copper ferrite. Cu+ is known to be a good catalyst to decompose H2O2 into hydroxyl radicals [6,7], and a synergistic effect between Cu and Fe species was recently observed in Cu-Fe bimetallic catalysts [3]. This is because Cu+ produces a major increase in the rate constant for the reduction of Fe3+ to Fe2+ (Equation (5)), thereby enhancing the generation of hydroxyl radicals and the phenol degradation efficiency. Importantly, in comparison to CFNS200, CFNS has the same percentage and crystallite size of cubic spinel (Table 1) and a lower cuprite content but shows a higher activity, attributable to its smaller Cu2O crystallite size and therefore higher Cu+ surface concentration (Table 2).
Given the presence of cuprite in the above catalysts, its catalytic activity to degrade the phenols was tested using a commercial cuprite under the same experimental conditions as for CFNS and using the same amount of cuprite 17.2 mg L−1 as in this catalyst (see Table 1). As shown in Table 4, the percentage of PHE, PNP and PAP degraded at time t was, respectively, 18%, 52% and 55% lower than obtained with CFNS, especially in the case of PHE. These results demonstrate the synergistic effect between Cu and Fe species in the CFNS catalyst.
The TOC/H2O2 weight ratio, a measure of the efficiency of H2O2 utilization for 95% TOC removal, was not influenced by the catalyst used but rather by the type of phenol degraded, being ~0.30 for PNP and ~0.19 for PHE and PAP (Table 4).
Cu ions leached from all catalysts (Table 4), decreasing in the order PHE > PNP > PAP. The amount of Cu leached did not depend on the type of phenol but rather on the reaction time needed to reach 95% TOC removal, i.e., the contact time of the catalyst with the reactive solution. A smaller amount of Cu leached from CFNS400 than from the other two catalysts. No Fe ions leached from any of these catalysts.
Cu ions leached can act as homogeneous Fenton catalysts. To check this possibility, the homogeneous reaction was conducted using the amount of Cu ions leached from the CFNS catalyst at 95% TOC removal for each phenolic compound (see Table 4). Cu ion concentrations were added as sulphate. Table 4 shows that the percentage degradation for the CFNS catalyst at time t was 1, 3 and 13% for PHE, PNP and PAP, respectively, the same order of increase as observed for the heterogeneous Fenton reaction. These low percentages mean that the homogeneous Fenton reaction has practically no influence on the overall activity of the CFNS catalyst.
NO3− and NO2− ions were detected in the PNP degradation and NH4+ ions in the corresponding PAP degradation, and the results obtained (Table 4) were used to determine the percentage of nitrogen removed. This value was 21% for PNP and 86% for PAP with CFNS, versus 25% for PNP and 88% for PAP with CFNS400. The larger amount of N removed from the PAP solution is attributable to the formation of ammonia, which can escape more easily from the solution into the atmosphere. In addition, N removal was slightly higher with increased calcination temperature of the catalyst.
Degradation of the most active phenolic compound, PAP, was also studied using the recycled CFNS catalyst. For this purpose, the catalyst was withdrawn by filtration after its first use, washed with distilled water to neutral pH, and then used again in the PAP removal. This process was repeated twice, determining the PAP degradation kinetics (Figure 9) and Cu ion leaching. The kinetics decreased with the reutilization of the catalysts. Thus, the pseudo-first order rate constant for the degradation was 0.145, 0.018 and 0.012 min−1 and the Cu ion leaching was 17.0, 5.1 and 0.2 mgL−1 for the fresh catalyst and its first and second reutilizations, respectively. These results are attributed to the disappearance of the cuprite phase from CFNS after each reutilization [6] and would explain the major decrease in the activity of the catalyst after its first use.

Figure 9.
PAP degradation kinetics with fresh and reutilized CFNS catalyst.
HPLC was used to study the degradation intermediates of the phenols after treatment with the CFNS catalyst. Table 5, Table 6 and Table 7 exhibit the results obtained for PHE, PNP and PAP at two reaction times as a function of the activity of the phenolic compound. The appearance of these reaction intermediates can be explained by taking account of the activated aromatic ring positions against HO• electrophilic attack and results published in the literature [29,30,31,32,33,34].
Table 5.
Intermediate compounds from PHE degradation at different reaction times and TOC removal.
Table 6.
Intermediate compounds from PNP degradation at different reaction times and TOC removal.
Table 7.
Intermediate compounds from PAP degradation at different reaction times and TOC removal.
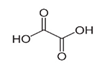
In the case of PHE, PHE, catechol, hydroquinone, p-benzoquinone, oxalic and formic acids were observed at 60 min of reaction time; the catechol and hydroquinone comes from the HO• attack on positions two and four, respectively, which are activated; p-benzoquinone comes from the oxidation of hydroquinone; and oxalic and formic acids from the ring opening of the aromatic compounds. Catechol and the acidic compounds remain at 90 min of reaction time; catechol is still present at this level of TOC removal because it is highly resistant to ring opening. The possible PHE degradation pathway is depicted in Figure 10.

Figure 10.
Proposed PHE degradation pathway.
In the case of PNP, PNP, hydroquinone, p-benzoquinone, oxalic and formic acids were observed at 30 min of reaction time. Aromatic ring position four is activated and positions two and six are doubly activated; therefore, hydroquinone is obtained after substitution of NO2− by a phenol group, and its subsequent oxidation yields p-benzoquinone. The oxalic and formic acids come from ring opening of the aromatic compounds against HO• electrophilic attack. Both acids remained after 60 min of reaction time. The possible PNP degradation pathway is depicted in Figure 11.

Figure 11.
Proposed PNP degradation pathway.
In the case of PAP, PAP, hydroquinone, p-benzoquinone, p-benzoquinone imine, oxalic and formic acids appeared after 10 min of reaction time; all aromatic ring positions are activated by the HO• attack. Therefore, hydroquinone comes from the substitution of the amino group by the phenol group and p-benzoquinone imine from the HO• attack on the amino group. The subsequent oxidation of these compounds yields p-benzoquinone. As noted above, the oxalic and formic acids come from ring opening of the aromatic compounds. P-benzoquinone imine and both acids remained after 30 min of reaction time. The possible PAP degradation pathway is depicted in Figure 12.
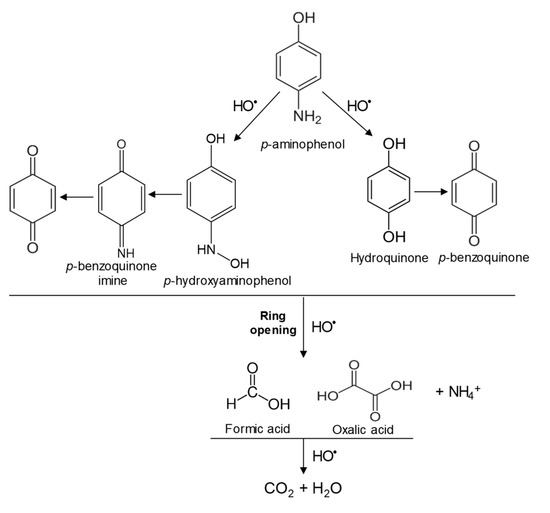
Figure 12.
Proposed PAP degradation pathway.
4. Conclusions
CFNS samples are composed of nanospheric particles. CFNS and CFNS200 contain three phases: c-CuFe2O4, Cu2O and Cu. Cuprite and metallic copper were oxidized to CuO when the calcination temperature increased to 400 °C. XPS showed that the Cu+ surface concentration was lower on CFNS200 than on CFNS due to the larger crystallite size of Cu2O as measured by XRD. All samples had very low MR/MS ratios, indicating substantial superparamagnetic behavior.
The activity of the catalysts decreased with higher calcination temperature and increased in the order PHE < PNP < PAP, matching the order of increase in the number of activated aromatic ring positions against electrophilic attacks. CFNS has the highest catalytic activity due to the presence of cuprite along with cubic copper ferrite. The phases of CFNS200 were similar to those of CFNS but its catalytic activity was lower, attributable to the lower Cu+ surface concentration caused by its larger Cu2O crystallite size. The cuprite alone showed lower catalytic activity than the CFNS composite, indicating the synergic effect between cuprite and copper ferrite. Cu ion leaching depended on the reaction time. The homogeneous Fenton reaction (due to leached Cu ions) had practically no influence on the overall activity of the CFNS catalyst. PAP degradation and Cu ion leaching decreased with reutilization of the CFNS catalyst, attributable to the disappearance of the cuprite phase after each reutilization. Possible degradation pathways are proposed for these phenols based on their degradation intermediates.
Author Contributions
C.M.-C., M.V.L.-R. and M.A.Á. conceived and designed the experiments; M.Á.F.-C. and L.M. performed the experiments; C.M.-C., M.V.L.-R., M.Á.F.-C., M.A.Á. and L.M. analyzed the data; C.M.C. and M.V.L.-R. wrote the paper.
Funding
This research was funded by Spanish Ministry of Economy, Industry and Competitiveness and FEDER (grant number CTQ2016-80978-C2-1-R), Asociación Universitaria Iberoamericana de Postgrado (AUIP) and University of Jaén.
Acknowledgments
The authors affiliated to the University of Jaén (Department of Inorganic and Organic Chemistry) acknowledge financial support from the Spanish Ministry of Economy, Industry and Competitiveness and from FEDER (Project CTQ2016-80978-C2-1-R). L. Mateus thanks the Asociación Universitaria Iberoamericana de Postgrado (AUIP) and University of Jaén for their grant and financial support.
Conflicts of Interest
The authors declare no conflict of interest.
References
- Muñoz, M.; de Pedro, Z.M.; Casas, J.A.; Rodríguez, J.J. Preparation of magnetite-based catalysts and their application in heterogeneous Fenton oxidation—A review. Appl. Catal. B Environ. 2015, 176–177, 249–265. [Google Scholar] [CrossRef]
- Pignatello, J.J.; Oliveros, E.; MacKay, A. Advanced oxidation processes for organic contaminant destruction based on the Fenton reaction and related chemistry. Crit. Rev. Environ. Sci. Technol. 2016, 36, 1–84. [Google Scholar] [CrossRef]
- Sun, Y.; Yang, Z.; Tian, P.; Sheng, Y.; Xu, J.; Han, Y.F. Oxidative degradation of nitrobenzene by a Fenton-like reaction with Fe-Cu bimetallic catalysts. Appl. Catal. B Environ. 2019, 244, 1–10. [Google Scholar] [CrossRef]
- Rigg, T.; Taylor, W.; Weiss, J. The rate constant of the reaction between hydrogen peroxide and ferrous ions. J. Chem. Phys. 1954, 22, 575–577. [Google Scholar] [CrossRef]
- Nichela, D.A.; Berkovic, A.M.; Costante, M.R.; Juliarena, M.P.; García Einschlag, F.S. Nitrobenzene degradation in Fenton-like systems using Cu(II) as catalyst. Comparison between Cu(II)-and Fe(III)-based systems. Chem. Eng. J. 2013, 228, 1148–1157. [Google Scholar] [CrossRef]
- López-Ramón, M.V.; Álvarez, M.A.; Moreno-Castilla, C.; Fontecha-Cámara, M.A.; Yebra-Rodríguez, A.; Bailón-Rodríguez, E. Effect of calcination temperature of a copper ferrite synthesized by a sol-gel method on its structural characteristics and performance as Fenton catalyst to remove gallic acid from water. J. Colloid Interface Sci. 2018, 511, 193–212. [Google Scholar] [CrossRef]
- Faheem, M.; Jiang, X.; Wang, L.; Shen, J. Synthesis of Cu2O-CuFe2O4 microparticles from Fenton sludge and its application in the Fenton process: The key role of Cu2O in the catalytic degradation of phenol. RSC Adv. 2018, 8, 5740–5748. [Google Scholar] [CrossRef]
- Deng, H.; Chen, H.Y.; Li, H. Synthesis of crystal MFe2O4 (M = Mg, Cu, Ni) microspheres. Mater. Chem. Phys. 2007, 101, 509–513. [Google Scholar] [CrossRef]
- Feng, J.; Su, L.; Ma, Y.; Ren, C.; Guo, Q.; Chen, X. CuFe2O4 magnetic nanoparticles: A simple and efficient catalyst for the reduction of nitrophenol. Chem. Eng. J. 2013, 221, 16–24. [Google Scholar] [CrossRef]
- Fontecha-Cámara, M.A.; Moreno-Castilla, C.; López-Ramón, M.V.; Álvarez, M.A. Mixed iron oxides as Fenton catalysts for gallic acid removal from aqueous solutions. Appl. Catal. B Environ. 2016, 196, 207–215. [Google Scholar] [CrossRef]
- Yakubi, A.; Tanaka, S. Oxidation behavior of copper nanoparticles at low temperature. Mater. Res. Bull. 2011, 46, 2323–2327. [Google Scholar]
- Chen, W.; Fan, Z.; Lai, Z. Synthesis of core—Shell heterostructured Cu/Cu2O nanowires monitored by in situ XRD as efficient visible-light photocatalysts. J. Mater. Chem. A 2013, 1, 13862–13868. [Google Scholar] [CrossRef]
- Zhao, W.; Zhang, S.; Ding, J.; Deng, Z.; Guo, L.; Zhong, Q. Enhanced catalytic ozonation for NOx removal with CuFe2O4 nanoparticles and mechanism analysis. J. Mol. Catal. A Chem. 2016, 424, 153–161. [Google Scholar] [CrossRef]
- Laokul, P.; Amornkitbamrung, V.; Seraphin, S.; Maensiri, S. Characterization and magnetic properties of nanocrystalline CuFe2O4, NiFe2O4, ZnFe2O4 powders prepared by the Aloe vera extract solution. Curr. Appl. Phys. 2011, 11, 101–108. [Google Scholar] [CrossRef]
- Zakiyah, L.B.; Saion, E.; Al Hada, N.M.; Gharibshahi, E.; Salem, A.; Soltani, N.; Gene, S. Up-scalable synthesis of size-controlled copper ferrite nanocrystals by thermal treatment method. Mat. Sci. Semicon. Proc. 2015, 40, 564–569. [Google Scholar] [CrossRef]
- Waldron, R.D. Infrared spectra of ferrites. Phys. Rev. 1955, 99, 1727. [Google Scholar] [CrossRef]
- Ding, Y.; Zhu, L.; Wang, N.; Tang, H. Sulfate radicals induced degradation of tetrabromobisphenol A with nanoscaled magnetic CuFe2O4 as a heterogeneous catalyst of peroxymonosulfate. Appl. Catal. B Environ. 2013, 129, 153–162. [Google Scholar] [CrossRef]
- Wu, F.; Li, X.; Wang, Z.; Xu, C.; He, H.; Qi, A.; Yin, X.; Guo, H. Preparation of high-value TiO2 nanowires by leaching of hydrolyzed titania residue from natural ilmenite. Hydrometallurgy 2013, 140, 82–88. [Google Scholar] [CrossRef]
- Selvan, R.K.; Augustin, C.O.; Berchmans, L.J.; Saraswathi, R. Combustion synthesis of CuFe2O4. Mater. Res. Bull. 2003, 38, 41–54. [Google Scholar] [CrossRef]
- Silva, M.D.P.; Silva, F.C.; Sinfrônio, F.S.M.; Paschoal, A.R.; Silva, E.N.; Paschoal, C.W.A. The effect of cobalt substitution in crystal structure and vibrational modes of CuFe2O4 powders obtained by polymeric precursor method. J. Alloys Compd. 2014, 584, 573–580. [Google Scholar] [CrossRef]
- Erdogan, I.Y.; Gullu, O. Optical and structural properties of CuO nanofilm: Its diode application. J. Alloys. Compd. 2010, 492, 378–383. [Google Scholar] [CrossRef]
- Khan, A.; Ullah, M.; Iqbal, T.; Mahmood, H.; Khan, A.; Shafique, M.; Majid, A.; Ahmed, A.; Khan, A. Surfactant assisted synthesis of cuprous oxide (Cu2O) nanoparticles via solvothermal process. Nanosci. Nanotechnol. Res. 2018, 3, 16–22. [Google Scholar]
- Wang, Y.; Zhao, H.; Li, M.; Fan, J.; Zhao, G. Magnetic ordered mesoporous copper ferrite as a heterogeneous Fenton catalyst for the degradation of imidacloprid. Appl. Catal. B Environ. 2014, 147, 534–545. [Google Scholar] [CrossRef]
- Jing, P.; Li, J.; Pan, L.; Wang, J.; Sun, X.; Liu, Q. Efficient photocatalytic degradation of acid fuchsin in aqueous solution using separate porous tetragonal-CuFe2O4 nanotubes. J. Hazard. Mater. 2015, 284, 163–170. [Google Scholar] [CrossRef] [PubMed]
- Albuquerque, A.S.; Tolentino, M.V.C.; Ardisson, J.D.; Moura, F.C.C.; de Mendonça, R.; Macedo, W.A.A. Nanostructured ferrites: Structural analysis and catalytic activity. Ceram. Int. 2012, 38, 2225–2231. [Google Scholar] [CrossRef]
- Guan, Y.H.; Ma, J.; Ren, Y.M.; Liu, Y.L.; Xiao, J.Y.; Lin, L.Q.; Zhang, C. Efficient degradation of atrazine by magnetic porous copper ferrite catalyzed peroxymonosulfate oxidation via the formation of hydroxyl and sulfate radicals. Water Res. 2013, 47, 5431–5438. [Google Scholar] [CrossRef] [PubMed]
- Xiao, Z.; Jin, S.; Wang, X.; Li, W.; Wang, J.; Liang, C. Preparation, structure and catalytic properties of magnetically separable Cu-Fe catalysts for glycerol hydrogenolysis. J. Mater. Chem. 2012, 22, 16598–16605. [Google Scholar] [CrossRef]
- Köferstein, R.; Walther, T.; Hesse, D.; Ebbinghaus, S.G. Crystallite-growth, phase transition, magnetic properties, and sintering behaviour of nano-CuFe2O4 powders prepared by a combustion-like process. J. Solid State Chem. 2014, 213, 57–64. [Google Scholar] [CrossRef]
- Santos, A.; Yustos, P.; Quintanilla, A.; Rodríguez, S.; García-Ochoa, F. Route of the catalytic oxidation of phenol in aqueous phase. Appl. Catal. B Environ. 2002, 39, 97–113. [Google Scholar] [CrossRef]
- Zazo, J.A.; Casas, J.A.; Mohedano, A.F.; Rodríguez, J.J. Catalytic wet peroxide oxidation of phenol with a Fe/active carbon catalyst. Appl. Catal. B Environ. 2006, 65, 261–268. [Google Scholar] [CrossRef]
- Subbulekshmi, N.L.; Subramanian, E. Nano CuO immobilized fly ash zeolite Fenton-like catalyst for oxidative degradation of p-nitrophenol and p-nitroaniline. J. Environ. Chem. Eng. 2017, 5, 1360–1371. [Google Scholar] [CrossRef]
- Xiong, Z.; Cao, J.; Lai, B.; Yang, P. Comparative study on degradation of p-nitrofenol in aqueous solution by mFe/Cu/O3 and mFe0/O3 processes. J. Ind. Eng. Chem. 2018, 59, 196–207. [Google Scholar] [CrossRef]
- He, Z.; Song, S.; Ying, H.; Xu, L.; Chen, J. p-Aminophenol degradation by ozonation combined with sonolysis: Operating conditions influence and mechanism. Ultrason. Sonochem. 2007, 14, 568–574. [Google Scholar] [CrossRef] [PubMed]
- Min, S.; Risheng, Y.; Yahua, Y.; Shengsong, D.; Wenxia, G. Degradation of 4-aminophenol by hydrogen peroxide oxidation using enzime from Serratia Marcescens as catalyst. Front. Environ. Sci. Eng. Chin. 2007, 1, 95–98. [Google Scholar]


© 2019 by the authors. Licensee MDPI, Basel, Switzerland. This article is an open access article distributed under the terms and conditions of the Creative Commons Attribution (CC BY) license (http://creativecommons.org/licenses/by/4.0/).