
Characterization of Ti/SnO2 Interface by X-ray Photoelectron Spectroscopy

Abstract
:1. Introduction
2. Experimental
3. Results and Discussion
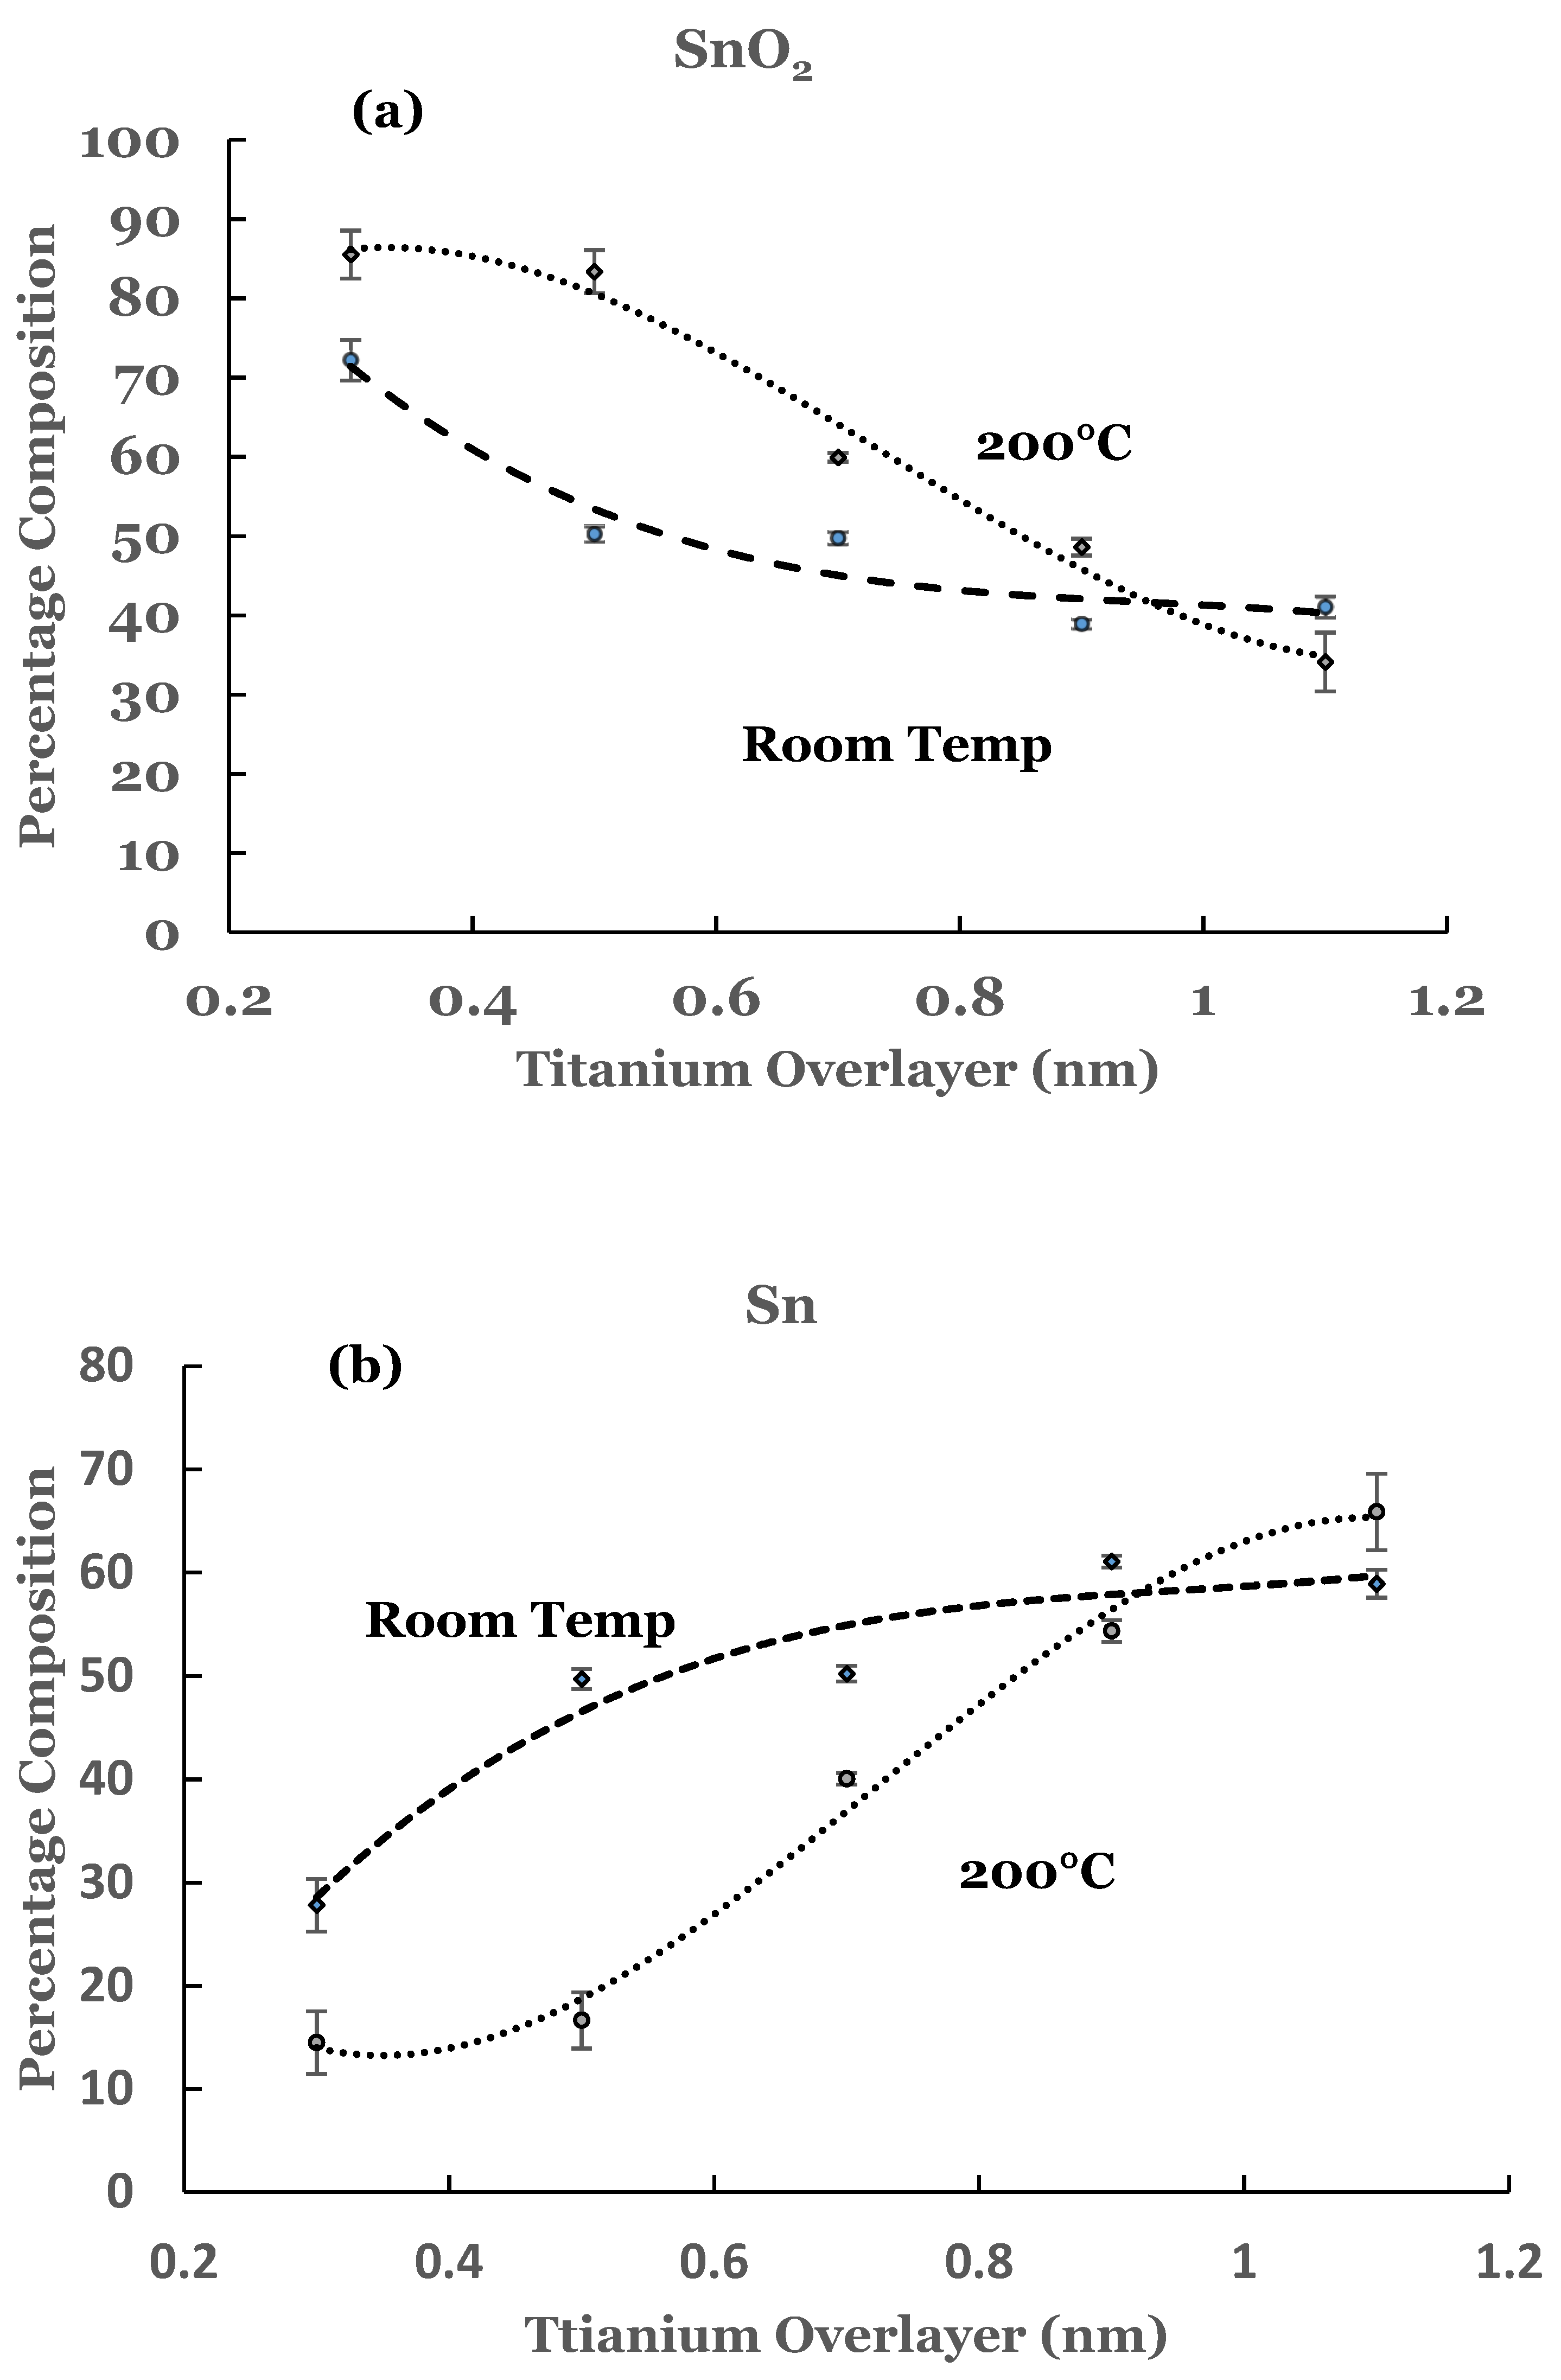
3.1. Room Temperature Deposition
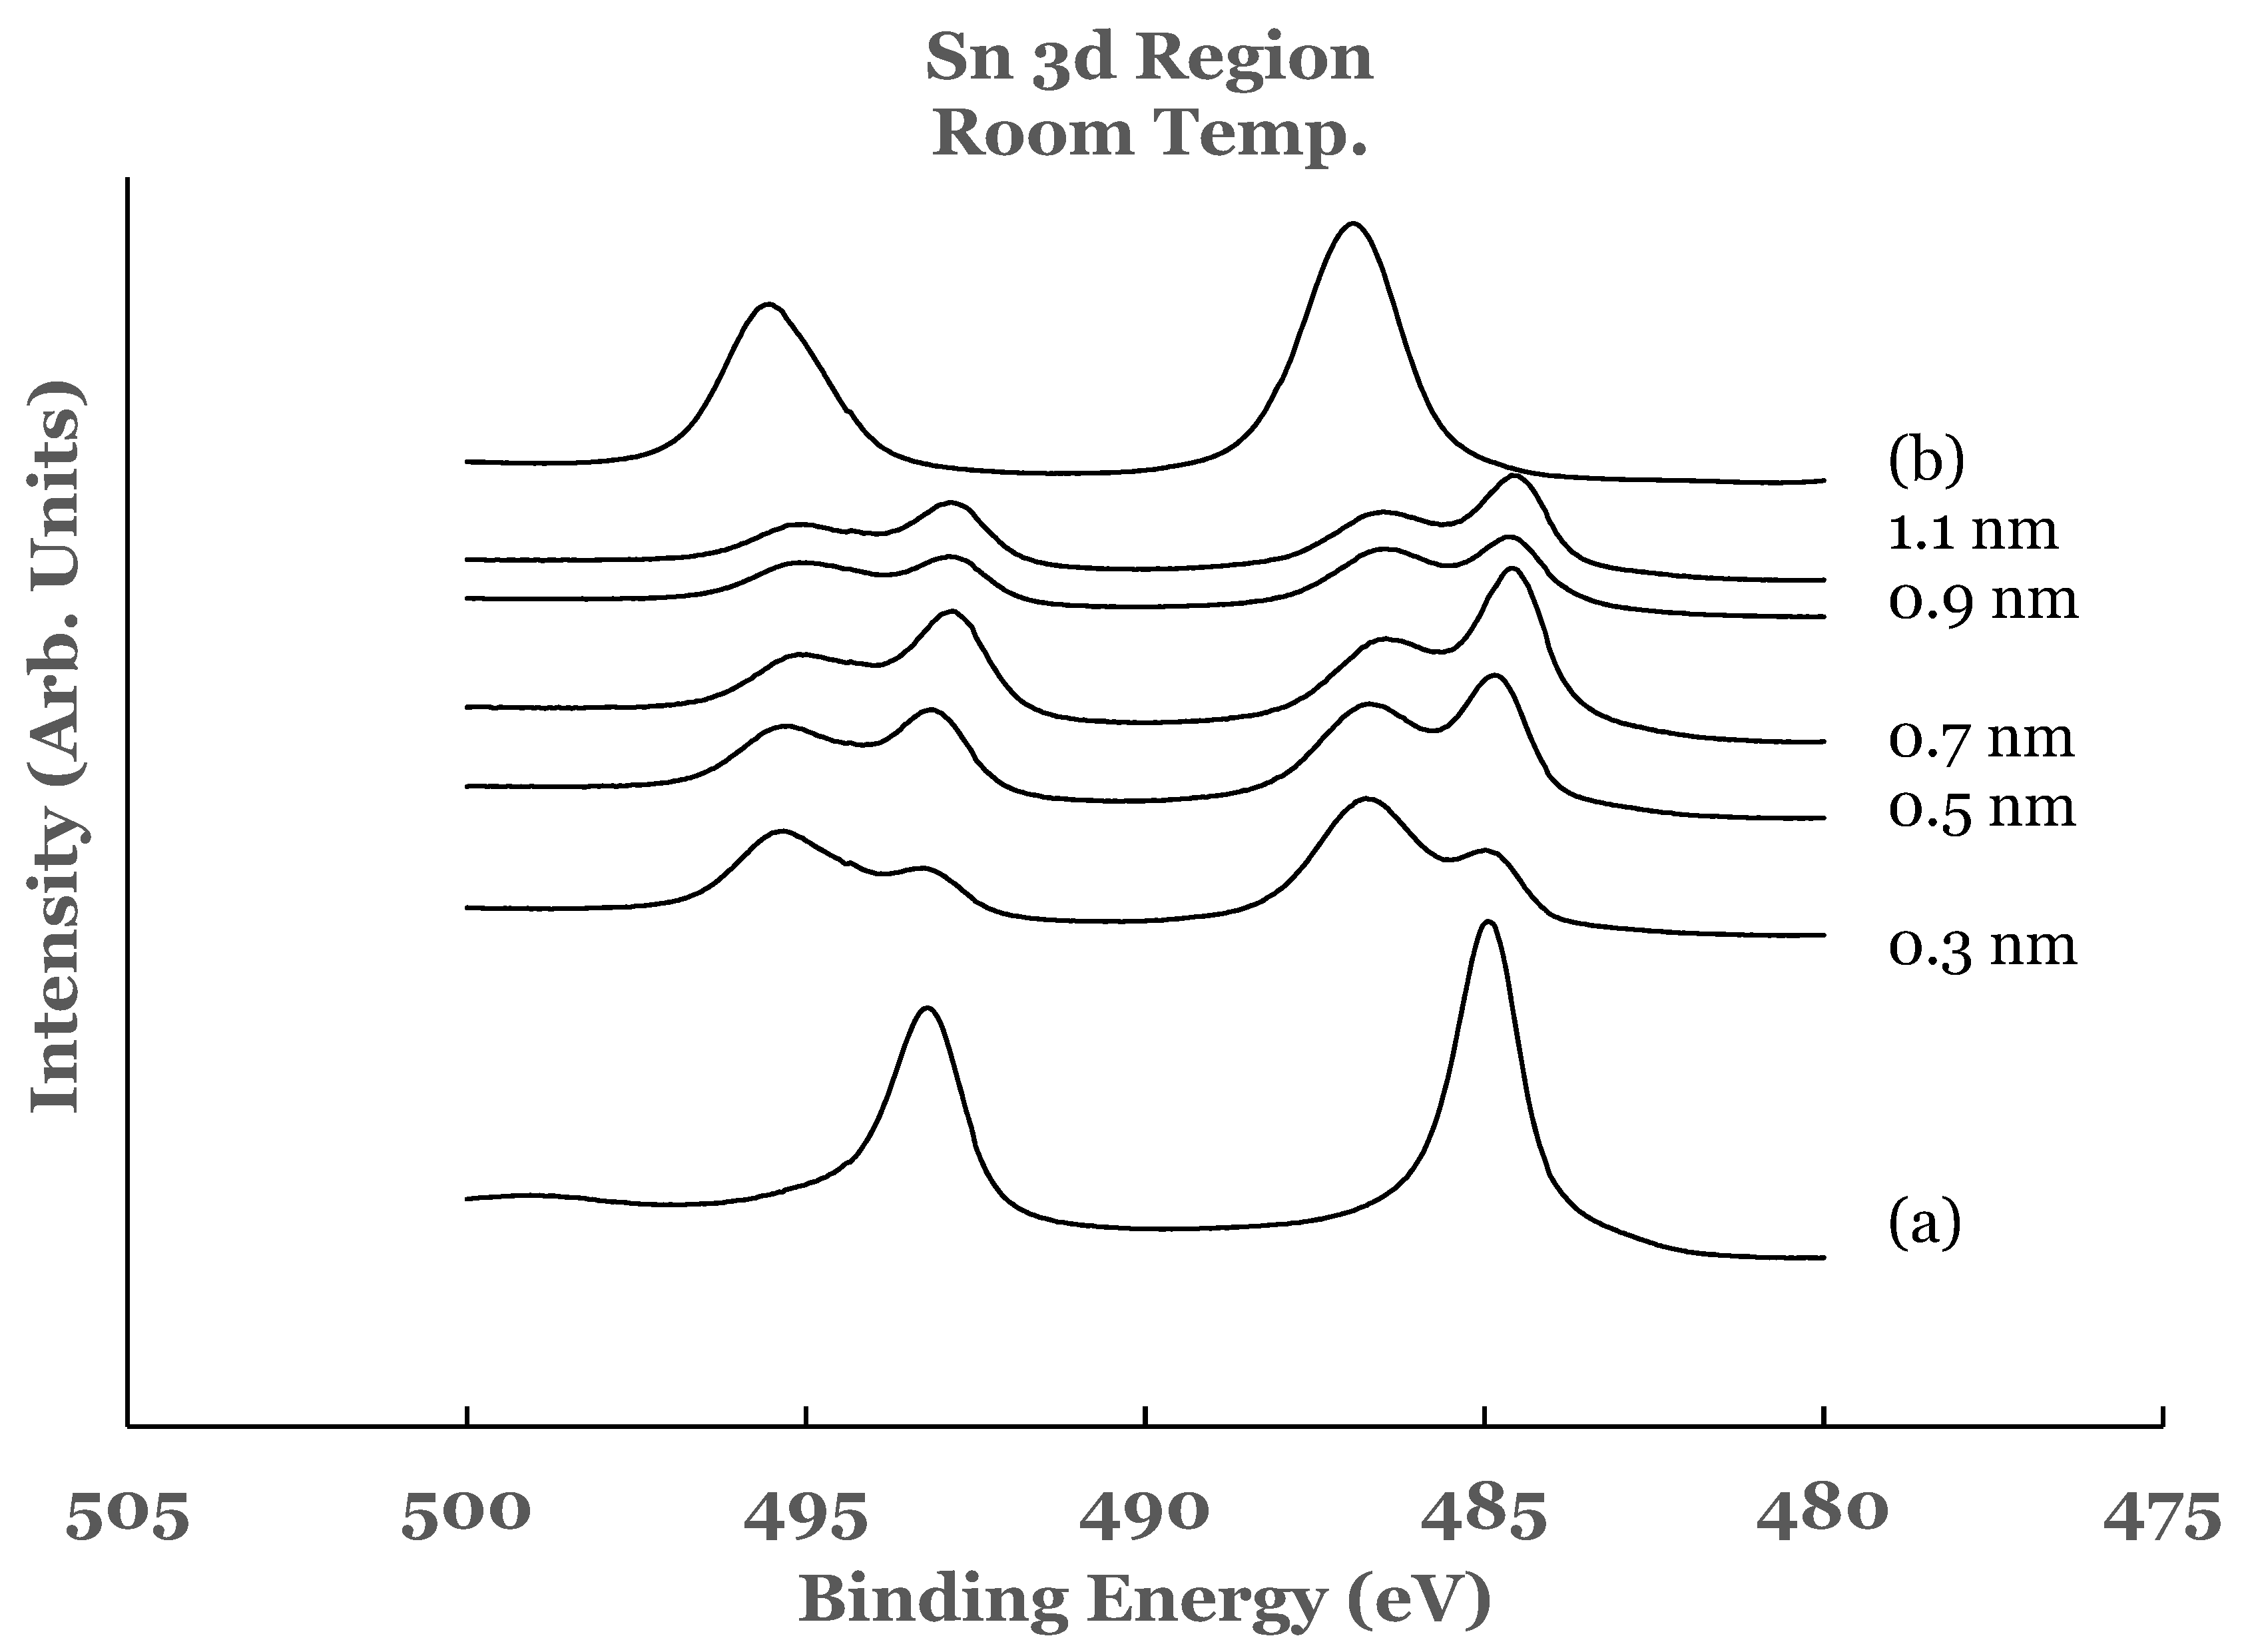
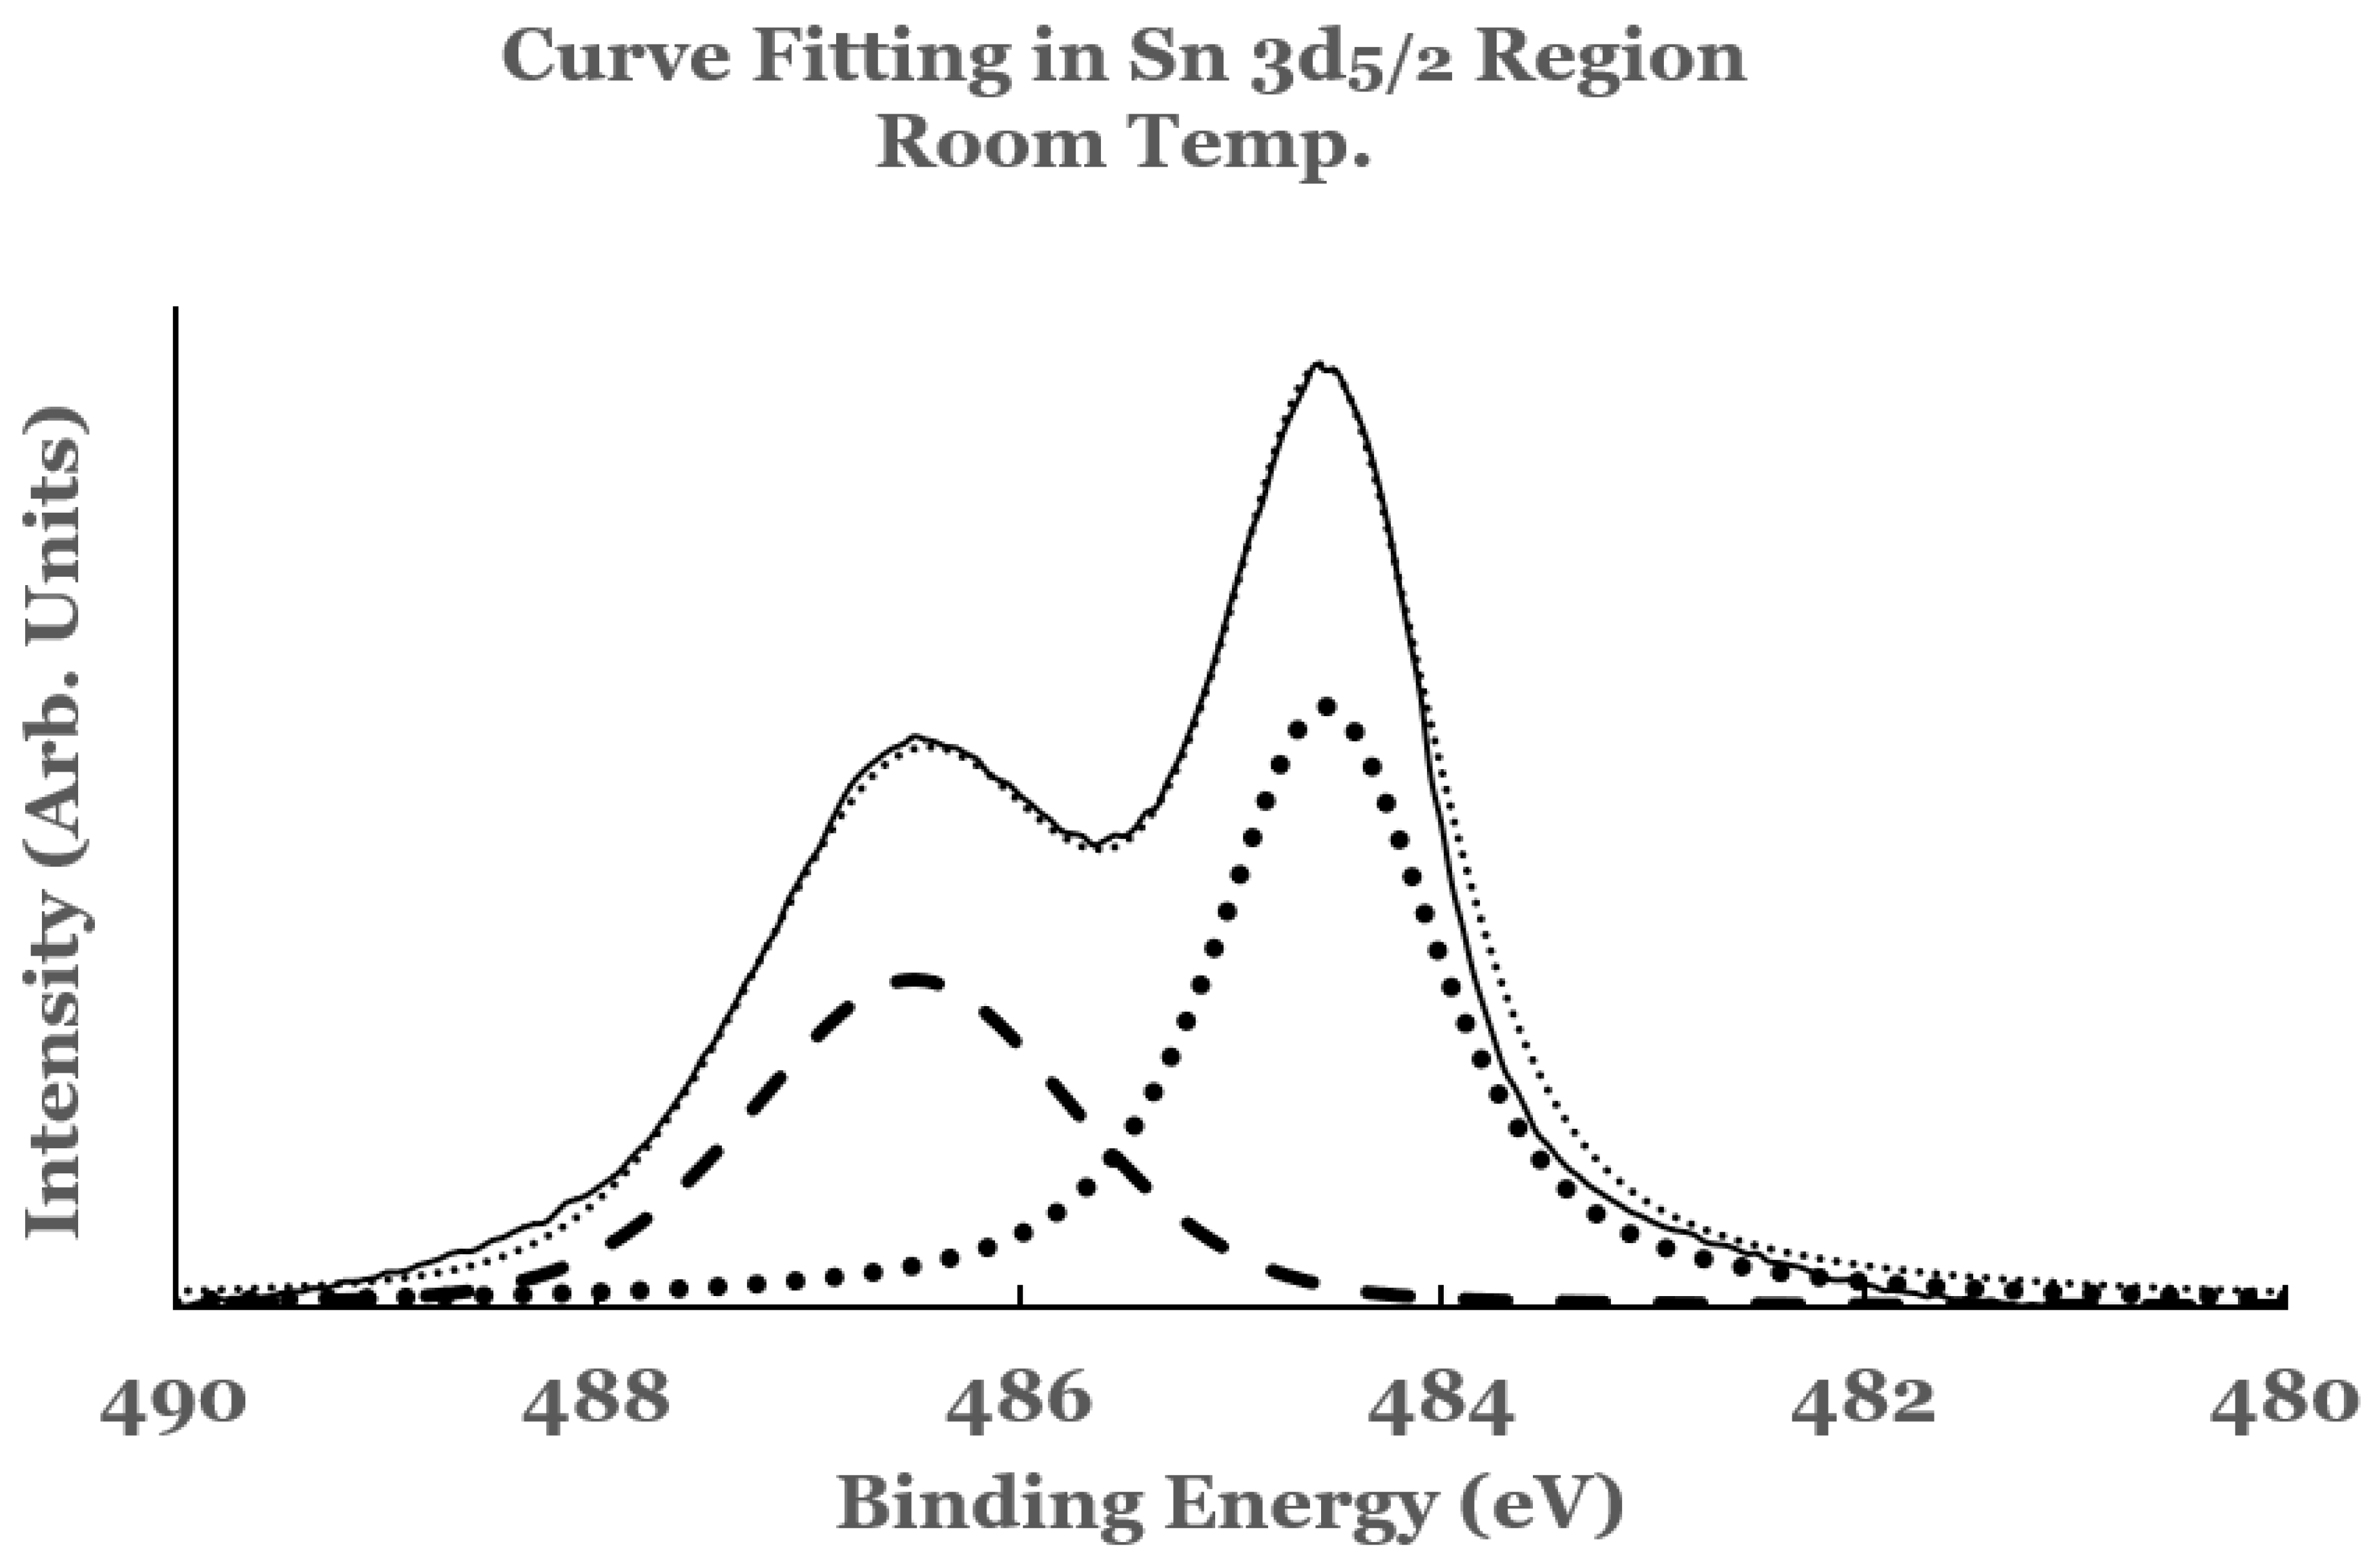
3.1.1. Sn 3d Region
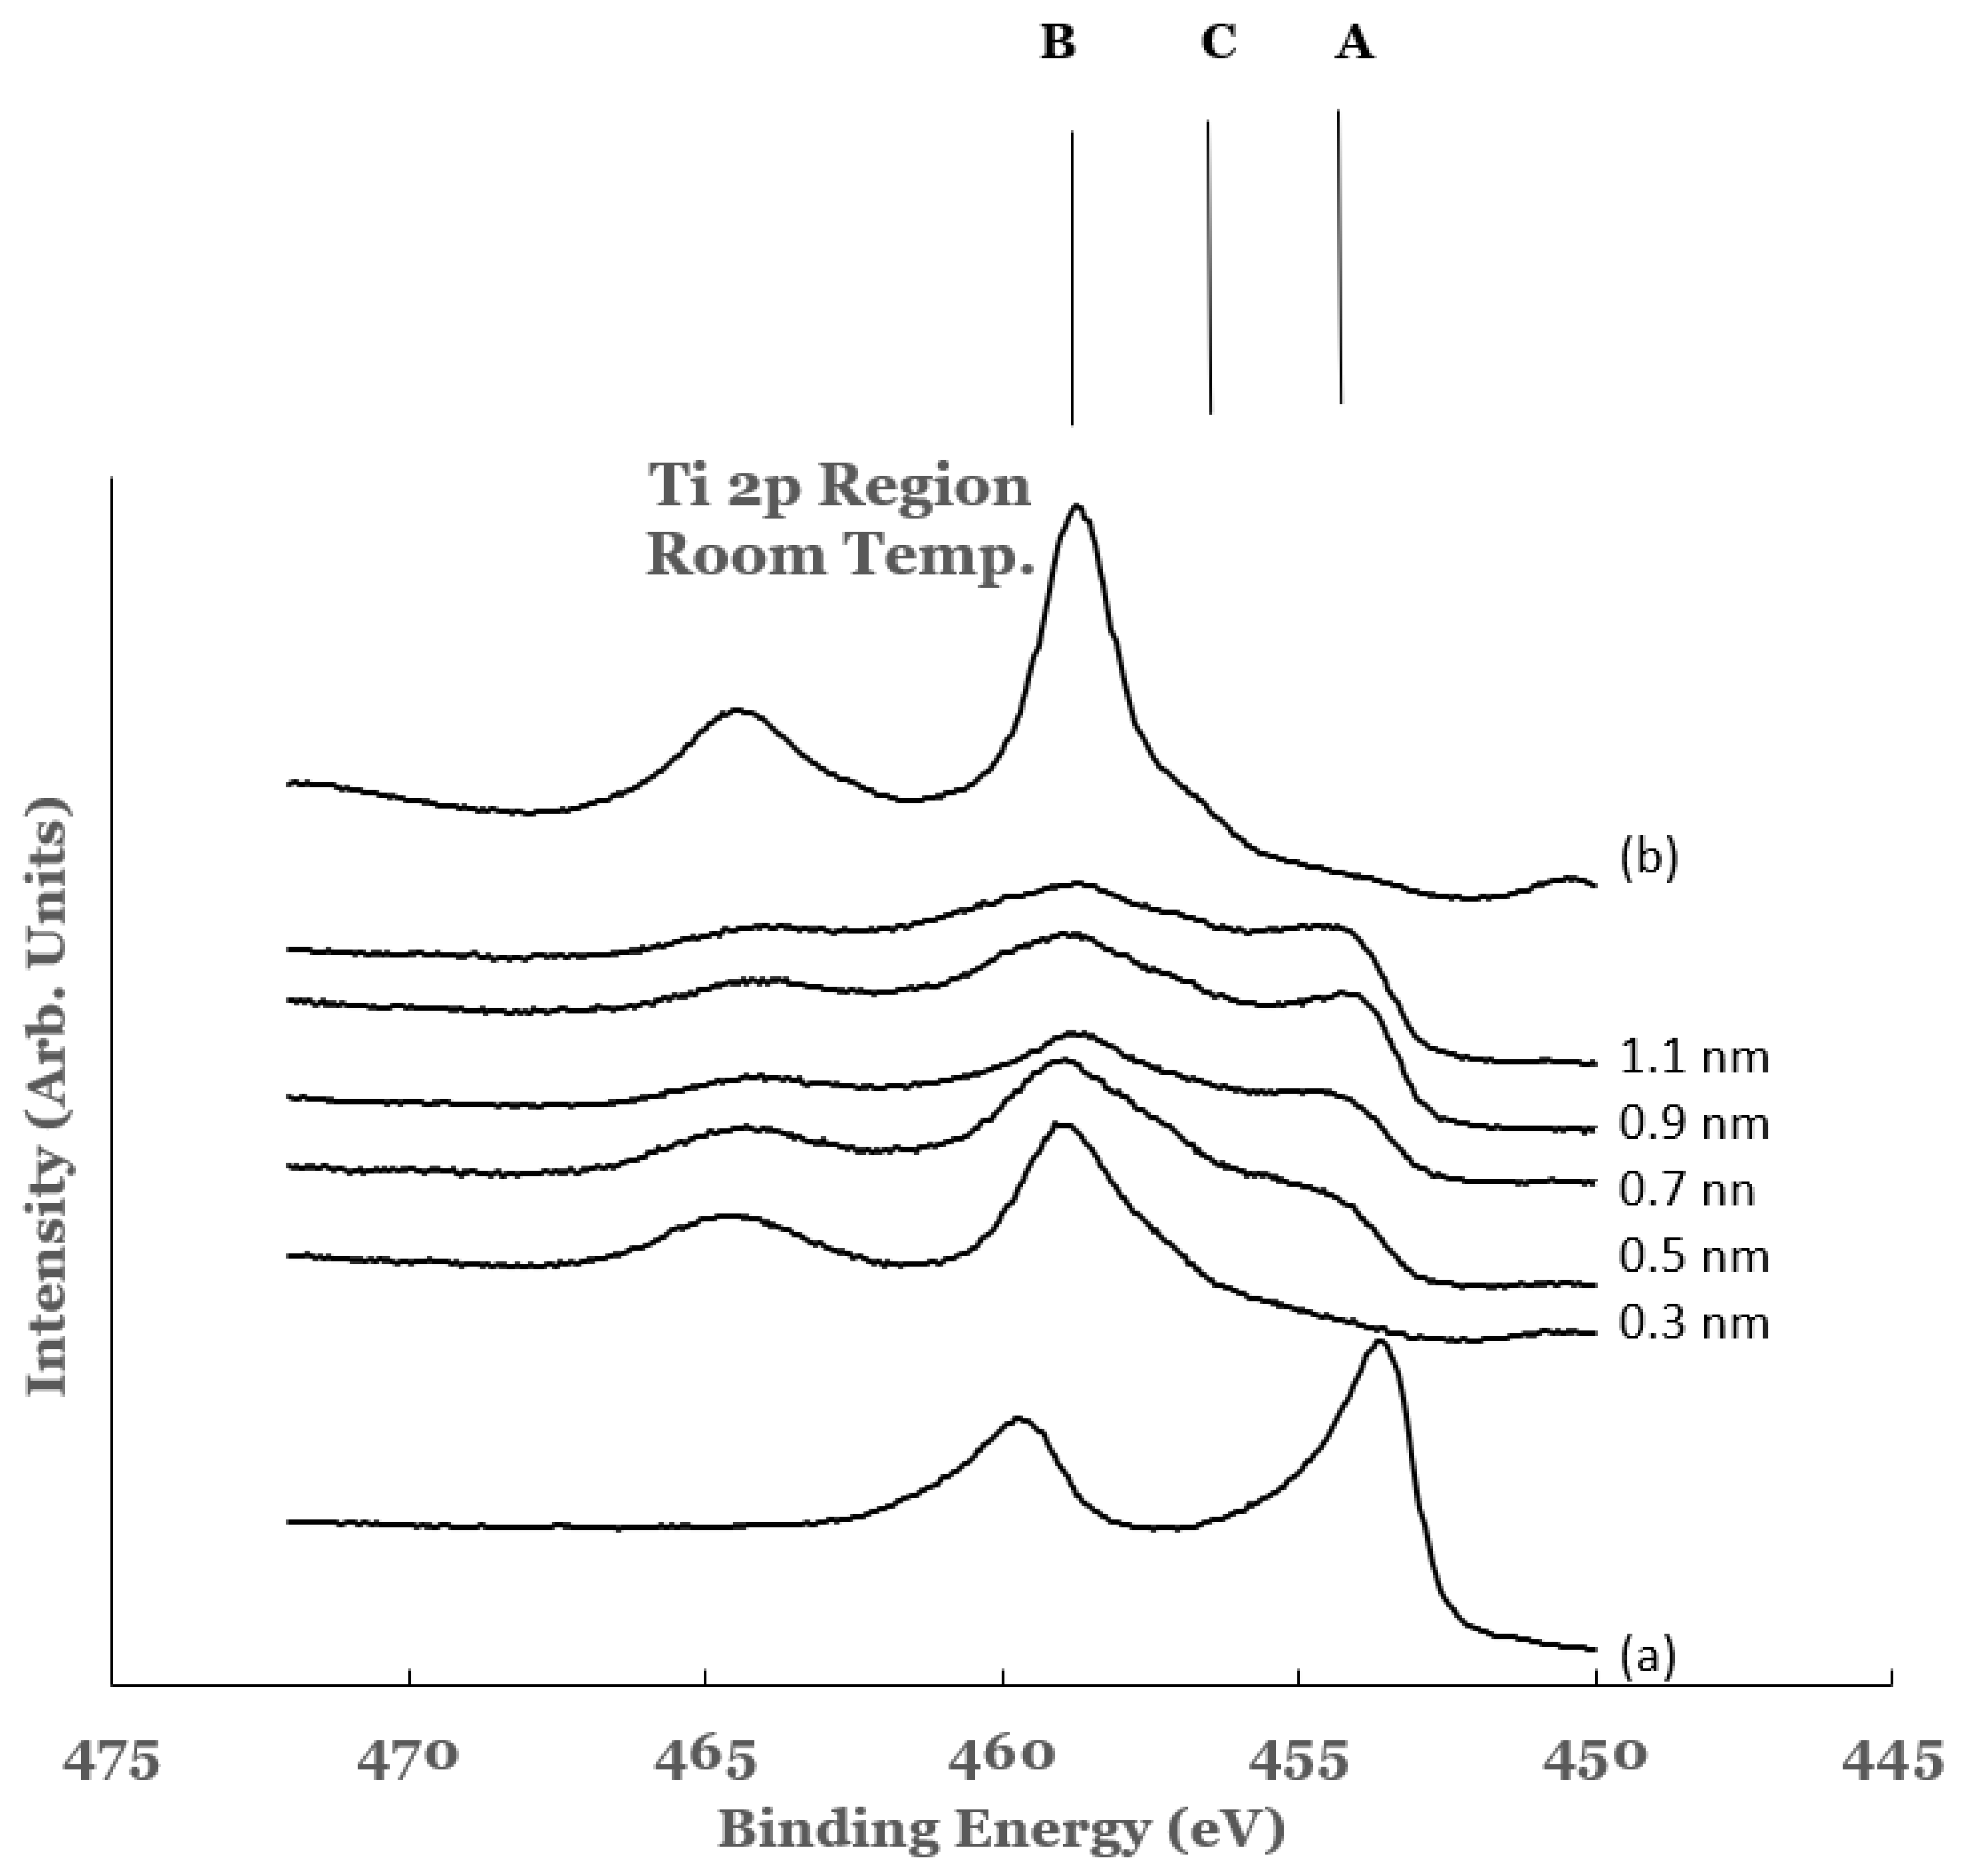
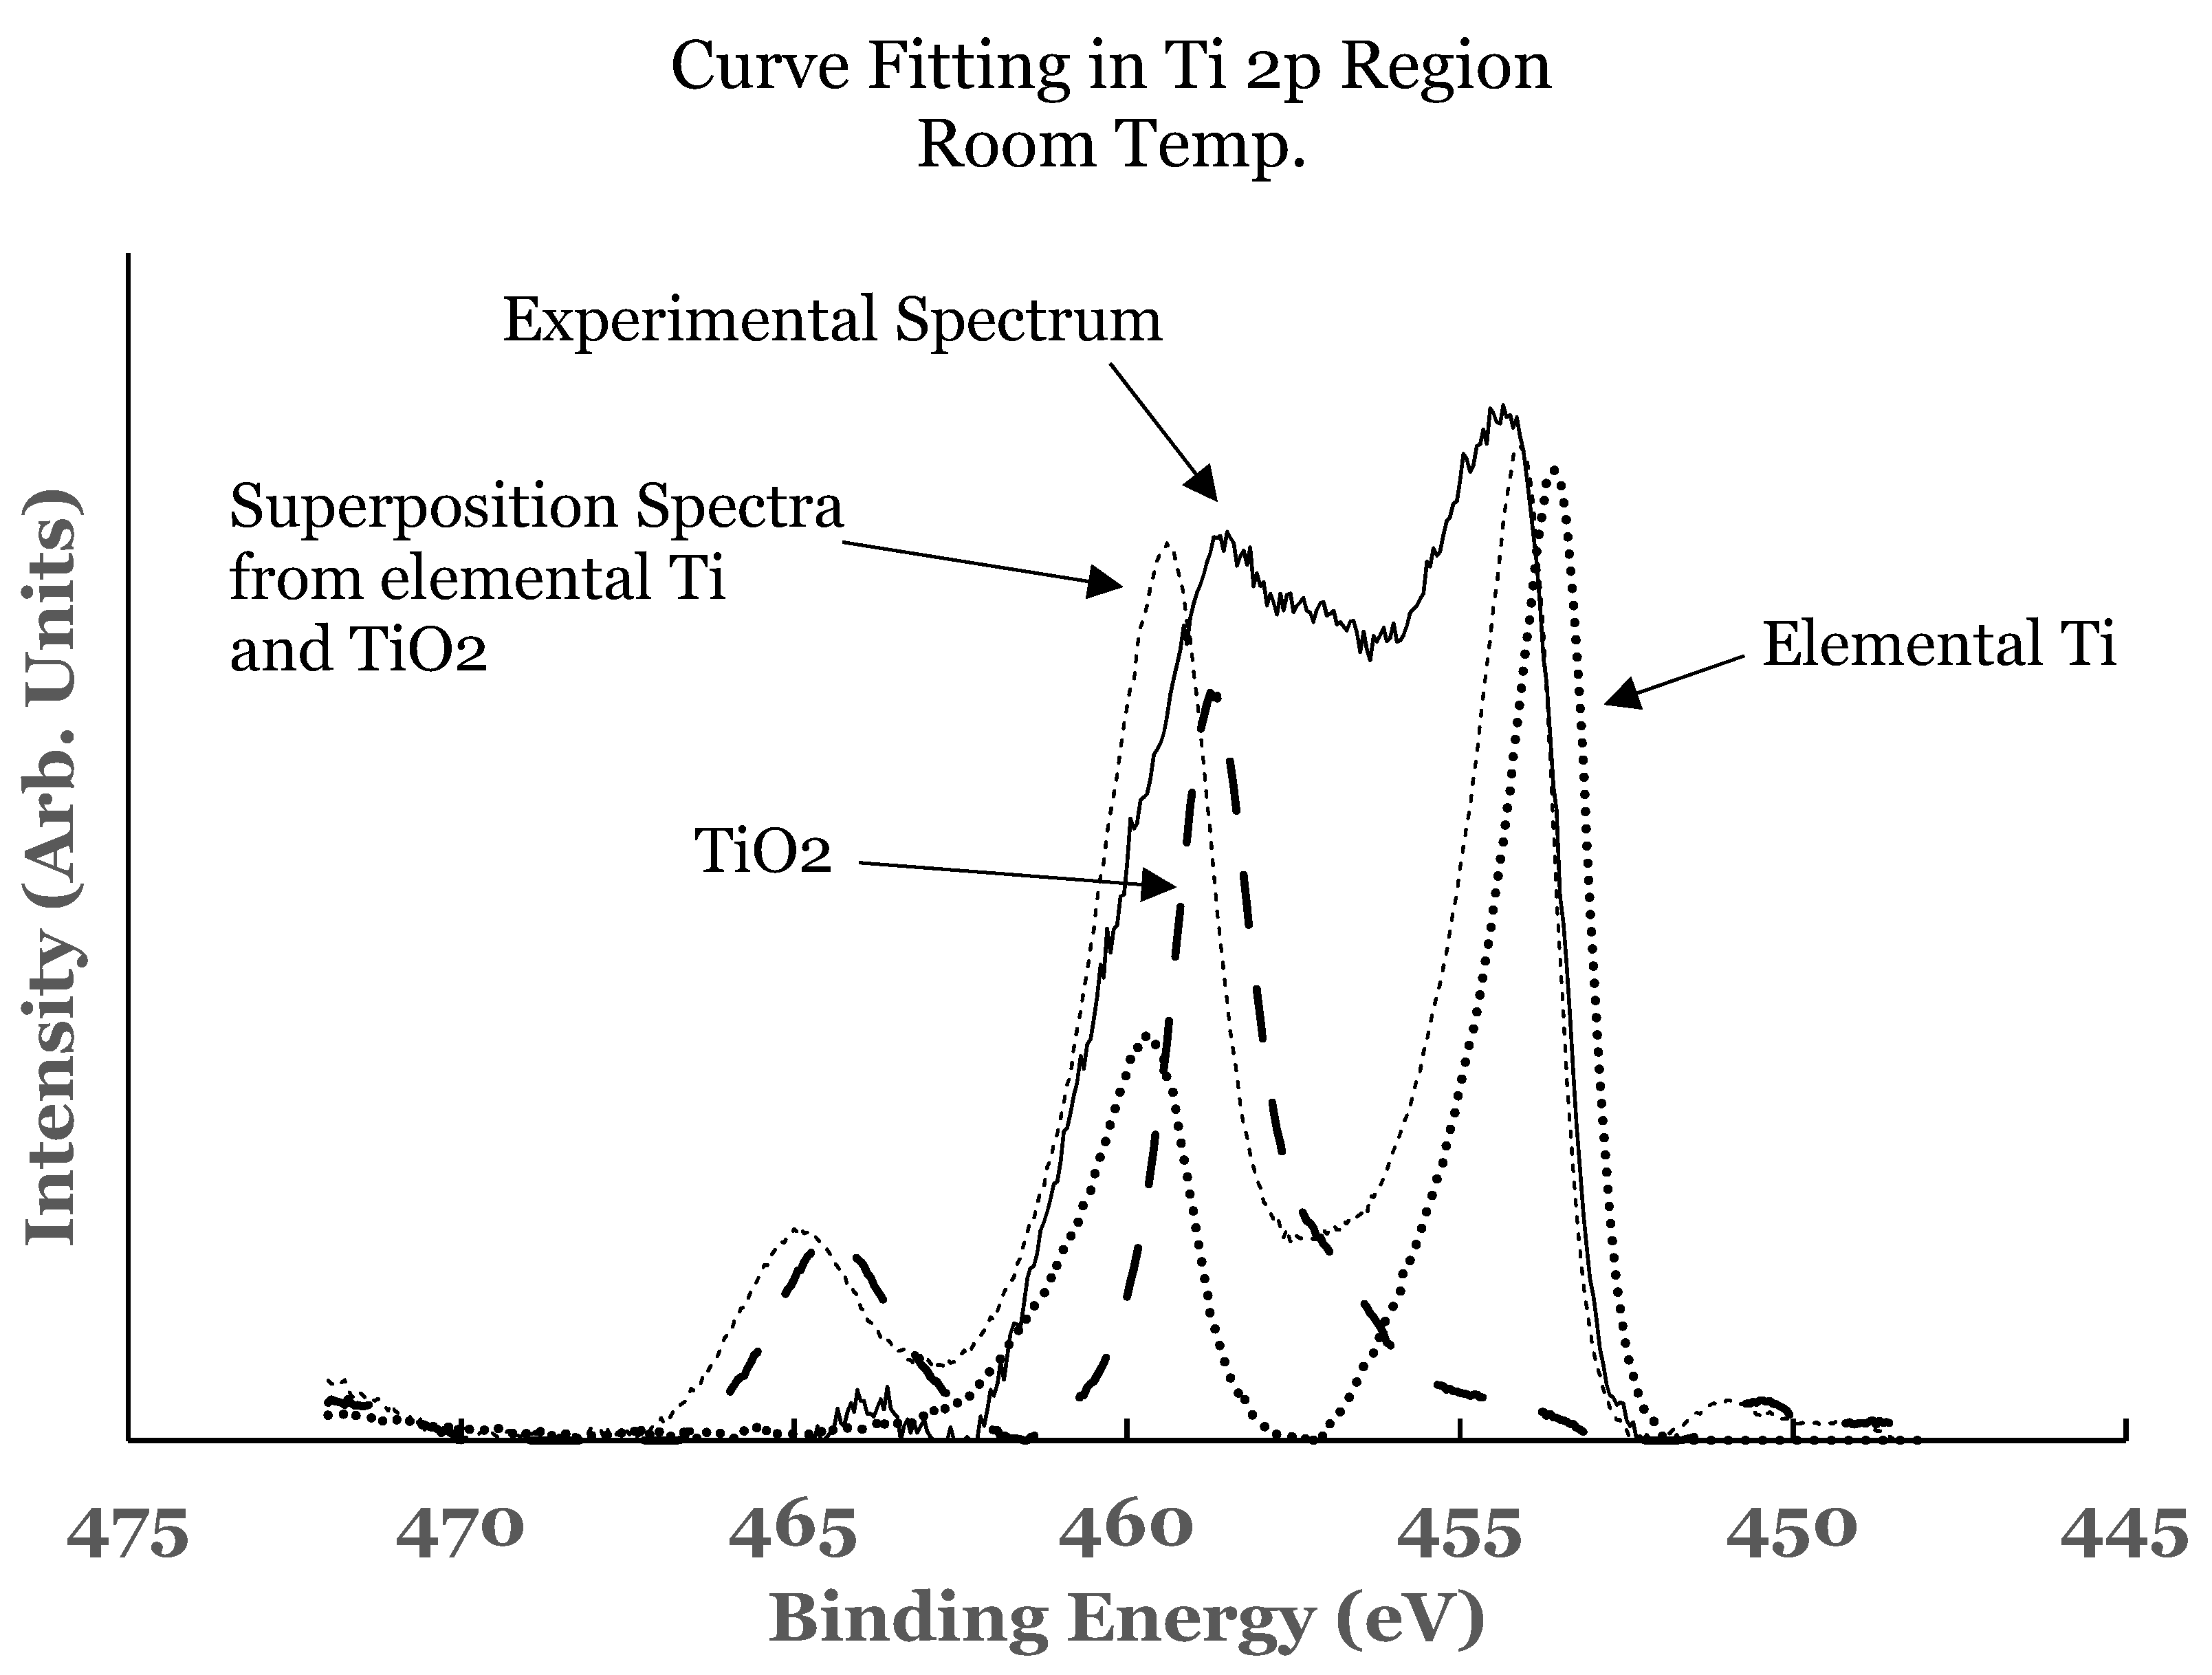
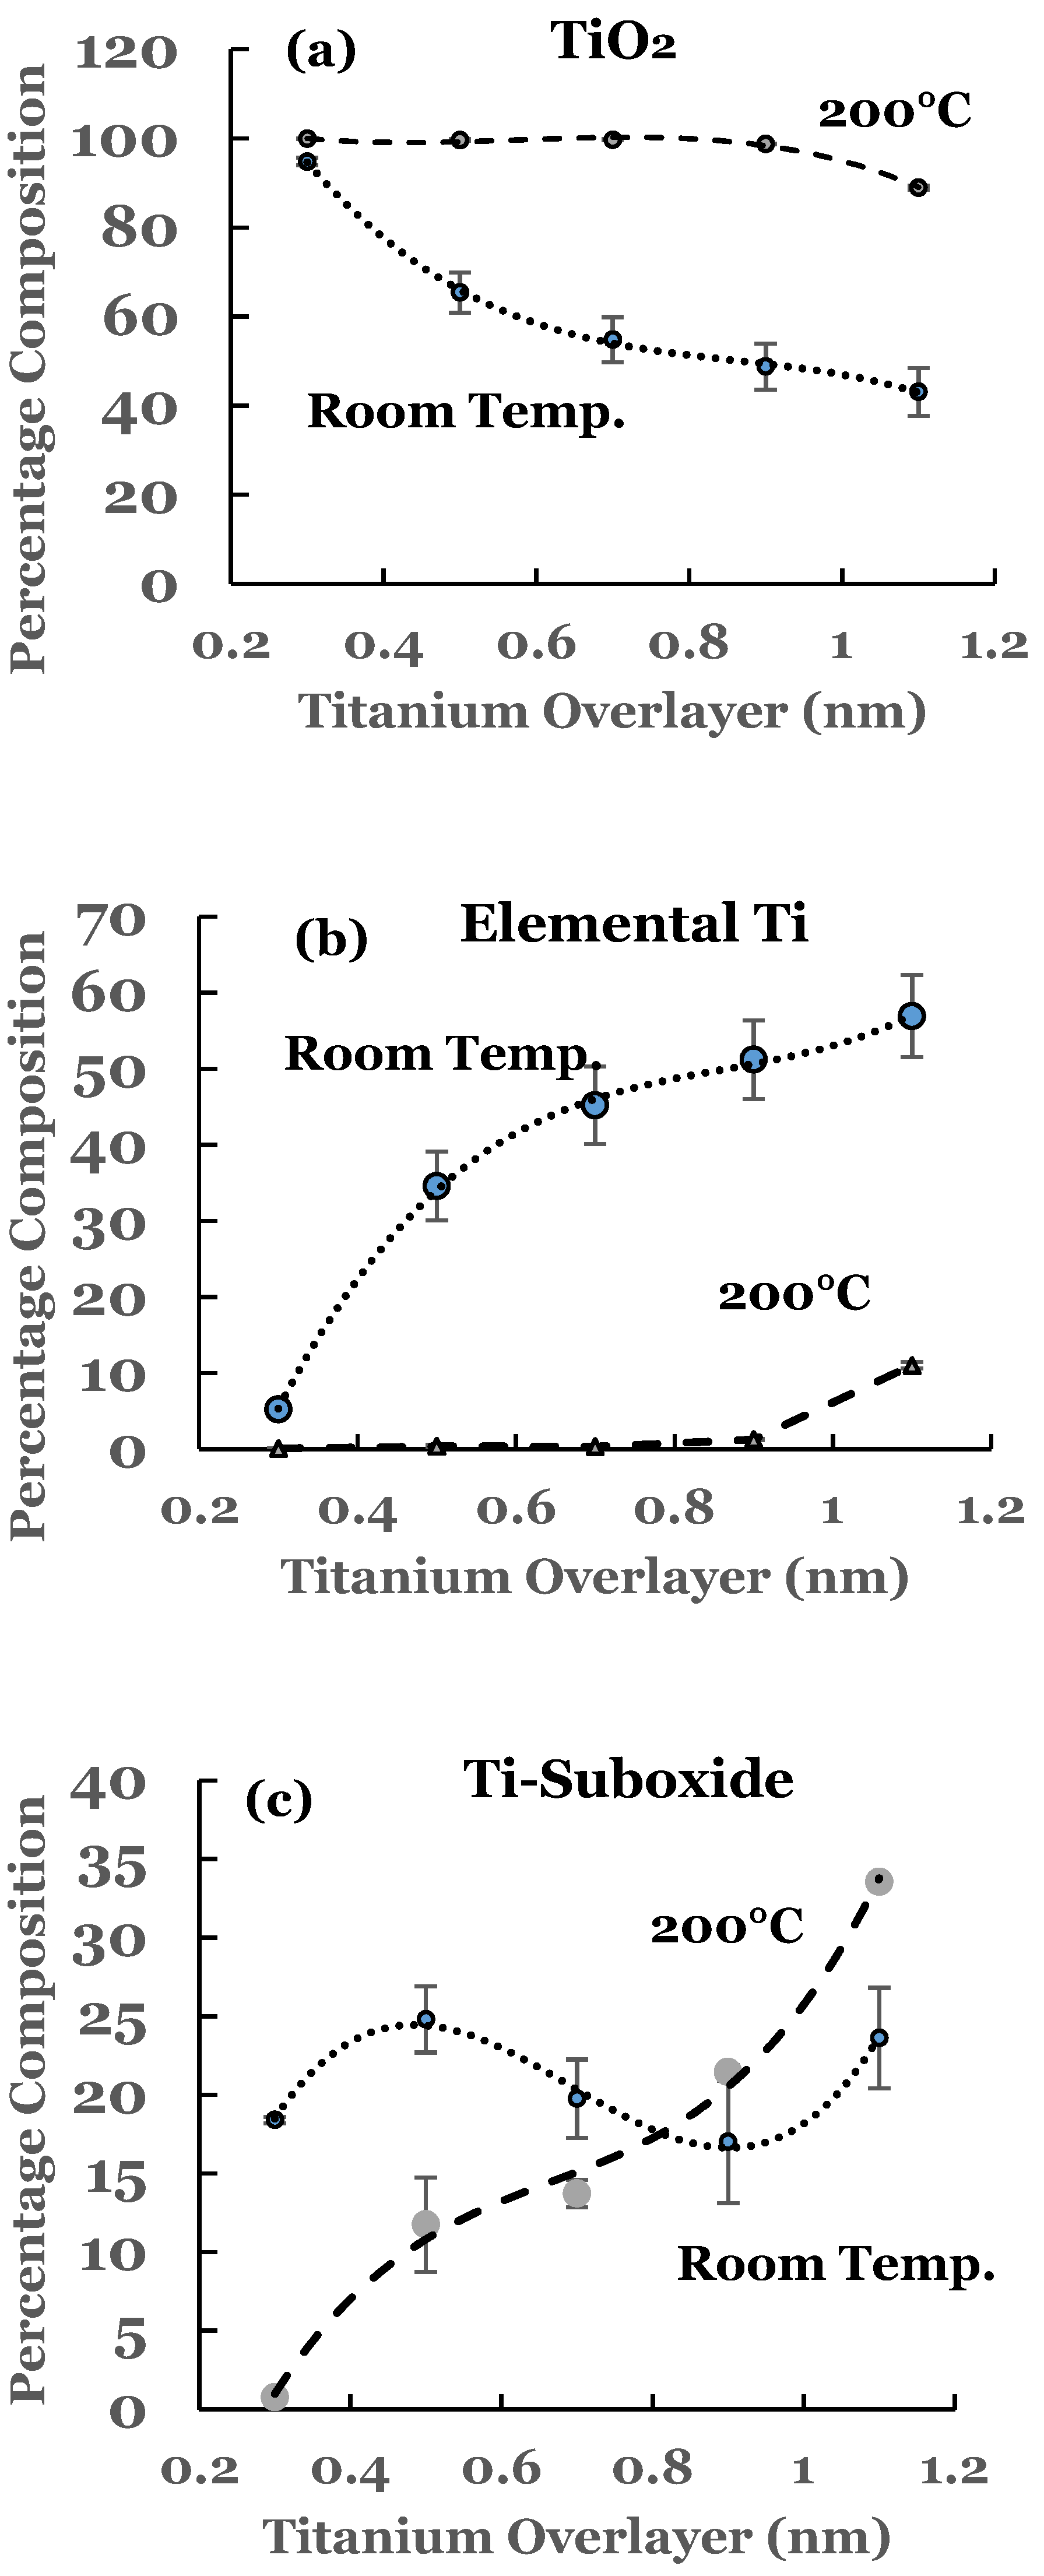
3.1.2. Ti 2p Region
3.2. Substrate Temperature (200 °C) Deposition
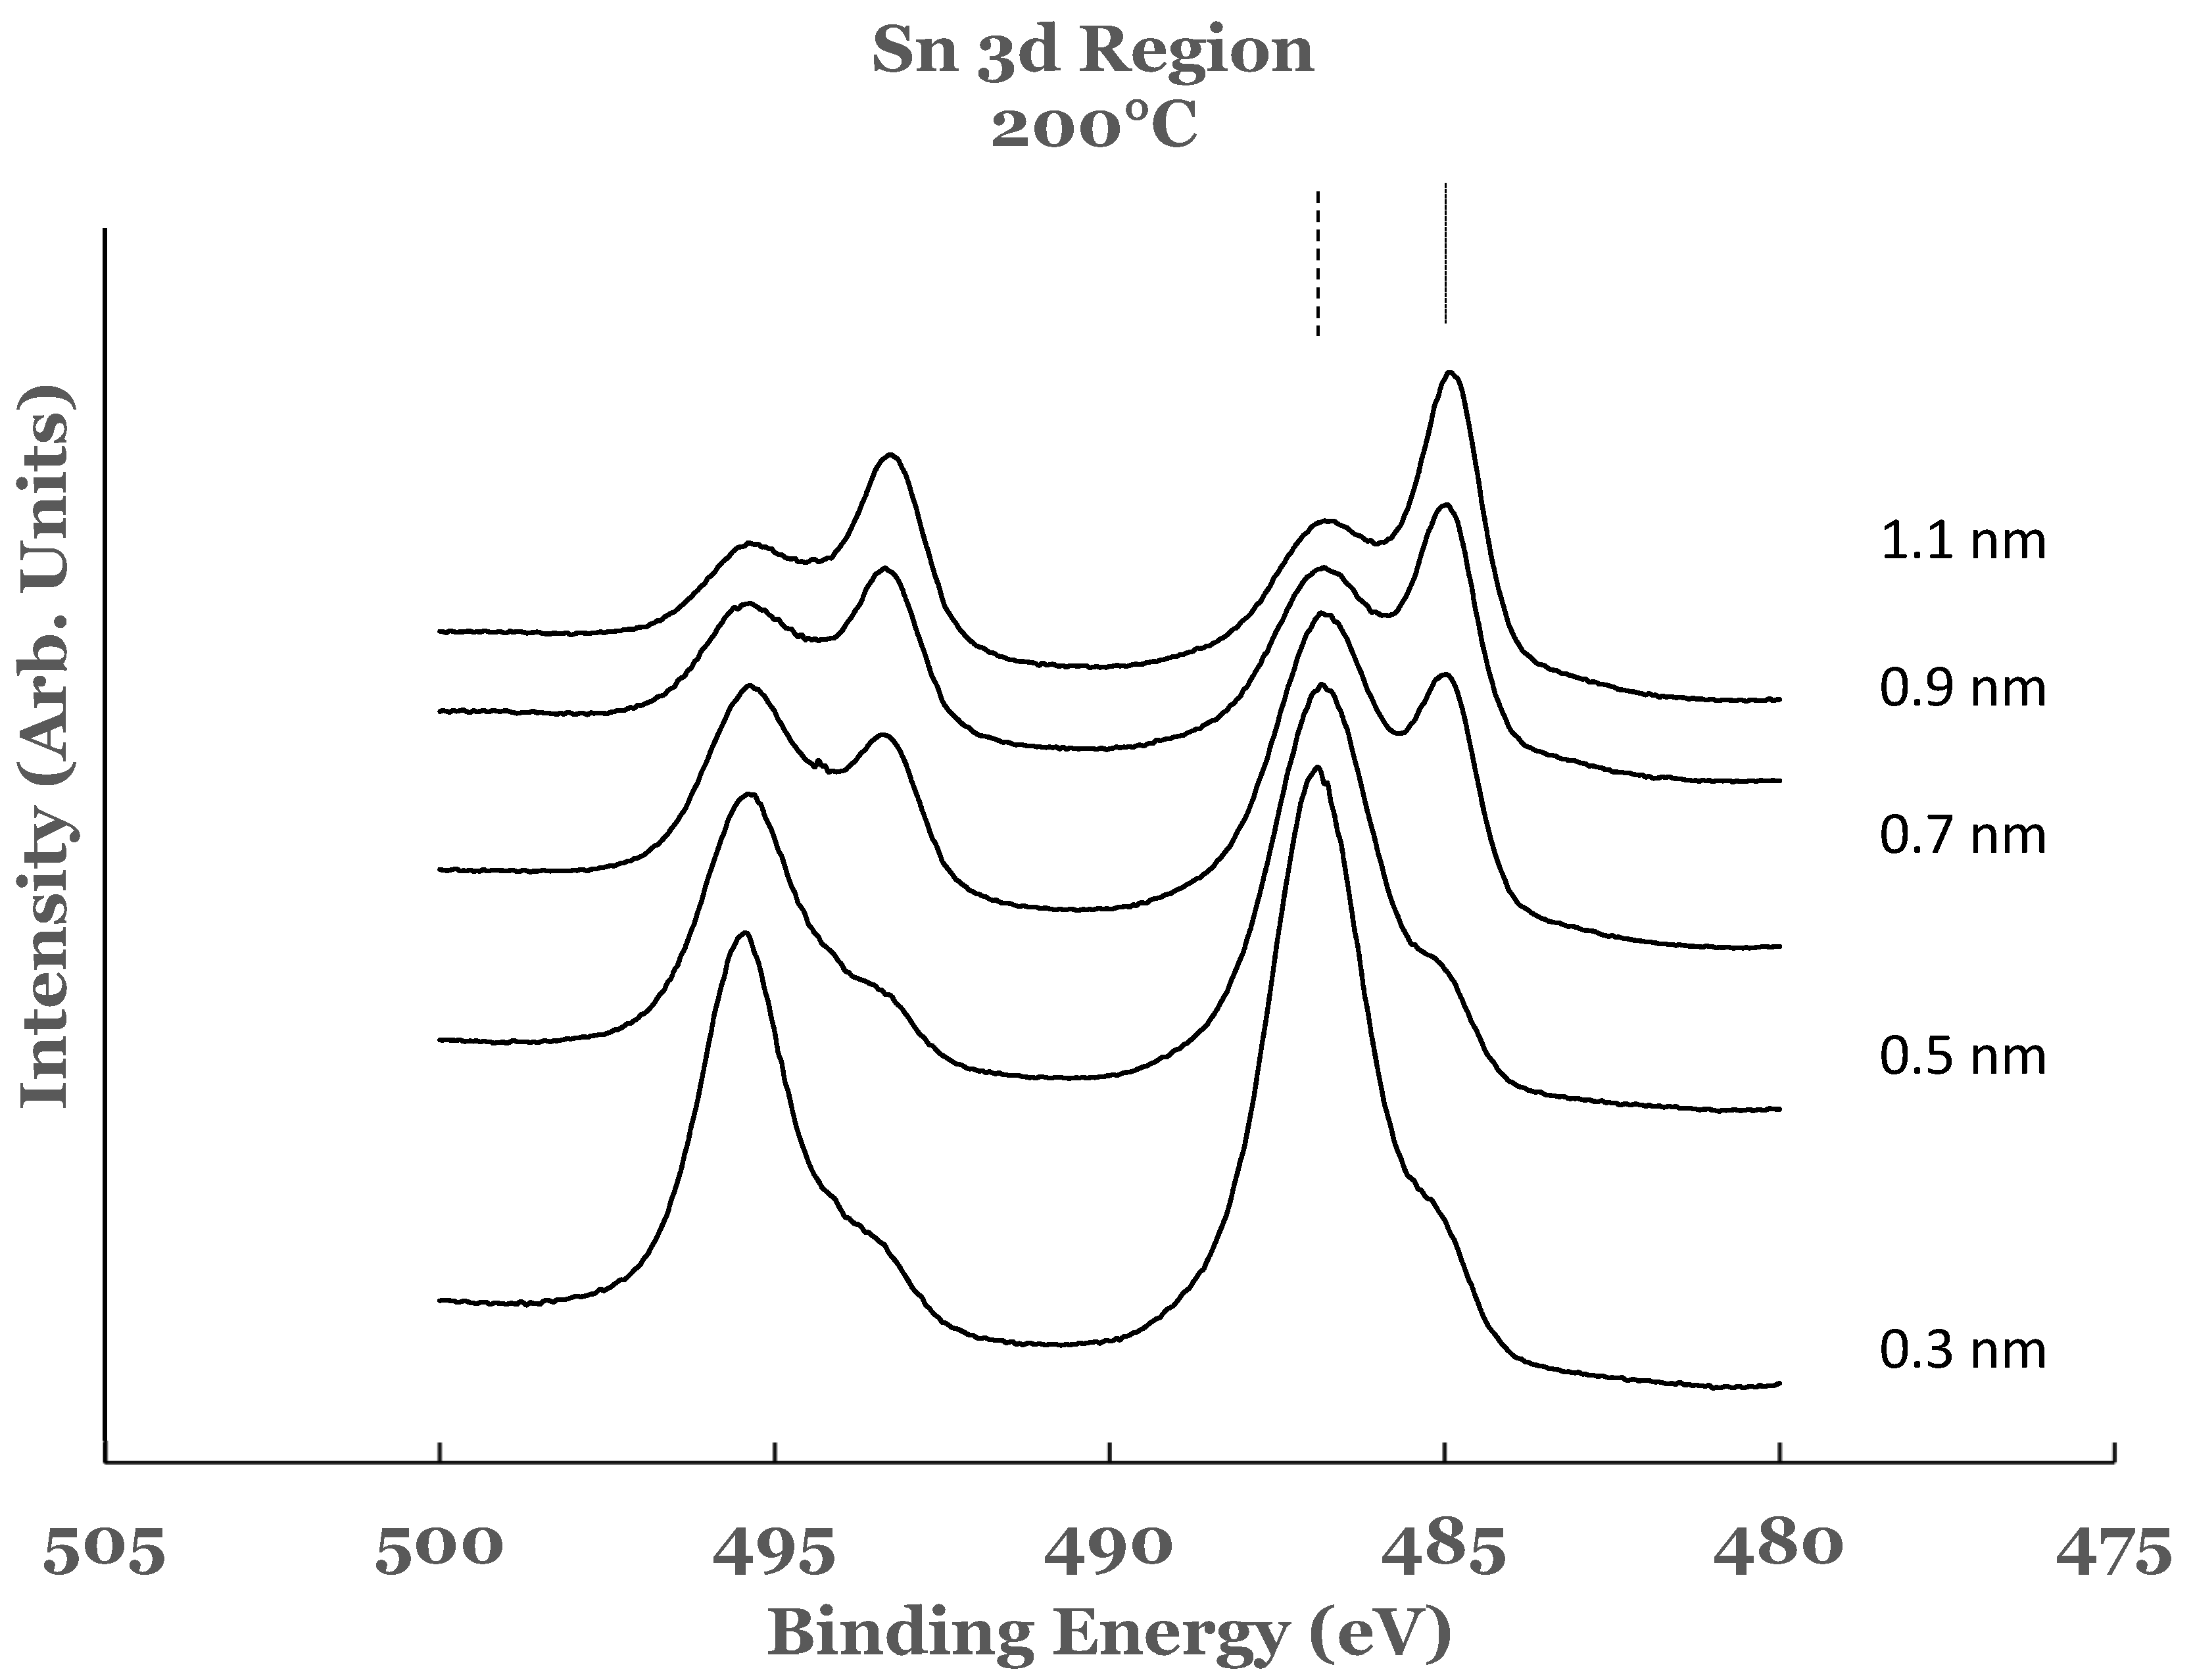
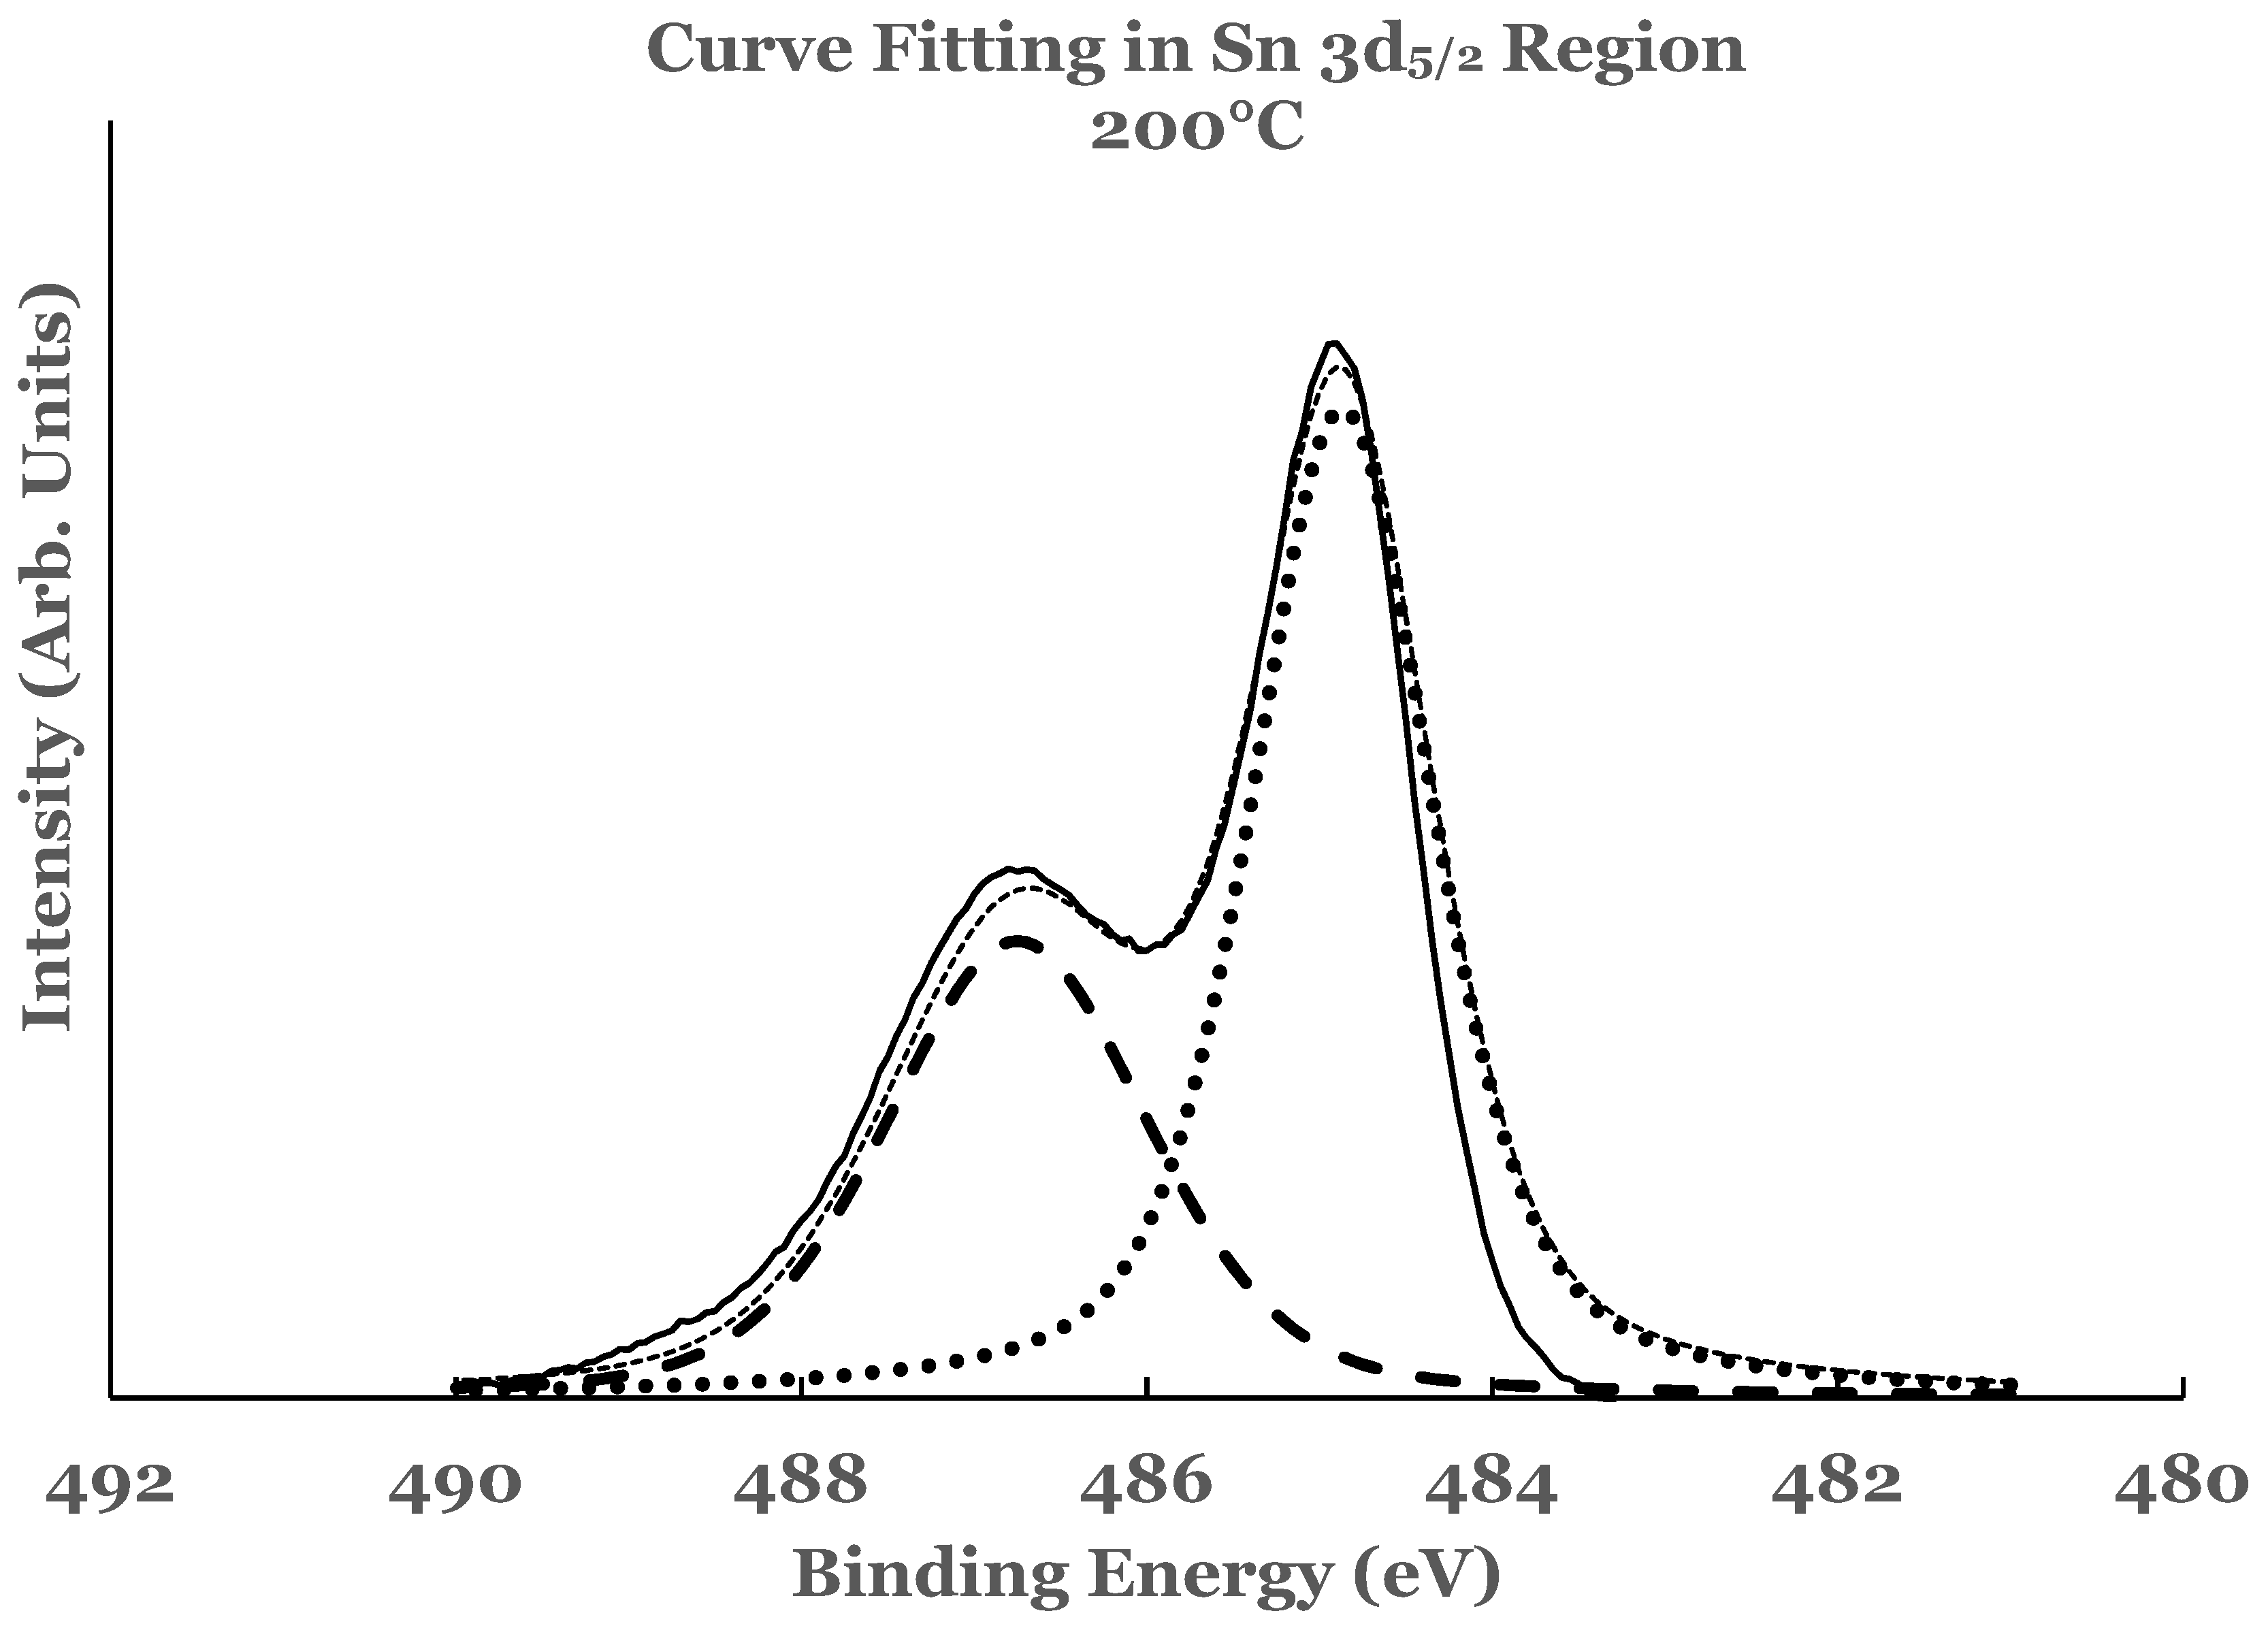
3.2.1. Sn 3d Region
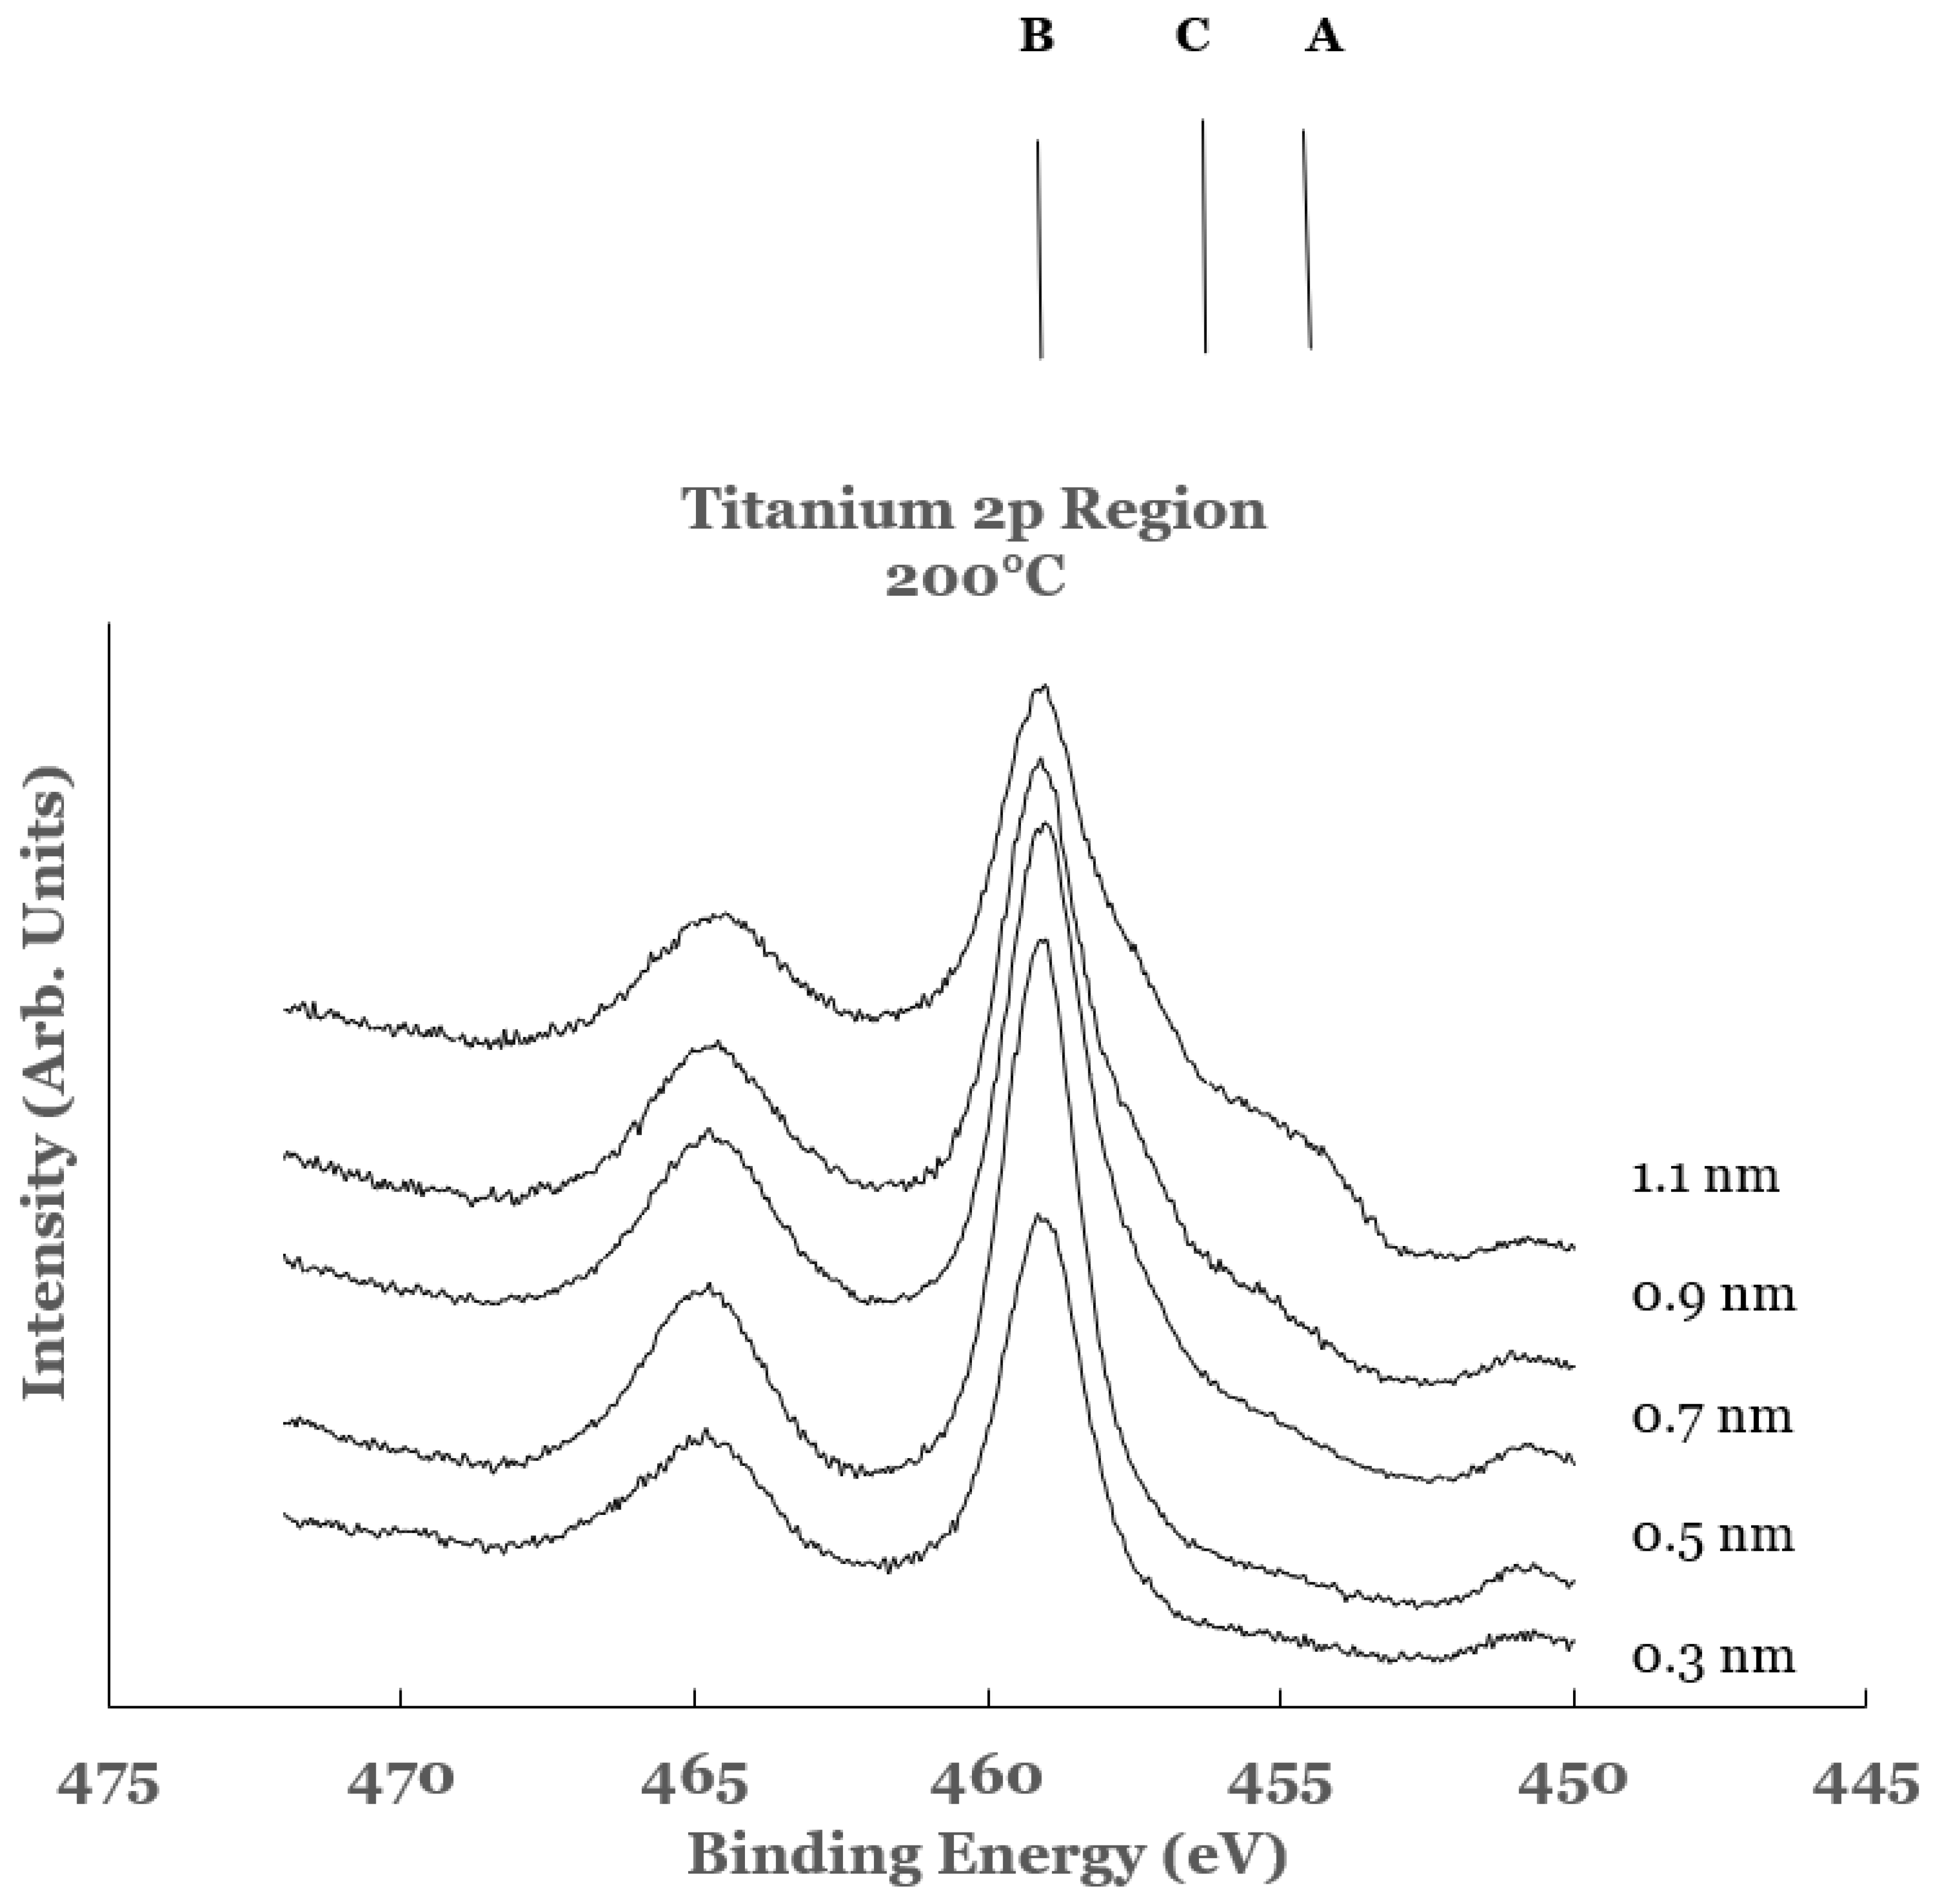
3.2.2. Ti 2p Region
4. Conclusions
Author Contributions
Funding
Institutional Review Board Statement
Informed Consent Statement
Data Availability Statement
Acknowledgments
Conflicts of Interest
References
- Jeon, N.J.; Noh, J.H.; Kim, Y.C.; Yang, W.S.; Ryu, S.; Seok, S.I. Solvent engineering for high-performance inorganic–organic hybrid perovskite solar cells. Nat. Mater. 2014, 13, 897–903. [Google Scholar] [CrossRef]
- Liu, M.; Johnston, M.; Snaith, H. Efficient planar heterojunction perovskite solar cells by vapour deposition. Nature 2013, 501, 395–398. [Google Scholar] [CrossRef]
- Xiong, L.B.; Qin, M.C.; Chen, C.; Wen, J.; Yang, G.; Guo, Y.X.; Ma, J.J.; Zhang, Q.; Qin, P.L.; Li, S.Z.; et al. Fully High-Temperature-Processed SnO2 as Blocking Layer and Scaffold for Efficient, Stable, and Hysteresis-Free Mesoporous Perovskite Solar Cells. Adv. Funct. Mater. 2018, 28, 1706276. [Google Scholar] [CrossRef]
- Park, M.; Kim, J.-Y.; Son, H.J.; Lee, C.-H.; Jang, S.S.; Ko, M.J. Low-temperature solution-processed Li-doped SnO2 as an effective electron transporting layer for high-performance flexible and wearable perovskite solar cells. Nano Energy 2016, 26, 208–215. [Google Scholar] [CrossRef]
- Bai, Y.; Fang, Y.; Deng, Y.; Wang, Q.; Zhao, J.; Zheng, X.; Zhang, Y.; Huang, J. Low Temperature Solution-Processed Sb:SnO2 Nanocrystals for Efficient Planar Perovskite Solar Cells. ChemSusChem 2016, 9, 2686–2691. [Google Scholar] [CrossRef] [Green Version]
- Chen, H.; Liu, D.; Wang, Y.; Wang, C.; Zhang, T.; Zhang, P.; Sarvari, H.; Chen, Z.; Li, S. Enhanced Performance of Planar Perovskite Solar Cells Using Low-Temperature Solution-Processed Al-Doped SnO2 as Electron Transport Layers. Nanoscale Res. Lett. 2017, 12, 1–6. [Google Scholar] [CrossRef] [PubMed] [Green Version]
- Ren, X.; Yang, D.; Yang, Z.; Feng, J.; Zhu, X.; Niu, J.; Liu, Y.; Zhao, W.; Liu, S.F. Solution-Processed Nb:SnO2 Electron Transport Layer for Efficient Planar Perovskite Solar Cells. ACS Appl. Mater. Inter. 2017, 9, 2421–2429. [Google Scholar] [CrossRef] [PubMed]
- Xiong, L.B.; Qin, M.C.; Yang, G.; Guo, Y.X.; Lei, H.W.; Liu, Q.; Ke, W.J.; Tao, H.; Qin, P.L.; Li, S.Z.; et al. Performance enhancement of high temperature SnO2-based planar perovskite solar cells: Electrical characterization and understanding of the mechanism. J. Mater. Chem. A 2016, 4, 8374–8383. [Google Scholar] [CrossRef]
- Roose, B.; Johansen, C.M.; Dupraz, K.; Jaouen, T.; Aebi, P.; Steiner, U.; Abate, A. A Ga-doped SnO2 mesoporous contact for UV stable highly efficient perovskite solar cells. J. Mater. Chem. A 2017, 6, 1850–1857. [Google Scholar] [CrossRef] [Green Version]
- Yahi, A.; Bouzidi, A.; Miloua, R.; Medles, M.; Nakrela, A.; Khadraoui, M.; Tabet-Derraz, H.; Desfeux, R.; Ferri, A.; Blach, J.-F. The relationship between processing and structural, optical, electrical properties of spray pyrolysed SnO2 thin films prepared for different deposition times. Optik 2019, 196. [Google Scholar] [CrossRef]
- Jiang, Q.; Zhang, L.; Wang, H.; Yang, X.; Meng, J.; Liu, H.; Yin, Z.; Wu, J.; Zhang, X.; You, J. Enhanced electron extraction using SnO2 for high-efficiency planar-structure HC(NH2)2PbI3-based perovskite solar cells. Nat. Energy 2016, 2, 16177. [Google Scholar] [CrossRef]
- Barsan, N.; Schweizer-Berberich, M.; Göpel†, W. Fundamental and practical aspects in the design of nanoscaled SnO 2 gas sensors: A status report. Anal. Bioanal. Chem. 1999, 365, 287–304. [Google Scholar] [CrossRef]
- Wang, C.; Yin, L.; Zhang, L.; Xiang, D.; Gao, R. Metal Oxide Gas Sensors: Sensitivity and Influencing Factors. Sensors 2010, 10, 2088–2106. [Google Scholar] [CrossRef] [Green Version]
- Wang, B.; Zhu, L.F.; Yang, Y.H.; Xu, A.N.S.; Yang, G.W. Fabrication of a SnO2 Nanowire Gas Sensor and Sensor Performance for Hydrogen. J. Phys. Chem. C 2008, 112, 6643–6647. [Google Scholar] [CrossRef]
- Nisar, J.; Topalian, Z.; De Sarkar, A.; Österlund, L.; Ahuja, R. TiO2-Based Gas Sensor: A Possible Application to SO2. ACS Appl. Mater. Interfaces 2013, 5, 8516–8522. [Google Scholar] [CrossRef]
- Garzellaa, C.; Cominia, E.; Tempestia, E.; Frigerib, C.; Sberveglieri, G. TiO2 thin films by a novel sol–gel processing for gas sensor applications. Sens. Actuators 2000, B68, 189–196. [Google Scholar] [CrossRef]
- Yu, J.; Zhao, X.; Zhao, Q. Effect of surface structure on photocatalytic activity of TiO2 thin films prepared by sol-gel method. Thin Solid Films 2000, 379, 7–14. [Google Scholar] [CrossRef]
- Yu, J.; Zhao, X.; Zhao, Q. Photocatalytic activity of nanometer TiO2 thin films prepared by the sol–gel method. Mater. Chem. Phys. 2001, 69, 25–29. [Google Scholar] [CrossRef]
- Manjula, P.; Boppella, R.; Manorama, S.V. A Facile and Green Approach for the Controlled Synthesis of Porous SnO2 Nanospheres: Application as an Efficient Photocatalyst and an Excellent Gas Sensing Material. ACS Appl. Mater. Interfaces 2012, 4, 6252–6260. [Google Scholar] [CrossRef]
- Liu, Y.; Jiao, Y.; Zhang, Z.; Qu, F.; Umar, A.; Wu, X. Hierarchical SnO2 Nanostructures Made of Intermingled Ultrathin Nanosheets for Environmental Remediation, Smart Gas Sensor, and Supercapacitor Applications. ACS Appl. Mater. Interfaces 2014, 6, 2174–2184. [Google Scholar] [CrossRef]
- Daghrir, R.; Drogui, P.; Robert, D. Modified TiO2 For Environmental Photocatalytic Applications: A Review. Ind. Eng. Chem. Res. 2013, 52, 3581–3599. [Google Scholar] [CrossRef]
- Wang, H.; Rogach, A.L. Hierarchical SnO2 Nanostructures: Recent Advances in Design, Synthesis, and Applications. Chem. Mater. 2013, 26, 123–133. [Google Scholar] [CrossRef]
- Fortunato, E.; Ginley, D.; Hosono, H.; Paine, D.C. Transparent Conducting Oxides for Photovoltaics. MRS Bull. 2007, 32, 242–247. [Google Scholar] [CrossRef] [Green Version]
- Green, A.N.M.; Palomares, D.C.; Haque, S.A.; Kroon, A.J.M.; Durrant, J.R. Charge Transport versus Recombination in Dye-Sensitized Solar Cells Employing Nanocrystalline TiO2 and SnO2 Films. J. Phys. Chem. B 2005, 109, 12525–12533. [Google Scholar] [CrossRef] [PubMed]
- Lewis, B.G.; Paine, D.C. Applications and Processing of Transparent Conducting Oxides. MRS Bull. 2000, 25, 22–27. [Google Scholar] [CrossRef]
- Dutta, S.; Patra, A.K.; De, S.; Bhaumik, A.; Saha, B. Self-Assembled TiO2 Nanospheres By Using a Biopolymer as a Template and Its Optoelectronic Application. ACS Appl. Mater. Interfaces 2012, 4, 1560–1564. [Google Scholar] [CrossRef]
- Presley, R.E.; Munsee, C.L.; Park, C.-H.; Hong, D.; Wager, J.F.; Keszler, D. Tin oxide transparent thin-film transistors. J. Phys. D Appl. Phys. 2004, 37, 2810–2813. [Google Scholar] [CrossRef] [Green Version]
- Bob, B.; Song, T.-B.; Chen, C.-C.; Xu, Z.; Yang, Y. Nanoscale Dispersions of Gelled SnO2: Material Properties and Device Applications. Chem. Mater. 2013, 25, 4725–4730. [Google Scholar] [CrossRef]
- Vinodgopal, K.; Kamat, P.V. Enhanced rates of photocatalytic degradation of an azo dye using SnO2/TiO2 coupled semiconductor thin films. Environ. Sci. Technol. 1995, 29, 841–845. [Google Scholar] [CrossRef]
- Liu, Z.; Sun, D.D.; Guo, P.; Leckie, J.O. An Efficient Bicomponent TiO2/SnO2 Nanofiber Photocatalyst Fabricated by Electrospinning with a Side-by-Side Dual Spinneret Method. Nano Lett. 2007, 7, 1081–1085. [Google Scholar] [CrossRef]
- Beltrán, A.; Andrés, J.; Sambrano, J.R.; Longo, E. Density Functional Theory Study on the Structural and Electronic Properties of Low Index Rutile Surfaces for TiO2/SnO2/TiO2 and SnO2/TiO2/SnO2 Composite Systems. J. Phys. Chem. A 2008, 112, 8943–8952. [Google Scholar] [CrossRef]
- Yadav, B.; Verma, N.; Singh, S. Nanocrystalline SnO2–TiO2 thin film deposited on base of equilateral prism as an opto-electronic humidity sensor. Opt. Laser Technol. 2012, 44, 1681–1688. [Google Scholar] [CrossRef]
- Hou, X.; Wang, X.; Liu, B.; Wang, Q.; Wang, Z.; Chen, D.; Shen, G. SnO2@TiO2Heterojunction Nanostructures for Lithium-Ion Batteries and Self-Powered UV Photodetectors with Improved Performances. ChemElectroChem 2013, 1, 108–115. [Google Scholar] [CrossRef]
- Radecka, M.; Zakrzewska, K.; Rerkas, M. SnO2–TiO2 solid solutions for gas sensors. Sens. Actuators B Chem. 1998, 47, 194–204. [Google Scholar] [CrossRef]
- Chai, S.; Zhao, G.; Li, P.; Lei, Y.; Zhang, Y.; Li, D. Novel Sieve-Like SnO2/TiO2 Nanotubes with Integrated Photoelectrocatalysis: Fabrication and Application for Efficient Toxicity Elimination of Nitrophenol Wastewater. J. Phys. Chem. C 2011, 115, 18261–18269. [Google Scholar] [CrossRef]
- Kumar, V.; Jaiswal, M.K.; Gupta, R.; Kulriya, P.K.; Asokan, K.; Sulania, I.; Ojha, S.; Kumar, R. Modification in the properties of SnO2 and TiO2 nanocomposite thin films by low energy ion irradiation. Integr. Ferroelectr. 2018, 193, 88–99. [Google Scholar] [CrossRef]
- Huang, M.; Yu, J.; Li, B.; Deng, C.; Wang, L.; Wu, W.; Dong, L.; Zhang, F.; Fan, M. Intergrowth and coexistence effects of TiO2–SnO2 nanocomposite with excellent photocatalytic activity. J. Alloy. Compd. 2015, 629, 55–61. [Google Scholar] [CrossRef]
- Vargas, M.A.; Rodríguez-Páez, J.E. Amorphous TiO2 nanoparticles: Synthesis and antibacterial capacity. J. Non-Crystalline Solids 2017, 459, 192–205. [Google Scholar] [CrossRef]
- Wang, Q.; Wei, X.; Dai, J.; Jiang, J.; Huo, X. Influence of annealing process on ferromagnetism of undoped TiO2 nanoparticles prepared by sol–gel method. Mater. Sci. Semicond. Process. 2014, 21, 111–115. [Google Scholar] [CrossRef]
- Kutuzova, A.S.; Dontsova, T.A. Characterization and properties of TiO2–SnO2 nanocomposites, obtained by hydrolysis method. Appl. Nanosci. 2019, 9, 873–880. [Google Scholar] [CrossRef]
- Ivanova, T.; Harizanova, A.; Koutzarova, T.; Vertruyen, B. Optical and structural characterization of TiO2 films doped with silver nanoparticles obtained by sol–gel method. Opt. Mater. 2013, 36, 207–213. [Google Scholar] [CrossRef]
- Liu, N.; Chen, X.; Zhang, J.; Schwank, J.W. A review on TiO2-based nanotubes synthesized via hydrothermal method: Formation mechanism, structure modification, and photocatalytic applications. Catal. Today 2014, 225, 34–51. [Google Scholar] [CrossRef]
- Kovalev, I.A.; Petrov, A.A.; Ibragimova, O.A.; Shokod’ko, A.V.; Chernyavskii, A.S.; Goodilin, E.A.; Solntsev, K.A.; Tarasov, A.B. New hierarchical titania-based structures for photocatalysis. Mendeleev Commun. 2018, 28, 541–542. [Google Scholar] [CrossRef]
- Rasoulnezhad, H.; Kavei, G.; Ahmadi, K.; Rahimipour, M.R. Combined sonochemical/CVD method for preparation of nanostructured carbon-doped TiO 2 thin film. Appl. Surf. Sci. 2017, 408, 1–10. [Google Scholar] [CrossRef]
- Wittawat, R.; Rittipun, R.; Jarasfah, M.; Nattaporn, B. Synthesis of ZnO/TiO2 spherical particles for blue light screening by ultrasonic spray pyrolysis. Mater. Today Commun. 2020, 24, 101126. [Google Scholar] [CrossRef]
- Bettini, L.; Dozzi, M.V.; Della Foglia, F.; Chiarello, G.L.; Selli, E.; Lenardi, C.; Piseri, P.; Milani, P. Mixed-phase nanocrystalline TiO2 photocatalysts produced by flame spray pyrolysis. Appl. Catal. B Environ. 2015, 178, 226–232. [Google Scholar] [CrossRef]
- Scarisoreanu, M.; Fleaca, C.; Morjan, I.; Niculescu, A.-M.; Luculescu, C.; Dutu, E.; Ilie, A.; Morjan, I.; Florescu, L.G.; Vasile, E.; et al. High photoactive TiO 2 /SnO 2 nanocomposites prepared by laser pyrolysis. Appl. Surf. Sci. 2017, 418, 491–498. [Google Scholar] [CrossRef]
- Anandan, S.; Pugazhenthiran, N.; Lana-Villarreal, T.; Lee, G.-J.; Wu, J.J. Catalytic degradation of a plasticizer, di-ethylhexyl phthalate, using Nx–TiO2−x nanoparticles synthesized via co-precipitation. Chem. Eng. J. 2013, 231, 182–189. [Google Scholar] [CrossRef]
- Zikriya, M.; Nadaf, Y.; Bharathy, P.V.; Renuka, C. Luminescent characterization of rare earth Dy3+ ion doped TiO2 prepared by simple chemical co-precipitation method. J. Rare Earths 2018, 37, 24–31. [Google Scholar] [CrossRef]
- Hariharan, D.; Thangamuniyandi, P.; Selvakumar, P.; Devan, U.; Pugazhendhi, A.; Vasantharaja, R.; Nehru, L. Green approach synthesis of Pd@TiO2 nanoparticles: Characterization, visible light active picric acid degradation and anticancer activity. Process Biochem. 2019, 87, 83–88. [Google Scholar] [CrossRef]
- Papp, C.; Steinrück, H.-P. In situ high-resolution X-ray photoelectron spectroscopy—Fundamental insights in surface reactions. Surf. Sci. Rep. 2013, 68, 446–487. [Google Scholar] [CrossRef]
- Chourasia, A.R.; Hillegas, A.E. Analysis of tin and tin oxide by x-ray photoelectron spectroscopy. Surf. Sci. Spectra 2021, 28, 014003. [Google Scholar] [CrossRef]
- Moulder, J.F.; Stickle, W.F.; Sobol, P.E.; Bomben, K.D. Handbook of X-ray Photoelectron Spectroscopy; Perkin-Elmer Corporation: Eden Prairie, MN, USA, 1992. [Google Scholar]
- Cho, S.; Yu, J.; Kang, S.K.; Shih, D.-Y. Oxidation study of pure tin and its alloys via electrochemical reduction analysis. J. Electron. Mater. 2005, 34, 635–642. [Google Scholar] [CrossRef]
- Thompson, A. X-ray Data Booklet; LBNL/PUB-490 Rev. 3; University of California: Berkeley, CA, USA, 2009. [Google Scholar]
- Kumar, D.; Chen, M.; Goodman, D. Characterization of ultra-thin TiO2 films grown on Mo(112). Thin Solid Films 2006, 515, 1475–1479. [Google Scholar] [CrossRef]
- Dolat, D.; Mozia, S.; Wróbel, R.; Moszyński, D.; Ohtani, B.; Guskos, N.; Morawski, A.W. Nitrogen-doped, metal-modified rutile titanium dioxide as photocatalysts for water remediation. Appl. Catal. B Environ. 2015, 162, 310–318. [Google Scholar] [CrossRef]
- Boscher, N.; Olivier, S.; Maurau, R.; Bulou, S.; Sindzingre, T.; Belmonte, T.; Choquet, P. Photocatalytic anatase titanium dioxide thin films deposition by an atmospheric pressure blown arc discharge. Appl. Surf. Sci. 2014, 311, 721–728. [Google Scholar] [CrossRef]
- Saric, I.; Peter, R.; Petravic, M. Oxidation of Cobalt by Oxygen Bombardment at Room Temperature. J. Phys. Chem. C 2016, 120, 22421–22425. [Google Scholar] [CrossRef]
- Dong, H.; Edmondson, J.; Miller, R.; Chourasia, A. Chemical reactivity at Fe/CuO interface studied in situ by X-ray photoelectron spectroscopy. Vacuum 2014, 101, 27–32. [Google Scholar] [CrossRef]
- Gamsjager, H.; Gajda, T.; Sangster, J.; Saxena, S.K.; Voigt, W. Chemical Thermodynamics Volume 12; Perrone, J., Ed.; OECD Nuclear Energy Agency, Data Bank: Leoben, Austria, 2013; ISBN 978-92-64-99206-1. [Google Scholar]
- Schaefer, S.C. Electrochemical Determination of Thermodynamic Properties of Bismuth Sesquioxide and Stannic Oxide; United States Department of the Interior Report of Investigation 8906; Bureau of Mines Report of Investigations: Anchorage, AK, USA, 1984. [Google Scholar]
- Kim, J.; Kang, S. Stable phase domains of the TiO2–Ti3O5–Ti2O3–TiO–Ti(CxOy)–TiC system examined experimentally and via first principles calculations. J. Mater. Chem. A 2013, 2, 2641–2647. [Google Scholar] [CrossRef]
- Lide, D.R. (Ed.) Handbook of Chemistry and Physics, 72nd ed.; CRC Press Inc.: Boca Raton, FL, USA, 1991. [Google Scholar]
- Magill, P.L. Equilibrium in the System Hydrogen, Water Vapor and the Oxides of Tin. Unpublished Bachelor’s Thesis, California Institute of Technology, Pasadena, CA, USA, 1923. [Google Scholar]

Publisher’s Note: MDPI stays neutral with regard to jurisdictional claims in published maps and institutional affiliations. |
© 2022 by the authors. Licensee MDPI, Basel, Switzerland. This article is an open access article distributed under the terms and conditions of the Creative Commons Attribution (CC BY) license (https://creativecommons.org/licenses/by/4.0/).
Share and Cite
Martinez, M.; Chourasia, A.R. Characterization of Ti/SnO2 Interface by X-ray Photoelectron Spectroscopy. Nanomaterials 2022, 12, 202. https://doi.org/10.3390/nano12020202
Martinez M, Chourasia AR. Characterization of Ti/SnO2 Interface by X-ray Photoelectron Spectroscopy. Nanomaterials. 2022; 12(2):202. https://doi.org/10.3390/nano12020202
Chicago/Turabian StyleMartinez, Miranda, and Anil R. Chourasia. 2022. "Characterization of Ti/SnO2 Interface by X-ray Photoelectron Spectroscopy" Nanomaterials 12, no. 2: 202. https://doi.org/10.3390/nano12020202
APA StyleMartinez, M., & Chourasia, A. R. (2022). Characterization of Ti/SnO2 Interface by X-ray Photoelectron Spectroscopy. Nanomaterials, 12(2), 202. https://doi.org/10.3390/nano12020202