Abstract
Academic dropout is a persistent challenge in higher education, particularly in contexts with socio-economic disparities and diverse learning conditions. Traditional predictive models often fail to capture the complex, non-linear interactions underlying student trajectories due to their reliance on low-dimensional and linear representations. This study introduces a visual representation–based computational approach for a student dropout analysis, applied to a real institutional dataset from Colombia. The methodology transforms structured student records into enriched visual encodings that map variable magnitudes, correlations, and latent relationships into spatial and textural patterns. These image-based representations allow convolutional neural networks (CNNs) to exploit hierarchical feature extraction, uncovering hidden dependencies not accessible through conventional classifiers. Experimental results demonstrate that a Convolutional Neural Network (CNN) trained from scratch outperforms both baseline machine learning models and transfer learning architectures across all evaluation metrics. Beyond predictive accuracy, the approach enhances data expressiveness, interpretability, and generalization, offering a visual-analytical perspective for understanding dropout dynamics. The Colombian case study confirms the feasibility and potential of this strategy in real educational settings, supporting early identification of at-risk students and contributing to the development of robust, explainable models in educational data mining and learning analytics.
1. Introduction
Student dropout has long been recognized as a multifaceted challenge in higher education, affecting not only the academic and personal trajectories of students but also the planning, quality assurance, and long-term sustainability of educational institutions. Over the past decade, advances in data science and artificial intelligence have fostered an expanding body of research aimed at anticipating attrition risk through computational modeling, integrating statistical techniques, machine learning, and deep learning. The literature reflects a clear transition from an early reliance on demographic and academic variables toward multimodal data sources, ensemble architectures, and explainable methods that enable institutions to understand not only who is likely to leave but also why such decisions occur.
Despite these advances, dropout prediction remains particularly challenging due to the heterogeneity and incompleteness of institutional data. Each university manages its own academic information systems, characterized by distinct structures, field definitions, and data entry practices, producing datasets that are inherently diverse and often fragmented. The level of detail, frequency of updates, and naming conventions vary considerably across institutions, resulting in non-standardized records where equivalent variables may differ in scope, semantics, or granularity. Such variability has significant implications for modeling, as inconsistencies in data completeness and representation affect both the comparability of results and the generalizability of trained models. Consequently, the core difficulty extends beyond achieving high predictive accuracy within a single dataset: it lies in developing computational strategies capable of representing heterogeneous and partially complete information in ways that preserve its relational structure and reveal the most informative patterns for anticipating dropout events.
In the Colombian higher education context, institutional data collection practices were not originally designed with predictive analytics in mind. Consequently, the relationship between available records and the phenomenon of student attrition is complex and indirect. Evidence shows that data acquisition arises from heterogeneous administrative processes that vary in purpose, structure, and timing, leading to inconsistencies that require extensive standardization efforts. Different admission instruments, survey formats, and storage systems coexist across programs and academic periods, often resulting in fragmented or redundant information. As a result, a substantial preprocessing phase is indispensable to harmonize, clean, and integrate the data before any computational modeling can be reliably applied. Unlike studies from countries with long-standing institutional analytics frameworks, research conducted within Colombian universities continues to face significant challenges derived from this fragmented data ecosystem, making dropout prediction a demanding yet valuable academic endeavor.
Within this study line, one line of research has explored the integration of unstructured data into predictive frameworks. Phan et al. [1] proposed a decision-support system for higher education that combined structured features such as academic performance and sociodemographics with textual feedback processed using doc2vec and BERT embeddings. Their findings indicated that segmentation and natural language features significantly enhanced predictive accuracy, even though textual data introduced challenges for model stability. Similarly, Krüger et al. [2] advanced an explainable machine learning approach in Brazilian schools that incorporated socioeconomic enrichment, temporal features, and SHAP values, achieving predictive accuracies above 90% while providing interpretable insights into the determinants of dropout. Other studies have emphasized the predictive potential of ensemble methods. Villa-Murillo et al. [3] demonstrated that combining survival analysis with decision trees and Random Forests improved early detection of at-risk students in Chilean universities, while Rabelo and Zárate [4] reported that ensembles of logistic regression, neural networks, and decision trees achieved nearly 90% accuracy in identifying vulnerable students. More recent benchmarks underscore the superiority of boosting algorithms when coupled with hyperparameter optimization: Villar and de Andrade [5] found that LightGBM and CatBoost consistently outperformed conventional classifiers, particularly when tuned with Optuna and complemented by anomaly detection through Isolation Forest. Likewise, Rebelo Marcolino et al. [6] leveraged Moodle log data to train CatBoost models optimized via NSGA-II, demonstrating that models exploiting the full temporal sequence of interactions substantially improved recall and F1-scores compared to week-by-week models.
The relevance of temporal and behavioral variables is further evidenced in studies analyzing student activity across different stages of the academic cycle. Segura et al. [7] observed that dropout prediction improves substantially after the first semester, with features such as course preference and early performance emerging as key predictors. Likewise, Niyogisubizo et al. [8] showed that a stacked ensemble combining Random Forest, gradient boosting, and neural networks reached an AUC of 0.98 by exploiting attendance, course access, and project data as the most influential variables. Deep learning has also gained traction as a dominant framework in educational data mining. Sayed [9] applied convolutional neural networks (CNNs) to student information and learning management system data from the Arab Open University, achieving nearly 99% accuracy and underscoring the capacity of CNNs to capture structural and visual patterns. A systematic review by [10] further highlighted the potential of deep neural architectures, particularly hybrid models combining Convolutional Neural Networks (CNN) and Long Short-Term Memory (LSTM) networks, for predicting student performance and dropout within virtual learning environments. In these settings, behavioral and interactional features derived from Massive Open Online Courses (MOOCs) and Learning Management Systems (LMS) consistently emerged as the most influential predictors.
Beyond algorithmic innovation, several studies have adopted complementary perspectives that extend beyond purely computational analyses. Silva et al. [11] proposed the Analytic Hierarchy Process as a transparent decision-support tool, comparing its predictive capacity with logistic regression, while Alban and Mauricio [12] highlighted students’ perceptions as decisive determinants of dropout, grounded in an extensive review of educational theories. Similarly, Llauró et al. [13] developed a tutor-based Delphi framework to assess dropout risk, revealing that factors such as motivation, study habits, and time allocation were consistently prioritized across disciplines. Other contributions reinforce the significance of contextual and methodological diversity. Rodríguez-Márquez et al. [14] applied Kaplan–Meier estimators to analyze dropout in Colombia, demonstrating that financial support and academic performance remain decisive factors. Pecuchova and Drlik [15] confirmed the advantage of decision trees over logistic regression in identifying students at risk in Malaysia, while Quintana-Quispe et al. [16] found that decision trees also outperformed alternative classifiers in Peru, particularly when integrated with feature reduction. Comparative analyses such as those by Kabathova and Drlik [17] further emphasized the challenges of prediction in courses with limited datasets, while showing that careful feature selection and model comparison can nonetheless yield accuracies above 90%.
Recent research has also drawn attention to the ethical and demographic dimensions of predictive modeling, showing how algorithmic systems may reproduce or amplify existing social and gender-based disparities. For instance, Fosch-Villaronga et al. [18] examined gender inferences on social media and their implications for algorithmic bias and discrimination, while Thakur et al. [19] analyzed gender-specific discourse around online learning on Twitter, revealing structural differences in participation, sentiment, and toxicity. In light of these findings, this study incorporates subgroup-level analyses—considering dimensions such as faculty, methodology, shift, socioeconomic stratum, and age groups—to assess whether model performance remains consistent across heterogeneous populations. Although small subgroup sizes and uncertainty are acknowledged as inherent limitations, these analyses contribute to a fairer and more transparent understanding of predictive behavior. Fairness considerations and more systematic subgroup evaluation are also recognized as essential directions for future research in educational data mining.
The rapid expansion of data-driven innovation has consolidated data science as a central catalyst for transformative applications in domains such as healthcare, finance, and industrial operations. Within these contexts, structured data, typically organized in tabular form with measurable attributes per record, has served as the foundation for decision-making systems and intelligent tools. However, traditional machine learning models often encounter significant limitations when addressing low-dimensional datasets and nonlinear feature interactions, thereby reducing their generalization capacity in complex, heterogeneous scenarios. Although certain algorithms achieve high predictive performance under specific conditions, such outcomes are not always attainable given the intrinsic nature, completeness, and dimensionality of the data. This underscores the importance of exploring alternative computational paradigms capable of strengthening data representation, resilience, and interpretability across diverse educational environments.
These limitations have motivated researchers to investigate innovative transformations of structured data into visual encodings that leverage the power of convolutional neural networks (CNNs) and other architectures originally conceived for image recognition. By reframing numerical records as two-dimensional images through methods such as spectrograms, recurrence plots, correlation maps, or Gaussian surface mappings, deep learning models can exploit their intrinsic ability to extract hierarchical spatial representations. Such transformations expand the expressive dimensionality of the data and uncover latent structures that remain inaccessible to conventional algorithms. This alignment has yielded promising results in medicine, where visual encodings of clinical variables have improved diagnostic performance, and in industrial contexts, where the visualization of sensor data has enhanced predictive maintenance and anomaly detection. These examples suggest that visual representations are not merely methodological novelties but rather constitute disruptive opportunities that redefine how classification and prediction tasks can be addressed, opening new perspectives for educational data mining and dropout analysis.
The objective of this study is to evaluate whether the visual transformation of structured student data can enhance the predictive performance and robustness of deep learning models in the context of dropout analysis. Specifically, the study proposes the design and implementation of a computational framework that converts academic and behavioral variables of students into visual encodings optimized for convolutional architectures, benchmarks these visual encodings against classical machine learning classifiers and structured-data baselines, and analyzes their interpretability and potential as a decision-support tool for higher education institutions in Colombia.
The contribution of this paper lies in introducing and validating a visual representation–based computational approach for dropout prediction. Unlike previous studies that rely exclusively on structured variables or traditional ensembles, our method proposes the transformation of tabular educational records into fringe-pattern images derived from Gaussian surface mappings, generated in both grayscale and RGB formats. These images encode feature importance, spatial frequency, and texture, enabling CNNs to capture latent relationships not directly observable in raw data. The study contributes at three complementary levels: methodologically, by integrating visual encoding strategies into deep learning workflows; empirically, by providing evidence from a Colombian case study; and practically, by demonstrating that visual transformations of student data can improve the early detection of dropout risk while enhancing interpretability through visual cues. Ultimately, this approach emphasizes that the pursuit of high predictive accuracy must be accompanied by efforts to strengthen data representation, generalization, and explainability, particularly in contexts characterized by heterogeneous and low-dimensional information.
The remainder of this paper is structured as follows. Section 2 presents the theoretical framework, outlining conventional dropout prediction methods, visual representation strategies, and the deep learning models employed in this study. Section 3 details the methodological design, including the case study, data preprocessing pipeline, baseline models, visual encoding procedures, and the implementation of the proposed deep learning approach. Section 4 reports and discusses the experimental results, focusing on baseline performance, the contribution of visual representations, and the effectiveness of the integrated deep learning process. Finally, Section 5 summarizes the main conclusions and highlights future directions for expanding the scope and applicability of the proposed framework.
2. Theoretical Framework
Student dropout in higher education constitutes a complex phenomenon that has motivated the development of increasingly sophisticated predictive models. This section presents the theoretical bases underpinning the proposed approach: first, conventional and machine learning models for dropout analysis are reviewed; then, visual representation approaches for structured data are introduced, with emphasis on fringe pattern images as a disruptive paradigm; finally, advances in deep learning for computer vision are synthesized, highlighting key architectures for classification tasks.
2.1. Conventional Machine Learning Techniques for Student Dropout Analysis
Early models of dropout prediction were rooted in educational theories, such as Tinto’s model of student integration and Spady’s sociological framework, which emphasized social and academic integration as predictors of persistence [20]. These theoretical underpinnings were later operationalized through statistical models, particularly logistic regression and survival analysis, allowing researchers to quantify dropout probabilities as functions of academic, demographic, and economic variables [21].
Logistic regression models dropout as a binary outcome . The probability of withdrawal given feature vector is defined as shown in Equation (1):
where denotes the sigmoid function, w the feature weights, and b the bias term. Parameters are typically estimated by maximizing the log-likelihood function (Equation (2)):
Survival analysis, and specifically the Cox proportional hazards model, estimates the hazard of dropout at time t as expressed in Equation (3):
where represents the baseline hazard. This formulation allows not only the prediction of dropout risk but also the estimation of its timing.
Machine learning approaches extended these statistical foundations by enabling the capture of non-linear relationships and high-dimensional feature spaces. Support Vector Machines (SVMs), for instance, maximize the margin between dropout and persistence classes, as shown in Equation (4):
Likewise, Decision Trees, Random Forests, and Gradient Boosting algorithms exploit recursive partitioning and ensemble aggregation, with information gain () defined in Equation (5):
Deep learning approaches emerged to overcome the representational limitations of shallow models. A multilayer perceptron (MLP) generalizes logistic regression by introducing multiple nonlinear transformations, as defined in Equation (6):
Recurrent architectures, such as Long Short-Term Memory (LSTM) networks, capture temporal dependencies in student activity sequences (Equation (7)):
In concordance with recent literature, Table 1 summarizes the main approaches to student dropout prediction. It distinguishes statistical, classical machine learning, and deep learning paradigms, outlining their core functioning, key advantages, and emerging research opportunities across educational contexts.

Table 1.
Comparative overview of dropout prediction approaches.
A recurring limitation in traditional classifiers lies in their reliance on low-dimensional feature spaces, which often fail to capture the complex, non-linear relationships inherent in educational data. This constraint reduces the expressive capacity of the models and limits their generalization across diverse learning contexts. Current research trends therefore emphasize the development of richer data representations—through feature engineering, manifold learning, or visual encoding strategies—to enhance the discriminative power and interpretability of dropout prediction models.
2.2. Visual Representation Approaches for Structured Data
In line with these emerging research directions, visual representation techniques have gained increasing attention as a transformative approach to overcome the expressive limitations imposed by low-dimensional feature spaces. Traditional tabular datasets, often restricted to a few attributes, tend to flatten the underlying complexity of the phenomena they describe. As a result, subtle interactions and higher-order correlations among variables remain obscured. To address this, visual encoding strategies propose transforming structured data into spatially organized, high-dimensional image-like artifacts, thereby enabling convolutional neural networks (CNNs) to operate on data traditionally confined to numerical vectors.
This methodological reformulation introduces an expanded feature space, where attribute magnitudes, relationships, and contextual dependencies are embedded as spatial patterns and textures. In contrast to one-dimensional arrays, visual encodings produce richer manifolds that facilitate hierarchical abstraction and deep spatial reasoning. Such high-dimensional representations allow CNNs to uncover non-linear structures and dependencies that classical approaches, constrained by linear assumptions, systematically ignore. Consequently, dropout prediction or academic risk analysis—domains characterized by multi-factorial and non-linear dynamics—can benefit from these richer geometric representations.
A representative illustration of this concept is the work of Aslan and Sabanci [22], who proposed a novel deep learning pipeline for diabetes prediction using the PIMA Indians Diabetes dataset, as shown in Figure 1. This dataset, originally composed of purely numerical clinical features (e.g., glucose concentration, BMI, insulin, and age), was transformed into two-dimensional grayscale images through a ReliefF-guided encoding process. Each feature value was normalized and mapped into pixel intensities within a structured grid, with spatial positioning determined by its relative importance. This process yielded high-dimensional image artifacts in which inter-feature dependencies were expressed visually as patterns of brightness and contrast. By training fine-tuned ResNet18 and ResNet50 architectures on these generated images—and further enhancing performance through hybrid CNN–SVM fusion and feature selection— the authors achieved classification accuracies exceeding 92%, significantly outperforming conventional 1D classifiers.
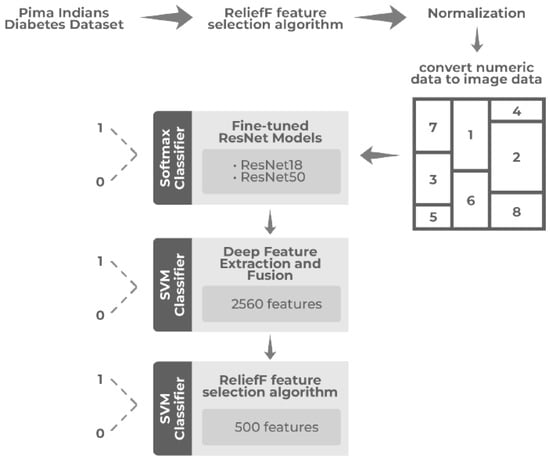
Figure 1.
PIMA structured data transformation from tabular format to visual representation.
Such findings underscore the value of high-dimensional visual encodings as an effective means to overcome the representational bottleneck of low-dimensional models. By expanding the input manifold, these strategies amplify the discriminative and generalization capacity of CNNs, offering an avenue for more expressive and interpretable deep learning in structured domains. This paradigm, though pioneered in biomedical applications, is equally applicable to educational datasets, where latent interactions among academic, socio-demographic, and behavioral variables may only emerge under richer spatial mappings.
Overall, visual representation approaches bridge the gap between structured analytics and computer vision by reinterpreting tabular records as spatial distributions. Through this lens, each data sample becomes a visual artifact containing multi-layered information, allowing deep networks to extract complex features beyond the reach of traditional, low-dimensional representations. This shift holds particular promise for educational data mining, where capturing the intricate interplay of variables is essential for robust and generalizable dropout prediction models.
Moreover, similar advances have been reported across other domains, reinforcing the benefits of encoding structured data through spatial and textural attributes. For instance, Sindi et al. [23] employed spectrogram-based encodings in power quality disturbance classification, achieving substantial improvements by capturing temporal–frequency textures; Nandihal et al. [24] demonstrated that recurrence plots and hybrid 1D–2D mappings enhance manifold learning in EEG analysis; and Dai et al. [25] used correlation maps to reveal spatial dependencies in satellite imagery. These examples collectively highlight the contribution of additional spatial descriptors—such as texture, gradient orientation, and local contrast—which enrich the representational space and strengthen the extraction of latent patterns (see Figure 2).
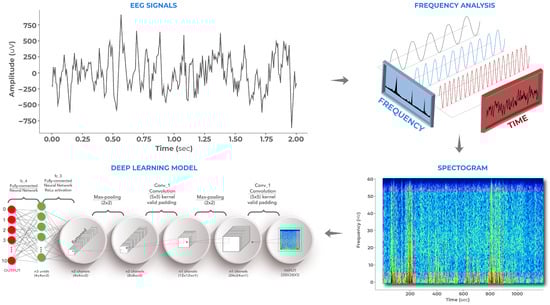
Figure 2.
Spectrogram-based visual encoding. Temporal signals are transformed into two-dimensional time–frequency representations.
The inclusion of these spatial attributes has proven particularly beneficial for complex analytical tasks, as it enables CNNs to exploit multi-scale cues and hierarchical texture information. This expansion beyond pure intensity encoding facilitates the identification of subtle, non-linear relationships that drive predictive accuracy and interpretability. As a result, visual representation techniques have opened new lines of research focused on domain-specific visual grammars, cross-modal fusion with textual or sequential data, and visual interpretability frameworks grounded in saliency and attention mechanisms—emerging directions that promise to redefine structured data analysis in education, healthcare, and beyond.
2.3. Deep Learning Models in Visual Representation Approaches
Building upon the advances in visual encoding, deep learning architectures—particularly convolutional neural networks (CNNs)—have become the analytical backbone of high-dimensional visual representations. Their capacity to learn hierarchical, end-to-end features directly from image-like data has redefined the scope of predictive modeling across domains. By leveraging localized receptive fields and weight sharing, CNNs can extract both low-level descriptors (edges, gradients, textures) and high-level abstractions (semantic groupings and contextual dependencies), thereby bridging the gap between pixel-level encoding and conceptual understanding [23,24,25,26].
In the context of structured data transformed into visual artifacts, CNNs serve as powerful instruments for uncovering latent relationships obscured in tabular form. When educational, biomedical, or environmental variables are spatially mapped into two-dimensional grids—through methods such as spectrogram generation, correlation mapping, or recurrence plotting—deep convolutional models can exploit spatial hierarchies to detect patterns indicative of underlying phenomena [27]. This capability is particularly valuable in educational data mining, where the interplay among academic, socio-demographic, and behavioral attributes often manifests as subtle, non-linear textures within the encoded visual field.
Canonical CNN architectures have evolved significantly since the pioneering work of [28], with each generation contributing to improved depth, expressiveness, and computational efficiency:
- LeNet: Introduced for grayscale digit recognition, demonstrating the feasibility of hierarchical spatial learning.
- AlexNet: Popularized the use of ReLU activation and GPU acceleration, enabling training of deeper models on large-scale datasets.
- VGG: Adopted a deep, uniform convolutional structure, enhancing the capacity to capture fine-grained spatial details.
- GoogleNet (Inception): Incorporated multi-scale convolutional modules, improving representational efficiency through parallel receptive fields.
- ResNet: Introduced residual learning, alleviating vanishing gradients and enabling ultra-deep networks with improved convergence.
- DenseNet: Proposed dense connectivity to promote feature reuse and gradient flow across layers.
These architectures, originally designed for natural image classification, have been successfully repurposed for the analysis of visually encoded structured data. For instance, Aslan and Sabanci [22] fine-tuned ResNet18 and ResNet50 on grayscale images derived from clinical features, achieving over 92% accuracy in diabetes prediction—surpassing traditional machine learning baselines. Similarly, Sindi et al. [23] employed hybrid one-dimensional and two-dimensional CNNs for power disturbance classification using spectrogram-based encodings, highlighting the benefit of multi-channel spatial cues. In neuroinformatics, Nandihal et al. [24] demonstrated that combining 1D temporal signals with 2D visual encodings of EEG data enhances manifold learning and interpretability.
In educational settings, where dropout prediction models often struggle with low-dimensional tabular features, CNN-based architectures trained on visual encodings have shown promising results. Empirical studies indicate that models such as VGG16, ResNet50, and DenseNet201 outperform conventional classifiers by capturing high-order dependencies and spatial relationships embedded in structured student data [4,5,6]. Through hierarchical feature extraction, these networks interpret spatial distributions, textures, and attribute gradients as proxies for complex learning dynamics—offering more robust and interpretable predictions for early dropout detection. Figure 3 illustrates the role of deep learning within visual representation-based strategies.
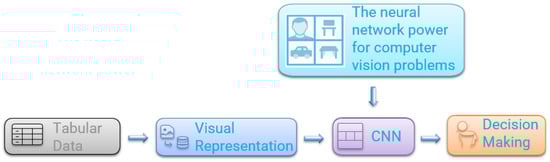
Figure 3.
Deep learning role in visual representation strategies.
In general terms, it could be assumed that deep learning models constitute the computational core of visual representation approaches. Their hierarchical design, capacity for spatial abstraction, and adaptability across domains enable the exploitation of high-dimensional feature spaces derived from structured data. By transforming tabular information into visual domains, CNN-based frameworks not only enhance discriminative performance but also facilitate richer interpretability, establishing a foundation for next-generation analytical pipelines in education, healthcare, and environmental sciences.
Future research directions should thus focus on refining the harmony between visual representation and deep learning through the exploration of image encodings that integrate more expressive spatial characteristics. Incorporating attributes such as texture, contrast, and spatial distribution can substantially enrich the feature space, enabling CNNs to better model the complex, non-linear relationships inherent in educational datasets. In dropout prediction—where input data typically exhibit low dimensionality and sparse interactions—these enhanced visual encodings may unlock new levels of analytical precision, offering models the ability to generalize more effectively across diverse student populations while preserving interpretability and fairness in predictive outcomes.
3. Methods and Procedures
This section outlines the methodological framework adopted for modeling and predicting academic dropout risk through enriched visual data representations. The discussion is structured into three main stages. First, the dataset is introduced, drawn from a real case study conducted in Colombia, and a general description of its structure, scope, and key attributes is provided to contextualize the factors associated with student retention and academic performance. Second, the baseline algorithms traditionally used for dropout risk estimation are presented, serving as reference models to evaluate the relative performance and interpretability of the proposed approach. Finally, a visual representation strategy is developed, in which structured educational data are transformed into image-based encodings augmented with spatial and textural attributes. This enriched transformation enables convolutional neural networks to exploit higher-dimensional feature spaces, enhancing their ability to capture complex, non-linear relationships that are typically underrepresented in low-dimensional educational datasets.
3.1. Study Case Description
In the Colombian higher education context, institutional data systems were not originally designed for predictive analytics or dropout forecasting, which makes the link between collected information and student attrition inherently complex. Data are typically gathered through heterogeneous administrative processes using diverse admission instruments, survey formats, and storage platforms, leading to inconsistencies that demand extensive standardization and preprocessing. Consequently, integrating, cleaning, and harmonizing these fragmented records becomes a prerequisite for any reliable computational analysis. Compared to countries with more consolidated data ecosystems, studies on dropout prediction within Colombian universities still face considerable challenges, reflecting both the institutional diversity and the evolving maturity of their analytical frameworks.
This study was conducted at a public higher education institution in Colombia that offers technological and professional programs. As part of its admission and academic monitoring processes, the institution has progressively implemented systematic strategies for collecting and managing student information. These processes encompass both the admission stage—through the completion of enrollment forms by applicants—and the subsequent academic lifecycle of enrolled students, which is tracked through an institutional management platform.
The institution provided access to anonymized internal records containing sociodemographic, socioeconomic, and academic variables from undergraduate programs. These data span multiple academic cohorts and allow for a comprehensive analysis of student trajectories, from admission to potential dropout or graduation. The dataset used in this study is particularly relevant to the Colombian higher education context, where dropout remains a persistent challenge associated with structural inequalities and diverse student profiles.
Data Sources and Preprocessing
Building upon the institutional data infrastructure described in the previous section, this stage details the data integration and preprocessing procedures that enabled the construction of a consistent modeling dataset suitable for supervised learning and deep learning experiments. This study relied on two anonymized institutional datasets offering complementary perspectives of the student population: an active-students registry comprising 181,922 records and a dropout registry containing 99,493 records. After aligning 154 shared variables, both sources were horizontally merged, and a provenance-tracking field (origen) was introduced to preserve the origin of each entry prior to concatenation. The resulting integrated dataset contained 281,415 records across 154 variables, providing a unified and longitudinal representation of academic trajectories, demographic characteristics, and administrative events.
From the institutional status field, a binary target variable (es_desertor) was derived to classify each record as either “dropout’’ or “non-dropout.’’ Students were labeled as dropouts when their institutional status indicated academic, definitive, or voluntary withdrawal, or regulatory cancellation; all other cases were categorized as non-dropouts. Longitudinal consolidation across heterogeneous systems was achieved using a hierarchical master key (student_code → internal_id → SNP/email), which prioritized identifier reliability and event recency. This linkage enabled the elimination of 216,615 duplicate rows, yielding a refined dataset of 64,800 unique student records. The final class distribution exhibited a pronounced imbalance: 61,228 non-dropouts (94.49%) versus 3572 dropouts (5.51%), corresponding to a 17.14:1 majority–minority ratio, meaning that for every student who dropped out, there were approximately seventeen who persisted. Additionally, email collisions—cases where a single email address was linked to multiple identifiers—were flagged in 881 records (1.36%) via the indicator flag_email_conflicto.
To ensure compliance with data protection standards and analytical consistency, non-modelable attributes, such as direct identifiers, metadata fields (data_*), and semantically redundant variables, were excluded. All date attributes were standardized as the number of days elapsed since 1 January 1970, and object-type columns containing more than 90% numeric content were coerced into numeric format. The resulting modeling table comprised 110 variables (76 categorical and 34 numeric), including the binary target variable and integrity flags, forming the structural basis for all subsequent modeling experiments. Categorical variables were encoded using an ordinal scheme with explicit handling of unknown categories (assigned a code of ) and missing values (NaN). A comprehensive mapping between text labels and numerical codes was preserved to ensure reproducibility across downstream modeling tasks.
The numeric subset contained 4,998,905 missing cells (70.77%), primarily resulting from optional form fields and inconsistencies inherited from legacy systems. To reconstruct a coherent feature space, K-Nearest Neighbors (KNN) imputation with was applied within a standardized academic–administrative subspace defined by key anchor variables, including age, stratum, methodology, shift, faculty, semester, level, credits_approved, credits_enrolled, subjects_enrolled, subjects_passed, campus, and period. For categorical variables, missing values were imputed using the most frequent category among valid neighbors. After this procedure, no missing values remained (0 NaN), yielding a complete and consistent feature space suitable for supervised modeling.
To accommodate both prevalence-faithful and balanced experimental designs, two final datasets were generated. The base set (64,800 × 110) retained the natural class imbalance, suitable for weighted learning and evaluation reflecting the observed prevalence. The balanced set (122,456 × 110) was constructed by oversampling minority cases with replacement, producing an equal 50/50 split between dropout and non-dropout records. This dual configuration enables comparative analysis across traditional machine learning and deep learning frameworks, while ensuring data integrity, reproducibility, and interpretability throughout the modeling pipeline.
The complete preprocessing workflow, including data extraction, alignment, deduplication, encoding, imputation, and class balancing, is summarized in the block diagram presented in Figure 4. The diagram illustrates the sequential transformation of the raw institutional records into structured modeling datasets, highlighting key dimensions at each stage: extraction from the two sources (181,922 and 99,493 records), alignment of 154 variables, deduplication yielding 64,800 unique students, exclusion of non-modelable attributes, encoding and standardization to 110 features, KNN-based imputation, and final dataset generation (64,800 imbalanced and 122,456 balanced records). This visualization emphasizes the reproducibility, traceability, and methodological rigor of the data preprocessing pipeline.
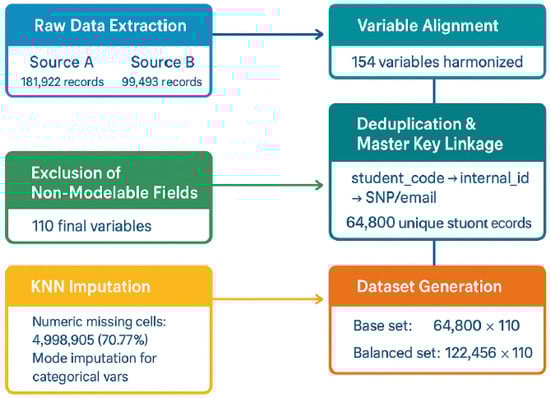
Figure 4.
Block diagram of the data integration and preprocessing pipeline, summarizing the sequential stages from raw data extraction to the generation of balanced and imbalanced modeling datasets.
For this exercise, the imputation topology, scaling, and leakage control involved standardizing numeric variables using z-score normalization and ordinally encoding categorical anchors with unknown_value = −1. Neighbor relationships were computed using a composite distance metric—scaled Euclidean for numeric fields and Hamming for categorical fields—yielding a Gower-like similarity structure. KNN imputation was performed with , unless otherwise specified. To prevent information leakage, the imputer and all preprocessing operations were fit exclusively within each training fold and subsequently applied to validation and test folds without refitting. Date-derived features (e.g., days since 1970–01–01) were standardized prior to neighbor computation. A sensitivity analysis varying , along with a MICE baseline, was conducted as follow (Table 2).
Table 2.
Sensitivity analysis for KNN imputation (different k values) and comparison with MICE. Metrics shown: ROC-AUC (mean ± 95% CI).
Likewise, record linkage, deduplication, and re-enrollment policy relied on a hierarchical matching key (student_code → internal_id → SNP/email) designed to prioritize identifier reliability and event recency. When multiple records were associated with the same student across academic periods, the most recent non-missing entry was retained, with ties resolved using the last update timestamp. Students who re-enrolled following a cancellation were encoded according to their final observed enrollment status at the end of the observation window, ensuring temporal consistency and preventing duplication across datasets.
3.2. Baseline Models
As part of the methodological design, a set of baseline machine learning models was implemented, serving as the starting point for identifying students at risk of student dropout. These models provide a reference framework for evaluating predictive performance and establish a benchmark against which more advanced approaches, such as high-dimensional visual representations and deep learning architectures, can be compared. The baseline stage was organized within a structured pipeline encompassing data preprocessing, an 80/20 training–testing split, hyperparameter tuning using exhaustive grid search combined with 5-fold cross-validation, and performance evaluation based on confusion matrix-derived metrics, as illustrated in Figure 5.
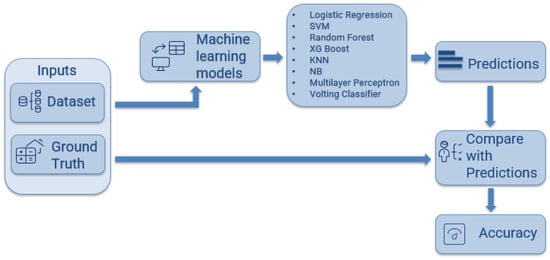
Figure 5.
Methodological workflow for baseline model evaluation.
To ensure a fair evaluation of class imbalance effects, resampling procedures were strictly confined to the training folds within each cross-validation split, thereby preserving the natural class distribution in validation and test sets. Oversampling was implemented through an imbalanced-learn pipeline, using both SMOTE and ADASYN strategies as comparative baselines. Each experimental configuration was repeated across five independent random seeds to assess performance robustness. Reported metrics correspond to the mean value and associated 95% confidence interval (CI), as summarized in Table 3.
Table 3.
Summary of the resampling and variance control protocol.
The baseline modeling phase involved a diverse set of algorithms designed to capture different aspects of the data. These included logistic regression, a linear interpretable classifier for identifying global relationships between predictors and dropout risk; support vector machines, effective for high-dimensional data and capable of modeling non-linear boundaries through kernel functions; random forest, an ensemble of decision trees that reduces overfitting and improves generalization; XGBoost, a gradient-boosted ensemble optimized for computational efficiency and strong performance on structured data; K-nearest neighbors, a distance-based classifier leveraging local similarity; Naïve Bayes, a simple probabilistic model robust with limited samples; and multilayer perceptron, a feedforward neural network capturing non-linear feature interactions. Additionally, a voting classifier was implemented to combine the predictions of the most effective models (XGBoost, random forest, and MLP), leveraging model diversity to enhance stability and robustness.
The performance of the proposed models was evaluated using standard classification metrics derived from the confusion matrix, including precision, recall, F1-score, and ROC-AUC. These measures quantify each model’s ability to correctly identify students at risk of dropout while balancing false positives and false negatives. Together, the combination of diverse algorithms and these evaluation metrics provides a comprehensive view of the predictive capacity and establishes a robust baseline for comparison with more advanced architectures that incorporate high-dimensional visual encodings or deep learning representations.
Building upon this foundation, the evaluation protocol was designed to ensure methodological rigor, reproducibility, and meaningful comparison across imputation and resampling strategies. Repeated stratified cross-validation was implemented, and all metrics were reported as mean values with 95% confidence intervals (CI) computed over seeds and folds. Complementary diagnostics included ROC and precision–recall curves. Decision thresholds were optimized on validation folds to maximize the F1 score, while deployment-oriented operating points were analyzed at fixed recall levels. Early stopping was configured with monitor = val_loss, a convergence patience of 10 epochs, and a minimum improvement tolerance of min_delta = . This criterion halted training once validation loss plateaued beyond the tolerance window, restoring the best-performing model weights to minimize overfitting and ensure convergence stability.
These evaluation procedures reinforce the internal validity of results and contribute to a transparent assessment of predictive reliability. As future work, this framework will be extended toward uncertainty-aware evaluation, Bayesian model averaging, and adaptive thresholding techniques, allowing for more robust generalization and fairer decision-making in large-scale educational datasets.
3.3. New Visual Representation Proposal for Student Dropout Analysis
Recent research in diverse domains has demonstrated the potential of transforming structured data into visual representations to enhance predictive modeling. Notably, studies involving datasets from the PIMA (Pima Indians) population and other biomedical or sociological contexts have successfully employed visual representation to convert tabular features into color fringe patterns [29]. In these cases, the core idea is to translate numerical variables into spatial intensity variations, creating images in which distinctive stripe arrangements encode complex interactions between features.
The rationale behind using fringe-based representations stems from principles of stress field imaging, originally developed in optical methods. Fringe patterns encode information through sinusoidal structures, whose spatial distortions reveal underlying geometric or amplitude properties. In computational contexts, this principle can be extended to structured datasets, where each variable is mapped as a spatial intensity distribution modulated by cosine-based interference patterns, generating visually complex textures that enhance the discriminative power of convolutional neural networks (CNNs).
Building on this framework, we propose a new visual representation approach for educational analytics. By encoding dropout-related features as synthetic fringe images, CNNs can capture subtle patterns of interaction and correlation among student variables, which may be difficult to detect in raw tabular formats. This paradigm enables more accurate and explainable classification outcomes, providing a promising avenue for early identification of students at risk of dropout.
As can be seen in Figure 6, the approach begins with cleaned and preprocessed structured data, providing a consistent and reliable foundation for analysis. Each feature is evaluated through a relevance analysis, which assesses both its value and its importance within the dataset. These values are then mapped onto a Gaussian surface, which is subsequently modulated by a cosine function. This process generates synthetic images that encode not only the magnitude of each feature but also its relative significance, producing a visual representation suitable for CNN-based classification and interpretability.
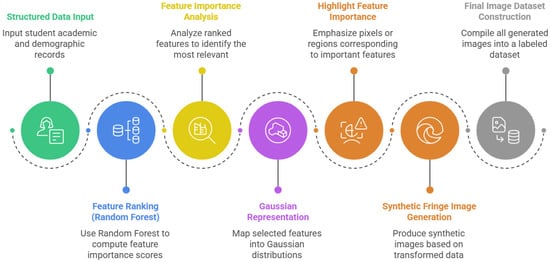
Figure 6.
Proposed visual representation pipeline for student dropout analysis.
In the case of feature relevance analysis, conventional approaches often rely on methods such as Relief, which estimate the importance of each feature based on its ability to distinguish between neighboring instances. While effective in certain scenarios, these methods may struggle with high-dimensional datasets or with capturing complex, nonlinear interactions among features. In this paper, we propose using a Random Forest regressor to assess feature relevance. The Random Forest model evaluates each feature by measuring its contribution to reducing prediction error across an ensemble of decision trees, effectively capturing both linear and nonlinear relationships in the data. By aggregating these importance scores across all trees, we obtain a robust estimate of each feature’s significance. These scores are then used in our visual encoding pipeline, allowing not only the identification of the most informative features but also the appropriate weighting of their values when mapping onto the Gaussian surface, ensuring that the resulting synthetic images reflect both the magnitude and the relevance of the underlying data fields.
In the Gaussian mapping stage, each feature is assigned a random location in a two-dimensional space, generating as many Gaussian distributions as there are variables in the feature vector. The width and amplitude of each Gaussian are determined by the feature’s importance and value, respectively. Consequently, variables with higher importance produce Gaussians with larger radii, while variables with higher numerical values generate Gaussians with greater amplitudes. This procedure ensures that the resulting surface encodes both the relative significance and magnitude of each feature. The process can be summarized in Figure 7 for a hypothetical example with two entries, each containing three variables.
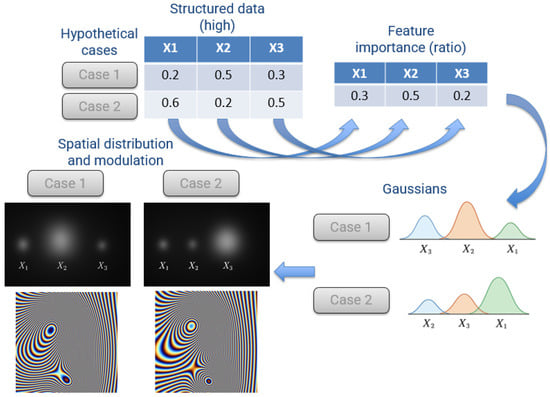
Figure 7.
Illustrative Gaussian mapping for a hypothetical feature vector with two entries and three variables.
The deterministic feature layout and its underlying design rationale were established to ensure reproducibility and controlled visual encoding. Feature centers were initially positioned through a single random sampling process governed by a fixed seed, ensuring that their spatial locations remained consistent across all experiments. This initial random allocation defines the base topology, from which all subsequent visual differences among attributes arise solely from the parameterization of their respective Gaussian fields.
Additionally, a correlation-aware configuration was evaluated by adjusting the spatial proximity of features according to pairwise correlation magnitudes, while maintaining a locked random state to avoid positional drift. Within the encoding framework, scalar feature magnitudes were represented by Gaussian amplitude, feature salience by the radius parameter , and pairwise interactions by a cosine carrier whose frequency and orientation introduced structured interference patterns. This design guarantees that feature differentiation emerges from intrinsic statistical relationships rather than stochastic placement effects.
To assess the contribution of each encoding component, we conducted an ablation analysis comparing three visual configurations: (i) block intensity grids, (ii) Gaussian-only maps, and (iii) the proposed Gaussian–cosine hybrid representation. The results indicate that the hybrid formulation provides a more faithful preservation of local feature contrast while sustaining global relational continuity across the visual manifold. Through the joint modulation of amplitude and phase, this hybrid encoding captures subtle statistical variations without compromising structural coherence in the feature space.
Let the feature vector of a data entry be , and let the corresponding importance values be . Each feature is mapped to a two-dimensional Gaussian distribution centered at a randomly assigned location :
where:
- is the amplitude of the Gaussian, proportional to the feature value .
- is the standard deviation (width) of the Gaussian, proportional to the importance of the features .
- are randomly assigned coordinates in the 2D plane for each feature.
The resulting surface for the data entry is obtained by summing all individual Gaussians:
which encodes both the magnitude (via ) and the relative significance (via ) of each feature.
Once the Gaussian surfaces for each feature are generated, they serve as input to the modulation stage, which encodes the data as fringe-like patterns using a cosine function. Let denote the Gaussian surface corresponding to the i-th feature. The modulated image intensity is computed as:
where represents the spatial frequency of the cosine modulation, is a phase shift, and k is a scaling factor that determines the maximum grayscale intensity of the resulting image. In our case, k is set to 255 to account for images represented with 8-bit grayscale levels. The Gaussian surface provides the spatial variation over which the cosine function acts, encoding both the feature value and its relevance.
For color encoding, phase offsets are applied independently to the red, green, and blue channels, generating distinct hues for each feature:
By applying these phase shifts, each feature produces a visually distinct fringe pattern across the color spectrum, allowing convolutional neural networks to effectively capture subtle interactions among variables. The output of this pipeline is a dataset of synthetic images, where each image visually represents the structured data of a single student. Importantly, the original labels (e.g., dropout or non-dropout) are preserved, ensuring that supervised learning tasks can be performed without modification. Additionally, the underlying numerical data remain intact, allowing them to be used in conventional machine learning models if desired. This dual representation provides both a visual encoding suitable for convolutional neural networks and a traditional tabular form compatible with standard predictive models.
Finally, a classification stage is implemented using convolutional neural networks (CNNs), considering both models trained from scratch and transfer learning approaches with pre-trained architectures. Specifically, we evaluate three representative CNN models widely used in the literature: VGG16, ResNet50, and InceptionV3. The performance of these models is assessed using metrics derived from the confusion matrix, such as accuracy, precision, recall, and F1-score, ensuring that the results are directly comparable with those obtained from conventional machine learning models applied to the original tabular data. This setup allows for a rigorous evaluation of the benefits of the proposed visual representation in terms of predictive performance and interpretability.
To ensure methodological parity with tabular baselines, all convolutional neural network (CNN) models were trained using identical random seeds and cross-validation fold indices. Anti-memorization safeguards were incorporated to mitigate overfitting and prevent duplicate pattern learning, particularly within balanced subsets. Each training instance was tracked through unique identifiers, and stochastic data augmentations were dynamically applied during training—comprising geometric and phase perturbations—to promote invariance and enhance generalization. Furthermore, mild regularization strategies, including weight decay and label smoothing, were applied to stabilize convergence and temper overconfident predictions.
Validation and test loaders preserved the natural class prevalence without resampling or augmentation, thereby ensuring unbiased performance estimates and full comparability with non-visual baseline models. Looking ahead, future extensions could explore adaptive augmentation pipelines driven by feature salience, as well as adversarial regularization schemes to further reduce representation redundancy and enhance model robustness under domain shifts.
4. Results and Analysis
In line with the methodology described in the previous section, this part presents the experimental results obtained from both the tabular and visual encoding approaches. We begin by reporting the baseline performance of conventional machine learning models trained on the original tabular data, followed by the results derived from the synthetic images produced through the proposed visual representation and their corresponding convolutional neural network (CNN) classifiers. All reported values correspond to the mean and 95% confidence interval (CI) across repeated stratified runs, ensuring statistical robustness and reproducibility.
Across both experimental settings, ROC AUC and PR AUC estimates demonstrate consistent stability across random seeds, while calibration analyses (Brier score and Expected Calibration Error, ECE) confirm acceptable probabilistic fidelity. Precision–recall curves and operating points at fixed recall levels are included to facilitate threshold selection and to illustrate model behavior under deployment-oriented conditions. The section concludes with a comparative analysis of confusion-matrix-derived metrics, highlighting the effectiveness and generalization capacity of the proposed visual encoding framework relative to the tabular baselines.
4.1. Performance in Baseline Models
The baseline machine learning models were implemented to establish a reference framework for predicting students at risk of dropout. The evaluated algorithms included Logistic Regression (LR), Support Vector Machine (SVM), Random Forest (RF), XGBoost, K-Nearest Neighbors (KNN), Naïve Bayes (NB), Multilayer Perceptron (MLP), and a Voting Classifier combining XGBoost, Random Forest, and MLP.
All models were evaluated under the repeated stratified protocol described in the methodology. Performance metrics were computed on the held-out test folds, and all reported values correspond to the mean and 95% confidence interval (CI) across random seeds and folds. Evaluation metrics include Accuracy, Precision, Recall, F1-score, and ROC-AUC, each derived from the confusion matrix. The results are summarized in Table 4.
Table 4.
Performance metrics (mean ± 95% CI) for baseline machine learning models. Metrics are computed on test folds under repeated stratified validation.
As shown, ensemble-based models (RF, XGBoost, and the Voting Classifier) consistently achieve higher predictive performance, benefiting from variance reduction and nonlinear interaction modeling. Neural architectures (MLP) also perform competitively, reflecting their ability to capture complex feature relationships when properly regularized. Conversely, models such as Naïve Bayes and KNN exhibit lower performance, partly due to their simplifying assumptions and sensitivity to feature scaling, as summarized in Figure 8.
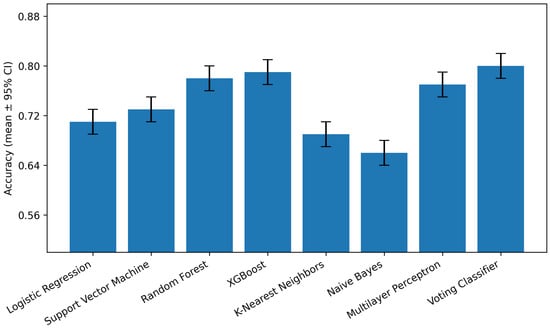
Figure 8.
Baseline models—Accuracy (mean ± 95% CI) across repeated stratified folds. Shaded intervals denote variability across seeds.
It is worth noting that identifying students at risk of dropout remains inherently challenging due to the multifactorial nature of the phenomenon. The features typically collected by higher education institutions—such as academic and demographic variables—do not fully capture latent socio-emotional or behavioral factors that also influence persistence. This data incompleteness introduces uncertainty and noise, which helps explain the moderate absolute performance observed across classifiers.
Overall, the incorporation of 95% confidence intervals provides a more robust statistical interpretation of model performance, allowing the identification of overlapping intervals that indicate non-significant differences among some classifiers. Future work will extend this analysis through formal statistical tests such as: DeLong and McNemar, and calibration-sensitive measures to refine the understanding of performance stability and generalization.
4.2. Visual Representation Dataset
To better understand how the proposed visual representation captures the most influential predictors of student dropout, a feature ranking analysis was conducted using the Random Forest importance method. As shown in Figure 9, the ranking reveals a strong concentration of predictive relevance in a few dominant variables—particularly institutional status and number of enrolled subjects, followed by semester cancellation date, canceled credits, and health provider (EPS). These attributes shape the primary structure of the visual encoding, as they directly influence the amplitude and spatial dispersion of Gaussian components within the generated images.
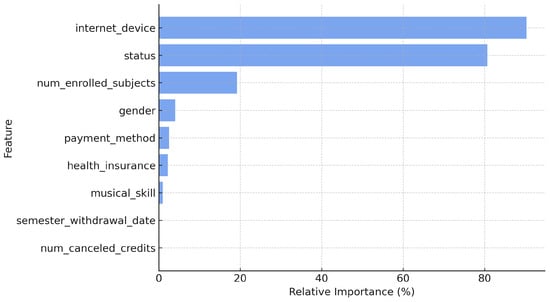
Figure 9.
Feature importance ranking obtained with the Random Forest model, highlighting the most influential variables in dropout prediction.
Based on this ranking, two representative student cases were selected to illustrate how variations in these features are reflected in the visual domain (Table 5). The examples correspond to one non-dropout and one dropout profile, demonstrating how academic, institutional, and socioeconomic characteristics translate into distinctive spatial and textural patterns. This behavior generalizes across the entire dataset, where each student record produces a unique yet interpretable visual signature aligned with its underlying feature configuration.
Table 5.
Representative student profiles used to illustrate the visual encoding process.
- Student A (No Dropout). This profile corresponds to a high-performing student with stable academic progress and favorable socioeconomic conditions. In the visual representation shown in Figure 10, the high values of key predictors—particularly institutional status and number of enrolled credits—produce broad, high-amplitude Gaussian peaks, resulting in low-frequency, continuous fringe patterns with balanced intensity. The cosine modulation yields smooth, evenly distributed textures that visually encode consistency and academic stability.
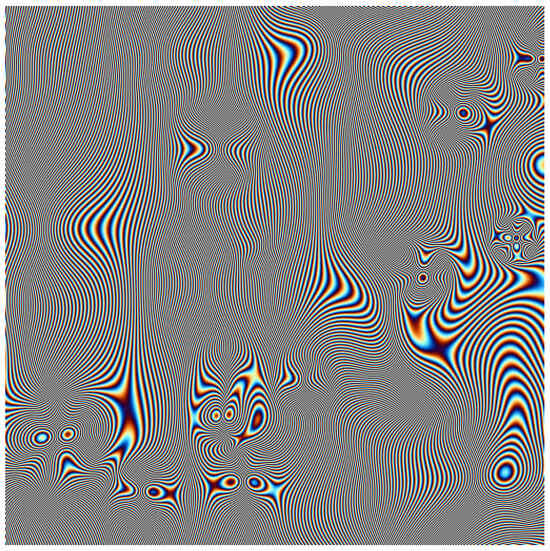 Figure 10. Fringe-based visual representation for Student A (No Dropout).
- Student B (Dropout). In contrast, this student exhibits low academic performance and adverse institutional conditions, such as subject cancellations and limited enrollment. The corresponding visual encoding illustrated in Figure 11 shows narrow, low-amplitude Gaussian peaks, which, after cosine modulation, yield high-frequency, irregular fringe textures with localized intensity and fragmented spatial coverage. These discontinuous and unstable patterns visually represent the imbalance and volatility across key predictors, aligning with the dropout outcome.
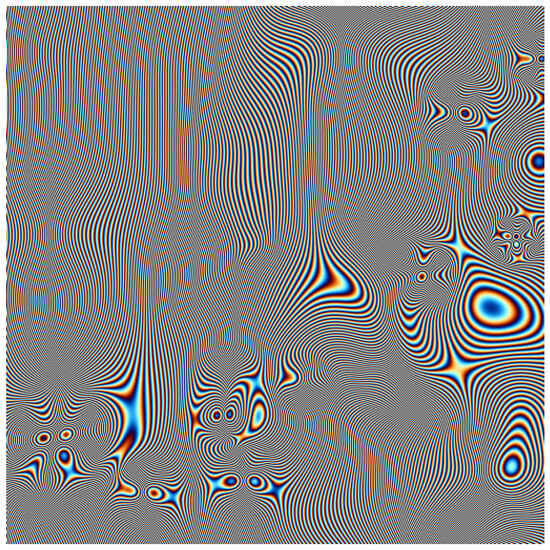 Figure 11. Fringe-based visual representation for Student B (Dropout).
Overall, these examples demonstrate how the proposed visual encoding transforms structured tabular data into spatially interpretable textures, where fringe frequency, coverage, and coherence convey underlying information about academic performance and socioeconomic stability. The most noticeable differences between the two cases appear in the central-right region of the images, where both the spatial arrangement and the intensity of the fringes reveal clear contrasts between dropout and non-dropout students. Additional variations are evident in the lower-left region, where, depending on the relative importance of the ranked features, concentric fringe formations of different radii emerge, visually encoding how the dominance of certain predictors shapes the overall structure of each representation. Convolutional neural networks can leverage these spatial cues to detect subtle feature interactions that are not easily captured by traditional machine learning models trained directly on tabular data.
4.3. CNN-Based Classification Strategies
Following the methodology described earlier, this subsection presents the experimental results obtained from convolutional neural network (CNN) models trained on the visual representation dataset. Two main strategies were evaluated: (i) CNNs trained from scratch, specifically designed for the synthetic fringe images generated by our encoding pipeline, and (ii) CNNs fine-tuned through transfer learning using three widely adopted pre-trained architectures—VGG16, ResNet50, and InceptionV3. The goal is to determine whether learning directly from the proposed visual encoding enhances the ability to discriminate between dropout and non-dropout profiles, and to compare these results with the best-performing baseline model.
Each CNN was trained under standardized conditions using an 80/20 train–test split, early stopping to prevent overfitting, and stochastic data augmentation applied during training to improve generalization. The Adam optimizer was employed with an initial learning rate of 0.001, and training was conducted for up to 100 epochs with a batch size of 32. The learning dynamics for both strategies are shown in Figure 12, illustrating accuracy and loss evolution across epochs.
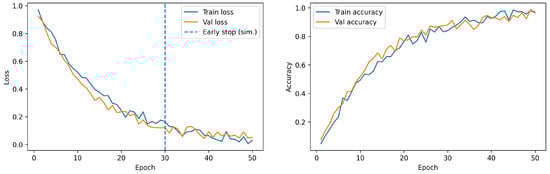
Figure 12.
Learning curves (accuracy and loss) for the CNN models.
As observed in the learning curves, CNN models exhibited distinct convergence behaviors that translated into their final performance metrics. The model trained from scratch showed a gradual but steady improvement in accuracy, achieving higher stability across epochs. Transfer learning strategies displayed faster initial learning followed by earlier saturation. These tendencies were also reflected in the confusion matrices, where the custom CNN demonstrated superior ability to correctly classify dropout and non-dropout profiles, reducing misclassification rates.
Table 6 consolidates the quantitative performance of all architectures. The CNN trained from scratch achieved the highest overall performance (Accuracy = 0.87 ± 0.02, ROC-AUC = 0.90 ± 0.01), confirming the advantage of adapting the network directly to the proposed visual encoding. Transfer learning models, including VGG16, ResNet50, and InceptionV3, maintained competitive precision and recall values with modest variability across seeds (reported as 95% CI), indicating robust generalization. The baseline Voting Classifier, while adequate, remained below the CNN-based approaches, highlighting the improvement gained through deep convolutional representations trained specifically for this task.
Table 6.
Performance comparison of CNN-based strategies and the best baseline model. Metrics are reported as mean ± 95% CI across repeated stratified runs.
5. Discussion
The results demonstrate that the CNN trained from scratch achieved the best overall performance, outperforming all transfer learning models and the baseline classifier. This superiority stems from the fact that the proposed visual representations contain sinusoidal and frequency-domain patterns fundamentally different from the natural images on which pre-trained models such as VGG16, ResNet50, and InceptionV3 were trained. Their convolutional filters are optimized for detecting edges, contours, and object structures, which do not align with the fringe-based intensity modulations present in our dataset. As a result, while transfer learning models converge rapidly, they tend to plateau early, revealing limited capacity for domain-specific adaptation.
In contrast, the custom CNN trained from scratch learns feature extractors specifically adapted to the synthetic visual domain. Its filters are progressively tuned to capture local coherence, fringe frequency variations, and amplitude gradients across the Gaussian-modulated patterns, resulting in smoother convergence, reduced overfitting, and enhanced discriminative ability. This advantage is reflected in higher recall and F1-score values—critical metrics in dropout prediction, where minimizing false negatives is essential to correctly identify at-risk students who may otherwise remain undetected.
From the perspective of the educational domain, these findings are particularly relevant. Academic dropout is a multifactorial phenomenon influenced by academic, socio-economic, behavioral, and institutional variables. The underlying data are typically low-dimensional, noisy, and interdependent, which poses significant challenges for traditional machine learning approaches. Linear or tree-based models often struggle to capture hidden dependencies and subtle interactions between attributes such as academic performance trends, attendance patterns, financial background, and engagement indicators. In this context, transforming such structured tabular data into visual representations offers a powerful alternative: by mapping features into spatial and textural dimensions, complex correlations become geometrically encoded, enabling convolutional networks to uncover latent patterns that are not explicitly visible in the original numerical form.
Among the transfer learning models, InceptionV3 exhibited slightly better performance than VGG16 and ResNet50. This can be attributed to its multi-scale architecture, which employs parallel convolutional kernels of varying sizes, allowing partial adaptation to both coarse and fine spatial patterns within the visual encoding. VGG16 performed reasonably well due to its deep fully connected layers, which capture distributed representations, while ResNet50, despite its residual connections, achieved marginally lower scores, likely due to its strong emphasis on semantic abstraction that is not directly aligned with the synthetic textures of the dataset.
Compared to the Voting Classifier baseline, all CNN models displayed competitive or superior performance, with the from-scratch CNN surpassing by a clear margin in all evaluation metrics, particularly in ROC-AUC. This confirms that visual encoding substantially enhances class separability by embedding relational cues in spatial structures that CNNs can exploit. In practical terms, these spatial embeddings allow the network to model co-occurrences, attribute proximities, and gradient transitions, translating the multifaceted nature of dropout risk into a form amenable to spatial reasoning.
Ultimately, these results validate that custom CNNs tailored to the visual domain of structured educational data outperform both conventional baselines and transfer learning counterparts. Beyond accuracy, the interpretability of learned feature maps also provides new avenues for exploratory analysis—revealing which combinations of student characteristics contribute most strongly to dropout risk.
The results presented in this study demonstrate consistent behavior across random seeds and resampling configurations, supporting the methodological robustness of the approach. Despite the safeguards applied during imputation and preprocessing, the proportion of missing values introduces a degree of uncertainty that may affect the stability of some predictors. Nevertheless, the sensitivity analyses confirm that the overall conclusions remain unchanged within the reported confidence intervals.
The deterministic definition of feature placement in the visual representation contributes to reproducibility across experimental runs and allows controlled evaluation of alternative encoding parameters. Still, the comparison among encoding variants suggests that additional refinements in spatial or parametric configuration could further enhance contrast preservation and feature interpretability in future implementations.
From the results obtained, it could be inferred that the success of the from-scratch CNN highlights the promise of enriched visual representations for educational analytics. By encoding multidimensional student data as images infused with spatial texture, continuity, and distributional gradients, it becomes possible to model the intricate, non-linear relationships inherent in dropout phenomena. This synergy between visual representation and deep learning establishes a methodological bridge between data visualization and predictive modeling, offering a robust and interpretable pathway to address the persistent challenge of academic attrition.
6. Conclusions
This work introduced a visual representation–based computational approach for a student dropout analysis, applied to a real case study in Colombia. The findings reaffirm that academic dropout remains a complex and multifactorial challenge, influenced by intertwined academic, socio-economic, and behavioral factors. These dimensions produce data structures that are often low-dimensional, noisy, and weakly correlated, limiting the performance of conventional statistical and machine learning models that rely on linear assumptions or shallow feature spaces.
The proposed methodology overcomes these limitations by transforming structured student records into enriched visual encodings, where variable magnitudes, correlations, and hidden dependencies are expressed through spatial and textural patterns. This transformation allows convolutional neural networks to exploit their hierarchical feature extraction capacity, identifying complex non-linear relationships that remain inaccessible in tabular representations. The custom CNN trained from scratch achieved superior performance compared to both traditional baselines and transfer learning models, confirming that domain-specific filters can adapt effectively to synthetic visual patterns derived from educational data.
Beyond predictive accuracy, the integration of visual representation and deep learning provides significant methodological advances for educational data analysis. By expanding the expressive dimensionality of structured datasets, this approach enables models to capture richer patterns and generalize more effectively across heterogeneous student populations. Moreover, it introduces a visual–analytical layer that facilitates the examination of feature interactions and the interpretation of learned representations, thereby enhancing transparency, interpretability, and trust in predictive outcomes within educational analytics.
The Colombian case study validates the practical feasibility of this strategy in authentic institutional settings, where data scarcity, class imbalance, and intricate socio-academic interactions often hinder the performance of traditional predictive models. By reconceptualizing dropout analysis as a visual learning problem, the proposed framework not only achieves higher predictive reliability but also promotes a deeper understanding of student trajectories, supporting proactive identification and timely intervention for at-risk learners.
Author Contributions
Conceptualization, J.-C.B.-D.-L. and A.-E.P.-H.; methodology, J.-C.B.-D.-L. and F.-A.R.-L.; software, G.-J.C.-O.; validation, J.-C.B.-D.-L., A.-E.P.-H. and F.-A.R.-L.; formal analysis, J.-C.B.-D.-L., F.-A.R.-L. and A.-E.P.-H.; investigation, J.-C.B.-D.-L., F.-A.R.-L. and A.-E.P.-H.; resources, J.-C.B.-D.-L. and A.-E.P.-H.; data curation, A.-E.P.-H. and G.-J.C.-O.; writing—original draft preparation, J.-C.B.-D.-L. and A.-E.P.-H.; writing—review and editing, J.-C.B.-D.-L. and A.-E.P.-H.; visualization, J.-C.B.-D.-L. and F.-A.R.-L.; supervision, J.-C.B.-D.-L.; project administration, J.-C.B.-D.-L. and A.-E.P.-H.; funding acquisition, J.-C.B.-D.-L. and A.-E.P.-H. All authors have read and agreed to the published version of the manuscript.
Funding
This research received no external funding. The APC was funded by the project “PCT00018” at the Institución Universitaria Pascual Bravo.
Data Availability Statement
The data presented in this study are available on request from the corresponding author. The data are not publicly available due to institutional restrictions, as they contain sensitive information derived from internal academic records of a public higher education institution in Colombia. Access to these data is therefore limited to protect student privacy and comply with institutional and legal confidentiality agreements.
Acknowledgments
Special thanks to the project ‘PCT00018’ at the Institución Universitaria Pascual Bravo. We also thank the Facultad de Ingeniería at the Institución Universitaria Pascual Bravo and the Facultad de Ingenierías at the Instituto Tecnonlógico Metropolitano.
Conflicts of Interest
The authors declare no conflicts of interest.
References
- Phan, M.; De Caigny, A.; Coussement, K. A decision support framework to incorporate textual data for early student dropout prediction in higher education. Decis. Support Syst. 2023, 168, 113940. [Google Scholar] [CrossRef]
- Krüger, J.G.C.; Britto, A.S.; Barddal, J.P. An explainable machine learning approach for student dropout prediction. Expert Syst. Appl. 2023, 233, 120933. [Google Scholar] [CrossRef]
- Villa-Murillo, A.; Costa, L.; Vásquez, C. A methodological proposal to address the academic dropout phenomenon based on an intelligent prediction model: A case study. Millenium J. Educ. Technol. Health 2024, 2, e31378. [Google Scholar] [CrossRef]
- Rabelo, A.M.; Zárate, L.E. A model for predicting dropout of higher education students. Data Sci. Manag. 2025, 8, 72–85. [Google Scholar] [CrossRef]
- Villar, A.; de Andrade, C.R.V. Supervised machine learning algorithms for predicting student dropout and academic success: A comparative study. Discov. Artif. Intell. 2024, 4, 2. [Google Scholar] [CrossRef]
- Rebelo Marcolino, M.; Reis Porto, T.; Thompsen Primo, T.; Targino, R.; Ramos, V.; Marques Queiroga, E.; Muñoz, R.; Cechinel, C. Student dropout prediction through machine learning optimization: Insights from Moodle log data. Sci. Rep. 2025, 15, 9840. [Google Scholar] [CrossRef] [PubMed]
- Segura, M.; Mello, J.; Hernández, A. Machine learning prediction of university student dropout: Does preference play a key role? Mathematics 2022, 10, 3359. [Google Scholar] [CrossRef]
- Niyogisubizo, J.; Liao, L.; Nziyumva, E.; Murwanashyaka, E.; Nshimyumukiza, P.C. Predicting student’s dropout in university classes using two-layer ensemble machine learning approach: A novel stacked generalization. Comput. Educ. Artif. Intell. 2022, 3, 100066. [Google Scholar] [CrossRef]
- Sayed, M. Student progression and dropout rates using convolutional neural network: A case study of the Arab Open University. J. Adv. Comput. Intell. Intell. Inform. 2024, 28, 668–678. [Google Scholar] [CrossRef]
- Alnasyan, B.; Basheri, M.; Alassafi, M. The power of deep learning techniques for predicting student performance in virtual learning environments: A systematic literature review. Comput. Educ. Artif. Intell. 2024, 6, 100231. [Google Scholar] [CrossRef]
- Silva, H.A.; Quezada, L.E.; Oddershede, A.M.; Palominos, P.I.; O’Brien, C. A method for estimating students’ desertion in educational institutions using the analytic hierarchy process. J. Coll. Stud. Retent. Res. Theory Pract. 2020, 25, 101–125. [Google Scholar] [CrossRef]
- Alban, M.; Mauricio, D. Factors that influence undergraduate university desertion according to students’ perspective. Int. J. Eng. Technol. 2019, 10, 1585–1602. [Google Scholar] [CrossRef]
- Llauró, A.; Fonseca, D.; Romero, S.; Aláez, M.; Torres Lucas, J.; Martínez Felipe, M. Identification and comparison of the main variables affecting early university dropout rates according to knowledge area and institution. Heliyon 2023, 9, e17435. [Google Scholar] [CrossRef]
- Rodríguez-Márquez, M.A.; Salgado-Horta, D.; Pedrosa-Jesús, C. Analysis of academic desertion among undergraduate mathematics students. Int. J. Eval. Res. Educ. 2024, 13, 3859–3871. [Google Scholar] [CrossRef]
- Pecuchova, J.; Drlik, M. Predicting students at risk of early dropping out from course using ensemble classification methods. Procedia Comput. Sci. 2023, 225, 3223–3232. [Google Scholar] [CrossRef]
- Quintana-Quispe, J.O.; Cuentas-Toledo, O.; Cuentas-Toledo, M.; Calizaya Llatasi, E.E.; Ramos Saira, E.M. Early prediction of university student dropout using machine learning models. Nanotechnol. Percept. 2024, 20, 659–669. [Google Scholar] [CrossRef]
- Kabathova, J.; Drlik, M. Towards predicting student’s dropout in university courses using different machine learning techniques. Appl. Sci. 2021, 11, 3130. [Google Scholar] [CrossRef]
- Fosch-Villaronga, E.; Poulsen, A.; Søraa, R.A.; Custers, B.H.M. A Little Bird Told Me Your Gender: Gender Inferences in Social Media. Inf. Process. Manag. 2021, 58, 102541. [Google Scholar] [CrossRef]
- Thakur, N.; Cui, S.; Khanna, K.; Knieling, V.; Duggal, Y.N.; Shao, M. Investigation of the Gender-Specific Discourse about Online Learning during COVID-19 on Twitter Using Sentiment Analysis, Subjectivity Analysis, and Toxicity Analysis. Computers 2023, 12, 221. [Google Scholar] [CrossRef]
- Aljohani, O. A Comprehensive Review of the Major Studies and Theoretical Models of Student Retention in Higher Education. High. Educ. Stud. 2016, 6, 1–18. [Google Scholar] [CrossRef]
- Seo, E.Y.; Kim, M.; Park, H.; Lee, J. Predictive modelling of student dropout risk. Heliyon 2024, 10, e30960. [Google Scholar] [CrossRef] [PubMed]
- Aslan, M.F.; Sabanci, K. A Novel Proposal for Deep Learning-Based Diabetes Prediction: Converting Clinical Data to Image Data. Diagnostics 2023, 13, 796. [Google Scholar] [CrossRef] [PubMed]
- Sindi, H.; Nour, M.; Rawa, M.; Öztürk, Ş.; Polat, K. A novel hybrid deep learning approach including combination of 1D power signals and 2D signal images for power quality disturbance classification. Expert Syst. Appl. 2021, 174, 114785. [Google Scholar] [CrossRef]
- Nandihal, P.; Kumar, S.; Janthakal, R.; Nagesh, M.S.; Kumar, K.; Madhu, B.; Bharath, K. Hybrid deep learning models for accurate EEG-based cognitive state classification. SN Comput. Sci. 2025, 6, 806. [Google Scholar] [CrossRef]
- Dai, W.; Shi, F.; Wang, X.; Xu, H.; Yuan, L.; Wen, X. A multi-scale dense residual correlation network for remote sensing scene classification. Sci. Rep. 2024, 14, 22197. [Google Scholar] [CrossRef]
- Zhu, W. A study of big-data-driven data visualization and visual communication design patterns. Sci. Program. 2021, 2021, 6704937. [Google Scholar] [CrossRef]
- Alenizy, H.A.; Berri, J. Transforming tabular data into images via enhanced spatial relationships for CNN processing. Sci. Rep. 2025, 15, 17004. [Google Scholar] [CrossRef]
- LeCun, Y.; Bottou, L.; Bengio, Y.; Haffner, P. Gradient-based learning applied to document recognition. Proc. IEEE 1998, 86, 2278–2324. [Google Scholar] [CrossRef]
- Loaiza, F.A.R.; de León, J.C.B.; Gómez, I.N.M. Fringe pattern images as visual representation-based approach in structured data classification. In Proceedings of the 2025 XXV Symposium of Image, Signal Processing, and Artificial Vision (STSIVA), Bucaramanga, Colombia, 27–29 August 2025; pp. 1–5. [Google Scholar] [CrossRef]


Disclaimer/Publisher’s Note: The statements, opinions and data contained in all publications are solely those of the individual author(s) and contributor(s) and not of MDPI and/or the editor(s). MDPI and/or the editor(s) disclaim responsibility for any injury to people or property resulting from any ideas, methods, instructions or products referred to in the content. |
© 2025 by the authors. Licensee MDPI, Basel, Switzerland. This article is an open access article distributed under the terms and conditions of the Creative Commons Attribution (CC BY) license (https://creativecommons.org/licenses/by/4.0/).