You are currently viewing a new version of our website. To view the old version click .
Information
  • Article
  • Open Access

10 November 2025

Toward Robust Human Pose Estimation Under Real-World Image Degradations and Restoration Scenarios

,
,
and
1
College of Computers and Informatics, Zagazig University, Zagazig 44519, Egypt
2
Department of Computer Science, Faculty of Computers and Information Technology, Future University in Egypt, New Cairo 11835, Egypt
3
College of Computing and Information Sciences, University of Technology and Applied Sciences, Ibri 516, Oman
*
Author to whom correspondence should be addressed.
This article belongs to the Special Issue Artificial Intelligence for Signal, Image and Video Processing

Abstract

Human Pose Estimation (HPE) models have varied applications and represent a cutting-edge branch of study, whose systems such as MediaPipe (MP), OpenPose (OP), and AlphaPose (ALP) show marked success. One of these areas, however, that is inadequately researched is the impact of image degradation on the accuracy of HPE models. Image degradation refers to images whose visual quality has been purposefully degraded by means of techniques, such as brightness adjustments (which can lead to an increase or a decrease in the intensity levels), geometric rotations, or resolution downscaling. The study of how these types of degradation impact the performance functionality of HPE models is an under-researched domaina that is a virtually unexplored area. In addition, current methods of the efficacy of existing image restoration techniques have not been rigorously evaluated and improving degraded images to a high quality has not been well examined in relation to improving HPE models. In this study, we explicitly clearly demonstrate a decline in the precision of the HPE model when image quality is degraded. Our qualitative and quantitative measurements identify a wide difference in performance in identifying landmarks as images undergo changes in brightness, rotation, or reductions in resolution. Additionally, we have tested a variety of existing image enhancement methods in an attempt to enhance their capability in restoring low-quality images, hence supporting improved functionality of HPE. Interestingly, for rotated images, using Pillow of OpenCV improves landmark recognition precision drastically, nearly restoring it to levels we see in high-quality images. In instances of brightness variation and in low-quality images, however, existing methods of enhancement fail to yield the improvements anticipated, highlighting a large direction of study that warrants further investigation and calls for additional research. In this regard, we proposed a wide-ranging system for classifying different types of image degradation systematically and for selecting appropriate algorithms for image restoration, in an effort to restore image quality. A key finding is that in a related study of current methods, the Tuned RotNet model achieves 92.04% accuracy, significantly outperforming the baseline model and surpassing the official RotNet model in predicting rotation degree of images, where the accuracy of official RotNet and Tuned RotNet classifiers were 61.59% and 92.04%, respectively. Furthermore, in an effort to facilitate future research and make it easier for other studies, we provide a new dataset of reference images and corresponding degenerated images, addressing a notable gap in controlled comparative studies, since currently there is a lack of controlled comparatives.

1. Introduction

HPE is a core technology with revolutionary applications in a wide range of fields including healthcare, sports [], security and virtual reality [,,]. Using HPE, we can optimize how we monitor physical therapy, optimize athlete performance, and ensure public safety. As HPE provides the ability to detect and preciously analyze human movements. For example, doctors can use it remotely to monitor the rehabilitation progress of patients, help athletes optimize their exercises, and detect suspicious activities in strength security systems. However, any minutetiny error in pose detection could have serious consequences, such as injuries, delayed recovery, or security breaches. HPE, as a foundation base for human-centric applications, has huge potential to save time, reduce effort, and deliver tailor-made solutions; hence, it is one of the most important enablers of precision and efficiency in today’s technology-driven world.
Image quality has always been a significant difficulty for all HPE systems in realistic surroundings. Most training datasets are high resolution, such as Max Planck Institute for Informatics (MPII) [] and Frames Labeled in Cinema (FLIC) [], but in practical applications, there are many low resolution, blurred, and environmentally degraded images due to fog, low light exposure, or rainstorms. Such low-quality images significantly reduce the accuracy of pose detection because the HPE model cannot find some small-scale key human features. Poor image quality would generally introduce critical failures lead to some serious issues: false detection and a general loss of precision, even with the most advanced algorithms. The examples given above indicate several critical fields where optimal good results are expected: health, sports, and security applications. Most current models are not robust enough to handle such different image quality problems; therefore, improving reliability and generalizing the HPE system in various real environments remains a formidable challenge but is still a challenging goal worth trying. Of course, making sure these image quality issues are overcome is what makes an HPE technology effective for practical use. In addition, several recent studies investigated at deep learning approaches applied to image-based challenges that are beyond the scope of this study. The authors in [,] developed methodologies that help to understand model robustness and performance in visual data analysis, offering a broader context for the future of our research.
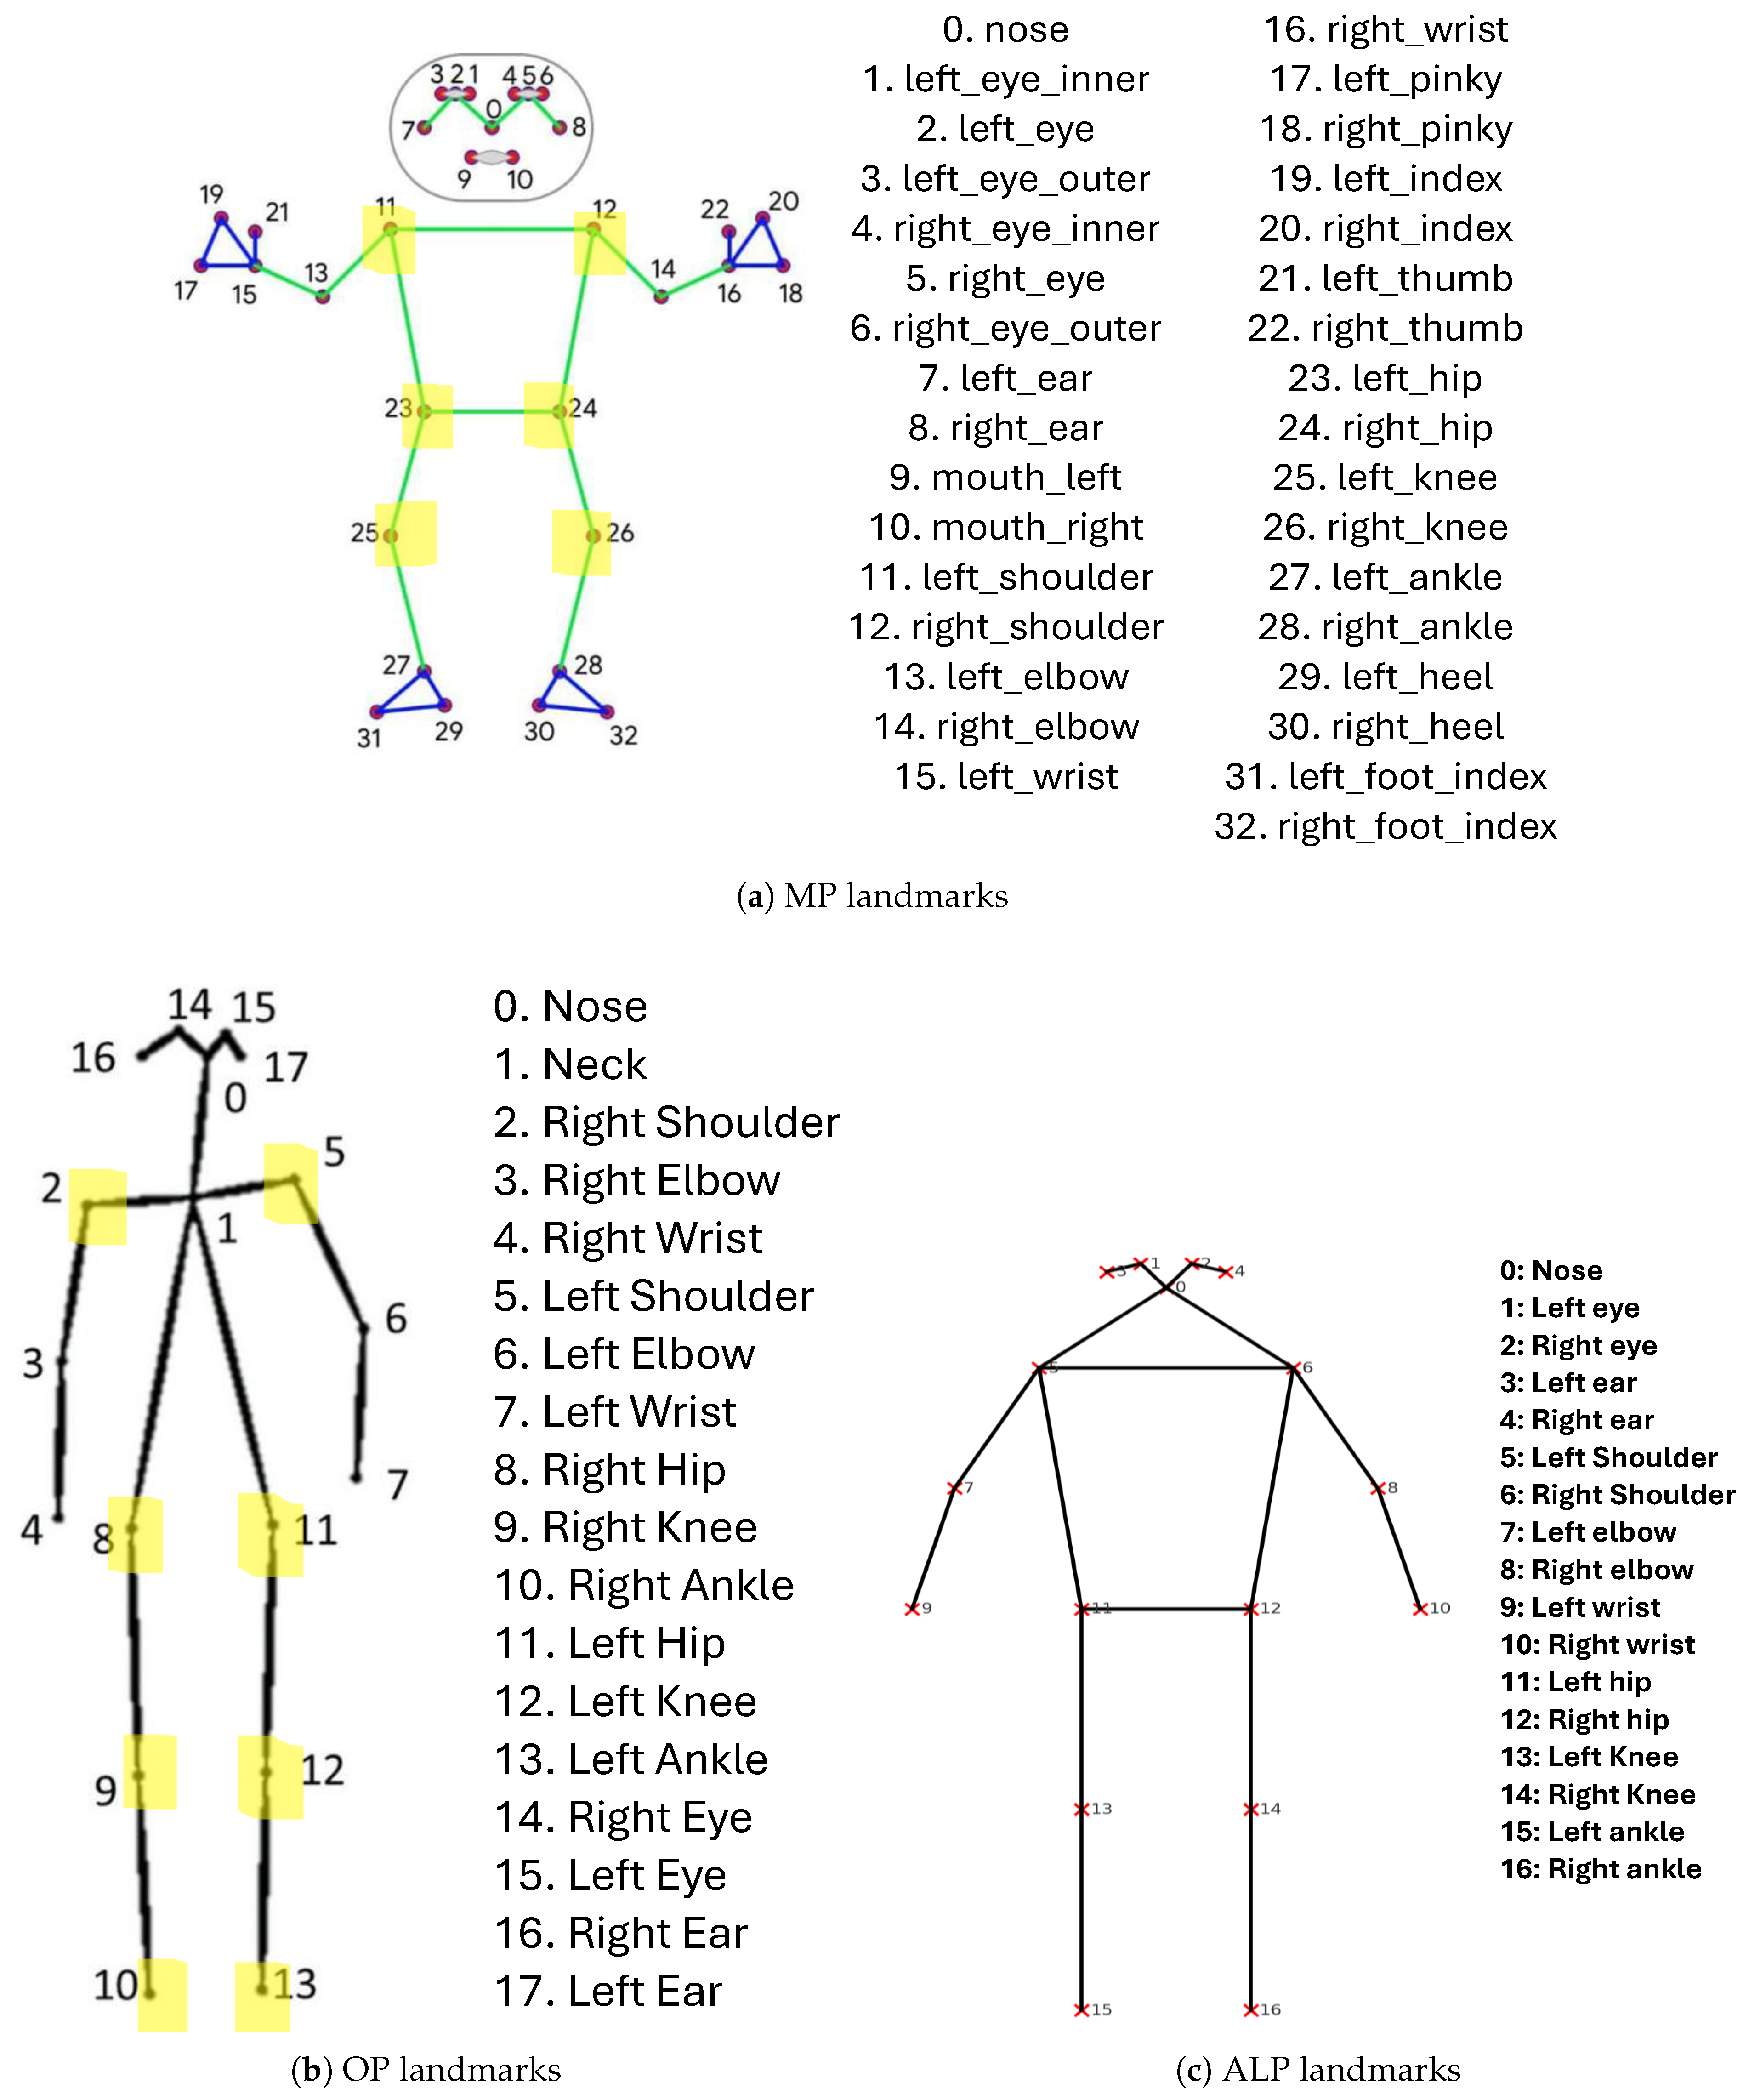
MediaPipe (MP) [,,] and OpenPose (OP) [,] are two open-source frameworks that are commonly used for real-time pose estimation and body tracking, exhibiting showing different strengths in various applications. While MP has been engineered allowed for the lightweight and efficient tracking of 33 body keypoints, exhibiting high performanceproving very performant under hard conditions such as partial occlusion and changing lighting conditions, OP has been developed by the Carnegie Mellon Perceptual Computing Lab and focused on high-precision multi-person two-dimensional pose estimation. Estimation is conducted on 18 body keypoints, including face features and hands. Both have found extensive applications in fitness, health, sport analytics, gaming, animation, and human–computer interaction owing to their computational efficiency and cross-platform adaptability due to their time efficiency and wide range of platform adaptability in harsh environmental conditions [,].
However, for recent work, the AlphaPose (ALP) model as the authors described in [] is an end-to-end full system to estimate multi-person pose and track and estimate 136 body, face, hand, and foot landmarks. Employing a top-down paradigm, the system improves detection and pose refinement by applying the state-of-the-art feature of Symmetric Integral Keypoint Regression (SIKR) to mitigate remove the imperfection of heatmap quantization, Parametric Pose Non-Maximum Suppression (NMS) to mitigate remove redundant poses, and pose-sensitive identity embedding to support built-in tracking. These limitations in body annotations are offset by training on the Halpe–Full Body data, and additional training on a wide range of additional datasets, including COCO, COCO-WholeBody, PoseTrack, 300WFace, FreiHand, and InterHand. The system has been seen to achieve 48.4 mean Average Precision (mAP) on Halpe-FullBody, 57.7 mAP on COCO-WholeBody, and washout tracking results of 66.4 mAP and 59.0 MOTA on PoseTrack and therefore offers new state-of-the-art performance, and also it provides accuracy and efficiency to support applications that require large scale human analysis.
HPE is an crucial point in research, with diverse applications in various disciplines. In spite of having several models and tools for HPE, two models, which are MP and OP, stand apart for their robustness and flexibility. Still, though such models have found extensive applications in various ranges, extensive quantitative and qualitative studies on the effects of degradations on HPE models’ performance have remained considerably rare.
Images that have poor quality defined by either low resolution, variability in brightness, or rotation at multiple angles pose a considerable challenge to models to predict human posture. In addition, the lack of a dataset that combines low- and high-quality images makes a systematic evaluation of how degradations in images affect the performance of models challenging.
To address such a shortage, we suggest proposed performing an evaluation to identify whether HPE models are effective in the case of degraded images. The evaluation to be conducted in our work will be preparing an innovative dataset of compromised images to provide better evaluation. In addition, our goal is analyzing how different types of degradations affect HPE models’ behavior. Having identified the type of degradation, our approach will subject such images to standard restoration and analyze to what extent HPE models’ behavior is benefited by such restored images. An integral component of our work is comparing HPE models’ behavior on compromised images against their behavior on subsequently corrected images, in order to assess whether such mechanisms of image improvement hold.
This work treats the challenge of a unclear images, a fact that has been rarely discovered in the literature, mainly dealing with high-quality images. Here, we present three contributions:
1.
A new dataset is created that contains a set of filtered versions of the original images in the MPII dataset. This makes up for an important gap in the currently available datasets, as no dataset addressing these issues has ever been compiled.
2.
We propose an unclear image detection and classification framework that achieves better results compared to the state-of-the-art in these specific tasks by employing RotNet as one of the central classifiers.
3.
We present an image restoration process to help enhance and reverse the degraded images to their original quality before feeding them into the HPE model for better pose detection accuracy. Together, these contributions improve the effectiveness and reliability of HPE systems in unconstrained real-world conditions.
The remainder of this paper is organized as follows. Section 2 explores the relevant literature, focusing on important achievements and concerns concerning this field. Section 3 covers the suggested proposed methodology, including the preparation of the dataset, the design of the framework, and the procedures applied. Section 4 contains the experiment results, complemented by a detailed analysis of image degradation. Section 5 discusses the findings, addresses limitations, and potential areas for improvement. Finally, Section 6 summarizes the paper and recommends areas for future research.

3. Methodology

3.1. Overview

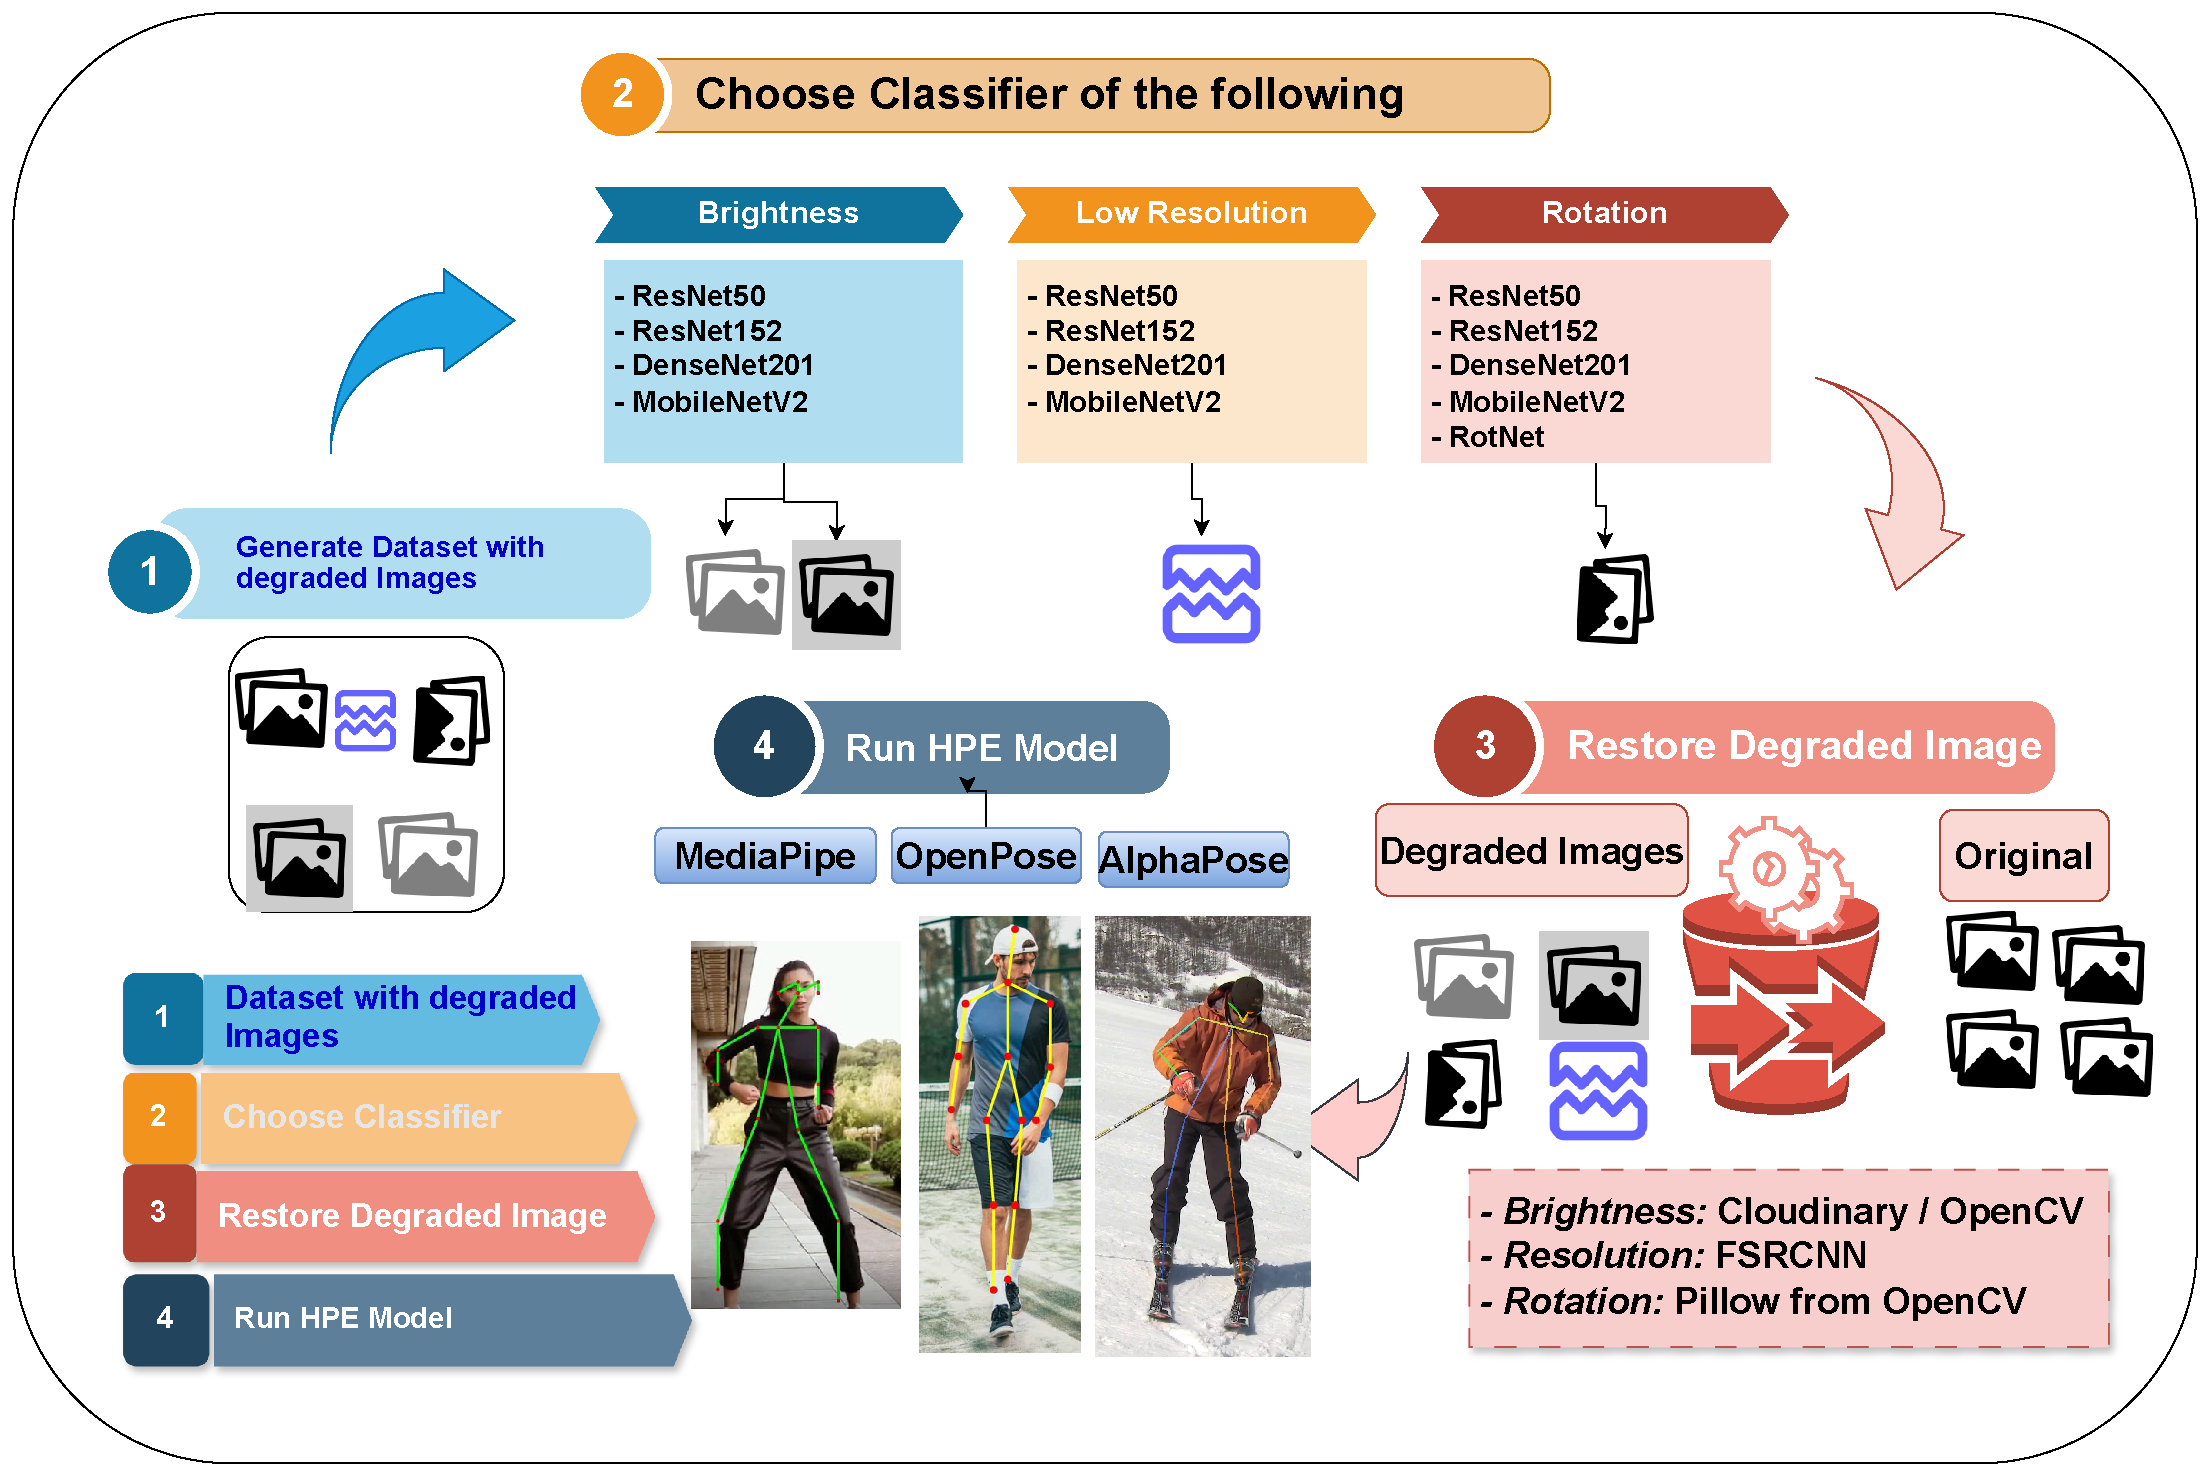
Figure 2 shows the proposed pipeline utilized in this study. The first step was to create a dataset of degraded images, which will constitute serve as the foundation for the next phases. Second, several models were constructed to categorize each degraded image and assign it to the appropriate class. The classification results were used to choose a restoration algorithm based on the type of image that was degraded. The chosen algorithm was then used to restore the images back to their original state. Finally, the HPE model had been applied to the restored images, allowing for further analysis. The process started with the creation of a dataset, which is then used to process the rest of the images. Following classification, the appropriate restoration algorithm was chosen for each image. Then the pictures were repaired within the appropriate categories. The HPE models were then utilized to evaluate the recovered images. All of these steps will be discussed in more detail in the following sections.
Figure 2. The proposed full pipeline of HPE architecture.

3.2. Dataset Preparation

The MPII dataset [] for single-person pose estimation includes 25,000 images, of which 15,000 were used for training, 3000 for validation, and 7000 for testing. These images were taken from YouTube videos, covering 410 different activities of humans, and manually annotated up to 16 body joints. However, since most of the generally used datasets do not contain degraded images, we modified the MPII dataset into a new one that will contain such images. Specifically, we will focus our attention on the generation of low-resolution images, rotation at 90 , 180 , and 270 , and brightness variation: increasing brightness by 80, 90, and 100 and decreasing brightness by 100 , 110 , and 120 . Initially, a set of 4000 original images was used that can be reused several times in generating their variants through the application of various filtersowing to applied filters. As can be seen from Figure 3, each class created will correspond to a concrete type of degradation. The result is a more diverse dataset with variations in image quality for better model robustness.
Figure 3. The main steps of the proposed dataset generation to reduce the images quality.
Image degradation methods include:
1.
Resolution Reduction Procedure: The algorithm was used to transform low-resolution images by using a one reduction percentage of the following 66.7%, 80%, 87.5%, or 90% to change image resolution. It is used the class image from the PIL library. The algorithm was applied by firstly calculating the target size based on the chosen reduction percentage and using nearest-neighbor interpolation to reduce image size. To reverse the resized image to its original size, bilinear interpolation was used to smooth transitions and maintain superior greater detail preservation. The above methodology ensured low-resolution images preserved image quality even when reduced in size. The algorithm processes all images in a given input directory sequentially, applying those methods to each image and then writing the results into an output directory, thereby facilitating efficient batch processingthus enabling efficient batch processing as well as storage.
2.
Brightness Adjustment Algorithm: The process used to adjust brightness changes illumination levels of images by two primary processes, namely, increasing and decreasing level of brightness. The process uses the convertScaleAbs function of the OpenCV library to apply these changes. Scaling factors of 80, 90, and 100 were used to enhance brightness, while −100, −110, and −120 were used to reduce brightness, resulting in values ranging from 0 to −255. The first step in this process was to convert each image to HSV color space, where hue, saturation, and value are separated components. The brightness was adjusted by changing the value channel in accordance with specified brightness levels. The image was then restored to its original BGR format. The conversion to HSV space was important because it enabled for modest brightness adjustments without affecting color hue and saturation quality. Finally, the technique generated a balanced dataset with varying brightness levels, which may be used for subsequent analysis or model training.
3.
Rotation Algorithm: This approach proceeded by applying image rotations with an affine transformation matrix, which was obtained based on the image’s center and a selected rotation angle from 0°, 90°, 180°, and 270°. To reduce image cropping during rotation, the method recalculated the image dimensions using trigonometric calculations that account for the change in orientation. The affine transformation matrix was then updated to ensure that the original image’s center is aligned with the center of the resized output, maintaining all visual content while avoiding distortion or data loss. Following image rotation, the method uses a geometric transformation to determine the predicted locations of human pose landmarks in the original image. A 2D rotation matrix for a given angle θ was defined using Equation (4):
Rotation Matrix = cos θ sin θ sin θ cos θ
Using Equation (5), the original landmark coordinates (X, Y) are transformed into new coordinates ( X , Y ) after rotation.
x y = cos θ sin θ sin θ cos θ x y
where there are rotations about the image’s center of rotation, these coordinates are translated so as to take into consideration this point of rotation.
This approach provides a collection of expected landmark positions, which correspond to the predicted locations of the landmarks after rotating the original image by a specific angle. These produced coordinates provide a baseline for evaluating the accuracies of the HPE models’ landmark predictions for rotated images. The comparison illustrates how closely the predicted landmarks correspond to the expected positions, assessing the HPE model’s resilience to rotated inputs.

3.3. Performance Evaluation Framework

The MPII dataset, recognized identified as a gold standard in HPE, was used as the basis for this study, where a particular subset of 8000 images was used to serve as the primary case studyanalyze extensively as a case study. The dataset of images was analyzed with two state-of-the-art HPE models, namely MP and OP. The findings revealed that MP performed better consistently compared to OP, particularly with single person cases.
To thoroughly evaluate how strong these models are against different image qualities, we created a new dataset with a diverse image quality of filters on 14 different categories. The categories ranged from original images to rotations of 90°, 180°, and 270°, brightness changes (increases by 80, 90, and 100; and decreases by −100, −110, and −120), as well as low-resolution images with reduction percentage of 66.7%, 80%, 87.5%, or 90%. All of these filtered images were retested using the very same pose estimation models to determine how these changes compared to original images.
The methodology used involved sequential organized steps. First, all images were run through the models, generating output based on images with overlaid landmarks. The X and Y coordinates of each joint were recorded in individual CSV files of their original images. The individual CSV files were merged into a single workbook with information related to 33 landmarks detected by MP and 19 detected by OP, with missing predictions having the label of ‘NaN.’ The individual CSV files were merged into a single workbook, with each sheet designed to match a particular image and arranged as (Joint, X, Y) when using MP and (Body part, X, Y) when using OP. Following the completion of the image processing stage, we conducted a comparison of the two datasets, namely the Ground Truth from MP and the Ground Truth from OP. This comparison allowed us to identify overlapping images that contained shoulder values, which gave us a total of 1370 common images. It was from this overlapping image set that we went on to develop our further calculations.
To compare the ground truth (original images) with the filtered images, a normalized calculation was used. Specific constraints were applied:
1.
If a landmark was present in the original but absent in the filtered image, NaN was recorded.
2.
If a landmark was absent in the original but present in the filtered image, Null was noted.
3.
When both values were available, the absolute difference was computed.
The calculation focused on specific anatomical landmarks to account for the influence of person’s size within the images. We start by searching about common metrics used to deal with corrected landmarks and we found Percentage of Correct Key points (PCK), as it is a detected joint and is considered correct if the distance between the predicted and the true joint is within a certain threshold. The threshold distance is usually a fraction of the reference distance (e.g., 0.5 times the shoulder width). The reference distance is calculated in various ways, such as Head Size, which is the distance between the eyes or ears, or Shoulder Width, which is the distance between the left and right shoulders, and other ways, but those are the common ways, such as knee and hip. We checked the frequency of each pair of joints, as shown in Figure 1a,b. We already tested on two datasets FLIC (500 images) and MPII (2500 images) using MP and OP and this table shows the frequency of each joint. Thus, we chose the shoulder joints pair to calculate the reference distance to be used in further calculations. An additional note to consider, we consider in the code if the reference distance is equal to zero, so there is no calculated reference distance and Zero Error is written to neglect calculations for this one.
After we calculate the reference distance for ground truth images, we perform the other two evaluations metrics, which are
1.
Absolute Differences of X and Y from Equation (6) divided by reference Distance as the shown in Equation (7)
2.
Euclidean distance of shoulder joints divided by reference Distance
Absolute Differences of X and Y divided by reference Distance can be calculated using Equation (6)
Δ X i = X GroundTruth , i X Filter , i , Δ Y i = Y GroundTruth , i Y Filter , i
After that, we normalized the value by dividing by Reference Distance using Equation (7).
X groundTruth X filter ReferenceDistance and Y groundTruth Y filter ReferenceDistance
So for all, we normalized the value of Difference by dividing by Reference Distance using Equation (8).
Δ X i = X GroundTruth , i X Filter , i ReferenceDistance , Δ Y i = Y GroundTruth , i Y Filter , i ReferenceDistance
After that, we calculate average of all X and all Y using Equation (9).
Δ X joint = 1 N i = 1 N Δ X i , Δ Y joint = 1 N i = 1 N Δ Y i
The last one is calculating the Euclidean distance of shoulder joints divided by reference Distance can be calculated using Equation (10)
P o i n t = ( X groundTruth X filter ) 2 + ( Y groundTruth Y filter ) 2
After that we normalized the value by dividing by Reference Distance for each joint as shown in Equation (11).
Δ Point = ( X groundTruth X filter ) 2 + ( Y groundTruth Y filter ) 2 ReferenceDistance .
After we performed these calculations, we calculated average the Differences for Each Joint: For each joint (same keypoint across multiple images), the average difference for all points was calculate using Equation (12).
Average Δ Point , i = 1 N i = 1 N Δ Point , i
All calculations were conducted for every filter class, excluding those involving rotational adjustments. For rotated images, a transformation matrix was utilized to update the ground truth values, ensuring alignment with the respective rotation angles (90°, 180°, 270°). Following this, the absolute difference between the updated ground truth and the corresponding rotation type was calculated. The averages for all X and Y landmarks across all images were then computed. Similarly, the difference values were normalized by dividing by a reference distance. Additionally, the averages of all X and Y coordinates for all images were obtained, and the Euclidean distance was determined using the same approach as in the previous calculations.

3.4. Quality Assessment Models

To investigate the influence of various image qualities, we examined frequently used pre-trained models for image classifying, particularly posture estimation. We utilized and fine-tuned models such as ResNet50, ResNet152, DenseNet201, RotNet, and MobileNetV2 [,]. Following that, we conducted a more detailed evaluation. Once the best classifier is found, it will be used to identify the image quality degradation origin. Based on these classification results, a corresponding restoration algorithm is applied to revert each degraded image to its original state.
To identify the most effective techniques used for restoring image quality, we will examine commonly used techniques; especially those for enhancing the brightness level, even increasing or decreasing it, fixing rotated images to their original state, and enhancing the resolution of low-resolution images. These aspects will be evaluated using different restoration methods to determine their effectiveness in restoring images to their original state to be used for further analysis. To know a detailed overview of various restoration techniques that we will use, the following section will be shown.

3.5. Image Restoration Approaches

After comparing the performance of our classifiers, we propose reversing the effect of each applied filter to restore the filtered images to their original state. This approach allows us to re-evaluate and compare the results before and after the restoration, providing an indication of the error percentage. We evaluated many approaches for comparing each filter’s influence and chose the most effective techniques based on quality or visual assessment of the images and quantity assessment of real coordinates landmarks in CSV files. We used Cloudinary in Section 2.3 and OpenCV, both discussed in Section 2.3, for brightness adjustments, FSRCNN for recovering low-resolution images, and naive image rotate technique to restore image rotation.
We evaluate our results experimentally by applying all classifiers to the test dataset. By knowing the prediction classes of each classifier’s test set, we reverse the applied filter depends on each predicted class that enable a comparative study of the results before and after the restoration.

3.5.1. Reverse Brightness

The following two procedures are used to reverse the impact of a brightness adjustment level change whether increasing or decreasing that which has previously been applied to the image. These methods in Section 2.3 focus on retrieving the true luminance and contrast levels of the image, maintaining its quality while reversing the applied brightness changes.
Method 1: Cloudinary: This approach utilized is used to adjust the brightness levels of an image by utilizing the Cloudinary image transformation engine [] to make brightness adjustments ranging from −100 to 100, where 100 represents highly lighted images and −100 represents highly dark images. With this, this adaptive adjustment ensures proper delivery of lighting and contrast by accurately setting the brightness factor as well as maintaining image quality and integrity intact.
Method 2: OpenCV: [] It controls brightness levels by implementing compensatory adjustments. The function convertScaleAbs controls both brightness and contrast parameters, thereby controlling the overall luminosity of an image. A negative value of beta is used to decrease brightness, and a positive value of beta is used to increase it. For example, if an image’s brightness has been increased by +100, using a beta parameter of −100 will restore brightness to its original state. Alpha adjusts the contrast parameter, and as there are no changes made to this contrast setting, it defaults to 1.0. It limits the amount of brightness variations possible without compromising on the visual quality of the image. Additionally, it allows brightness levels to change while maintaining the quality of the image.

3.5.2. Reverse Low Resolution

We created a dataset with different classes in reference to different reduction percentage of resolution to aid in training our classifier. However, in the reverse effect application scenario context, we suggested proposed to start work with resolution with reduction percentage 66.7% alone as a representative sample to test objectives. In order to improve these low-resolution images, FSRCNN [,] addresses the drawbacks of low-resolution images by upscaling their resolution to three times that of the downsampled image. This is a deep learning model that stands out for its lightweight and high efficiency in creating super-resolution for single images. The approach was implemented using the cv2.dnn_superres module of OpenCV. The procedure takes the submission of low-resolution images with appropriate color formatting and applies the FSRCNN model to triple the resolution. The enhanced images were then saved in a specified directory. This approach successfully restored image resolution and demonstrated FSRCNN’s ability to address quality decline in low-resolution datasets.

3.5.3. Reverse Rotation

In Section 2, we discussed the commonly used techniques and their restrictions, so we chose the geometric transformation method, discussed in Section 2.3. After increasing the image quality, the proper tool is used to reverse the degradation of image quality.

4. Experimental Results and Discussion

4.1. Classifiers Results

In terms of a preliminary study to analyze and compare experimental results of our research, we develop a comprehensive series of experiments on the dataset using the classifiers of ResNet50, ResNet152, DenseNet201, RotNet, and MobileNetV2; this mandate was given in order to generate optimal results. This is very noteworthy, which is a key part for the following evaluations. The initial settings of these pre-trained models were used for our models then they were fine-tuned using our dataset to experiment with their performance variations. This is done to identify the optimal models to get an idea regarding the best performing models for the classification of these degraded images. Moreover, the dataset for each classifier is partitioned into training, validation, and testing subsets, as summarized in Table 2.
Table 2. Dataset split for different degradation types.
The findings will be given in the following manner: initially, all classifiers’ results will be provided as they are shown in Table 3, Table 4 and Table 5 demonstrate the results of every classifier at training and validation levels on three degradation factors, and then the best models of deterioration will be chosen for future assessments.
Table 3. Performance comparison of different classifiers for rotation-degraded images.
Table 4. Performance comparison of different classifiers for brightness-degraded images.
Table 5. Performance comparison of different classifiers for low resolution-degraded images.
In the following, the state-of-the-art RotNet model was proposed in []. Furthermore, we proposed a tuned version of RotNet to fit the current dataset, and we call it tuned-RotNet. The results for Rotation indicate a high overfitting for DenseNet201 and a severe overfitting for RotNet official, and a light overfitting for the tuned-RotNet, which suggests that the high score models are ResNet152, MobileNetV2, and RotNet []; however, we decided to compare MobileNetV2, RotNet, and tuned-RotNet. In addition, the top model for brightness was MobileNetV2, while there is overfitting found in the ResNet152 model and the DenseNet201 model has a lower overall accuracy. For low-resolution, as shown in Table 5, MobileNetV2 is selected as the best classifier, while all other models fail due to severe overfitting.
We created a prediction for the test set in order to validate the outcome of our model before proceeding with any additional experiments, during which we remain confident in the prediction.
With the importance of image classification, as this classifier is going to serve as the backbone for applying HPE models, we tried to build a robust system for better improvement of the accuracy of the model. The classifier will predict the class of the degraded image, which tells what type of degradation occurs in that image. According to its class and degradation type, different algorithms are applied to that image to restore it to the original form. This makes the HPE model work optimally.
Our contribution started with a small-sized dataset and was built up by different trials to 8000 images per class. We divided the classifier into three separate classifiers because each one dealt with one particular degradation type. Because if all the degradation classes are combined and tried as one single classifier, then the accuracy would be drastically reduced, which is not required.
We fine-tuned some other hyper-parameters, such as the learning rate, stochastic gradient descent, L2 regularization, epoch, early stopping, and learning rate reduction, and found that they further improved the model for better accuracy.
Additionally, we adopted the RotNet model in two ways: one was the official model [], and the proposed model that has some modifications was done in preprocessing and changing hyperparameters in training by changing the handling of the dataset before training the classifier to suit other pre-trained models. In that case, the tuned-RotNet outperformed the official RotNet model.
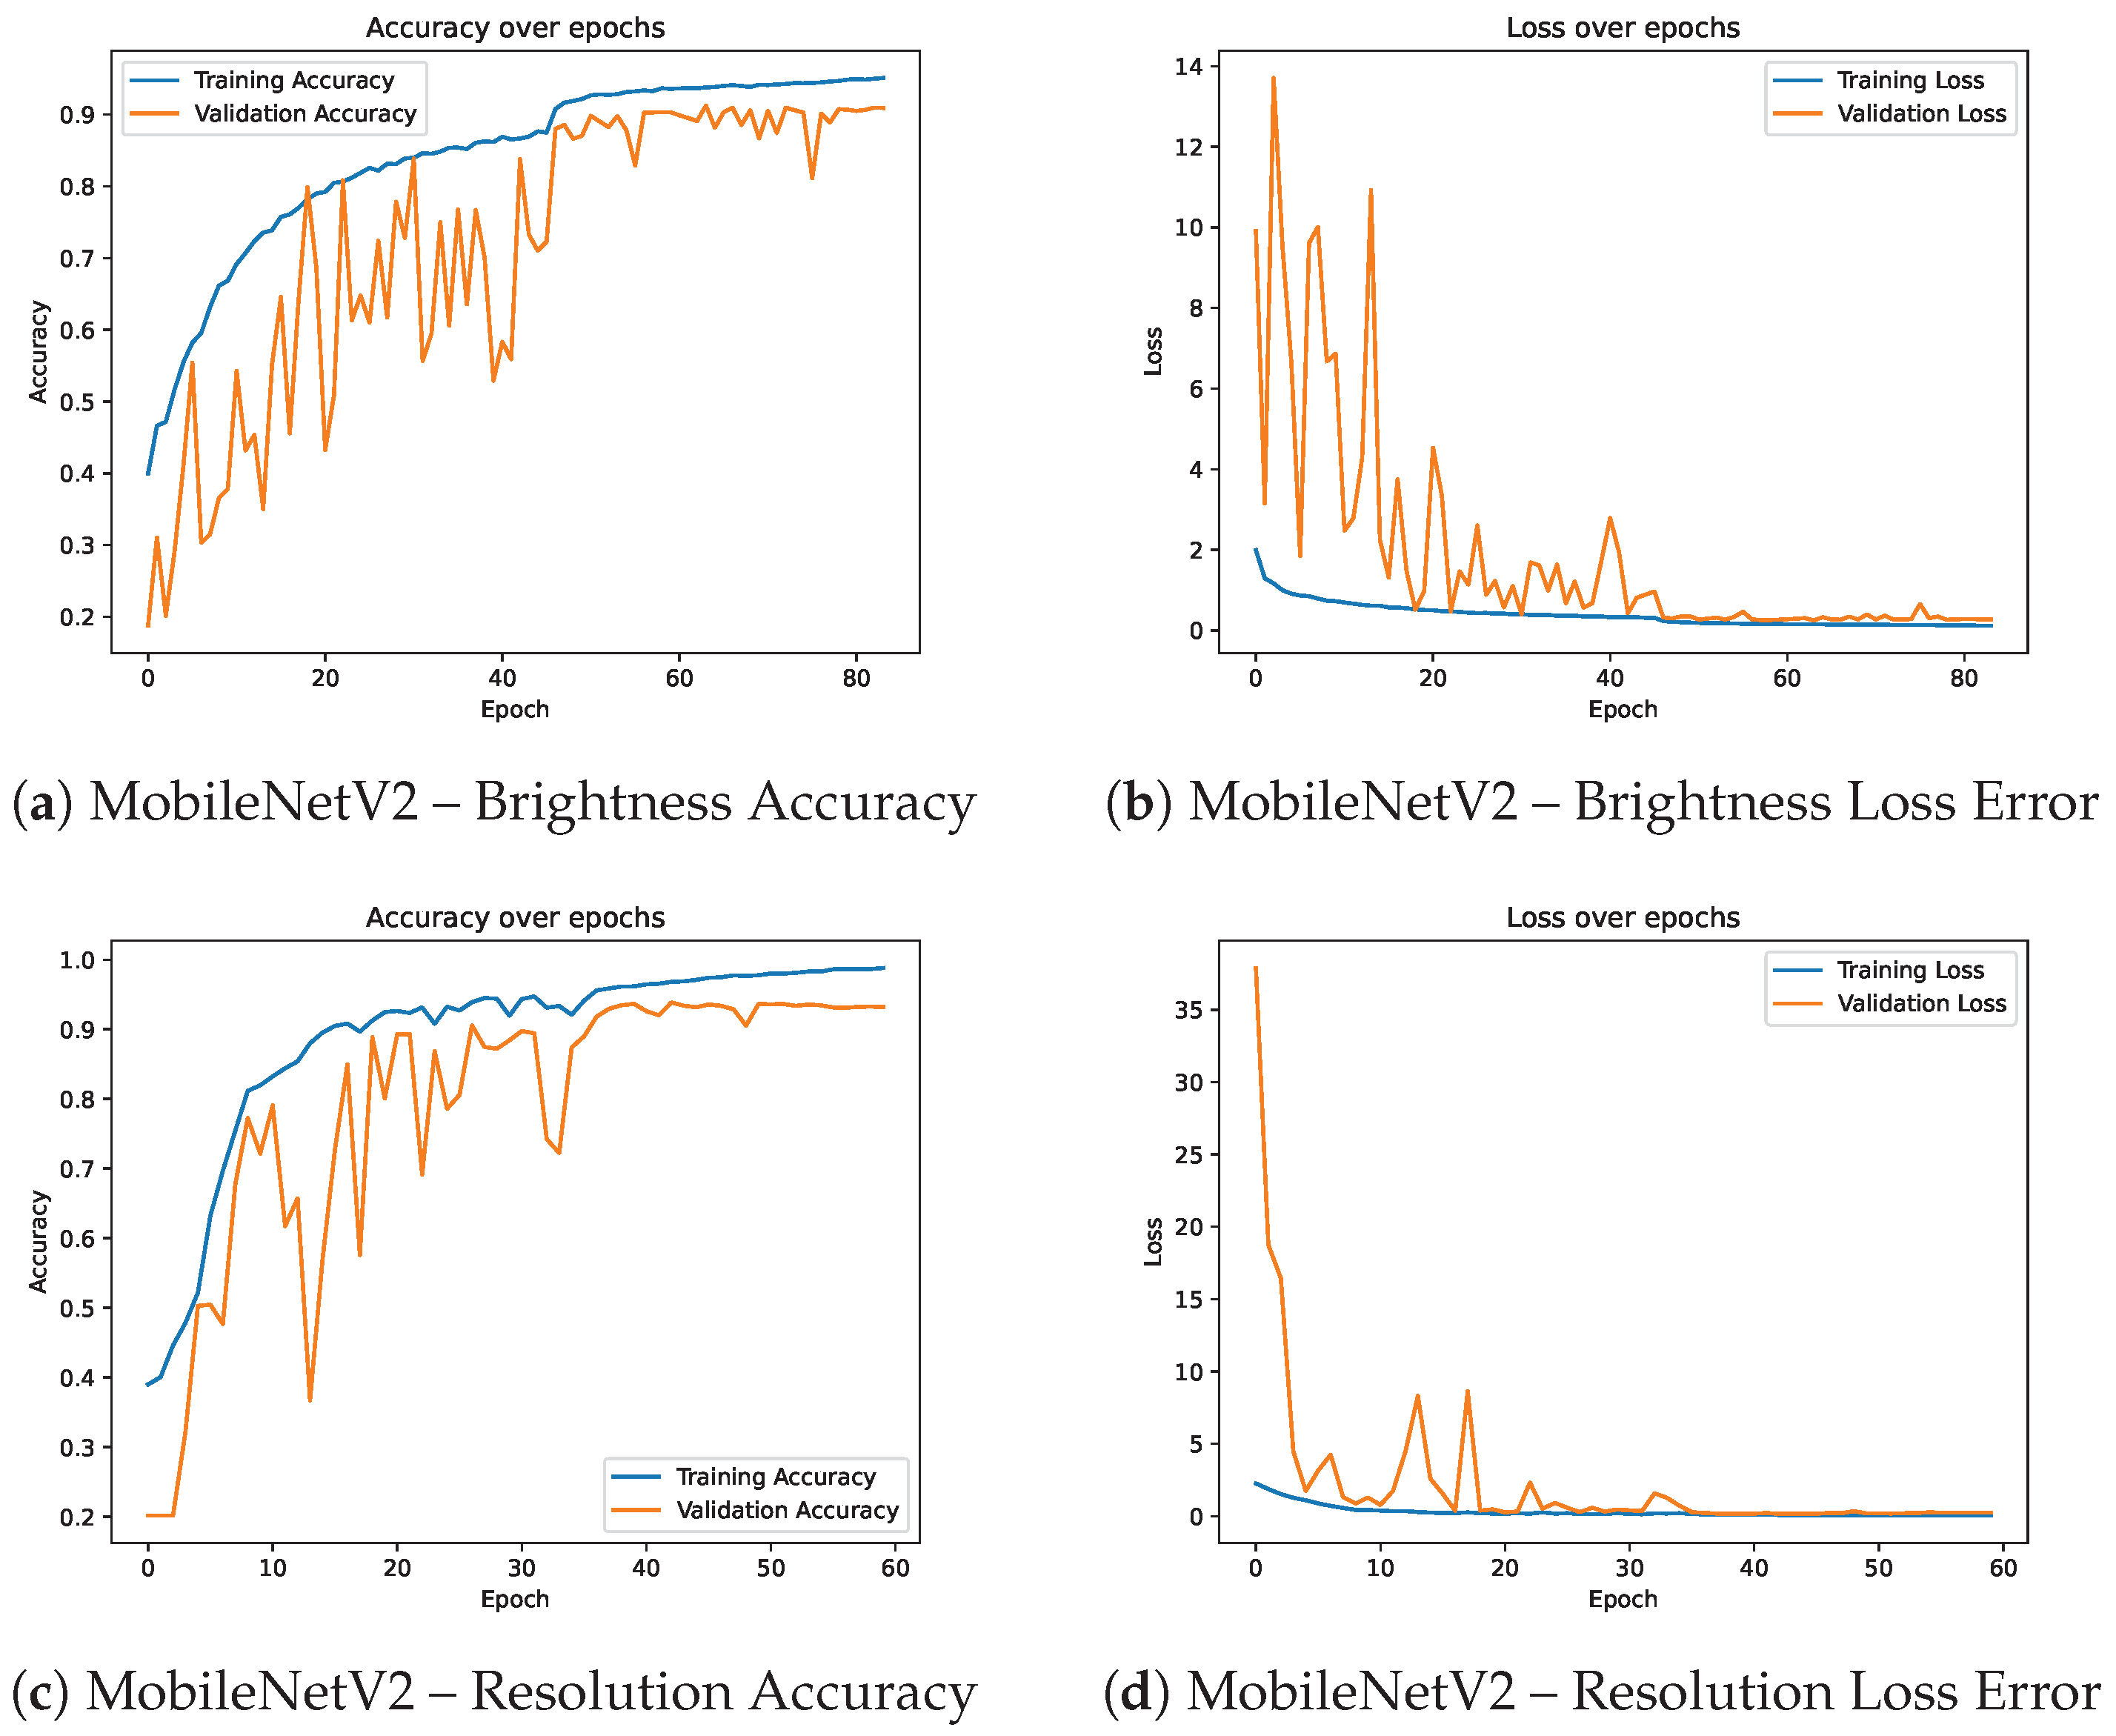
Finally, we used MobilenetV2 for all degradation approaches since it gave the best training and validation accuracies throughout. For rotation, brightness, and low resolution, the accuracies of training were 100%, 95.09%, and 98.80%, while for validation, the accuracies were 97.87%, 90.91%, and 93.20%. We also applied RotNet with its two versions (Official and the tuned-RotNet) in addition to MobileNetV2 for the rotation degradation approach.
To start running HPE models, we need to have a baseline or reference to compare with, so ground-truth data were obtained by running the MP, OP, ALP HPE models directly on non-degraded images without any degradation. All the detected joints from all images were incorporated in the creation of the ground-truth; that is, all non-NaN values in both X and Y coordinate information for all joints were utilized. The predictions in terms of X and Y coordinates provide a reference against which all subsequent comparisons with the degraded images are made. A reference is provided by this baseline through which one can assess the effect image degradation has on model performance by viewing the differences relative to the unchanged, non-degraded images.
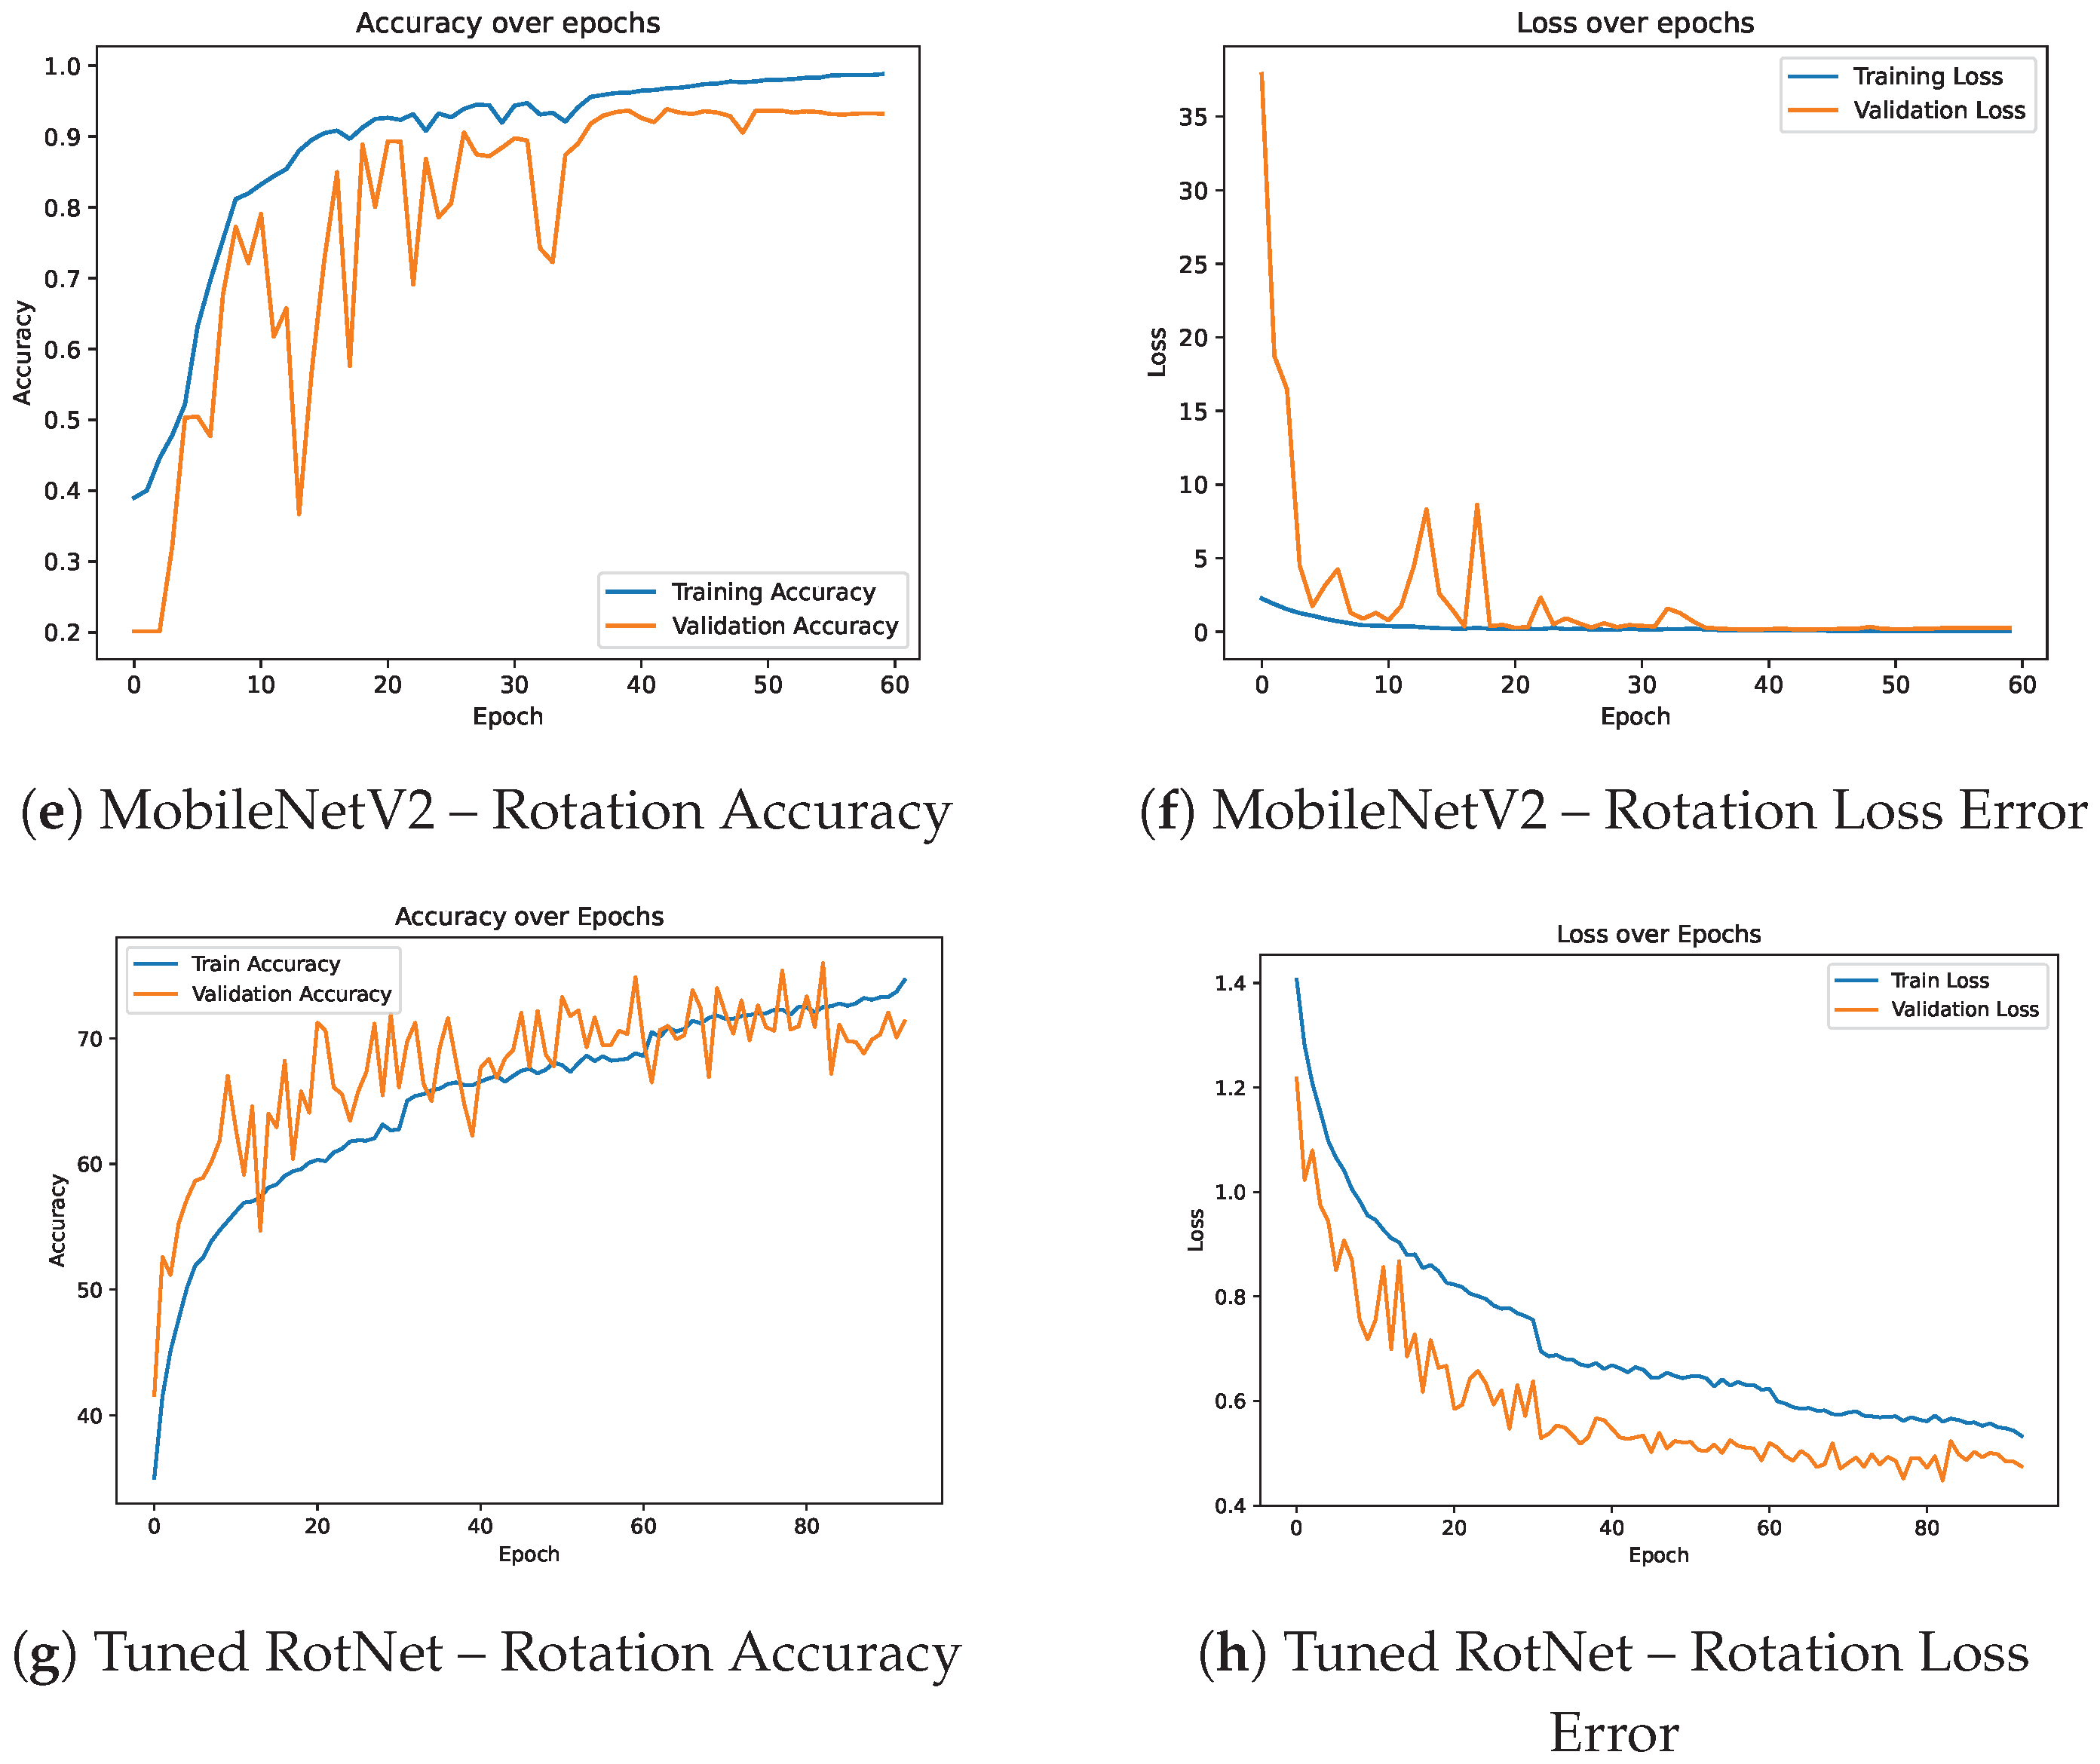
The training and validation accuracy and loss curves of MobileNetV2 under brightness Figure 4a,b resolution as shown in Figure 4c,d, and rotation Figure 4e,f degradations are presented. In addition, Figure 4g,h illustrate the performance of the tuned RotNet under rotation degradation. These figures complement the classifier results by demonstrating stable convergence behavior and consistent performance across different degradation types.
Figure 4. Training and validation performance of Classifier MobileNetV2 and Tuned RotNet across different image degradation types. Each row presents accuracy (left) and loss error (right) plots for MobileNetV2 under (a,b) Brightness, (c,d) Resolution, (e,f) Rotation, and for (g,h) Tuned RotNet under rotation degradation.

4.2. Quality Assessment Models Performance

To accurately assess how image degradation and restoration techniques affect these state-of-the-art HPE models, we ran trials of three types of degradation (brightness, resolution and rotation) of each of the three state-of-the-art HPE models (MP, OP, and ALP). An overview of the average normalized error over all three types of degradation. This shows that rotation degradation has a larger effect on overall performance than both brightness and resolution degradation, and that the restoration techniques exhibit variable efficacy and have differing levels of success based on the nature of the degradation and the HPE being used.
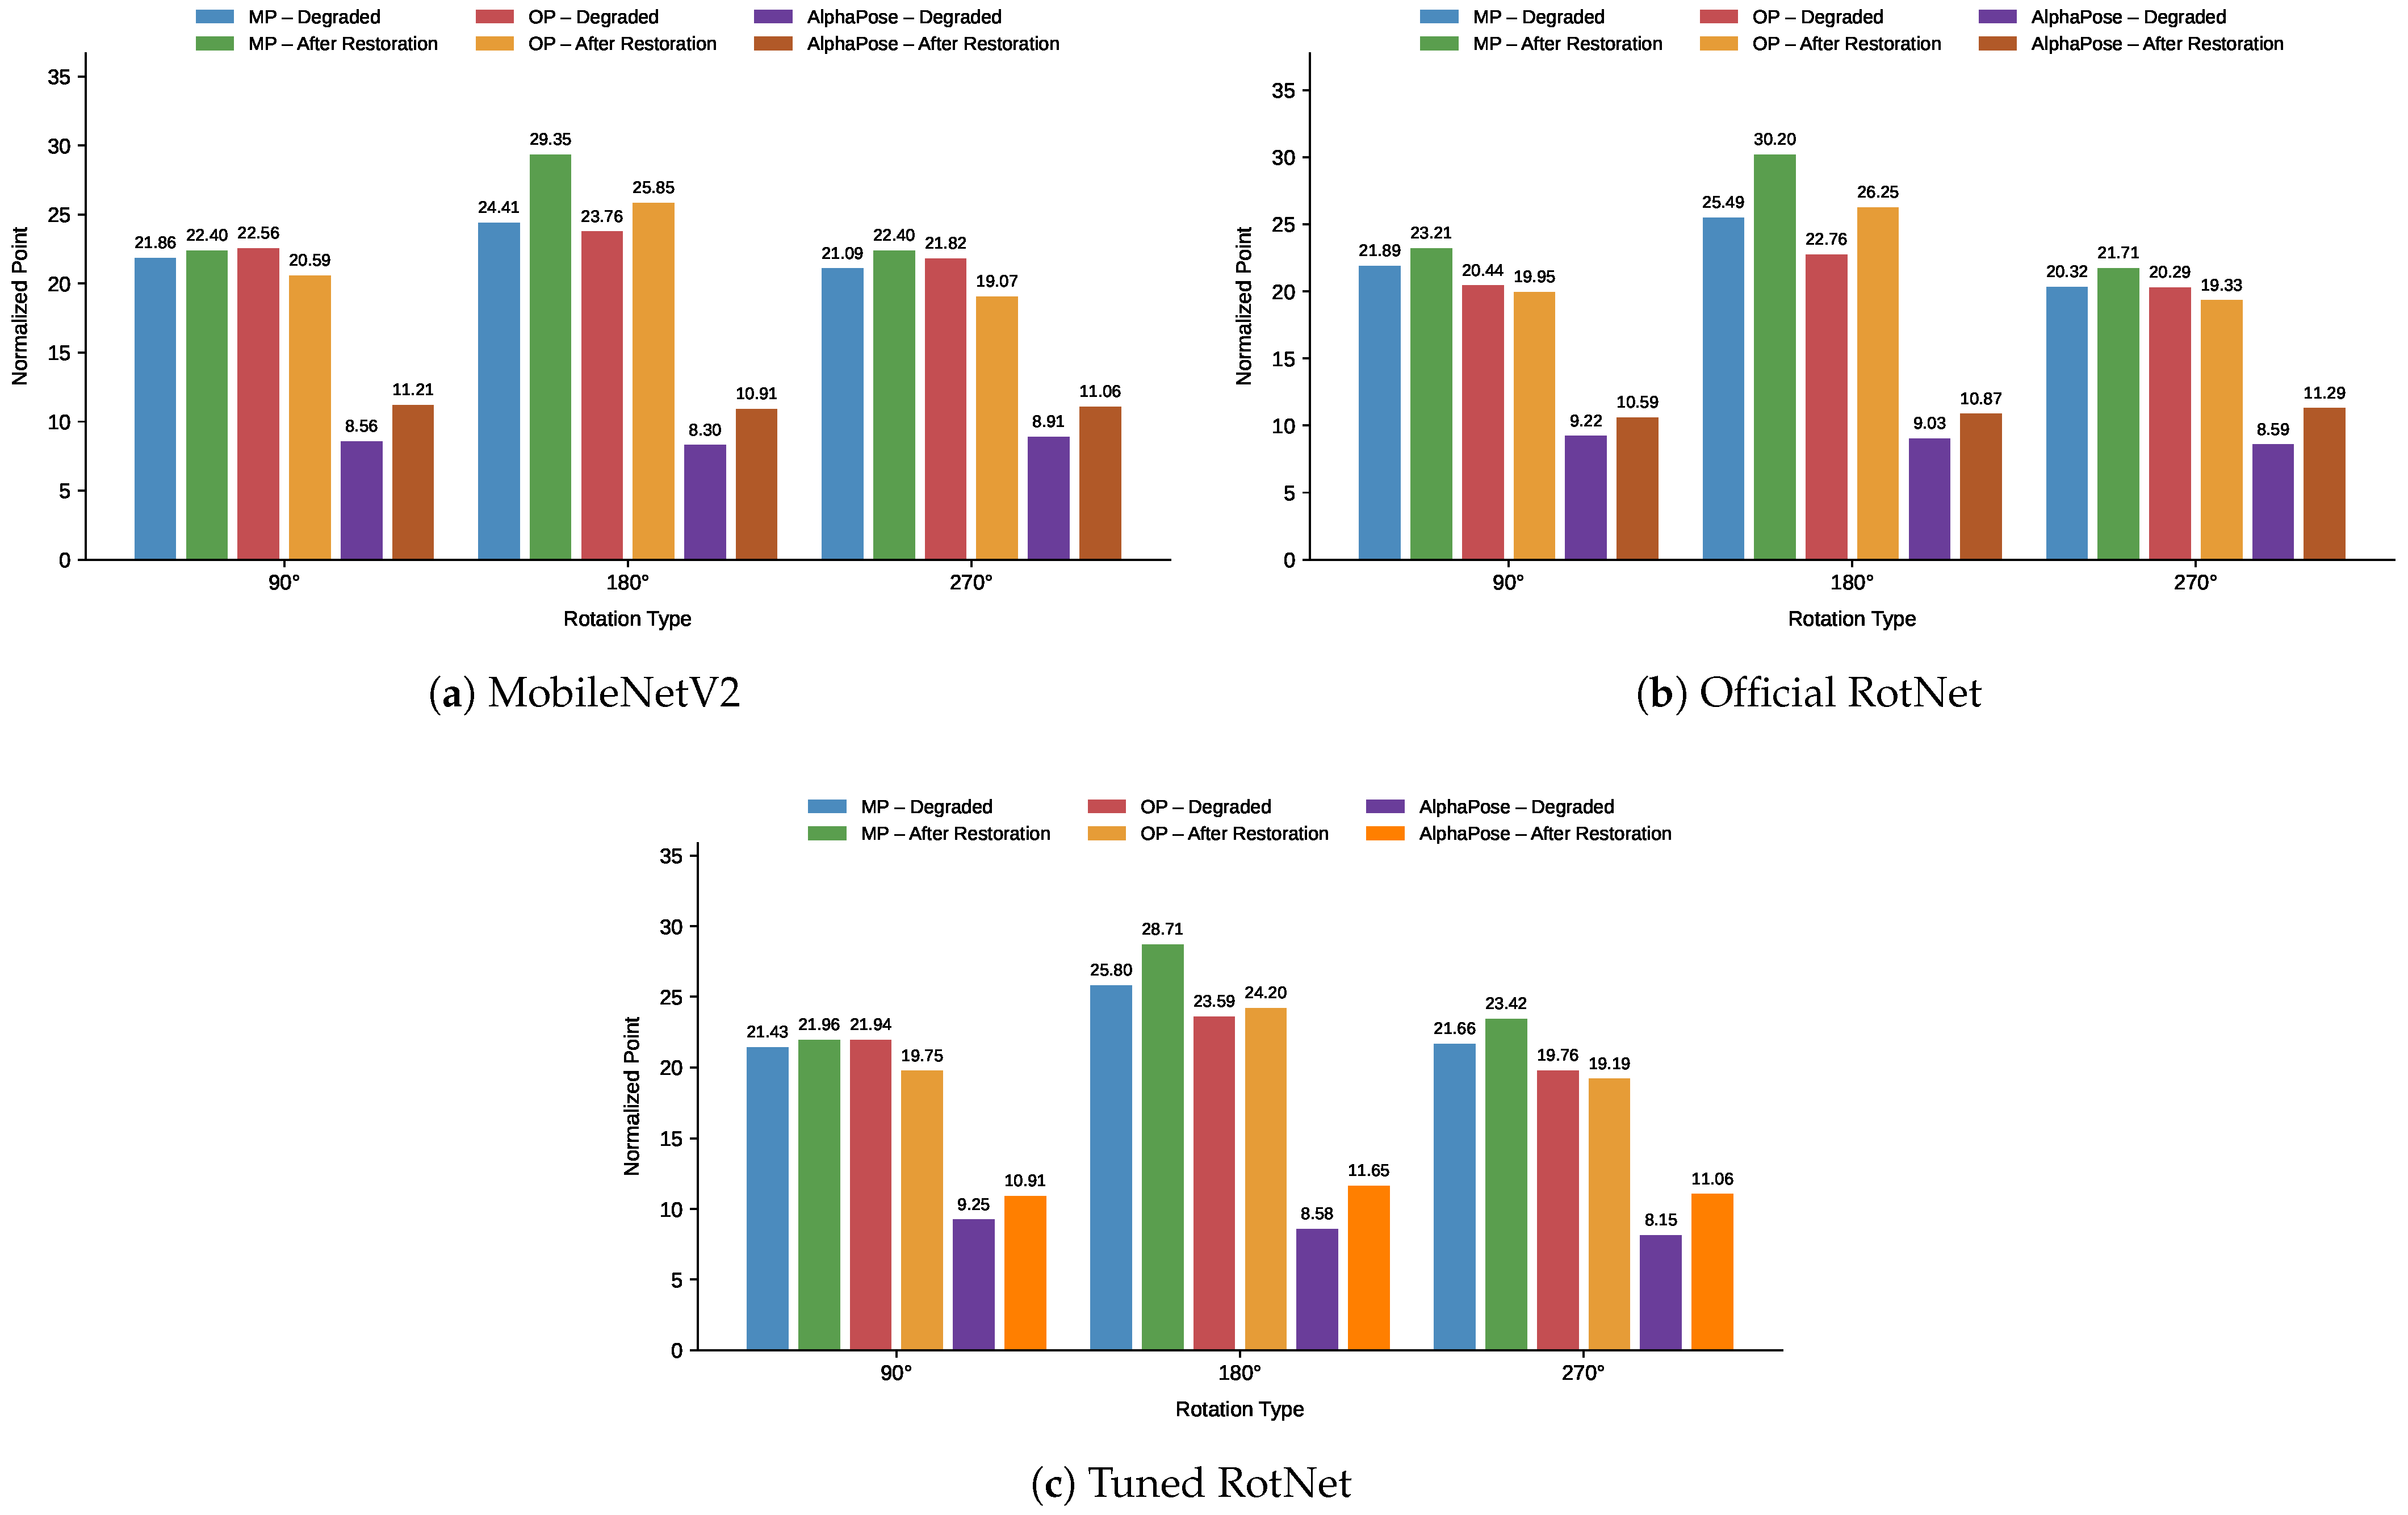
We then used the test set for each classifier to assess the effect before and after reversing the filters or restoring the original state of the images and calculated the error percentage before and after this restoration technique was performed. Moving on to the comparison for low resolution, the results are presented in Figure 5 for MP, OP, and ALP. While Figure 6a–c represent the results for MP, OP, and ALP for brightness for MobileNetV2 classifier. However, for rotation, the results before and after restoration are shown in Figure 7a for MobileNetV2, Figure 7b for tuned-RotNet, and Figure 7c for Official RotNet. All of these results are achieved using the evaluation metric of the normalized point divided by the reference distance, which is mentioned before in Equation (11).
Figure 5. Point divided by reference distance for classifier MobileNetV2 with degraded images (Resolution) and after restoration using the MP HPE model.
Figure 6. Point divided by reference distance for classifier MobileNetV2 with degraded images (Brightness) and after restoration using different HPE models (a) MP, (b) OP, and (c) AlphaPose. (a) MobileNetV2 with degraded images (Brightness) and after restoration using the MP HPE model; (b) MobileNetV2 with degraded images (Brightness) and after restoration using the OP HPE model; (c) MobileNetV2 with degraded images (Brightness) and after restoration using the AlphaPose HPE model.
Figure 7. Point divided by reference distance for classifiers (MobileNetV2, Official RotNet, and Tuned RotNet with degraded images (Rotation) and after restoration using different HPE models (MP, OP, and ALP) in each subfigure of: (a) MobileNetV2, (b) Official RotNet, and (c) Tuned RotNet.
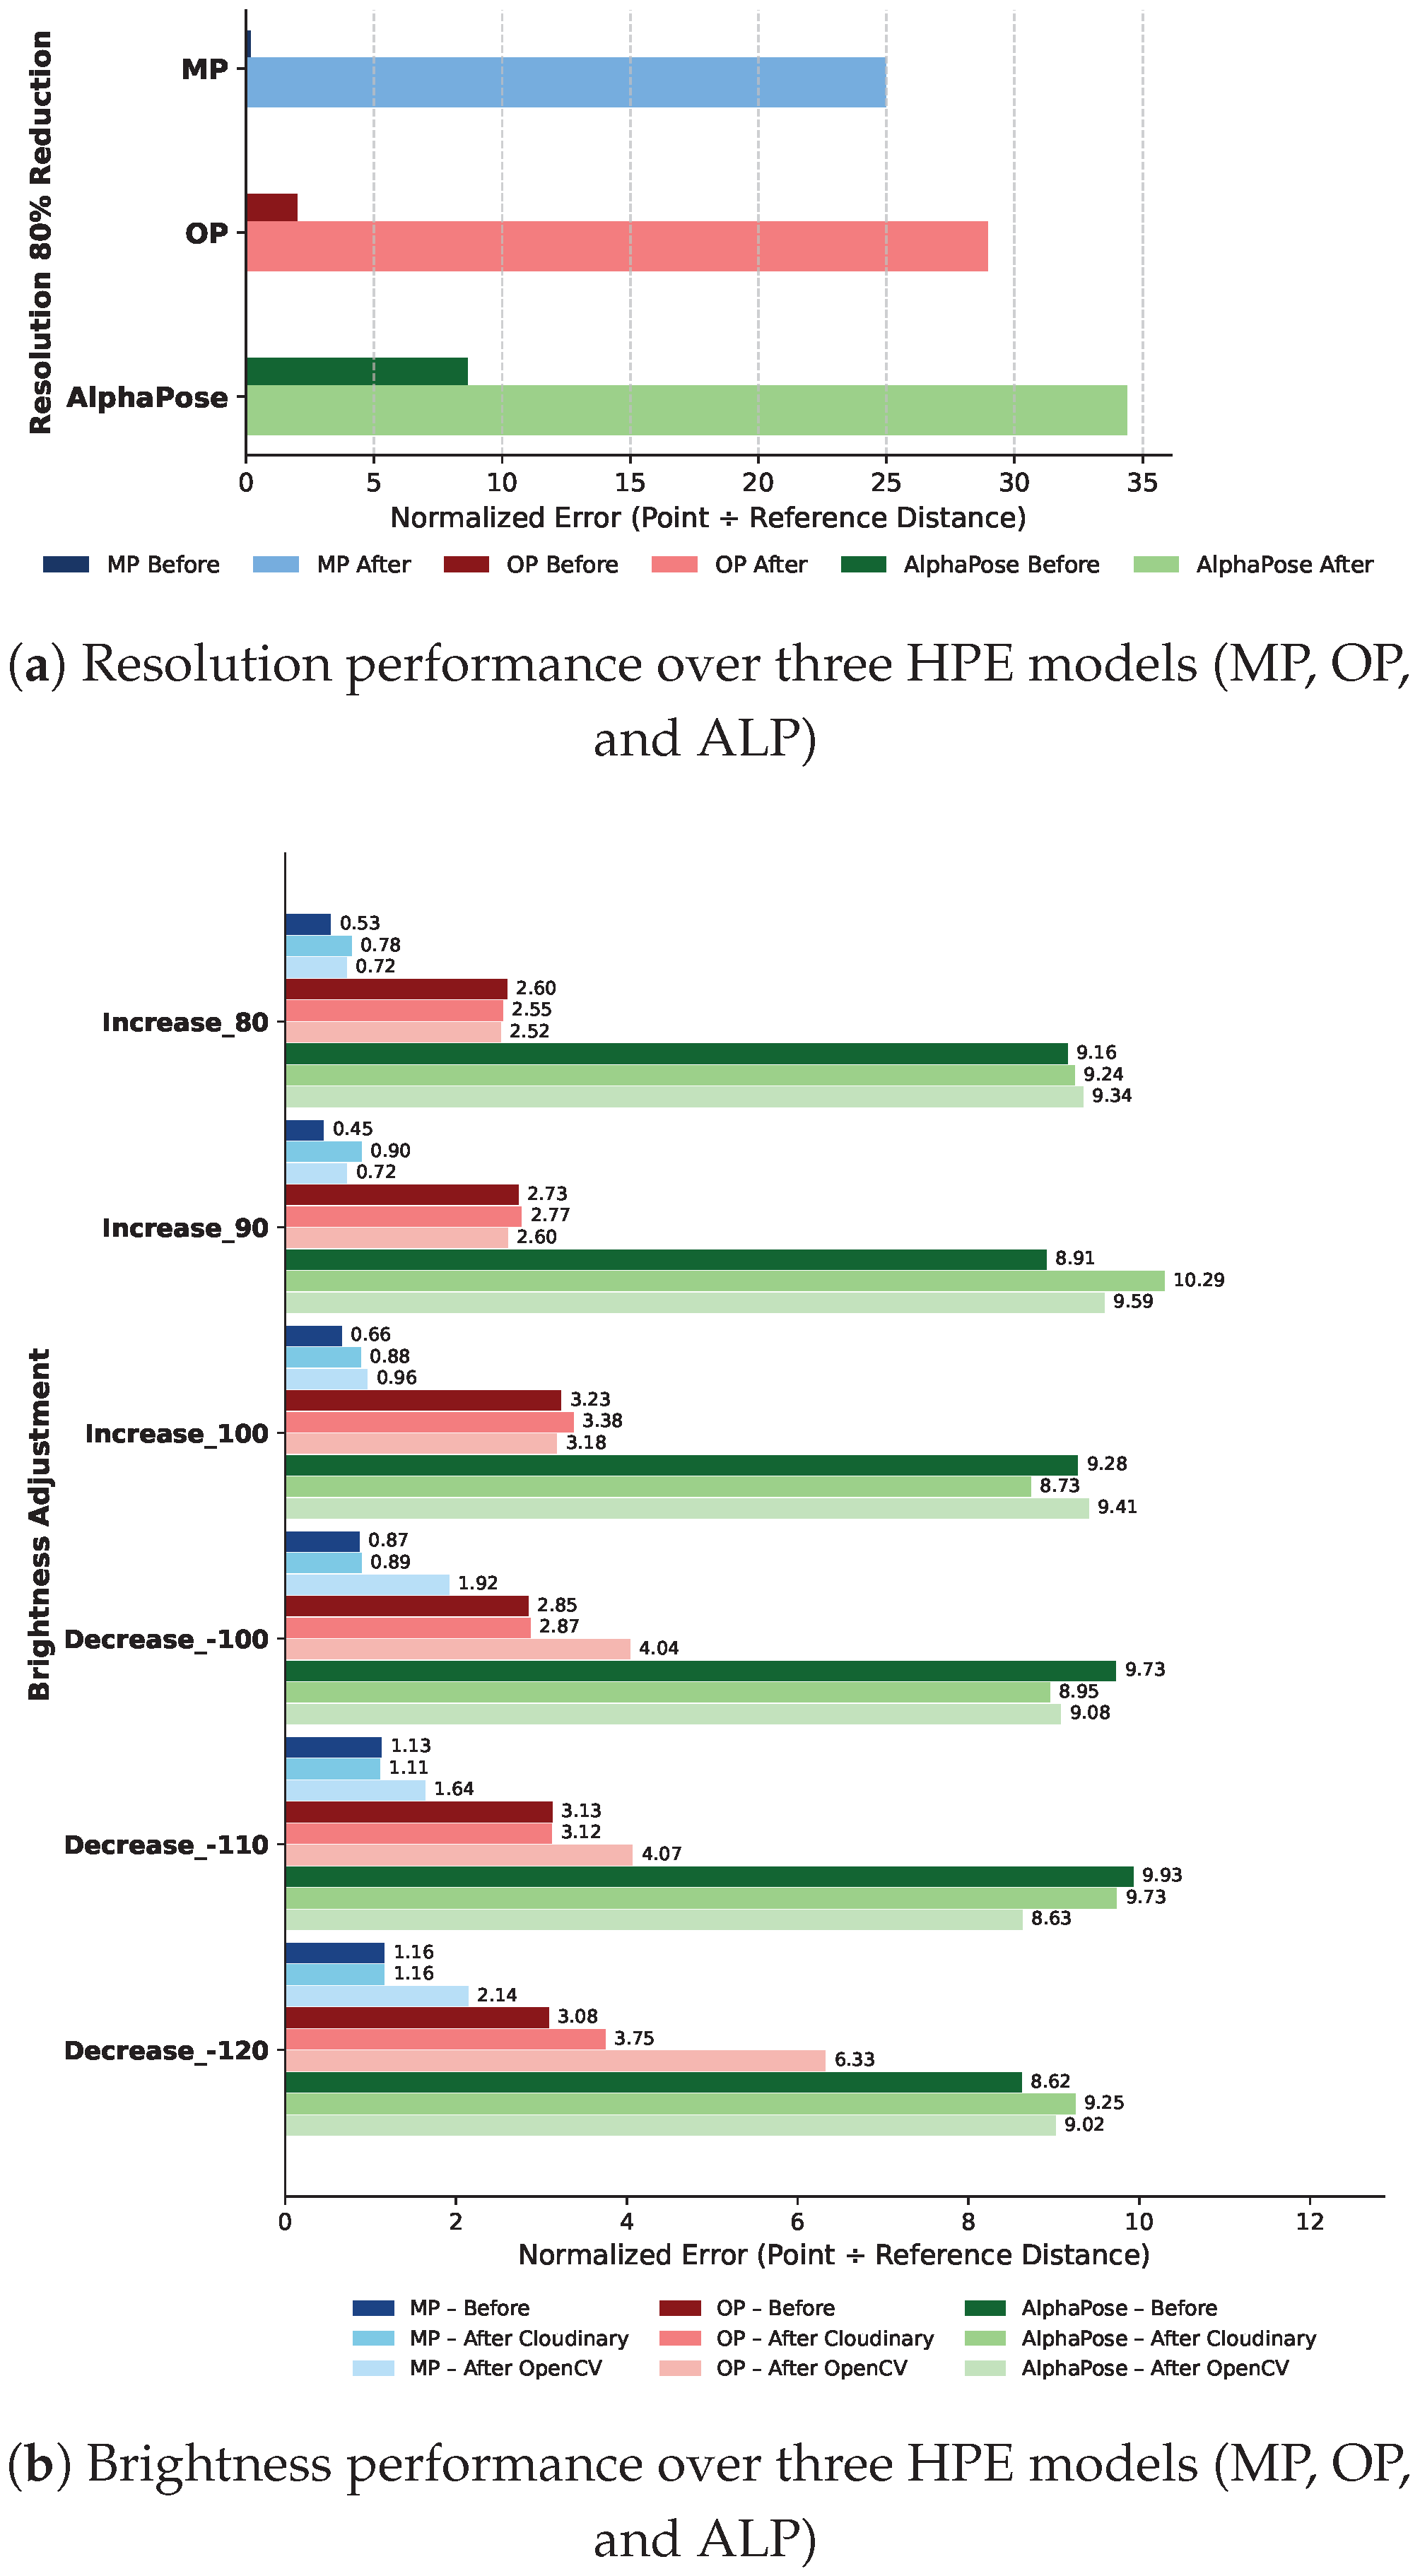
The findings show that Cloudinary in Section 2.3 and OpenCV, both discussed in Section 2.3, have different strengths for various classes of brightness degradation in MP, OP, and ALP. Although their overall efficacy is comparable, each approach performs better in different situations. In MP, Cloudinary improves the outcome for the Decrease_110 class by decreasing the average error from 1.1301 to 1.1095, whilst OpenCV does not. For OP, Cloudinary improves performance in the Increase_80 and Decrease_110 classes by lowering errors from 2.6000 and 3.1296 to 2.5477 and 3.1226, respectively. OpenCV, on the other hand, performs better in the Increase_80, Increase_90, and Increase_100 classes, with errors reduced from 2.6000, 2.7278, and 3.2312 to 2.5224, 2.6049, and 3.1814, respectively. On the other hand, for ALP Cloudinary improves the performance for Increase_100, Decrease_100, and Decrease_110 to decrease the average error from 9.2801, 9.7274, and 9.9285 to 8.7318, 8.9525, and 9.7347, respectively. While for ALP using OpenCV, the results are improved on Decrease_100 and Decrease_110 by decreasing the average error from 9.7274 and 9.9285 to 9.0813 and 8.6307, respectively.
As a conclusion, these results show that image quality restoration techniques currently in the process of being developed to improve image quality possess limitations, which require further research and trails to achieve optimum solutions. However, when considering the low-resolution degradation type, the application of FSRCNN yields unfavorable results, as it significantly increases the average pose estimation error—from 0.1881 to 24.9770 for MP, from 2.0122 to 28.9446 for OP, and from 8.6625 to 34.3943 for ALP, indicating that this enhancement method is far from beneficial in such cases. Hence, it is an open challenge for all researchers to improve the results of FSRCNN algorithm or propose new ones. Although there are different reduction percentages in our dataset to promote diversity in classifier training, a reduction percentage of 66.7% was selected as an example to allow investigating its complex consequences. This was done in order to maintain a clear and concise analysis.
Furthermore, the understanding that a large portion of the current research is predicated on a limited range of reduction percentages, potentially limiting its applicability in various contexts, provides justification for the development of distinct resolution reduction percentages. In addition, note that the average error rate for all three models for Brightness and Low Resolution shows that MP, OP, and ALP come in this order from minimum average error values to maximum average error values. Also, with regards to rotation degradation type, each of the classifiers, which are MobileNetV2, RotNetOfficial, and Tuned_RotNet was tested independently before and after application of the restoration process. This was due to the separate test sets related to each rotation class present for every classifier, which meant that there were no shared test sets between models. Thus, we tested the restoration process by testing each individual classifier over relevant degraded images followed by another test after application of the restoration process in an attempt to rectify the degradations. Interestingly, rotation did not contribute any improvements to MP in all three classifiers.
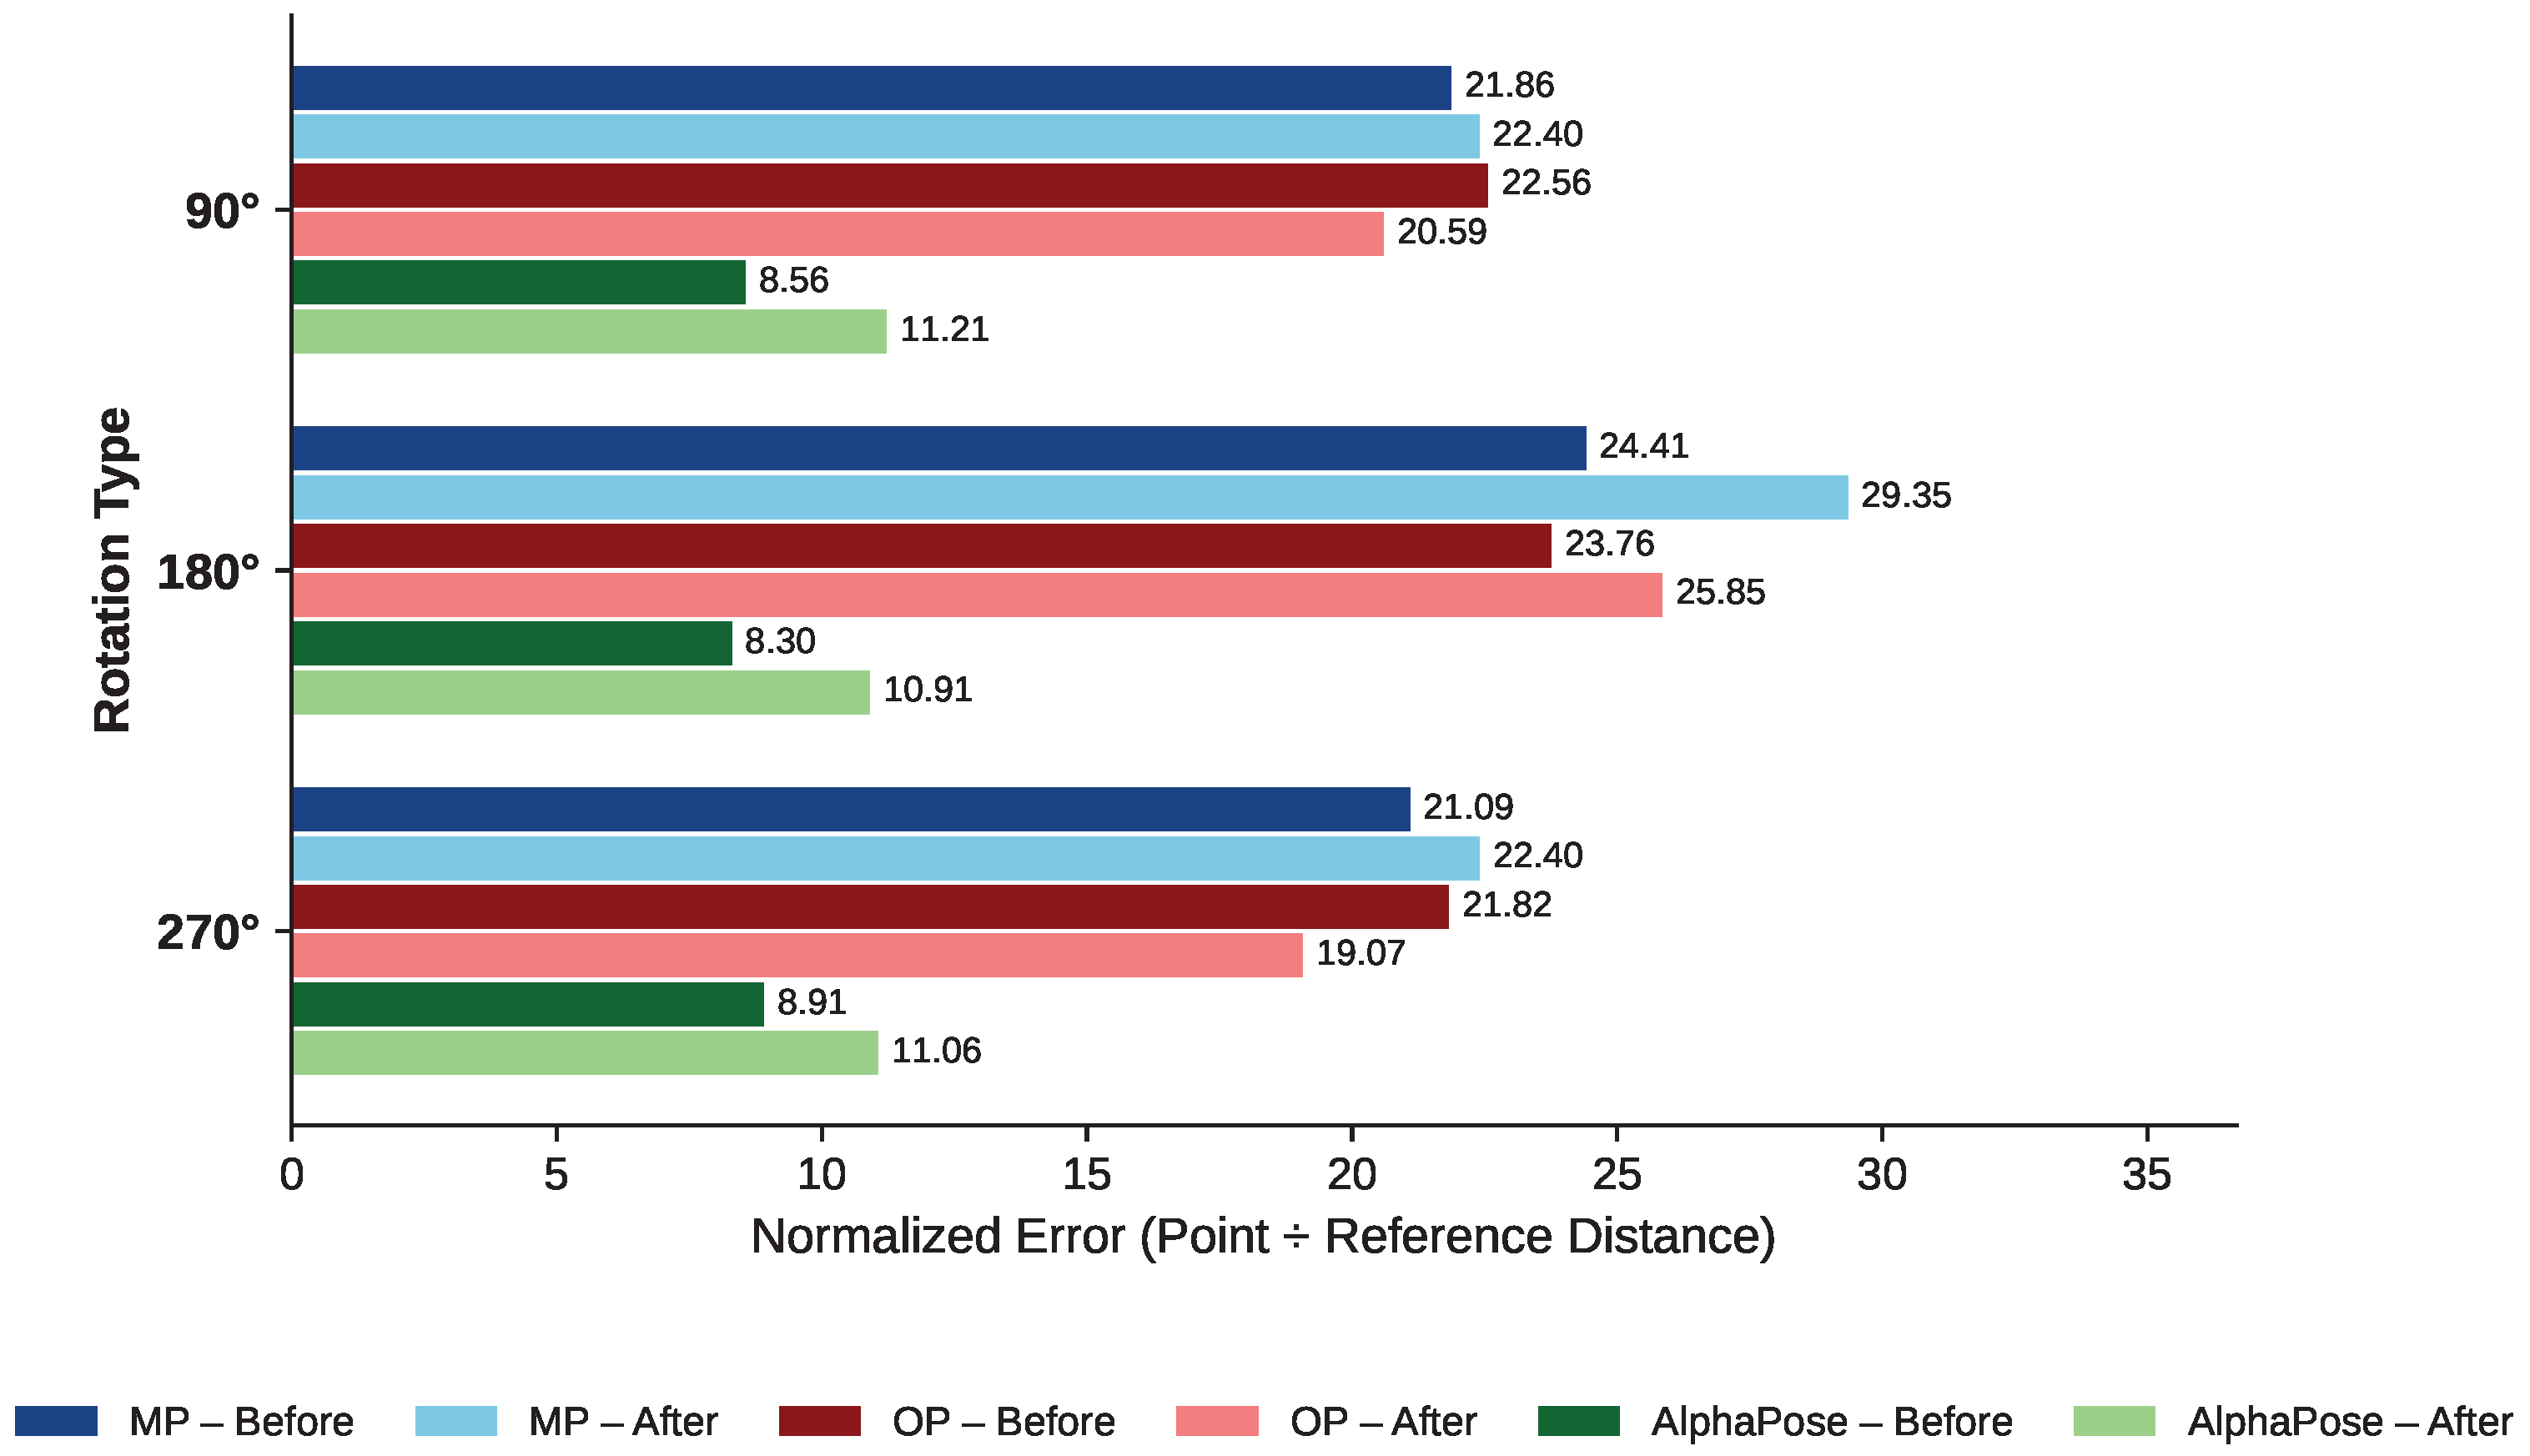
Conversely, in OP, all three classifiers showed improvements in both the Rotate_90 and Rotate_270 classes. While in ALP, there is no impovement in any rotation class, but overall the average error rate is smaller than the average error rate for MP and OP, which indicates the ALP is worked well in detecting landmarks in accurate way. Specifically, MobileNetV2 reduced its error from 22.5590 to 20.5914 for Rotate_90 and from 21.8237 to 19.0651 for Rotate_270. Similarly, rotation showed improvement with error rates reducing from 20.4381 and 20.2862 to 19.9548 and 19.3323, respectively. Similarly, Tuned_RotNet also showed improvements with reduced error from 21.9426 and 19.7584 to 19.7533 and 19.1890. From these observations, MobileNetV2 boasted the best restoration, followed by RotNetOfficial then Tuned_RotNet. These findings illustrate the practical significance of HPE detection even under degraded image settings, demonstrating the ability of restoration approaches and strong classifiers to retain consistent performance.
Our proposed model is analyzed against the state-of-the-art in [] as a comparative basis for rotation operations. There, 50.37% and 89.76% accuracy in image classification using five and two convolutional layers, respectively, is reported. The works reported 89.06% accuracy in classification for CIFAR-10 as in angles of 0°, 90°, 180°, and 270° with image rotation detection. During our research, we used the same source code but modified data preprocessing operations such as augmentation operations as RandomResizedCrop, RandomHorizontalFlip, and CenterCrop. We also employed the Adam optimizer for playing with a learning rate value of 0.001 and used StepLR to decay it with a decimation value of 0.1 every five epochs. With these enhancements, the achieved training accuracy and the validation accuracy were 98.96% and 92.04%, respectively. On the other hand, with no changes regarding these in our source code with our dataset, in both experiments the accuracies in training and validation were 84.70% and 61.59%, respectively.
Finally, we take all the degraded images and apply restoration techniques to them. We present the results for each HPE model (MP, OP, ALP) for each degradation approach, comparing between before and after restoration. We provide for each degraded type the evaluation criteria, which is the average of points divided by reference distance.
In addition to quantitative measurement showing changes in landmark detection before and after restoration techniques are applied, validation is also incorporated with visual inspection of detected landmarks of running HPE Models MP, OP, and ALP. Verification can be done by superimposing landmarks on images or by checking their coordinates as saved in a CSV file. The restoration technique is considered effective with respect to this is when the HPE model detects and outlines landmarks with improved accuracy after restoration.
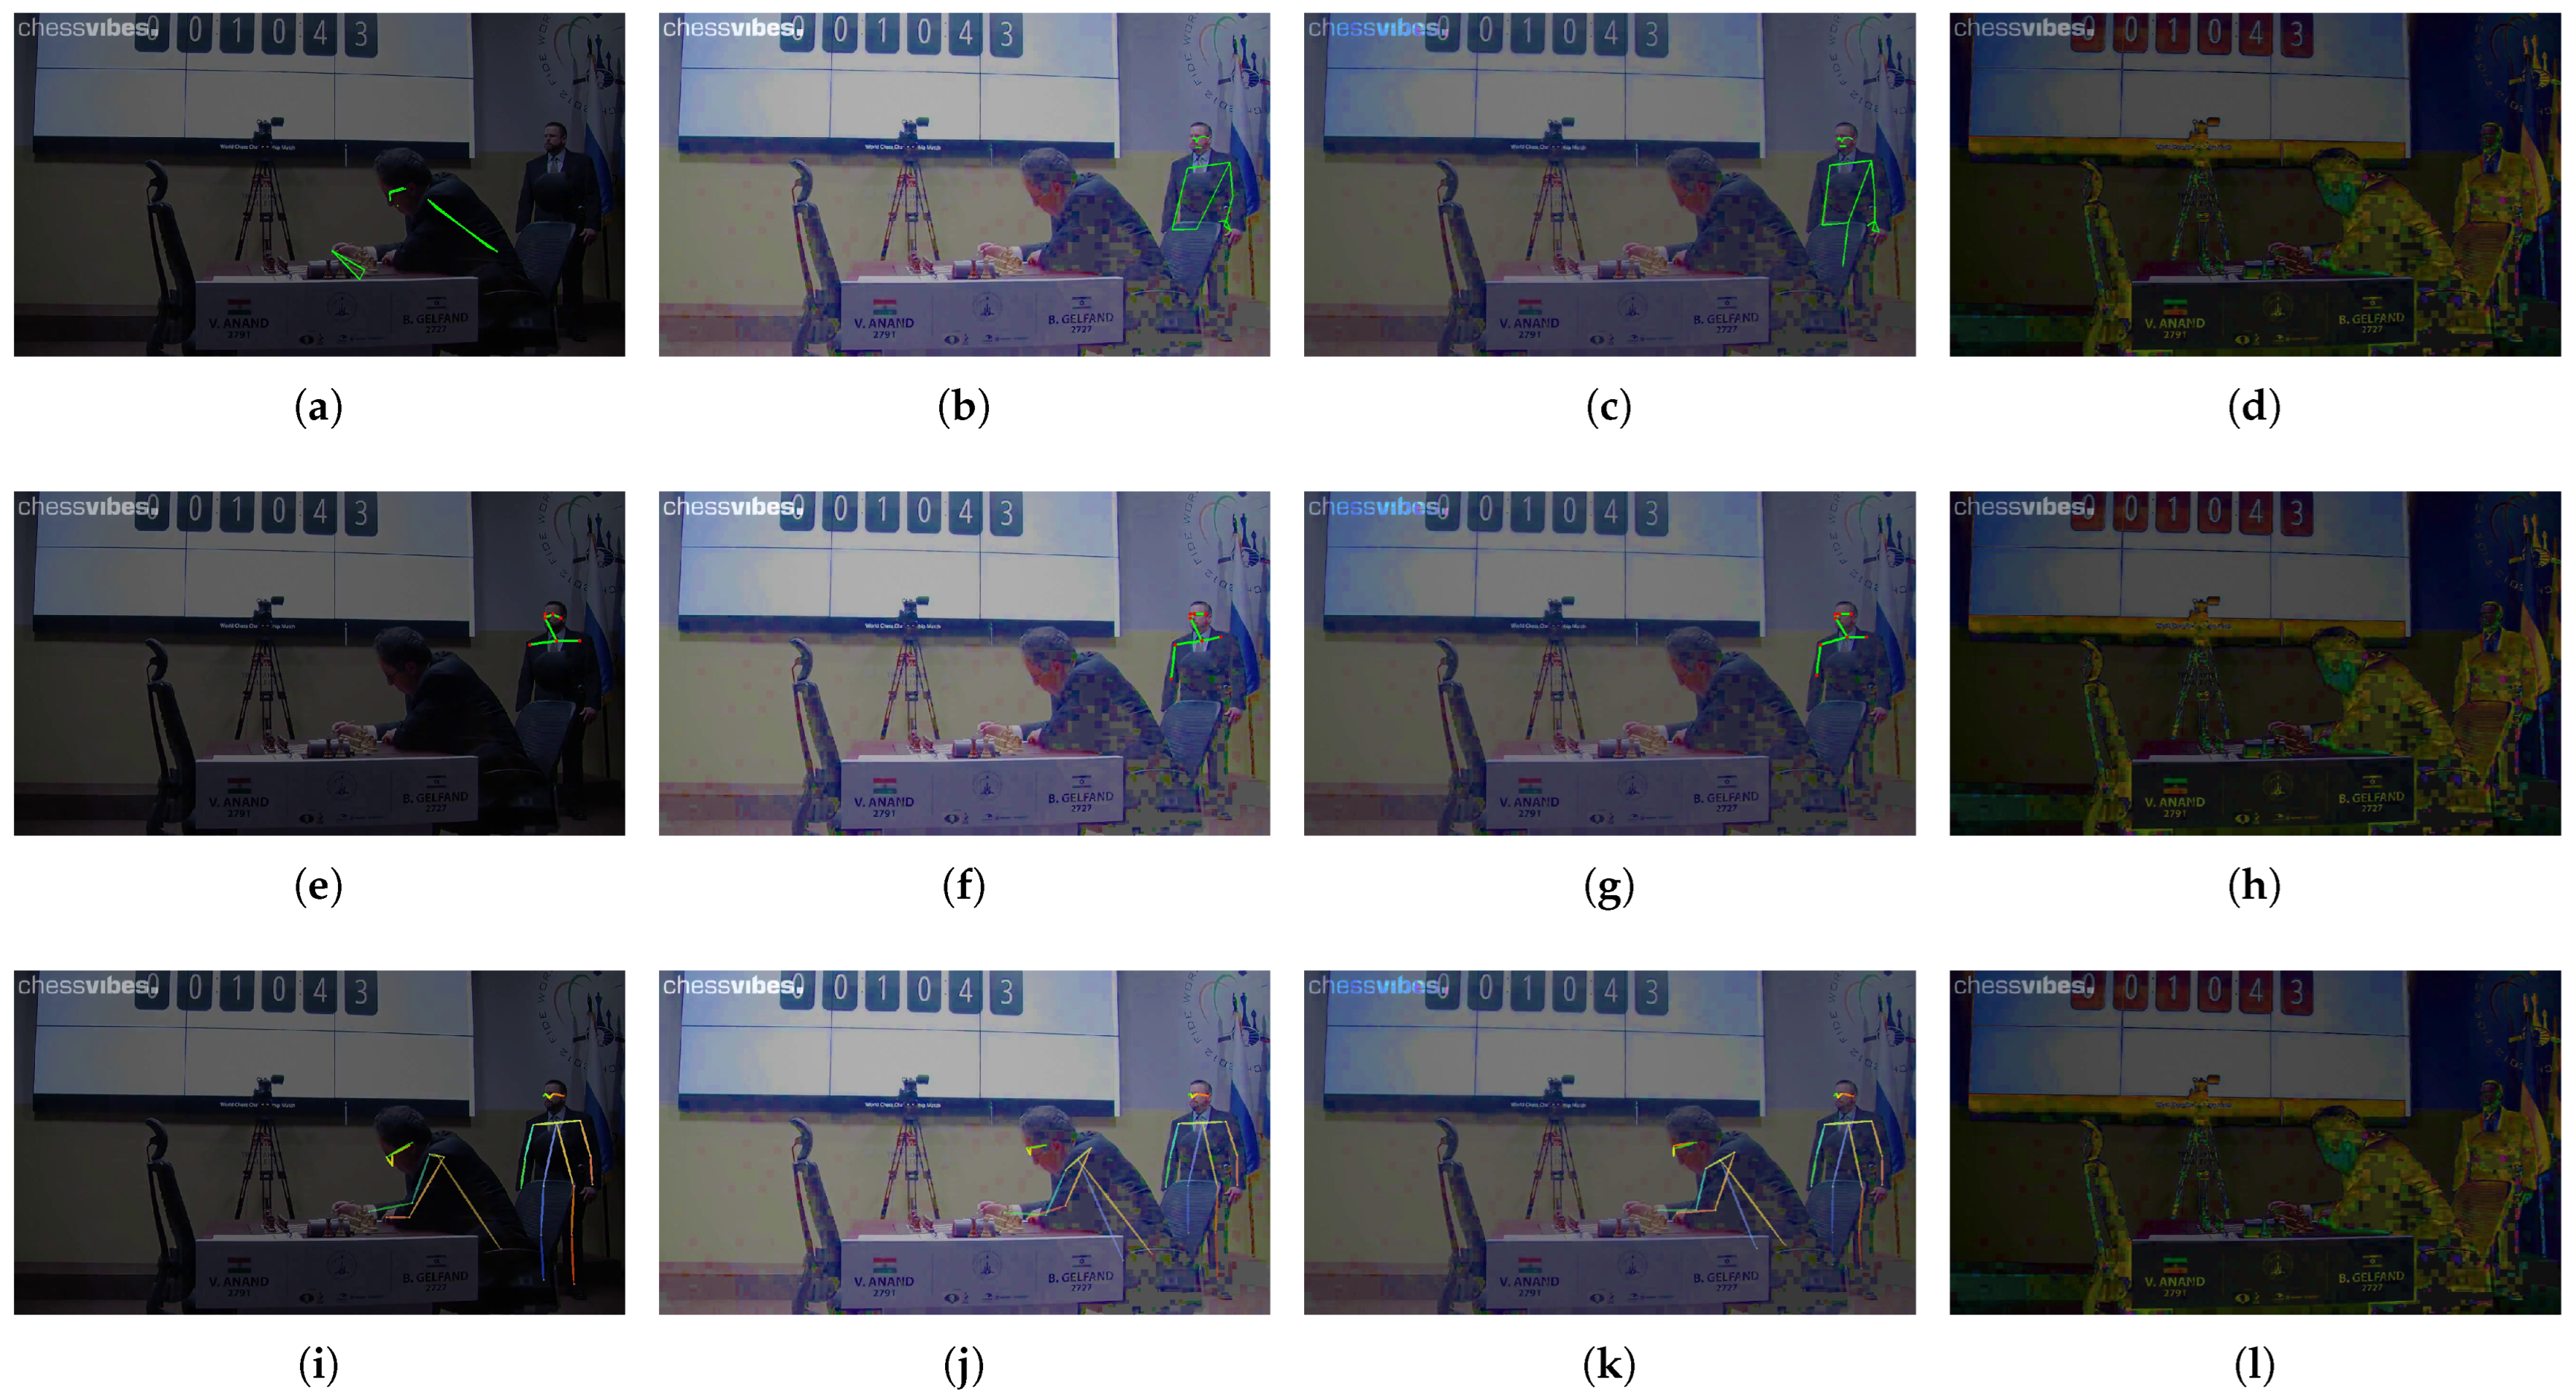
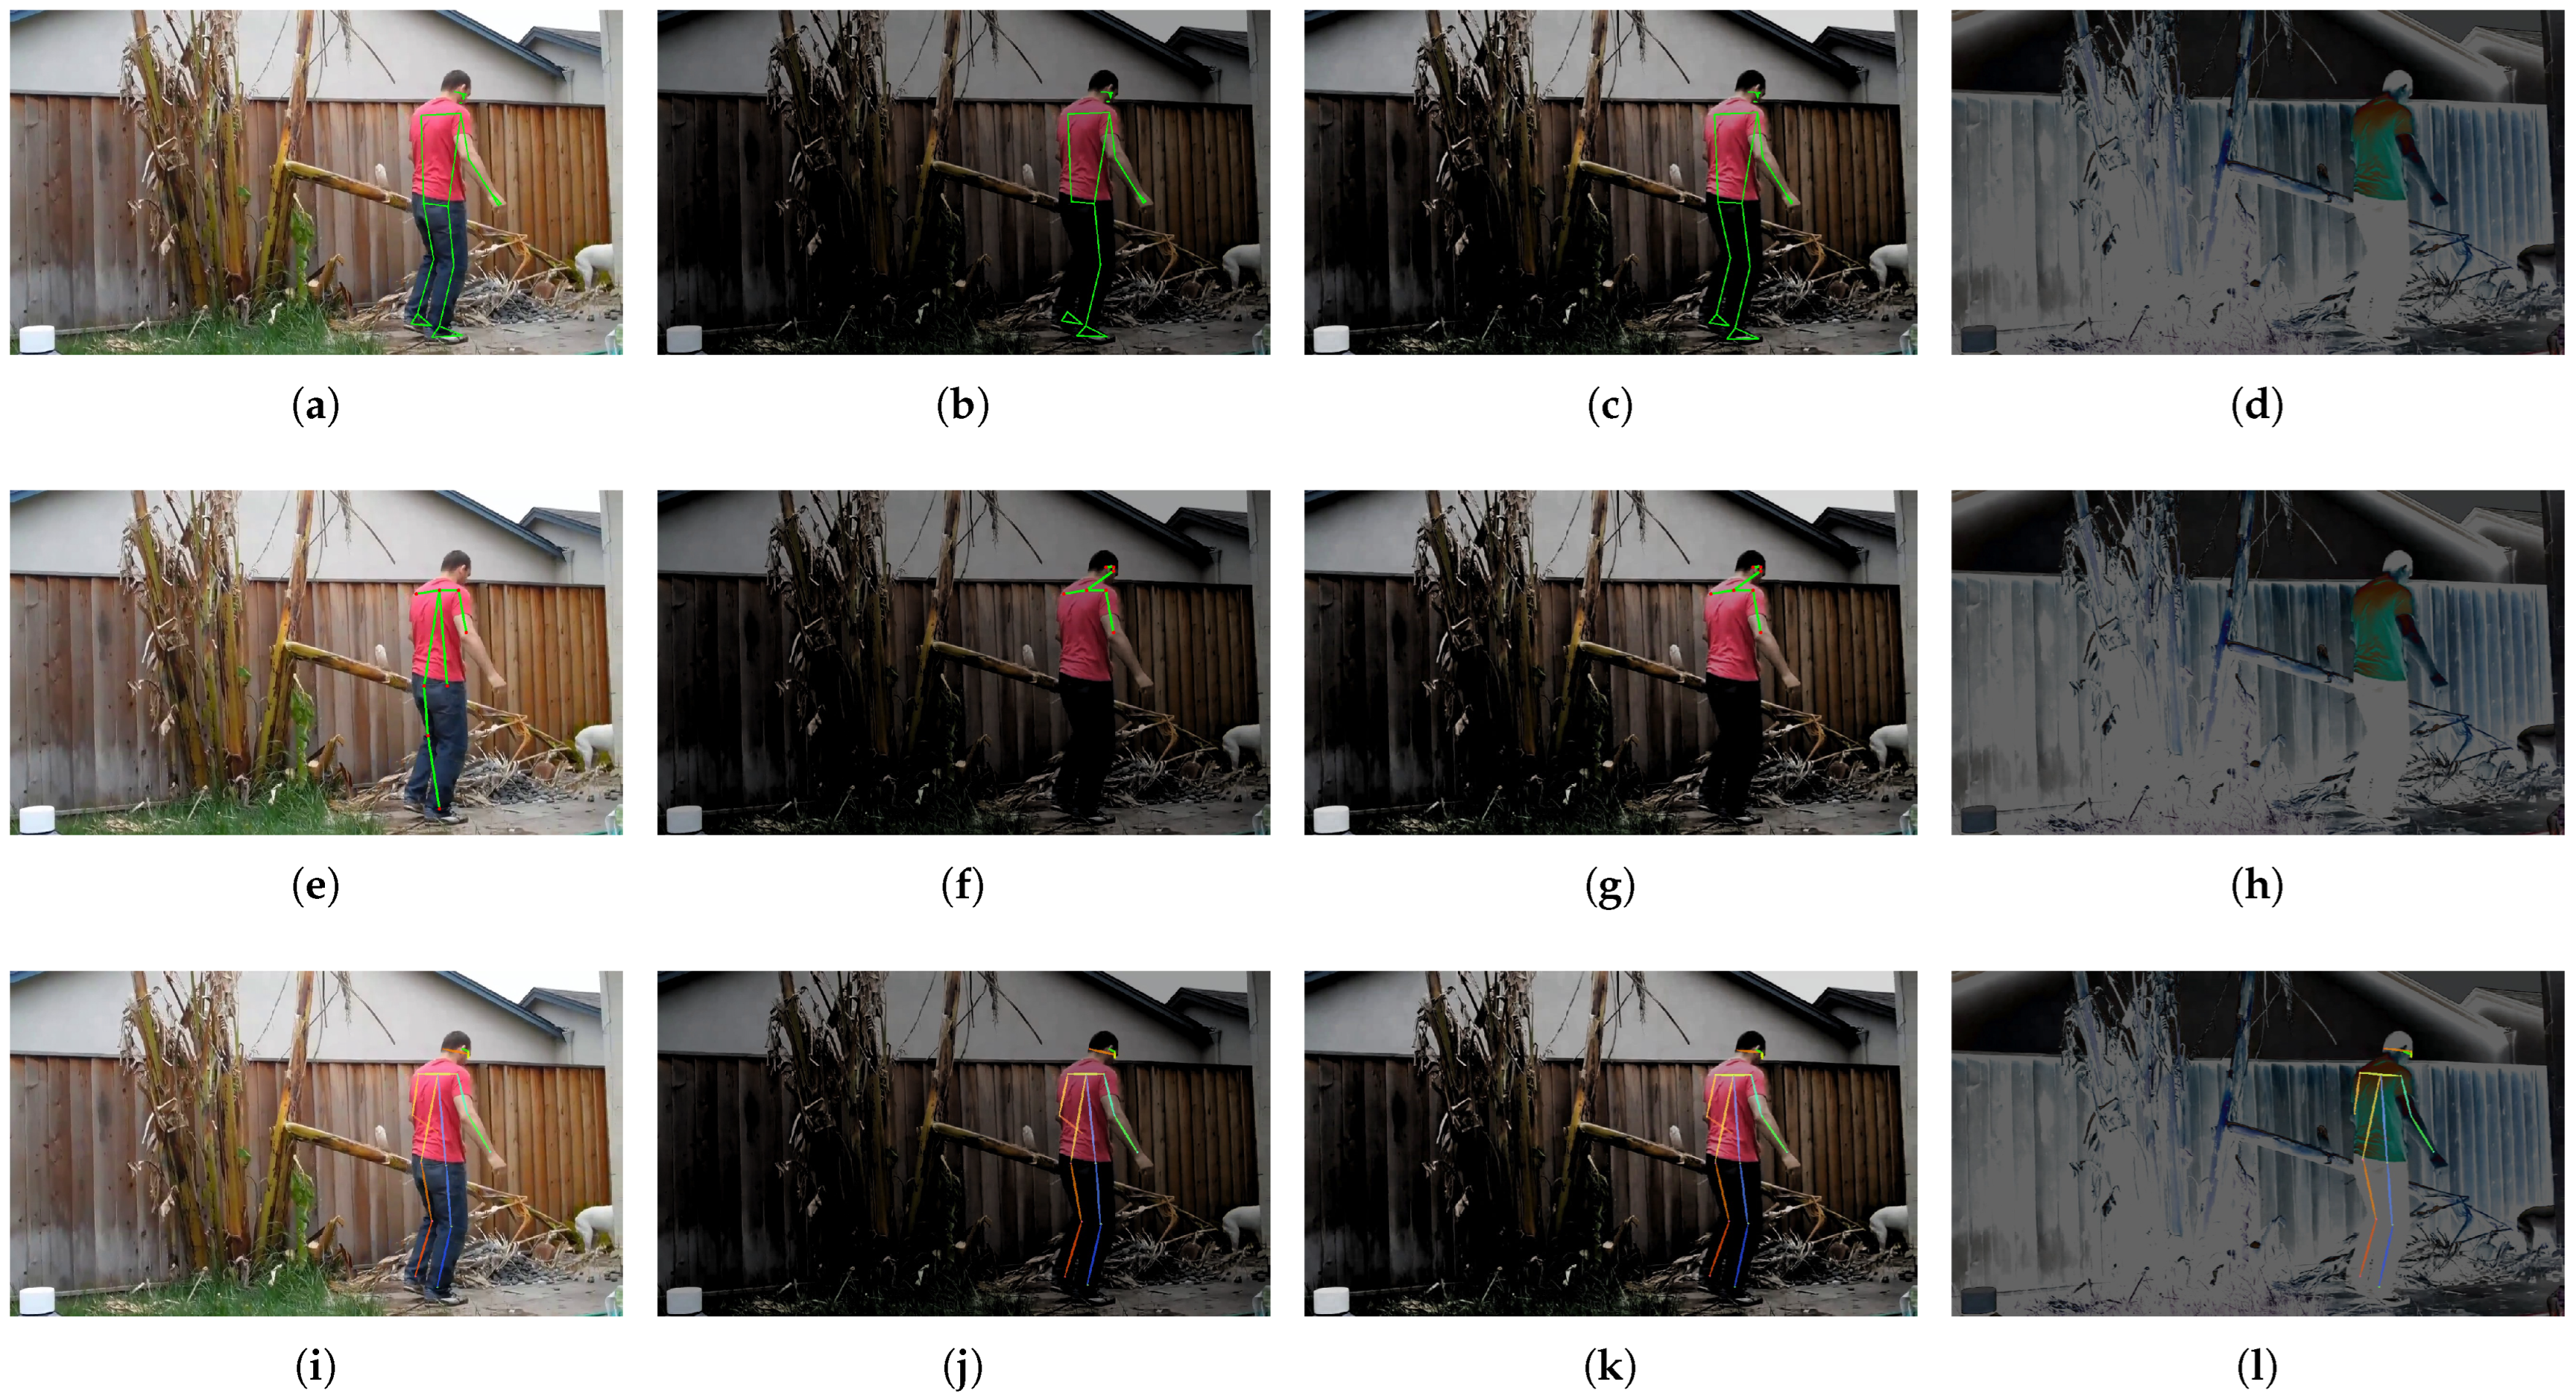
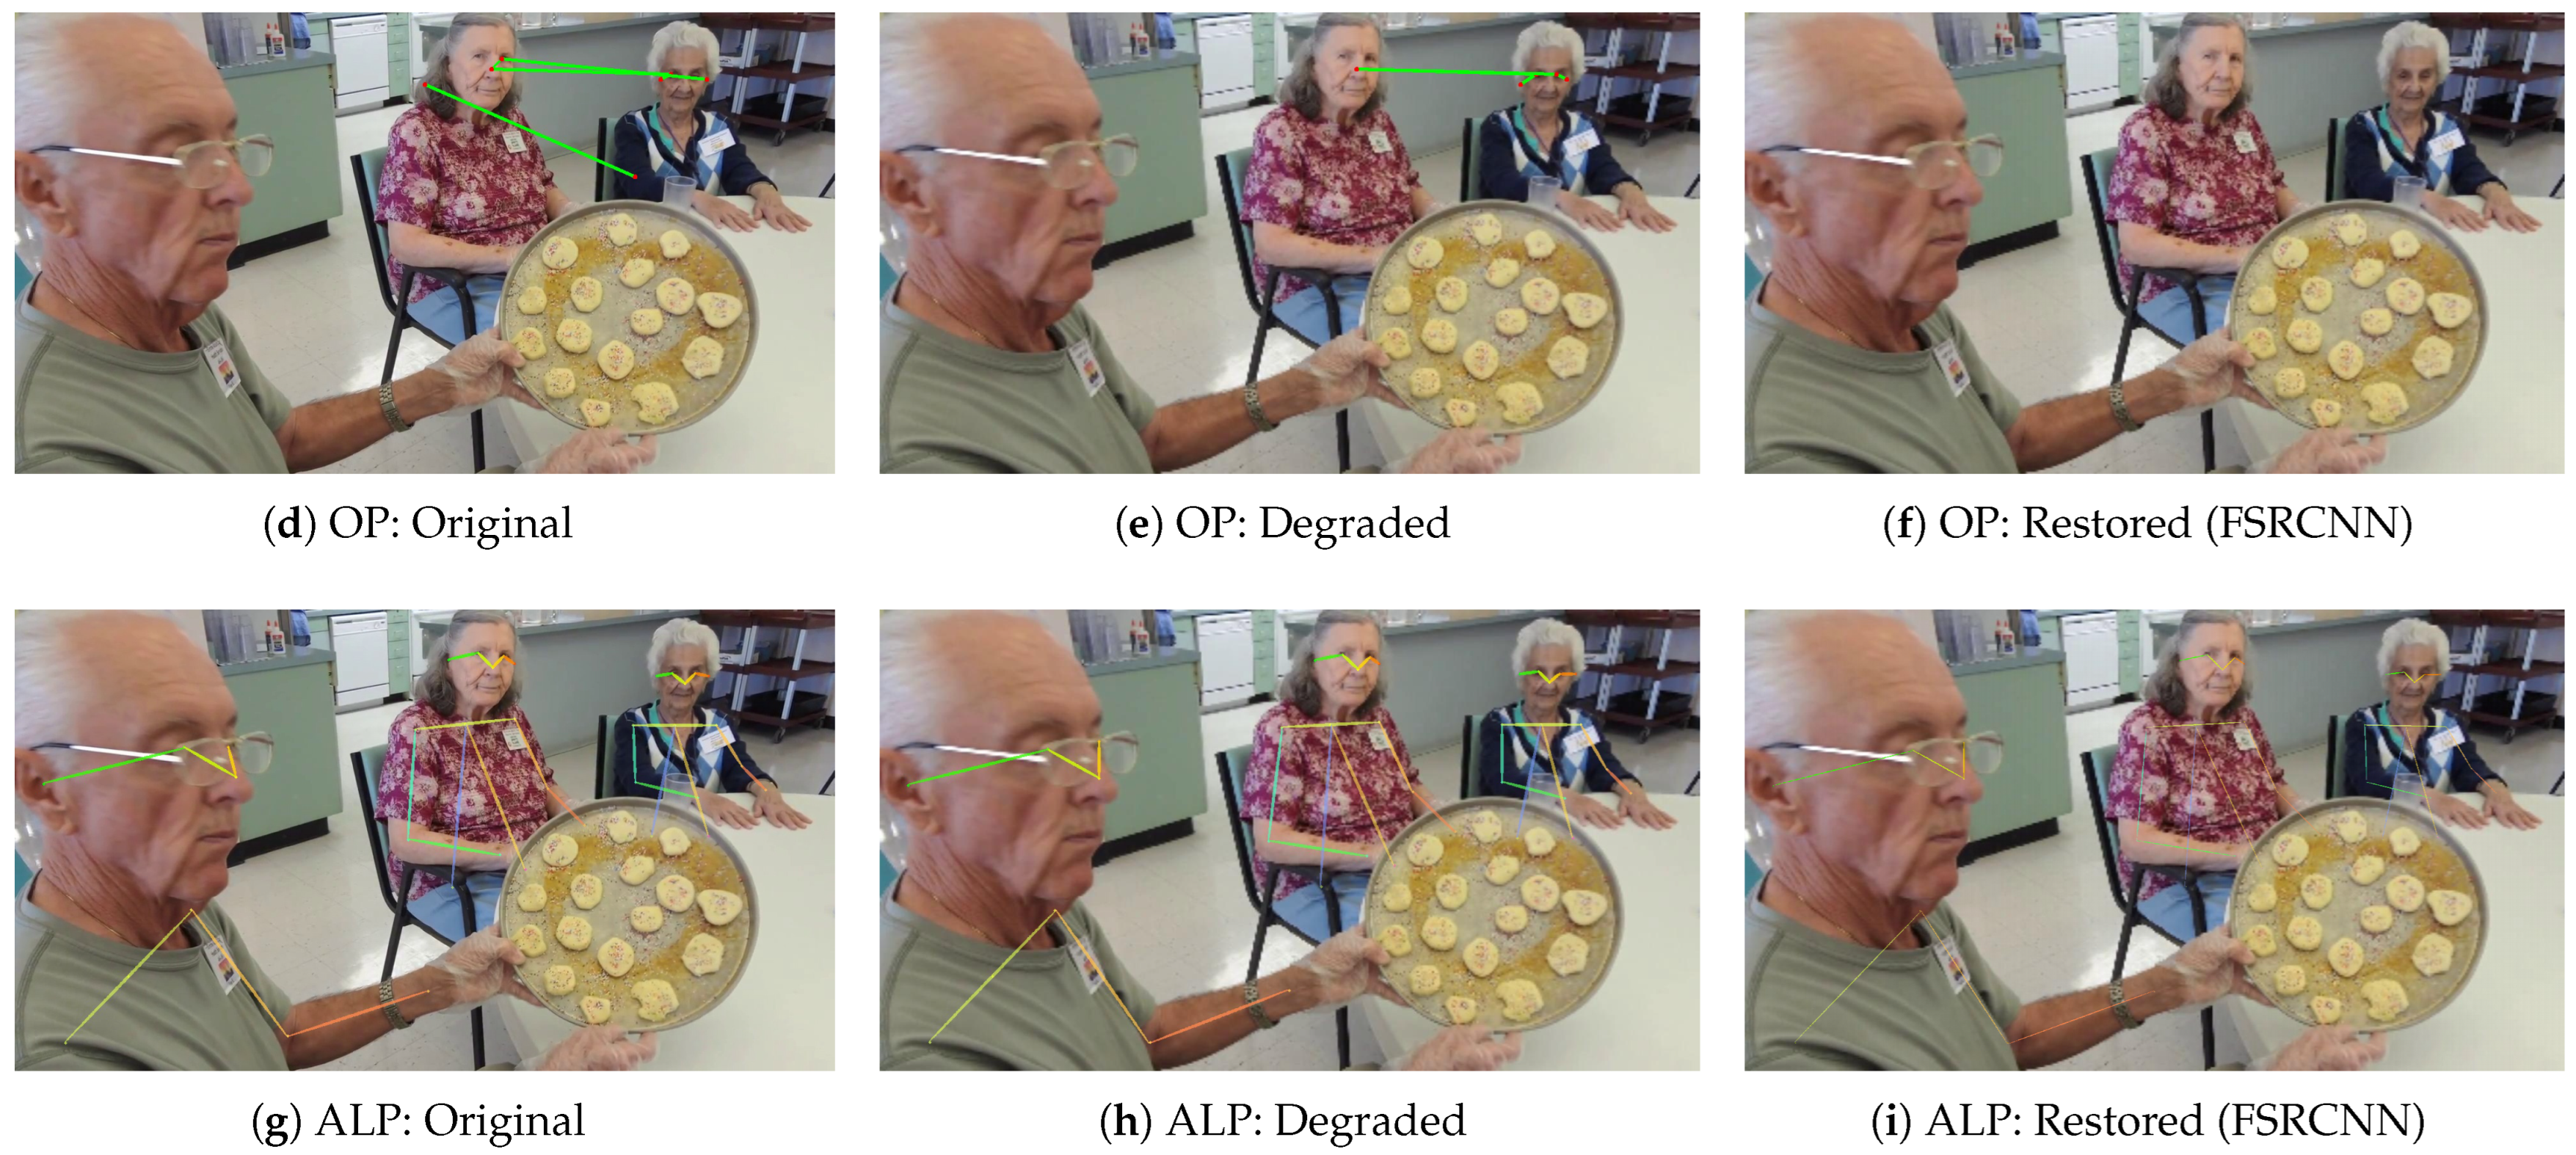
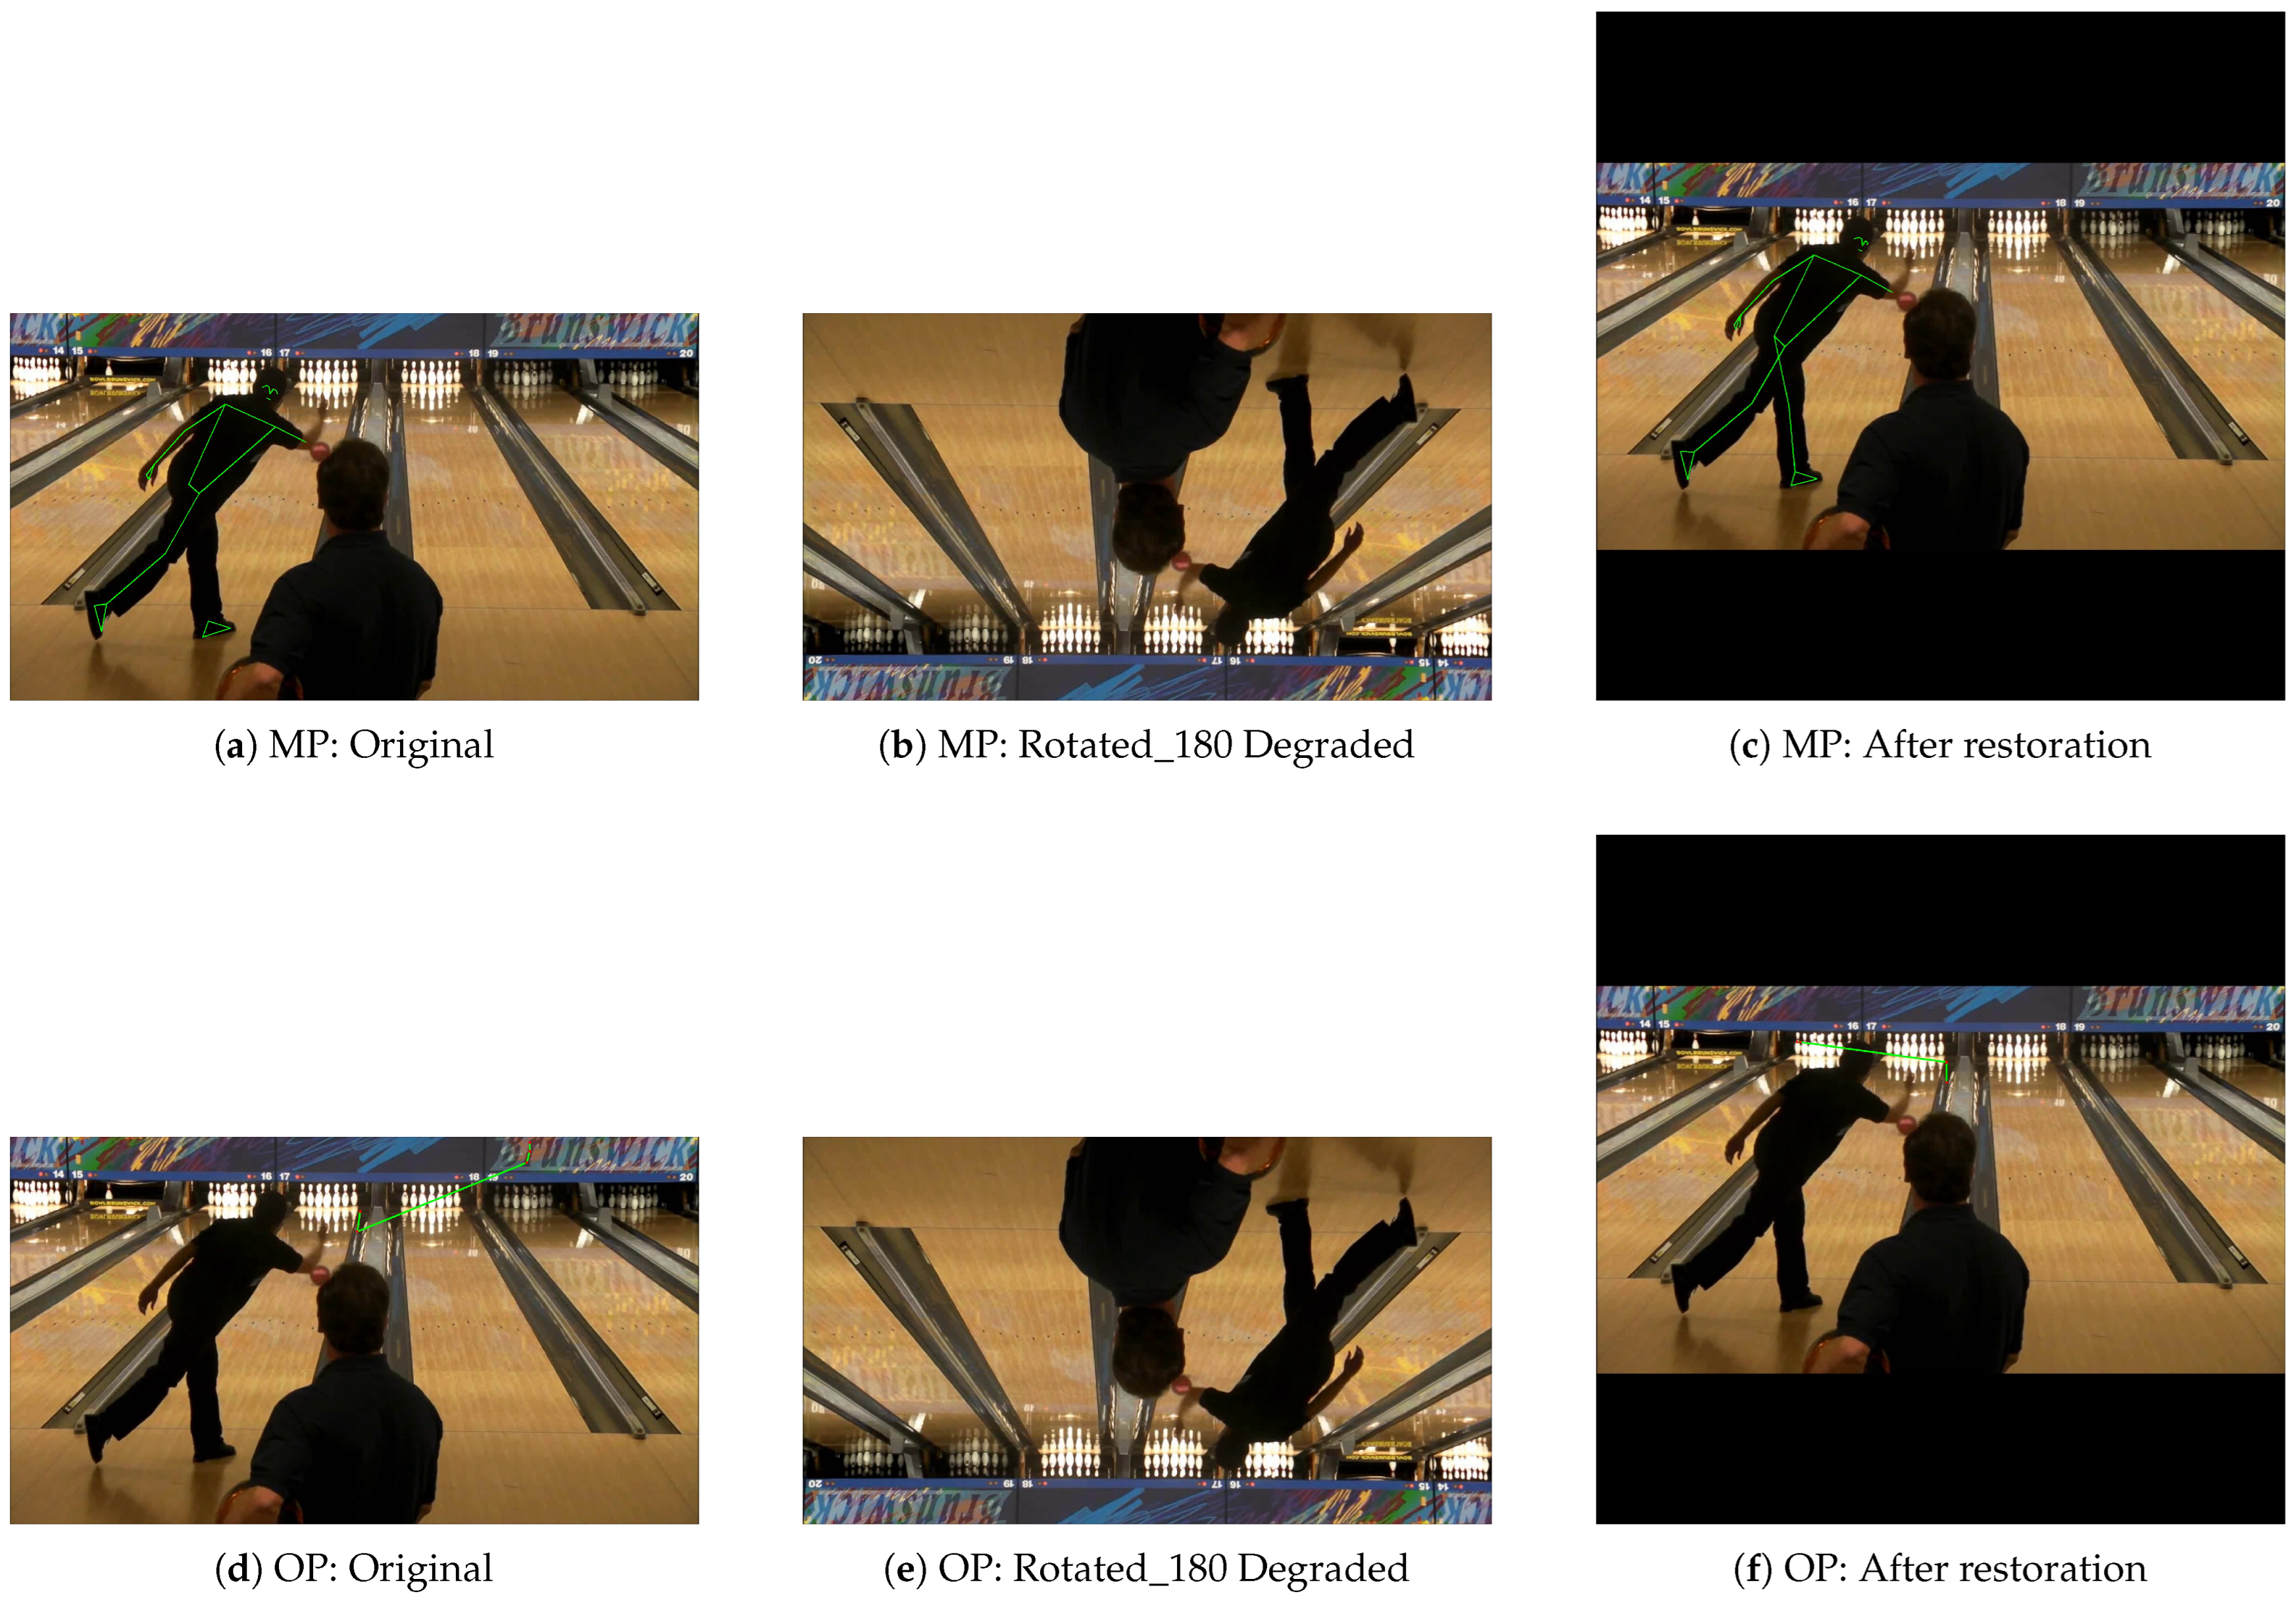
Before restoration, the applied degradations significantly reduce the model’s accuracy, sometimes making it impossible to detect landmarks. However, once the degradation is reversed, the model’s ability to identify and outline landmarks improves, often closely resembling the original image, although accuracy may still vary across different cases. The actual run time for all types of degradation, before and after restoration, is presented in Figure 8, Figure 9, Figure 10 and Figure 11.
Figure 8. Comparison of brightness increasing degradation and restoration across HPE models. Each row shows original, degraded, and restoration results using Cloudinary and OpenCV for (ad) MP, (eh) OP, and (il) ALP. (a) MP: Original; (b) MP: Degraded; (c) MP: Cloudinary (after restoration); (d) MP: OpenCV (after restoration); (e) OP: Original; (f) OP: Degraded; (g) OP: Cloudinary (after restoration); (h) OP: OpenCV (after restoration); (i) ALP: Original; (j) ALP: Degraded; (k) ALP: Cloudinary (after restoration); (l) ALP: OpenCV (after restoration).
Figure 9. Comparison of brightness decreasing degradation and restoration across HPE models. Each row shows original, degraded, and restoration results using Cloudinary and OpenCV for (ad) MP, (eh) OP, and (il) ALP. (a) MP: Original; (b) MP: Degraded; (c) MP: Cloudinary (after restoration); (d) MP: OpenCV (after restoration); (e) OP: Original; (f) OP: Degraded; (g) OP: Cloudinary (after restoration); (h) OP: OpenCV (after restoration); (i) ALP: Original; (j) ALP: Degraded; (k) ALP: Cloudinary (after restoration); (l) ALP: OpenCV (after restoration).
Figure 10. Comparison of low-resolution degradation and restoration across HPE models. Each row shows original, degraded, and restored images using FSRCNN for (ac) MP, (df) OP, and (gi) ALP.
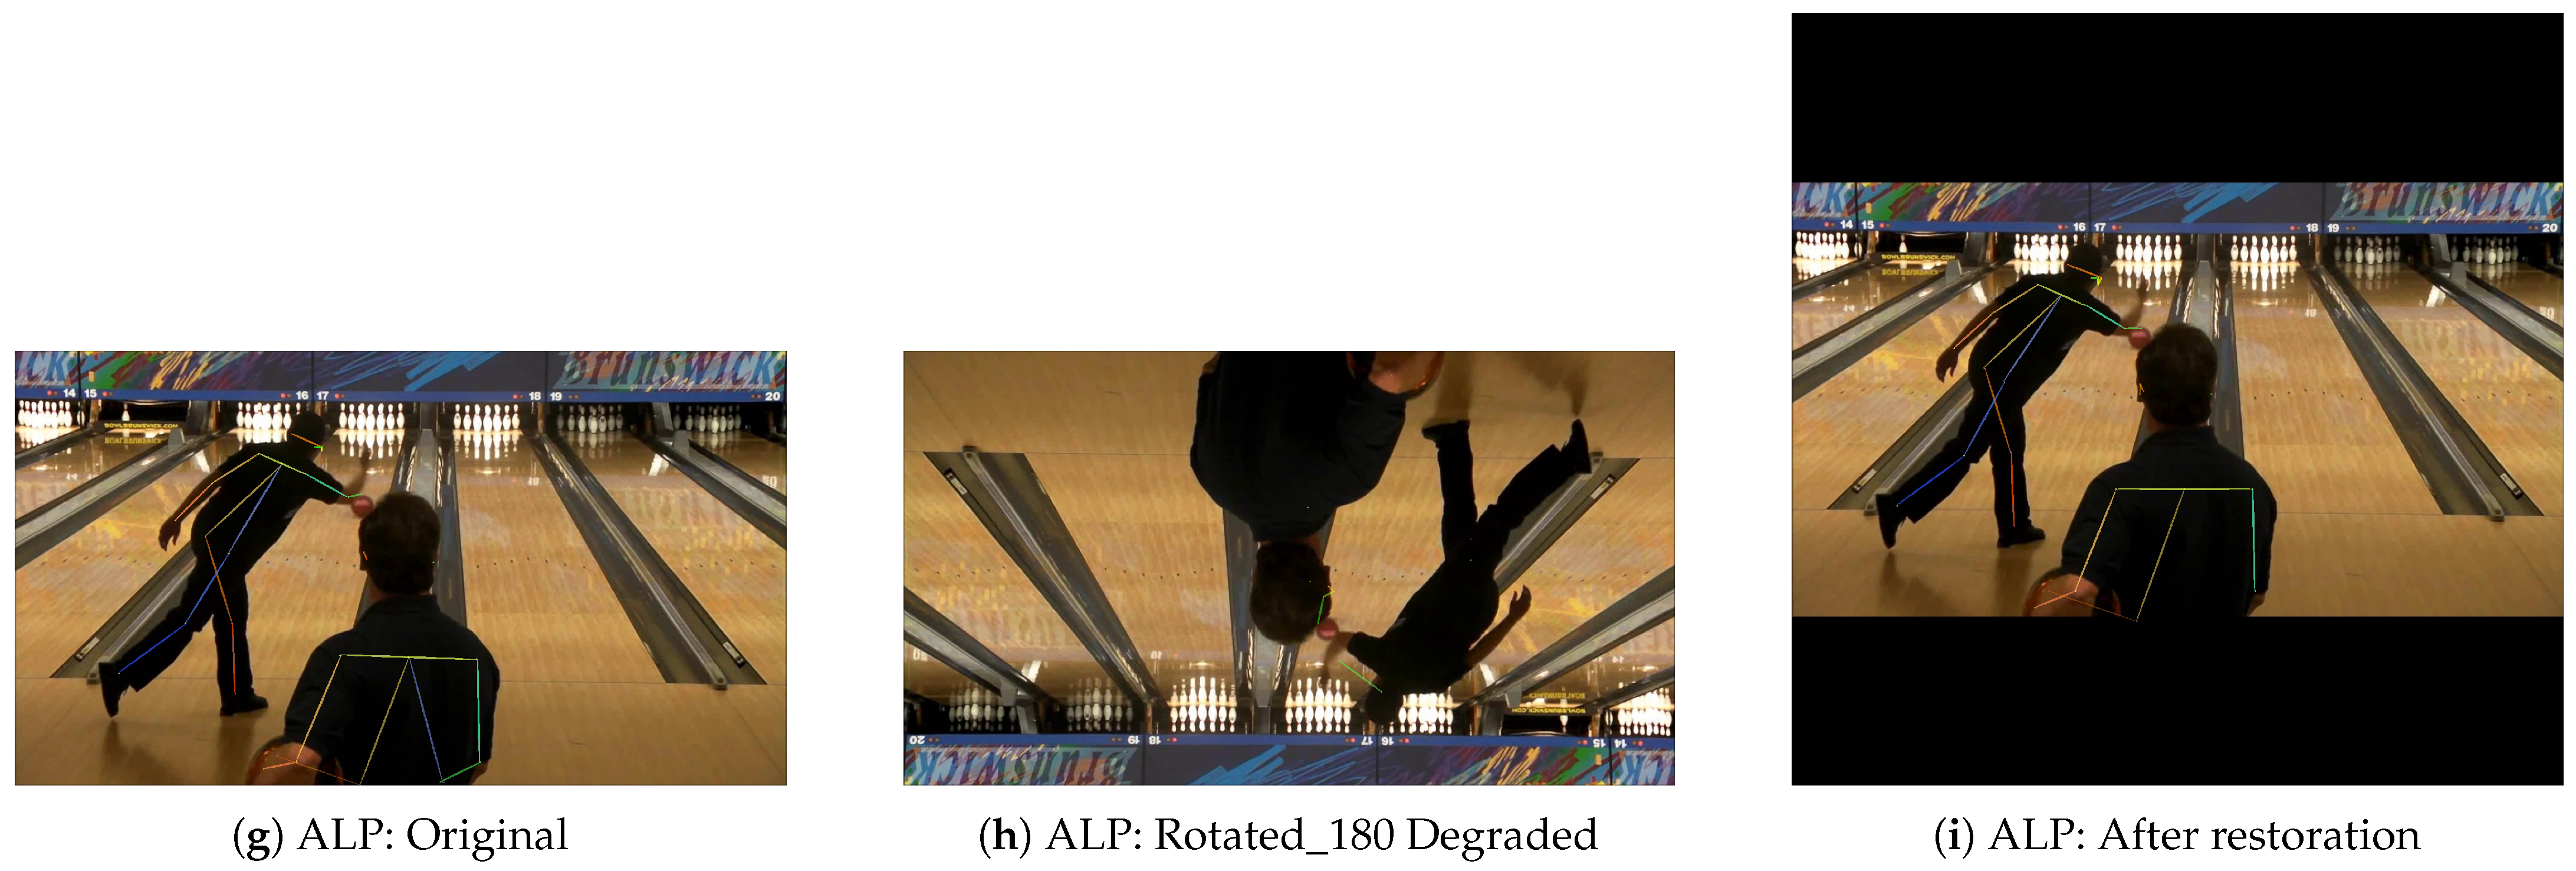
Figure 11. Performance of rotation 180 degree degradation type across HPE models. Each row shows: original image, degraded image, and restoration result. (ac): MP; (df): OP; (gi): ALP.
The visual results, which are the actual output at the run time, illustrate how different types of degradation impact the performance of the HPE models MP, OP, and ALP. As seen in Figure 8b,f,j for brightness increase, Figure 9b,f,j for brightness decrease, Figure 10b,e,h for resolution reduction, and Figure 11b,e,h for rotation 180 as a sample for rotation degradation type, whether all landmarks are detected or not, the comparison is always made against the original images as ground truth techniques. Figure 8c,d,g,h,k,l for brightness increase, Figure 9c,d,g,h,k,l for brightness decrease, Figure 10c,f,i for resolution reduction, and Figure 11c,f,h for rotation show that use of these restoration techniques has resulted in a significant improvement in accuracy of HPE models MP, OP, and ALP. Although not all such output from these models is consistently identical with the original image (ground truth), there exist cases where restored images actually outperform ground truth. That fact is recognized as having great value, as it sets a benchmark for future researchers seeking further precision improvements within this area. However, Figure 12 and Figure 13 depict the overall performance in three HPE models (MP, OP, and ALP) for resolution, brightness, and rotation) using MobileNetV2 classifier’s test set.
Figure 12. Performance comparison of three HPE models (MP, OP, and ALP) under resolution and brightness variations using MobileNetV2 classifier’s test set.
Figure 13. Performance comparison of three HPE models (MP, OP, and ALP) under rotation variations using MobileNetV2 classifier’s test set.

5. Limitation

The analysis of the HPE models (MP, OP, and ALP) reveals significant errors, indicating that degradation factors such as low resolution, brightness variation, and rotation critically degrade the performance of HPE models when applied to degraded datasets compared to non-degraded datasets. Moreover, the results substantiate the effectiveness in restoration through comparisons between before and after-restoration performance. In terms of brightness degradation, Cloudinary in Section 2.3 demonstrates notable effectiveness, particularly in minimizing errors for MP when brightness is reduced especially in the Decrease_110 class. For OP, Cloudinary shows strong performance in the Increase_80 and Decrease_110 classes, while OpenCV outperforms in Increase_80, Increase_90, and Increase_100. While for ALP, Cloudinary shows the increase of the performance in Increase_100, Decrease_100, and Decrease_110 and for OpenCV, performance gains are observed for the improvement for Decrease_100 and Decrease_110. This indicates that the effectiveness of each method is limited to specific brightness classes, which in turn restricts the overall robustness of HPE detection under varying brightness conditions.
Regarding rotation degradation, all classifiers—including Tuned_RotNet, RotNetOfficial, and MobileNetV2—fail to improve performance for MP and ALP. However, for OP, improvements are explicitly clearly observed in the Rotate_90 and Rotate_270 classes. MobileNetV2 yields the most substantial error reductionachieves the most significant reduction in error, followed by RotNetOfficial and then Tuned_RotNet. In addition, the average error rate for ALP is smaller than MP and OP even if there is no improvement before and after restoration but the small average error indicates that the model works largely almost good in detecting more landmarks than MP and OP. Again, the performance gains are constrained to particular rotation classes, emphasizing the class-specific nature of each method’s success and underscoring a key limitation in the model’s generalizability of HPE detection.
Conversely, in the case of resolution degradation, applying FSRCNN leads to a dramatic increase in error for all models MP, OP, and ALP, suggesting that the restoration technique is ineffective and even detrimental in low-resolution scenarios. These findings underscore that while restoration methods and classifiers can be effective, their benefits are often confined to specific degradation types and classes, which limits the overall consistency and reliability of HPE detection systems.
For assessing whether restoration actually reduces the average error in the performance of the HPE models, a comparison in the performances before and after the restoration of degraded images were performed. Predicting landmarks to be as exact as possible in degraded images also means our target is to establish how restoration improves the prediction to at least show its effectiveness.
There are many issues with the existing approach, especially in the repair process. However, black padding added in the process of restoring the rotated image to its original location could negatively influence the landmarks’ localization. On brightness changes, as already stated in the case of Cloudinary in Section 2.3 or OpenCV, both discussed in Section 2.3, they are worked well for certain types of brightness degradation; however, they now do not follow for the others. Further adjustments need to be made to cover beyond the original class and also increase the accuracy. Likewise, for low-resolution images, improvements should be performed on the algorithm, so that it could support more scaling variations since most algorithms currently apply with fixed-scale variations like two, three, and four times, which limits its adoption. Moreover, its performance against is much worse than the brightness and rotation.

6. Conclusions and Future Work

HPE is becoming increasingly important in fields such as healthcare, sports, security, and virtual reality applications. In HPE, prediction of the landmarks has to be precise, since all the processes following rely on this fundamental step. Primary factors influencing major factors observed in affecting HPE models include brightness, resolution, and rotation.
A new dataset was introduced, which, for the first time, included degraded images—a previously overlooked dimension in this research area, and a factor overlooked until now in the field. Thereafter, classifiers were developed for identifying the type of degradation in an image, and restoration algorithms were applied accordingly for each unique degradation type. Then, the restored images were evaluated using the HPE models, MP, OP, and ALP, before and after the restoration process to analyze the improvement in performance.
Our experiments indicate the possibility of improving the restoration efficacy by employing rotated images; however, we did notice minor padding artefacts in the restored images, indicating a clear avenue for subsequent refinement suggesting an obvious potential for further improvement. While successful performance was obtained for cases with brightness and low-resolution degradations, the performance was not consistently achieved for all conditions, thus opening the door for further optimizations.
We look forward to future research activities that will require an exhaustive study of the algorithms used for reconstructing degraded images, along with an exploration of other types of degradation not considered in this work. In addition, the algorithms introduced show limitations in the detection of full joints in all cases; thus, there is an increasing imperative need for improved methodologies in the field of multi-person detection. Although models like MP achieve acceptable performance in single-person cases, they underperform in multi-person settings, while ALP achieves high performance in detecting single or multi-person images.Therefore, it becomes necessary to create new concepts intended to resolve these issues, especially with the aim of improving the performance of HPE models.

Author Contributions

Conceptualization, A.S. and H.M.; methodology, N.E.E., A.S. and H.M.; software, N.E.E. and A.A.; validation, A.S., A.A. and H.M.; formal analysis, N.E.E. and A.A.; investigation, A.S.; resources, A.S.; data curation, N.E.E., A.A. and H.M.; writing—original draft preparation, N.E.E.; writing—review and editing, A.S.; A.A. and H.M.; visualization, N.E.E., A.S. and H.M.; supervision, A.S., H.M. and A.A.; project administration, A.S.; funding acquisition, A.S. All authors have read and agreed to the published version of the manuscript.

Funding

This research was funded by a research grant from the Omani Ministry of Higher Education, Research, and Innovation under the project number BFP/RGP/ICT/23/382.

Institutional Review Board Statement

Not applicable.

Data Availability Statement

The dataset supporting the conclusions of this article is available from the corresponding author upon reasonable request.

Acknowledgments

Sincere appreciation is extended to Ahmed Fathallah for his valuable guidance and continuous support during the implementation phase. During the preparation of this manuscript, the authors used Grammarly web version and ChatGPT version 4o for the purposes of grammar correction. The authors have reviewed and edited the output and take full responsibility for the content of this publication.

Conflicts of Interest

The authors declare no conflicts of interest.

References

  1. Guo, W.; Pan, Z.; Xi, Z.; Tuerxun, A.; Feng, J.; Zhou, J. Sports analysis and VR viewing system based on player tracking and pose estimation with multimodal and multiview sensors. arXiv 2024, arXiv:2405.01112. [Google Scholar] [CrossRef]
  2. Zhou, L.; Meng, X.; Liu, Z.; Wu, M.; Gao, Z.; Wang, P. Human pose-based estimation, tracking and action recognition with deep learning: A survey. arXiv 2023, arXiv:2310.13039. [Google Scholar] [CrossRef]
  3. Chen, H.; Feng, R.; Wu, S.; Xu, H.; Zhou, F.; Liu, Z. 2D human pose estimation: A survey. Multimed. Syst. 2023, 29, 3115–3138. [Google Scholar] [CrossRef]
  4. Stenum, J.; Cherry-Allen, K.M.; Pyles, C.O.; Reetzke, R.D.; Vignos, M.F.; Roemmich, R.T. Applications of pose estimation in human health and performance across the lifespan. Sensors 2021, 21, 7315. [Google Scholar] [CrossRef]
  5. Andriluka, M.; Pishchulin, L.; Gehler, P.; Schiele, B. 2D human pose estimation: New benchmark and state of the art analysis. In Proceedings of the IEEE Conference on Computer Vision and Pattern Recognition, Columbus, OH, USA, 23–28 June 2014; pp. 3686–3693. [Google Scholar]
  6. Sapp, B.; Taskar, B. Modec: Multimodal decomposable models for human pose estimation. In Proceedings of the IEEE Conference on Computer Vision and Pattern Recognition, Portland, OR, USA, 23–28 June 2013; pp. 3674–3681. [Google Scholar]
  7. Tan, F.; Zhai, M.; Zhai, C. Foreign object detection in urban rail transit based on deep differentiation segmentation neural network. Heliyon 2024, 10, e37072. [Google Scholar] [CrossRef] [PubMed]
  8. Tang, Y.; Yi, J.; Tan, F. Facial micro-expression recognition method based on CNN and transformer mixed model. Int. J. Biom. 2024, 16, 463–477. [Google Scholar] [CrossRef]
  9. Lugaresi, C.; Tang, J.; Nash, H.; McClanahan, C.; Uboweja, E.; Hays, M.; Zhang, F.; Chang, C.L.; Yong, M.G.; Lee, J.; et al. MediaPipe: A framework for building perception pipelines. arXiv 2019, arXiv:1906.08172. [Google Scholar] [CrossRef]
  10. Singh, A.K.; Kumbhare, V.A.; Arthi, K. Real-time human pose detection and recognition using MediaPipe. In Advances in Intelligent Systems and Computing, Proceedings of the International Conference on Soft Computing and Signal Processing, Hyderabad, India, 18–19 June 2021; Springer: Singapore, 2021; pp. 145–154. [Google Scholar]
  11. Kulkarni, S.; Deshmukh, S.; Fernandes, F.; Patil, A.; Jabade, V. Poseanalyser: A survey on human pose estimation. SN Comput. Sci. 2023, 4, 136. [Google Scholar] [CrossRef]
  12. Cao, Z.; Simon, T.; Wei, S.E.; Sheikh, Y. Realtime multi-person 2D pose estimation using part affinity fields. In Proceedings of the IEEE Conference on Computer Vision and Pattern Recognition, Honolulu, HI, USA, 21–26 July 2017; pp. 7291–7299. [Google Scholar]
  13. Kitamura, T.; Teshima, H.; Thomas, D.; Kawasaki, H. Refining OpenPose with a new sports dataset for robust 2D pose estimation. In Proceedings of the IEEE/CVF Winter Conference on Applications of Computer Vision, Waikoloa, HI, USA, 3–8 January 2022; pp. 672–681. [Google Scholar]
  14. Roggio, F.; Trovato, B.; Sortino, M.; Musumeci, G. A comprehensive analysis of the machine learning pose estimation models used in human movement and posture analyses: A narrative review. Heliyon 2024, 10, e39977. [Google Scholar] [CrossRef]
  15. Dedhia, U.; Bhoir, P.; Ranka, P.; Kanani, P. Pose estimation and virtual gym assistant using MediaPipe and machine learning. In Proceedings of the 2023 International Conference on Network, Multimedia and Information Technology (NMITCON), Bengaluru, India, 1–2 September 2023; pp. 1–7. [Google Scholar]
  16. Fang, H.S.; Li, J.; Tang, H.; Xu, C.; Zhu, H.; Xiu, Y.; Li, Y.L.; Lu, C. Alphapose: Whole-body regional multi-person pose estimation and tracking in real-time. IEEE Trans. Pattern Anal. Mach. Intell. 2022, 45, 7157–7173. [Google Scholar] [CrossRef]
  17. Zhang, Z.; Wan, L.; Xu, W.; Wang, S. Estimating a 2D pose from a tiny person image with super-resolution reconstruction. Comput. Electr. Eng. 2021, 93, 107192. [Google Scholar] [CrossRef]
  18. Johnson, S.; Everingham, M. Clustered Pose and Nonlinear Appearance Models for Human Pose Estimation. In Proceedings of the British Machine Vision Conference (BMVC), Aberystwyth, UK, 31 August–3 September 2010; British Machine Vision Association: Durham, UK, 2010; p. 5. [Google Scholar]
  19. Sun, X.; Li, F.; Bai, H.; Ni, R.; Zhao, Y. SRPose: Low-resolution human pose estimation with super-resolution. In Smart Innovation, Systems and Technologies, Proceedings of the International Conference on Intelligent Information Hiding and Multimedia Signal Processing, Kitakyushu, Japan, 16–18 December 2022; Springer: Singapore, 2022; pp. 343–353. [Google Scholar]
  20. Lin, T.Y.; Maire, M.; Belongie, S.; Hays, J.; Perona, P.; Ramanan, D.; Dollár, P.; Zitnick, C.L. Microsoft COCO: Common objects in context. In Computer Vision—Proceedings of the ECCV 2014: 13th European Conference, Zurich, Switzerland, 6–12 September 2014; Proceedings, Part V 13; Springer: Singapore, 2014; pp. 740–755. [Google Scholar]
  21. Tran, T.Q.; Nguyen, G.V.; Kim, D. Simple multi-resolution representation learning for human pose estimation. In Proceedings of the 2020 25th International Conference on Pattern Recognition (ICPR), Milan, Italy, 10–15 January 2021; pp. 511–518. [Google Scholar]
  22. Yun, K.; Park, J.; Cho, J. Robust human pose estimation for rotation via self-supervised learning. IEEE Access 2020, 8, 32502–32517. [Google Scholar] [CrossRef]
  23. Gidaris, S.; Singh, P.; Komodakis, N. Unsupervised representation learning by predicting image rotations. arXiv 2018, arXiv:1803.07728. [Google Scholar] [CrossRef]
  24. Kim, J.W.; Choi, J.Y.; Ha, E.J.; Choi, J.H. Human pose estimation using MediaPipe pose and optimization method based on a humanoid model. Appl. Sci. 2023, 13, 2700. [Google Scholar] [CrossRef]
  25. SIMOES, W.; REIS, L.; ARAUJO, C.; MAIA JR, J. Accuracy assessment of 2D pose estimation with MediaPipe for physiotherapy exercises. Procedia Comput. Sci. 2024, 251, 446–453. [Google Scholar] [CrossRef]
  26. Wang, K.; Wang, T.; Qu, J.; Jiang, H.; Li, Q.; Chang, L. An end-to-end cascaded image deraining and object detection neural network. IEEE Robot. Autom. Lett. 2022, 7, 9541–9548. [Google Scholar] [CrossRef]
  27. Wang, M.; Liao, L.; Huang, D.; Fan, Z.; Zhuang, J.; Zhang, W. Frequency and content dual stream network for image dehazing. Image Vis. Comput. 2023, 139, 104820. [Google Scholar] [CrossRef]
  28. Kandel, I.; Castelli, M.; Manzoni, L. Brightness as an augmentation technique for image classification. Emerg. Sci. J. 2022, 6, 881–892. [Google Scholar] [CrossRef]
  29. Li, K.; Chen, H.; Huang, F.; Ling, S.; You, Z. Sharpness and brightness quality assessment of face images for recognition. Sci. Program. 2021, 2021, 4606828. [Google Scholar] [CrossRef]
  30. Bengtsson Bernander, K.; Sintorn, I.M.; Strand, R.; Nyström, I. Classification of rotation-invariant biomedical images using equivariant neural networks. Sci. Rep. 2024, 14, 14995. [Google Scholar] [CrossRef]
  31. Dong, W.; Zhang, J.; Zhou, Y.; Gao, L.; Zhang, X. Blind detection of circular image rotation angle based on ensemble transfer regression and fused HOG. Front. Neurorobot. 2022, 16, 1037381. [Google Scholar] [CrossRef]
  32. Szczuko, P. ANN for human pose estimation in low resolution depth images. In Proceedings of the 2017 Signal Processing: Algorithms, Architectures, Arrangements, and Applications (SPA), Poznan, Poland, 20–22 September 2017; pp. 354–359. [Google Scholar]
  33. Szczuko, P. CNN architectures for human pose estimation from a very low resolution depth image. In Proceedings of the 2018 11th International Conference on Human System Interaction (HSI), Gdansk, Poland, 4–6 July 2018; pp. 118–127. [Google Scholar]
  34. Szczuko, P. Very Low Resolution Depth Images of 200,000 Poses–Open Repository. 2018. Available online: https://github.com/szczuko/poses (accessed on 25 October 2025).
  35. Srivastav, V.; Gangi, A.; Padoy, N. Unsupervised domain adaptation for clinician pose estimation and instance segmentation in the operating room. Med. Image Anal. 2022, 80, 102525. [Google Scholar] [CrossRef] [PubMed]
  36. Srivastav, V.; Issenhuth, T.; Kadkhodamohammadi, A.; de Mathelin, M.; Gangi, A.; Padoy, N. MVOR: A multi-view RGB-D operating room dataset for 2D and 3D human pose estimation. arXiv 2018, arXiv:1808.08180. [Google Scholar]
  37. Srivastav, V.; Gangi, A.; Padoy, N. Self-supervision on unlabelled OR data for multi-person 2D/3D human pose estimation. In Lecture Notes in Computer Science, Proceedings of the International Conference on Medical Image Computing and Computer-Assisted Intervention, Lima, Peru, 4–8 October 2020; Springer: Cham, Switzerland, 2020; pp. 761–771. [Google Scholar]
  38. Belagiannis, V.; Wang, X.; Shitrit, H.B.; Hashimoto, K.; Stauder, R.; Aoki, Y.; Kranzfelder, M.; Schneider, A.; Fua, P.; Ilic, S.; et al. Parsing human skeletons in an operating room. Mach. Vis. Appl. 2016, 27, 1035–1046. [Google Scholar] [CrossRef]
  39. Szczuko, P. Deep neural networks for human pose estimation from a very low resolution depth image. Multimed. Tools Appl. 2019, 78, 29357–29377. [Google Scholar] [CrossRef]
  40. Cloudinary. Techniques for Image Enhancement with Cloudinary: A Primer; Cloudinary: London, UK, 2024. [Google Scholar]
  41. Bradski, G.; The OpenCV Team. OpenCV: Open Source Computer Vision Library. 2025. Available online: https://opencv.org/ (accessed on 14 September 2025).
  42. Dong, C.; Loy, C.C.; Tang, X. Accelerating the super-resolution convolutional neural network. In Computer Vision—Proceedings of the ECCV 2016: 14th European Conference, Amsterdam, The Netherlands, 11–14 October 2016; Proceedings, Part II 14; Springer: Cham, Switzerland, 2016; pp. 391–407. [Google Scholar]
  43. Shi, W.; Caballero, J.; Huszár, F.; Totz, J.; Aitken, A.P.; Bishop, R.; Rueckert, D.; Wang, Z. Real-time single image and video super-resolution using an efficient sub-pixel convolutional neural network. In Proceedings of the IEEE Conference on Computer Vision and Pattern Recognition, Las Vegas, NV, USA, 27–30 June 2016; pp. 1874–1883. [Google Scholar]
  44. Lim, B.; Son, S.; Kim, H.; Nah, S.; Lee, K.M. Enhanced deep residual networks for single image super-resolution. In Proceedings of the IEEE Conference on Computer Vision and Pattern Recognition Workshops, Honolulu, HI, USA, 21–26 July 2017; pp. 136–144. [Google Scholar]
  45. Agustsson, E.; Timofte, R. NTIRE 2017 challenge on single image super-resolution: Dataset and study. In Proceedings of the IEEE Conference on Computer Vision and Pattern Recognition Workshops, Honolulu, HI, USA, 21–26 July 2017; pp. 126–135. [Google Scholar]
  46. Reidy, L. Rotate Images Function in Python. Available online: https://gist.github.com/leonardreidy/2dcca95a7c14b485dcee06792c6f14e9 (accessed on 25 October 2025).
  47. Szeliski, R. Computer Vision: Algorithms and Applications; Springer Nature: Berlin/Heidelberg, Germany, 2022. [Google Scholar]
  48. Samkari, E.; Arif, M.; Alghamdi, M.; Al Ghamdi, M.A. Human pose estimation using deep learning: A systematic literature review. Mach. Learn. Knowl. Extr. 2023, 5, 1612–1659. [Google Scholar] [CrossRef]
  49. Yu, B.; Fan, Z.; Xiang, X.; Chen, J.; Huang, D. Universal Image Restoration with Text Prompt Diffusion. Sensors 2024, 24, 3917. [Google Scholar] [CrossRef]
  50. Su, Y.; Chen, D.; Xing, M.; Oh, C.; Liu, X.; Li, J. Coming Out of the Dark: Human Pose Estimation in Low-light Conditions. In Proceedings of the 34th International Joint Conference on Artificial Intelligence (IJCAI), Montreal, QC, Canada, 16–22 August 2025; pp. 1882–1890. [Google Scholar] [CrossRef]
  51. Yoon, J.h.; Kwon, S.k. Robust Human Pose Estimation Method for Body-to-Body Occlusion Using RGB-D Fusion Neural Network. Appl. Sci. 2025, 15, 8746. [Google Scholar] [CrossRef]
  52. Zhang, Z.; Shin, S.Y. Two-Dimensional Human Pose Estimation with Deep Learning: A Review. Appl. Sci. 2025, 15, 7344. [Google Scholar] [CrossRef]
  53. Kareem, I.; Ali, S.F.; Bilal, M.; Hanif, M.S. Exploiting the features of deep residual network with SVM classifier for human posture recognition. PLoS ONE 2024, 19, e0314959. [Google Scholar] [CrossRef]
  54. Gao, M.; Li, J.; Zhou, D.; Zhi, Y.; Zhang, M.; Li, B. Fall detection based on OpenPose and MobileNetV2 network. IET Image Process. 2023, 17, 722–732. [Google Scholar] [CrossRef]
Disclaimer/Publisher’s Note: The statements, opinions and data contained in all publications are solely those of the individual author(s) and contributor(s) and not of MDPI and/or the editor(s). MDPI and/or the editor(s) disclaim responsibility for any injury to people or property resulting from any ideas, methods, instructions or products referred to in the content.

Article Metrics

Citations

Article Access Statistics

Multiple requests from the same IP address are counted as one view.