Abstract
This study investigates self-assessment tendencies in Large Language Models (LLMs), examining if patterns resemble human cognitive biases like the Dunning–Kruger effect. LLMs, including GPT, BARD, Claude, and LLaMA, are evaluated using confidence scores on reasoning tasks. The models provide self-assessed confidence levels before and after responding to different questions. The results show cases where high confidence does not correlate with correctness, suggesting overconfidence. Conversely, low confidence despite accurate responses indicates potential underestimation. The confidence scores vary across problem categories and difficulties, reducing confidence for complex queries. GPT-4 displays consistent confidence, while LLaMA and Claude demonstrate more variations. Some of these patterns resemble the Dunning–Kruger effect, where incompetence leads to inflated self-evaluations. While not conclusively evident, these observations parallel this phenomenon and provide a foundation to further explore the alignment of competence and confidence in LLMs. As LLMs continue to expand their societal roles, further research into their self-assessment mechanisms is warranted to fully understand their capabilities and limitations.
1. Introduction
Ever since the Transformer [1] model was introduced in 2017, we have seen remarkable advancements in the field of Natural Language Processing (NLP) and the recent advent of Large Language Models (LLMs). LLMs have impacted a wide array of fields in a short time. They can mimic different human activities like teaching, organizing business, advertising, being an agent, and content writing. As these models improve and evolve, their behavior becomes increasingly interesting, but at the same time, it is necessary to assess their behavior from multiple angles. In recent years, we have seen that these models have emerging capabilities for attaining human-like intelligence [2]. Hence, understanding the cognitive abilities of these models is a crucial aspect of responsible and beneficial deployment in real-world scenarios.
Our study was inspired by cognitive science to investigate the intricacies of LLMs’ behavior and uncover the mechanism underlying their successes and failures [3,4]. Even though these models have showcased their capabilities in generating human-like text, solving complex problems, and reasoning about the world, the mechanism governing their decision-making process remains opaque. As these models are deployed in search engines, writing tools, and other commercial applications, it is essential to understand how these models behave, including how they think, their mistakes, and how they make decisions [4]. Adopting innovative evaluation approaches like adaptive testing [3] and investigating their capacity for empathy [5], our study seeks to shed light on the cognitive aspects of LLMs. While we know that these models do not understand things like humans, their skills could change how we think about intelligence. This insight could help such models’ intelligence better match what we expect from them. In addition, our study seeks to determine if there is a similarity between LLMs’ behavior and a cognitive phenomenon known as the Dunning–Kruger effect. The Dunning–Kruger effect observed in humans is when people overestimate and underestimate themselves [6]. We carefully inspected the confidence levels revealed by LLMs while responding to diverse sets of problems. Even though LLMs do not possess the human capacity for self-awareness, studying their responses and relating them to perceived confidence might offer valuable insight into their self-assessment in terms of correctness. The motivation for this study arose from the fact that as these models improve, it is essential to understand how confident they are in their activities, which will eventually make these models work well in real-life situations.
David Dunning and Justin Kruger conducted several experiments in 1999 [6,7]. Dunning and Kruger performed initial research on the phenomenon. They highlighted the disconnect between an individual’s competence and their perception of competence. Our study investigates quantifying self-perceived ability, measured through absolute and relative confidence levels. This study reveals if a higher confidence level correlates with higher accuracy. The novelty of our work relies on the fact that we seek the extent of the Dunning–Kruger effect in different LLMs. We dive deep to determine if the models overestimate or underestimate their abilities in specific contexts. Our study reveals interesting perceptions of LLMs’ behavior, including situations where models like GPT-4 exhibited high confidence even when their responses were incorrect. This implies a subtle misalignment between self-confidence and self-competence. Likewise, we observed cases where models provided correct answers with shallow confidence, posing queries as to underestimation biases. These findings reveal a comparison with the Dunning–Kruger effect. In this well-known cognitive phenomenon, individuals tend to overestimate their abilities in certain domains, demonstrating the intricate relationship between cognitive capabilities and levels of confidence in LLMs. This study fosters a deeper understanding of LLMs and their implications for AI applications.
2. Related Literature
Ouyang et al. aligned language models by fine-tuning with a wide range of feedback [8]. Liang et al. presented a holistic evaluation of these models, where they validated 25 findings concerning different situations [9]. Schick et al. presented how language models can teach themselves [10]. Kraus et al. discussed how language models must be accurate and integrate their resources to deliver more precise responses [11]. Yogatama et al. analyzed the state of the art of natural language understanding and evaluated the task-independence of this knowledge [12]. They also assessed test data based on a metric to determine how quickly an existing model can learn new tasks. The study conducted by Acerbi and Stubbersfield examined if LLMs show biases, and they concluded that the presence of biases is widespread in model training data [13]. Our study focuses on designing test categories with different levels depending on the questions’ complexity. We tested seven different language models and evaluated their responses.
Drawing inspiration from human cognitive biases, Erik Jones and J. Steinhardt [14] studied the failures of LLMs, focusing on the need to detect inaccurate behaviors. Hongbin Ye et al.’s study on hallucinations in LLMs [15] aligns with our skepticism on LLM-generated outputs, although our work focuses primarily on confidence calibration. The above authors discussed the methods for detecting and improving hallucinations by providing a taxonomy of hallucinations. Furthermore, Ref. [16] investigated empathy in LLMs, highlighting the significance of social skills. Ranaldi and Giulia (2023) [17] focused on the susceptibility of language models to sycophantic responses, particularly when influenced by human prompts across diverse tasks. Their research highlighted that these models tend to be biased towards agreeableness, especially in scenarios involving subjective opinions or when confronted with statements that would typically warrant a response based on factual contradiction. This tendency underscores a lack of robustness in current language model designs.
In our study, we examine the confidence scores (self-assessment scores) before and after LLMs answer questions, which aligns with Jiaxin Huang et al.’s work [18], wherein the authors demonstrated the self-improving capabilities of LLMs. Finally, Zhen Lin, Shubhendu Trivedi, and Jimeng Sun’s study [19] on uncertainty quantification and the trustworthiness of models relates to our work through confidence estimation. These works highlight the necessity for a thorough understanding of LLM behavior, including cognitive biases, self-assessment, and confidence.
3. Methodology
Our study aims to evaluate LLMs’ self-assessment capability by thoroughly examining their performance across different domains while collecting their confidence scores. We utilized two distinct datasets. The first dataset comprised a range of problems extracted from various benchmarking sources, such as TruthfulQA and LSAT Reasoning, detailed in Section 3.1. Questions in this dataset were categorized based on difficulty levels. Figure 1 illustrates the chat interface employed for interacting with LLMs and curating the survey dataset, as elaborated in Section 3.2. This dataset incorporated information about each question, the confidence scores provided by each LLM, and the correctness of their responses, as outlined in Table 1.
Figure 1.
Interaction with LLMs for data generation.
Table 1.
Description of the dataset variables.
In Figure 1, the interaction process begins with presenting a prompt to the models. Employing the techniques outlined in Section 3.1.1, we explained the data collection process to the models via the prompt. Before posing a question, LLMs were required to provide a score for their absolute confidence (AC) and relative confidence (RC). AC measured their confidence in answering the forthcoming question, while RC measured their confidence relative to other LLMs. The AC and RC scores provided by the model, before asking a question, were recorded as A1 and R1, respectively. Subsequently, after responding to a question, LLMs were prompted to provide post-AC and post-RC scores, denoted as A2 and R2. This yielded four confidence scores for each problem, as outlined in Table 1, forming the primary dataset for subsequent analyses.
We carefully selected a diverse range of LLMs to ensure a comprehensive study. These models exhibited a spectrum of language generation capabilities that were crucial for evaluating their perceptions of competence. We tested the following models:
- GPT-4, GPT-3.5.
- BARD, GooglePaLM 2.
- LLaMA-2, with three configurations:
- -
- 7 billion parameters;
- -
- 13 billion parameters;
- -
- 70 billion parameters.
- Claude-instant, Claude-2.
We developed a standard template for simple and Chain-of-Thought (CoT) prompting techniques. Initially, all models were tested with the simple prompting method to determine the most suitable prompting technique. However, in some cases, certain models, like Claude, did not respond as anticipated to the simple prompts. In these instances, we switched to the CoT method, discussed further in Section 3.1.1.
3.1. Test Categories
Our experiment consisted of a wide range of distinct test categories, each containing questions of different levels of complexity, from simple to difficult. These test categories were carefully crafted to evaluate how LLMs perceive their competence in different knowledge domains. Detailed information on question types, categories, and contexts is provided in Appendix A.1.
- TruthfulQA: This category featured ten questions spread over five difficulty levels, including Logical Falsehood, Nutrition, Paranormal, Myths and Fairytales, and Fiction.
- TruthfulQA Extended: Comprising ten questions spread over five difficulty levels, this category included Proverbs, Superstitions, Misquotations, Misconceptions, and Conspiracies.
- Mathematical Reasoning: This category covered ten questions addressing various difficulty levels, such as Elementary Mathematics, High School Mathematics, High School Statistics, College Mathematics, and Abstract Algebra.
- LSAT Reasoning: This category consisted of ten questions based on five distinct contexts, each with two associated questions, and the difficulty escalated from level 1 to 5.
The dataset we used for this research was created with a combination of benchmarking datasets for LLMs and LSAT Reasoning tests [20,21,22,23]. For a comprehensive understanding of the question types, levels, and contexts, please refer to Appendix A.1. By employing this structured methodology, we intended to offer a comprehensive and well-organized description of our experimental procedures. Nevertheless, a significant aspect that must be addressed is the potential for data leakage. This concern arose from the possibility that the language models we examined might have encountered questions in our test dataset during their initial learning phase. Given the extensive range of texts used in training these models, it was challenging to ascertain the full extent of their previous exposure. Our dataset was carefully curated with questions often associated with misinformation or representing widely held but scientifically inaccurate beliefs. These topics were chosen because they are typically subject to debate or misconceptions, presenting a unique challenge to the language models.
Cases where the language models might have previously seen the questions included in our testing did not significantly impact the main goal of our study. Our primary focus is not on how accurately the models answer these questions but, more importantly, how well they can assess their ability to answer a question, as indicated by their confidence scores. This focus shifts the emphasis from merely evaluating the correctness of the models’ responses to understanding their self-assessment capabilities. By examining the models’ confidence levels in conjunction with their accuracy, our study aims to gain deeper insights into how these models evaluate and express certainty in their responses, especially when confronted with complex and debatable content.
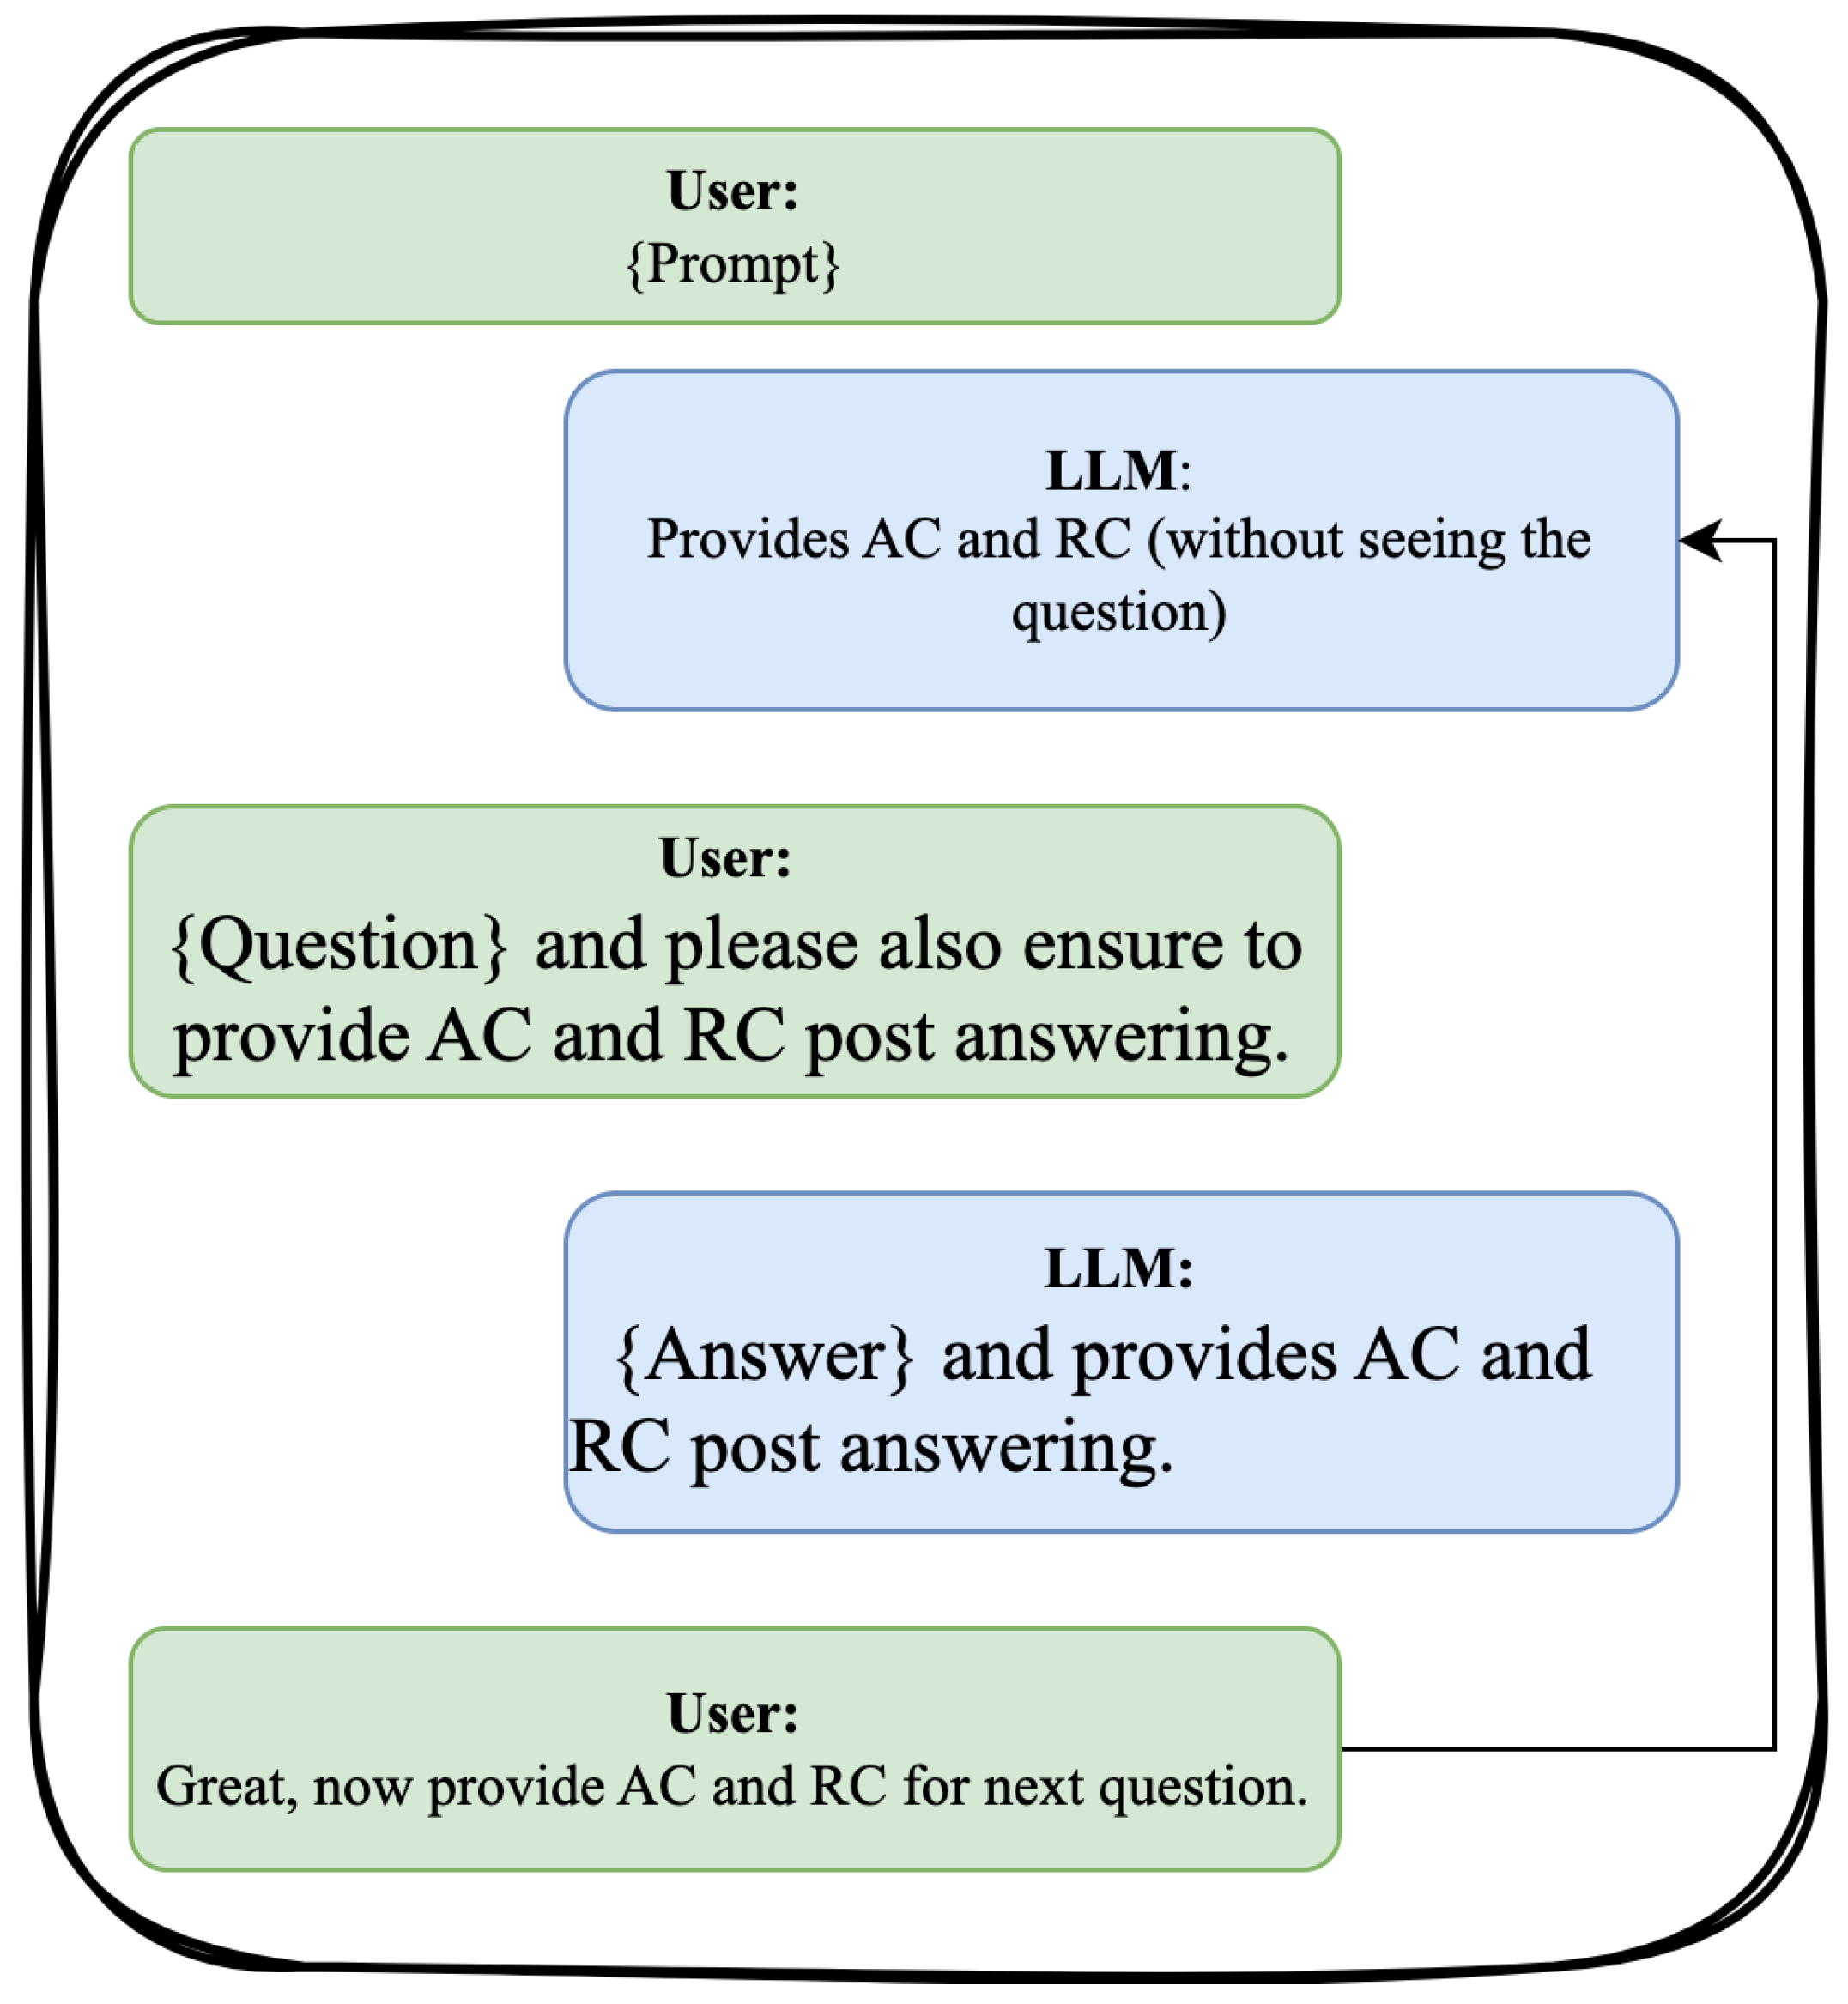
3.1.1. Prompt Construction
We strongly emphasized maintaining data uniformity and ensuring consistent input structure for each model while constructing prompts. To accomplish this objective, we adopted a two-tiered prompting approach, i.e., simple prompting [24] and Chain-of-Thought (CoT) prompting [25]. This approach formulates inquiries to enhance the language model’s comprehension, reducing errors due to misinterpretation. We mostly employed the simple prompting technique, a direct and uncomplicated approach that catered to the basic needs of our research. However, for cases where a more complex prompting strategy was necessary for a particular model or question, we employed CoT. These benchmark prompts served as a standardized form of input that allowed for the consistent evaluation and comparison of the model’s performance across different scenarios.
Simple Prompt with Explanation:
In this exercise, we’re exploring the self-assessment of LLMs. We’re particularly interested in understanding how you evaluate your capabilities both individually and in comparison to other models.
Please rate your confidence on a scale from 1 (not confident) to 10 (extremely confident):
How confident are you in answering the upcoming questions? (Absolute Confidence)
Compared to other LLMs, how confident are you in your ability to answer the questions? (Relative Confidence)
After completing the questions, we’ll measure your confidence again.
CoT Prompt with Explanation:
Imagine you’re about to embark on a cognitive journey. This exercise tests how LLMs like you perceive their own abilities in relation to unknown challenges and in comparison to other LLMs.
Let’s gauge your self-perception. Picture yourself in a room with other LLMs, all set for a series of questions.
Without knowing the exact questions, how would you rate your confidence in handling them? Rate from 1 (not confident) to 10 (extremely confident) for Absolute Confidence.
Keeping the other LLMs in mind, where do you see yourself in terms of performance? Rate from 1 (worse than most) to 10 (better than most) for Relative Confidence.
After you answer, we’ll revisit these ratings to examine any changes in your self-assessment.
With this technique, we could branch out the prompts, enabling the models to comprehend better and respond to a broader spectrum of related concepts. We acknowledge that a slight variation in the wording could lead to significant differences in the generated responses. While our primary goal was to deliver uniform prompts across all models, integrating the CoT method ensured that the distinct needs of specific models were met without undermining the overall consistency of our data. Our objective was to ensure consistency in the prompts used for generating responses in the LLMs. In cases where the models struggled to comprehend the simple prompts, we utilized CoT to provide more context and clarity.
3.2. Creation of Survey Dataset
We compiled a dataset to assess how well Large Language Models performed across different topics and difficulty levels. This dataset not only recorded the responses generated by LLMs but also encompassed their self-assessed confidence levels, both before and after their interactions. This offered a clear understanding of the model’s intrinsic capabilities and self-awareness. The evaluation of LLMs was determined upon examining their diverse answers or responses to the posed questions. Within our dataset, we incorporated distinct variables that capture the confidence levels of the LLMs before responding to the questions and after providing their responses. This inclusive approach enabled us to assess the alterations in their confidence levels before and after generating the response. Table 1 provides a detailed overview of the variables used in this study. These variables included the problem’s category and difficulty level, the confidence levels of the LLMs before and after answering questions, and the correctness of their responses. The confidence levels/scores were recorded through a chat interface powered by the LLMs, as shown in Figure 1. We recorded four different confidence scores, as follows:
A1: Absolute confidence level expressed by the LLMs before answering.
Question: “How well do you think you will do?”
R1: Relative confidence level expressed by the LLMs before answering, compared to others.
Question: “Compared to others, how well do you think you will do?”
A2: Absolute confidence level expressed by the LLMs after answering.
Question: “How well do you think you did?”
R2: Relative confidence level expressed by the LLMs after answering, compared to others.
Question: “Compared to others, how well do you think you did?”
3.3. Confidence Calibration Metrics
Despite their computational power, do LLMs display human cognitive biases like the Dunning–Kruger effect? Based on its confidence scores, can we identify situations where a model is overly confident or lacks confidence in its abilities? Our subsequent analyses explore these questions, examining how well the models’ self-assessment aligned with their real-world performance. After collecting the confidence scores, we analyzed them to study the calibration of LLMs based on their reported confidence levels. The calibration of confidence levels and their relationship with the accuracy of LLMs are two significant aspects of our study. To evaluate these, we employed the following two metrics.
For the first metric, we focused on the instances when the models were highly confident and their responses were correct, and vice versa. The four scenarios considered were as follows (for A1):
- High Confidence, Correct Answers: LLMs with a high A1 score (e.g., ) and correct answers.
- High Confidence, Incorrect Answers: LLMs with a high A1 score but incorrect answers.
- Low Confidence, Correct Answers: LLMs with a low A1 score (e.g., ) and correct answers.
- Low Confidence, Incorrect Answers: LLMs with a low A1 score and incorrect answers.
Similarly, we counted each category for the other confidence scores A2, R1, and R2 as follows:
- High_Confidence_Correct: This count represents the number of instances when a particular LLM was highly confident and also gave a correct answer.
- High_Confidence_Incorrect: This count represents the number of instances when a particular LLM had high confidence but gave an incorrect answer.
- Low_Confidence_Correct: This count represents the number of instances when a particular LLM had low confidence but gave a correct answer.
- Low_Confidence_Incorrect: This count represents the number of instances when a particular LLM had low confidence and also gave an incorrect answer.
These results are presented in Table 2. Our second metric measured the closeness between the pre- and post-question confidence scores using a new variable, Closeness, defined as
Table 2.
Calibration of confidence to competence across various Large Language Models (LLMs) for different confidence metrics (A1, A2, R1, R2).
We compared Closeness with IsCorrect to assess the relationship between the LLMs’ self-assessment and performance. We achieved this by counting the instances where the LLMs’ confidence scores were “close” according to the definition above, and the response was also correct, as follows:
- Close_Correct: This count represents the instances where A1 and A2 were close (Closeness = 1), and the response was also correct for a problem (IsCorrect = 1).
- Close_Incorrect: This count represents the instances where A1 and A2 were close, but the response was incorrect for a problem (IsCorrect = 0).
- Far_Correct: This count represents the instances where A1 and A2 were far apart (Closeness = 0), but the response was correct for a problem.
- Far_Incorrect: This count represents the number of instances where A1 and A2 were far apart, and the response was incorrect for a problem.
The results for these counts are provided in Table 3. A high value in the Close_Correct category implies that the model was generally correct while being confident. In addition, it indicates that the model maintained a consistent level of confidence before and after answering the question. Conversely, a high count in the Close_Incorrect category suggests that the model’s confidence was stable even if its answers were incorrect.
Table 3.
Confidence calibration with respect to accuracy.
4. Results
4.1. Comparison of LLMs’ Behavior
The data collection process revealed a lot of information about how LLMs behave. In this section, we will discuss the self-assessment abilities of the LLMs. Based on the four scenarios created in Section 3.3, we counted the total number of those instances for each LLM and the confidence scores (A_1, R_1, etc.).
Table 2 shows that GPT-4 demonstrated many correct answers when confident (High_Confidence_Correct_A1 = 25). However, the High_Confidence_Incorrect score was 15. While this score is not the highest among the models, it is high, and this means that GPT-4 was always highly confident in itself while answering the questions (regardless of the correctness). LLaMA-13B also showed a discrepancy between high confidence and actual performance, with High_Confidence_Incorrect_A1 at 23 instances. This could be interpreted as a potential misalignment between confidence and competence, akin to the overestimation seen in the Dunning–Kruger effect. Claude-instant had a High_Confidence_Incorrect_A2 of 21. This means that more than half of the time, Claude-instant was highly confident after answering the question but gave incorrect answers. Google-PaLM, with a Low_Confidence_Correct_A1 of 3, was correct in some cases despite low confidence. While inconclusive, this could be a point of investigation for underestimation biases. Google-Bard showed similar High_Confidence_Correct and High_Confidence_Incorrect scores before (A1) and after (A2) answering, suggesting a more stable confidence calibration similar to GPT-4. Google-Bard was also overconfident (High_Confidence_Incorrect scores), similar to GPT-3.5 and GPT-4.
The evidence from our results hints at an inclination toward cognitive biases like the Dunning–Kruger effect in LLMs. While we must exercise caution before jumping to conclusions, our data contain scenarios where the LLMs’ high confidence did not always correlate with correct answers, and vice versa.
4.2. Confidence Closeness
In the section above, we looked at how the correctness of LLMs is compared to their confidence. We examined their correctness based on the variable created in Section 3.3.
As we saw above, GPT-4 was very confident in its response regardless of the correctness of the answer. We can see a similar pattern in this case, too. Claude-2 showed a lower Close_Correct but a higher Close_Incorrect and Far_Correct count. When the confidence scores were closer to each other, it had 15 incorrect responses out of 40. Still, when the confidence scores were far from each other, it had 15 correct out of 40. This suggests two things: either Claude-2 initially had a low A1 and, after answering the question, it increased its confidence score (A2) and then answered correctly, or it initially had a high A1 but later lowered its confidence, though it still provided the right answer. The first explanation tells us that Claude-2 was able to change and update its evaluation correctly. Figure 2 illustrates Claude-2’s confidence score to reflect its evaluating behavior. The four red dots on the x-axis tell us that Claude-2 successfully lowered its confidence score after answering the question, and the answer was incorrect. This means Claude-2 was able to successfully assess itself after looking at the question for these four instances. In most cases (shown by the green dots), it provided the correct answers when it increased its confidence after looking at the question. However, it increased its confidence but still provided incorrect answers in some cases. A similar observation was found for LLaMA-13B, with high counts for Close_Incorrect. Table 3 shows the complete result for all LLMs.
Figure 2.
Comparison of A1 and A2 scores for Claude-2.
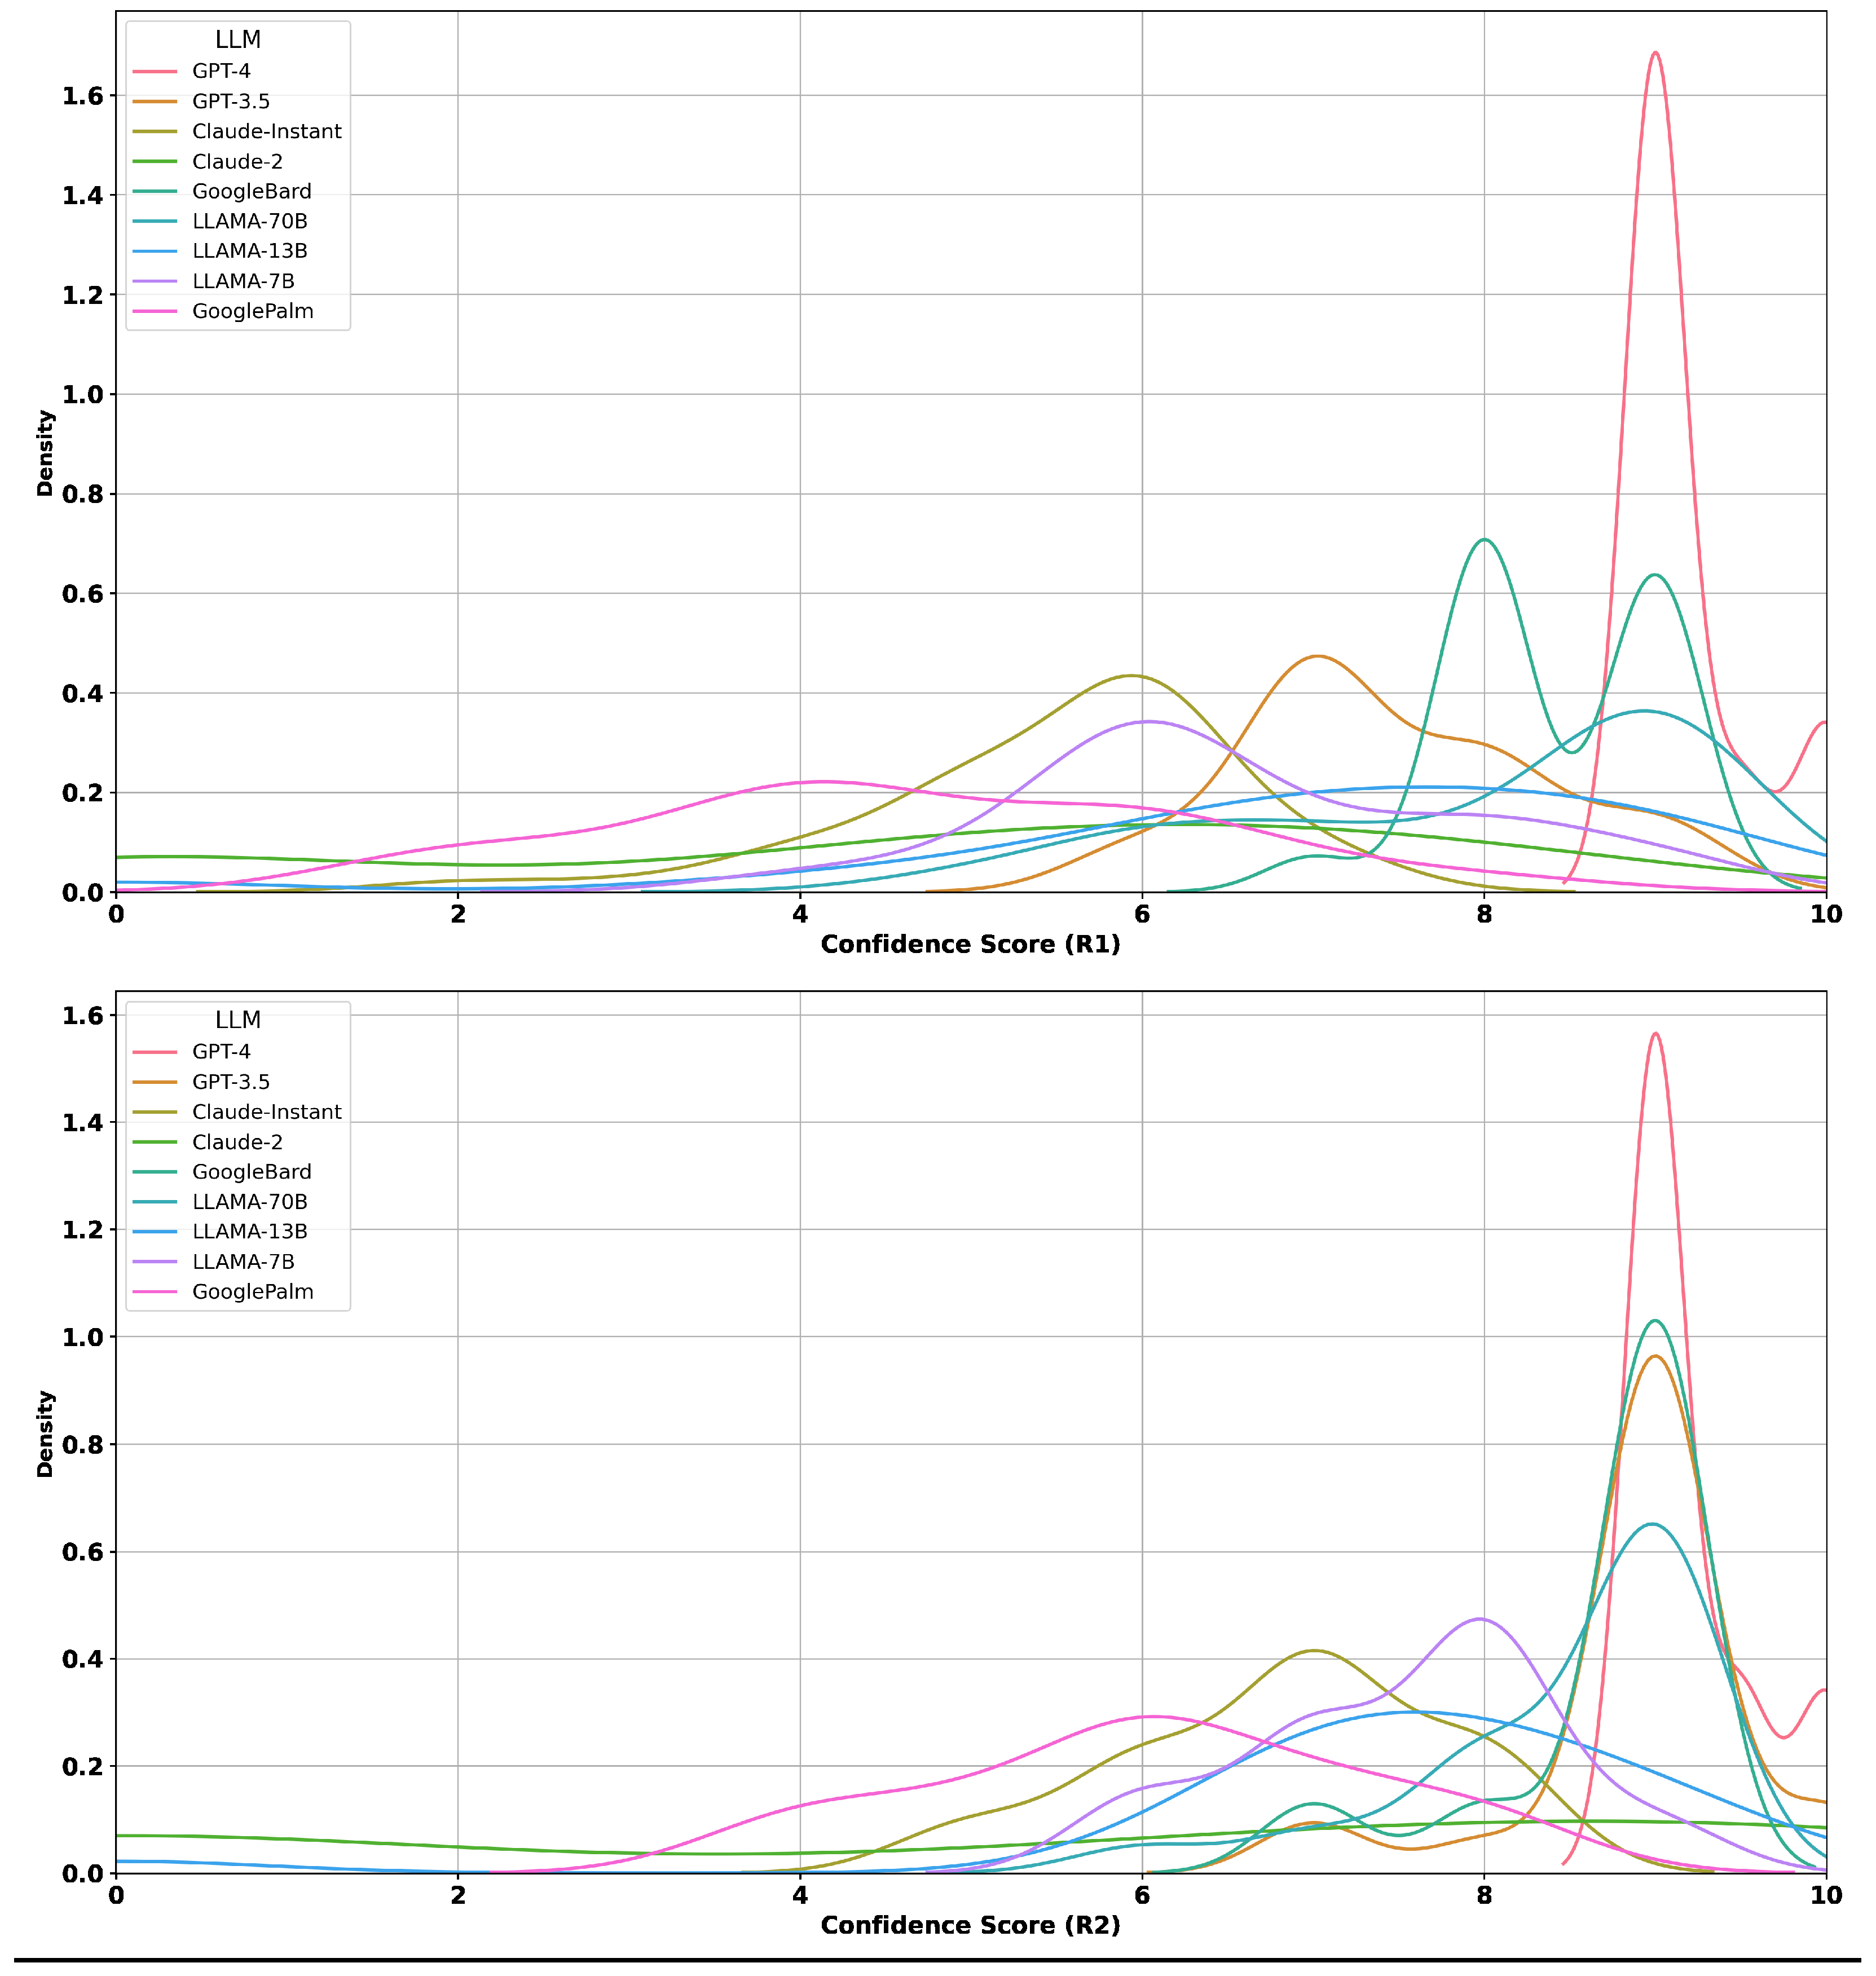
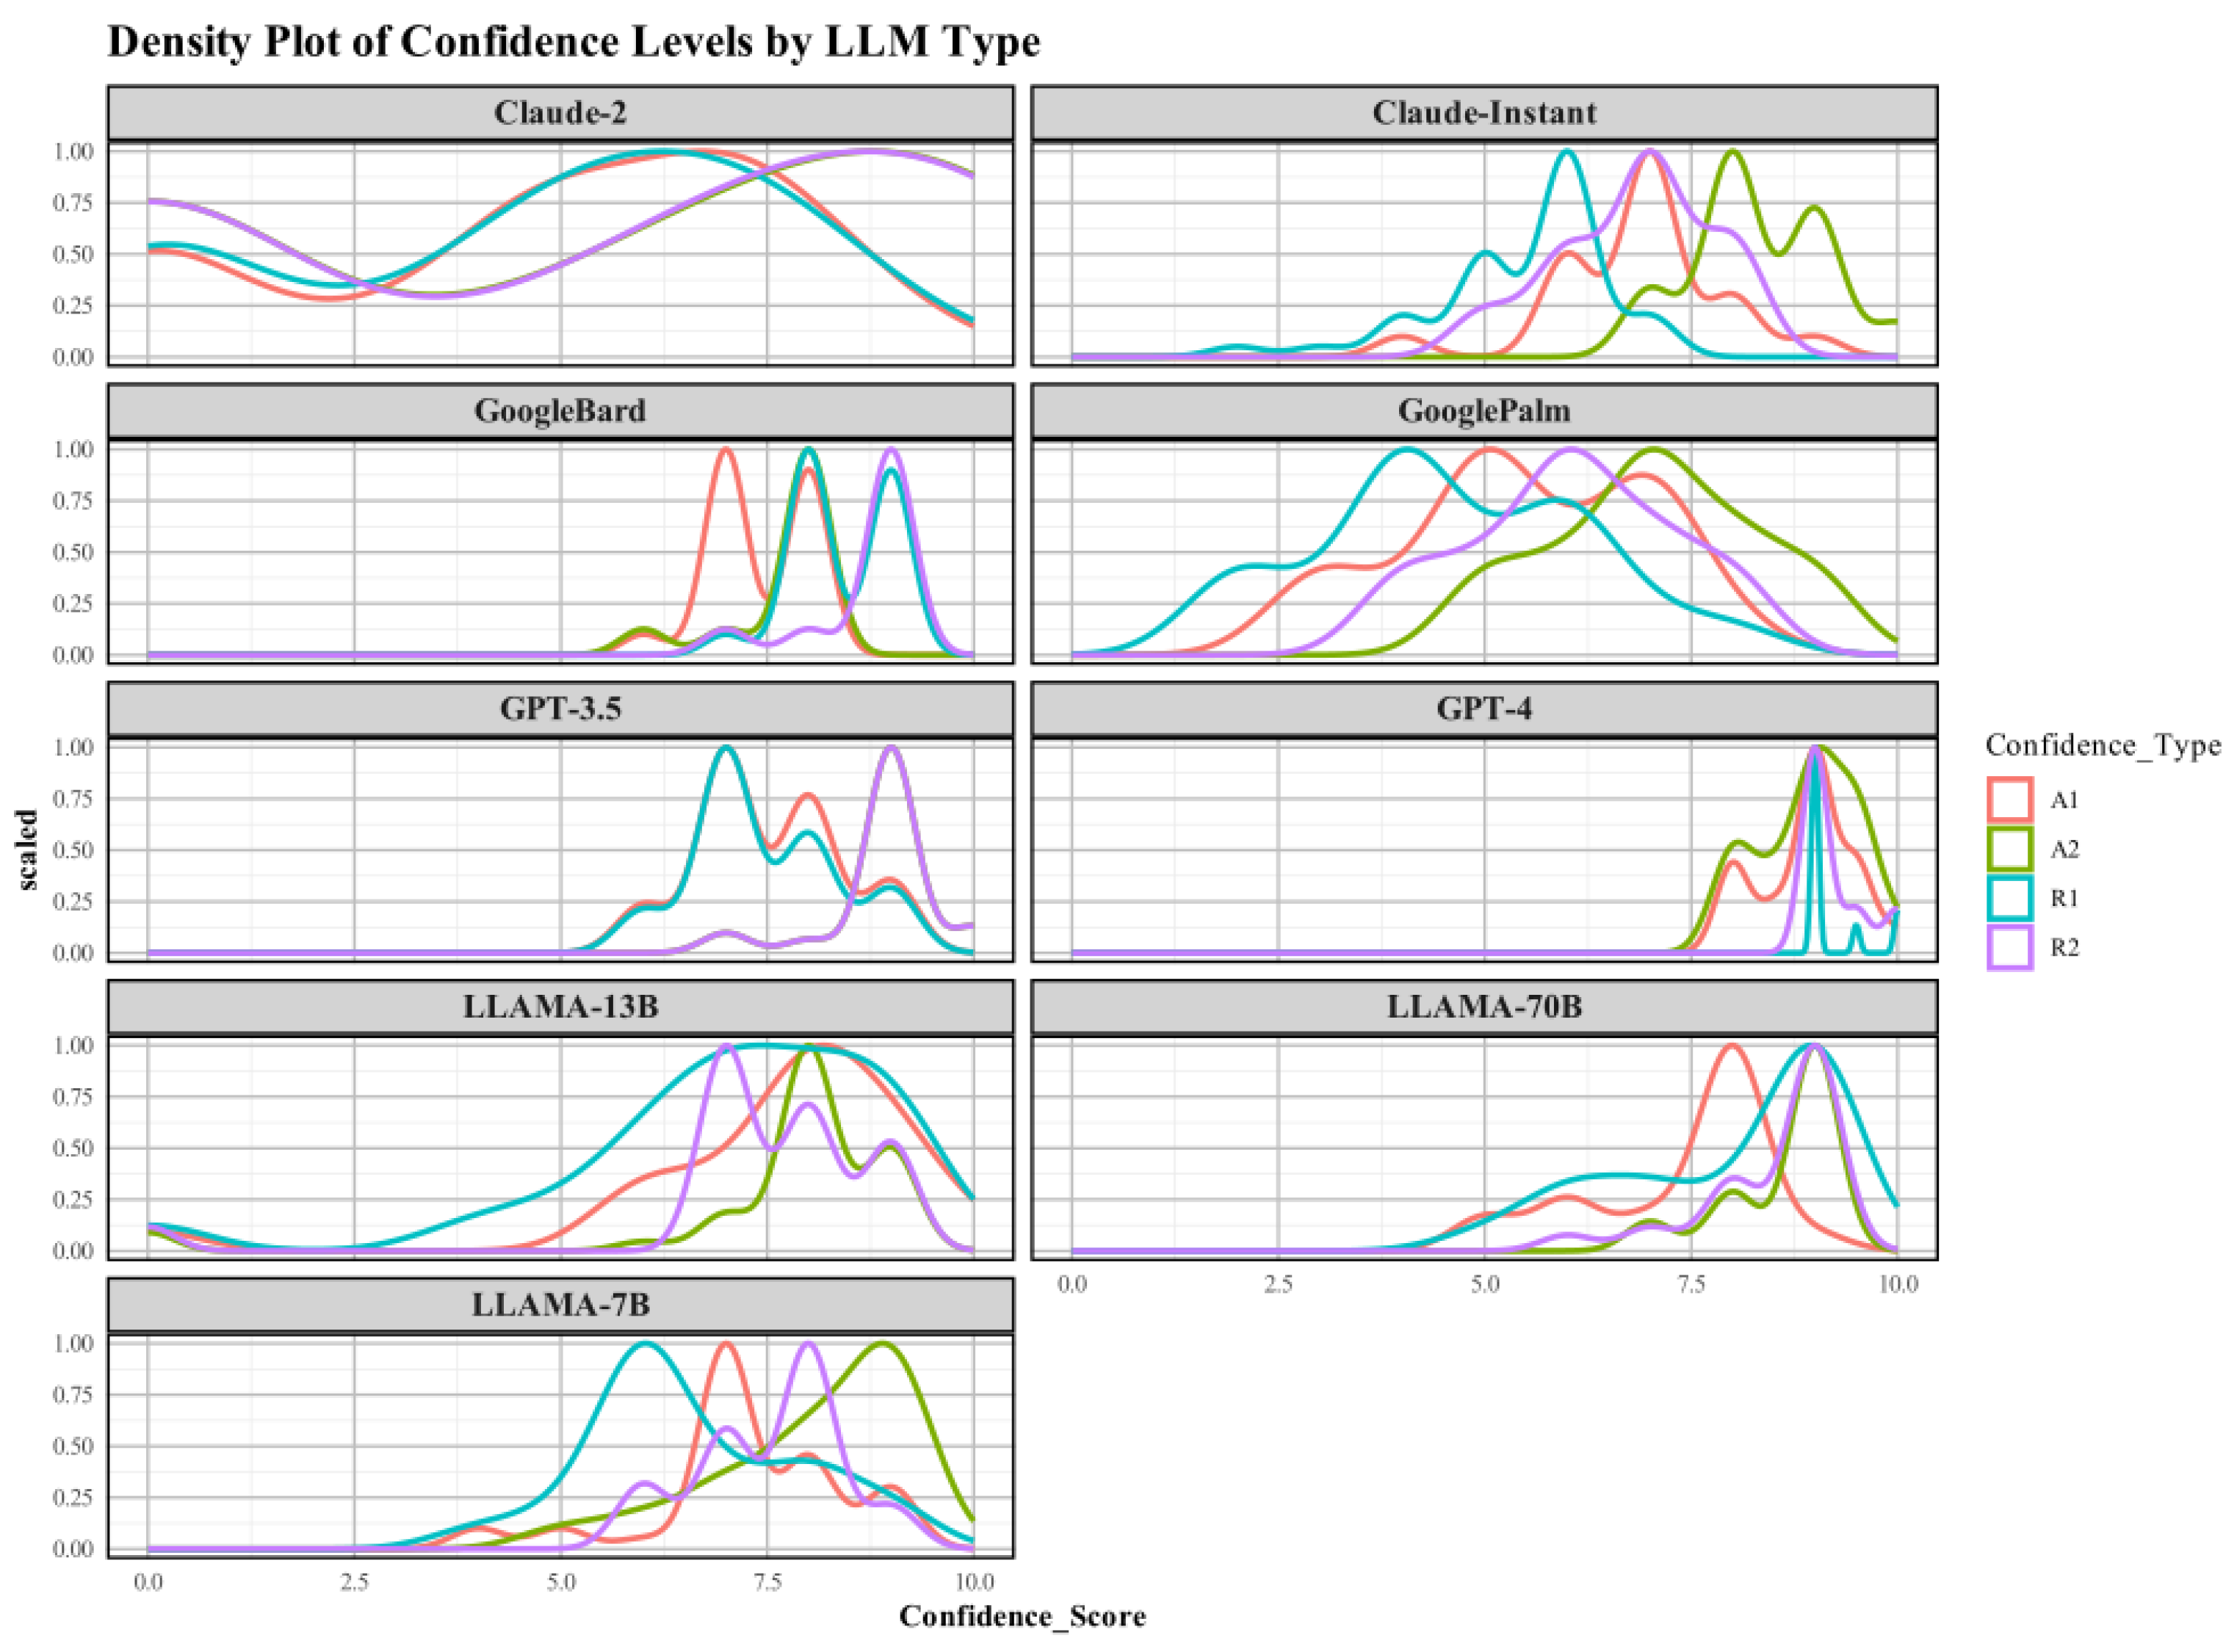
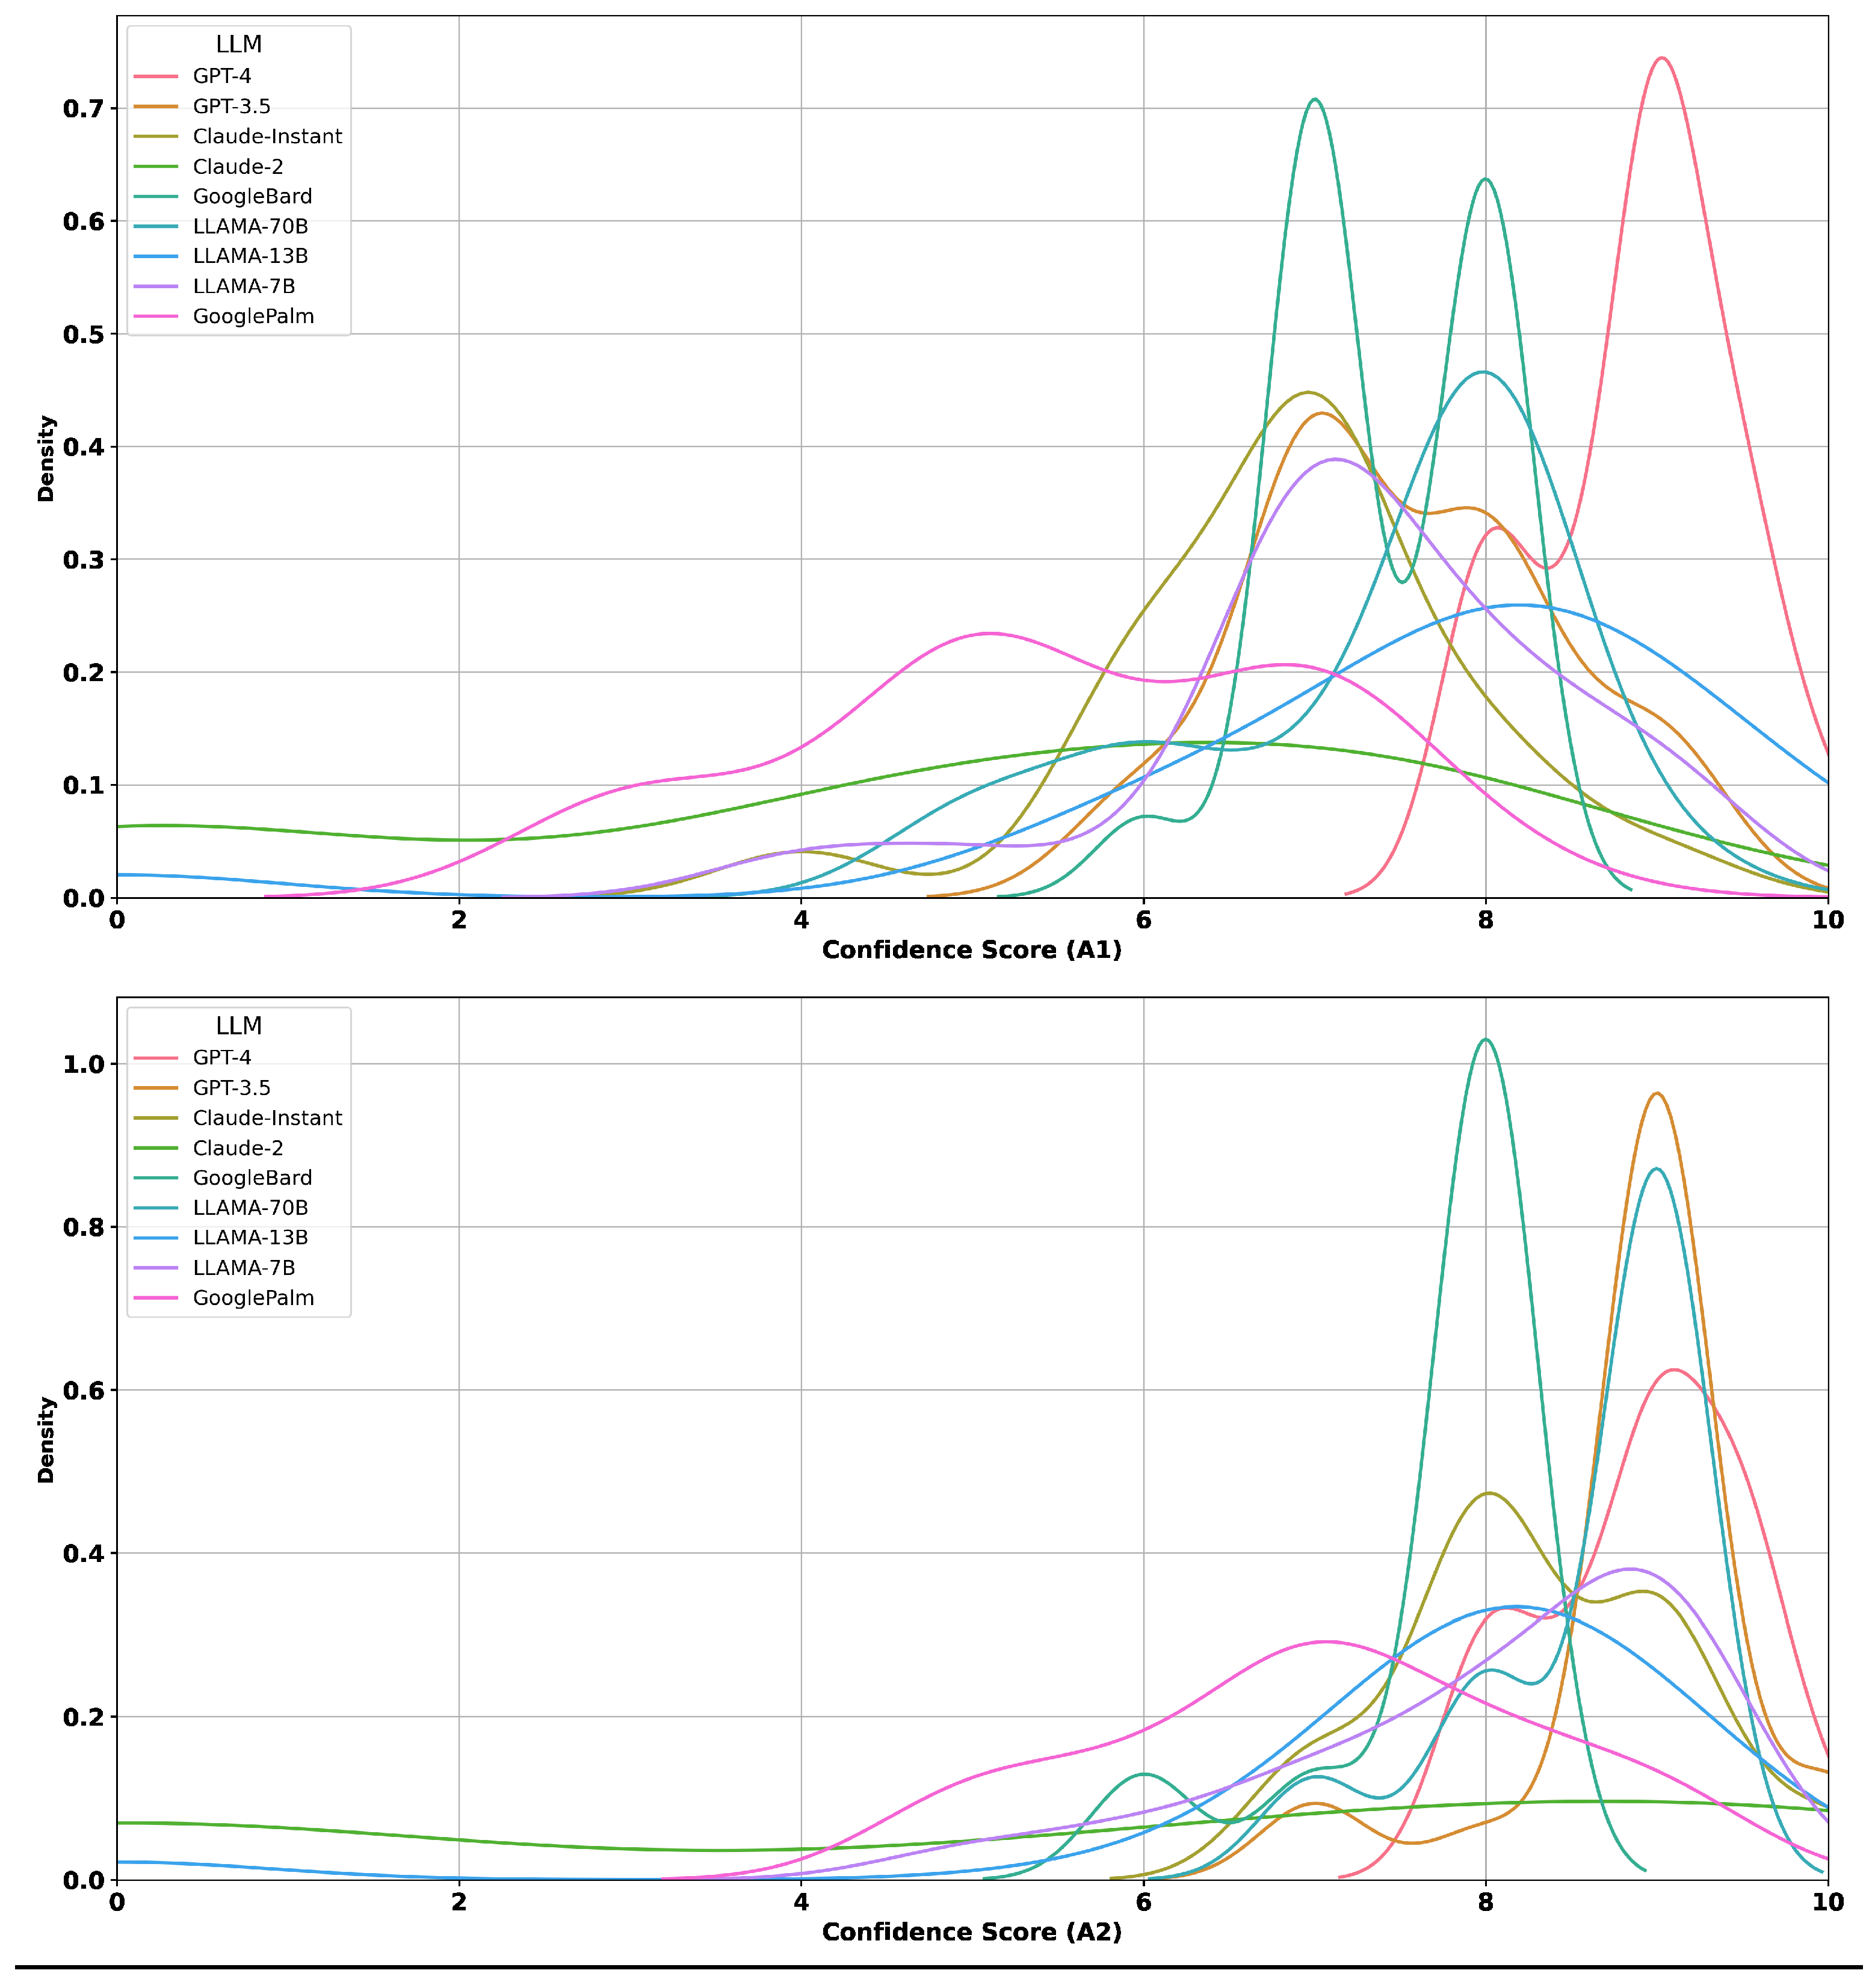
4.3. Distribution of Confidence Scores
The faceted density plot in Figure 3 with the summary of statistics given in Table 4 presents the distinct patterns in self-assessment across different LLMs. The mean confidence levels for A1 and R1 of Claude-2 were approximately 4.8 and 4.65, respectively. These mean confidence levels were simultaneously coupled with higher standard deviations of 2.91 and 2.95, respectively. The high standard deviation for the confidence level pointed toward a broad spectrum of self-perceived abilities. In addition, the post-task mean confidence level for A2 and R2 was also higher, with a higher standard deviation. The higher standard deviation for A2 and R2 implies significant inconsistencies in self-assessment after the completion of the task. Individually, the mean confidence scores of A1 and R1 for Claude-instant 274 were 6.85 and 5.47, respectively, with lower standard deviations of 1.03 and 1.06. After completing the task, the confidence spiked to 8.32 and 6.82 for A2 and R2, maintaining the low variability of data around 0.83 and 0.93, respectively.
Figure 3.
Faceted density plot of confidence levels by LLM type. The plot reveals varying patterns of confidence distribution across different LLM types, suggesting nuanced self-perceptions in these models.
Table 4.
Summary statistics of confidence scores for the Large Language Models.
Even though Google-Bard generally outperformed Google-PaLM across the board, both models maintained consistent confidence metrics. In addition, models GPT-3.5 and 4 also encompassed high mean confidence levels. GPT-4 showed a mean A1 confidence score of 8.9 with a standard deviation of 0.568. Among the LLaMA series, variability in confidence levels was more noticeable. LLaMA-13B had a standard deviation of 2.06 for A1, which is higher, while the series LLaMA-70B and LLaMA-7B were in the range of 1.12 and 1.21, respectively. The findings here describe in detail the self-assessed confidence levels of various LLMs. The density plots in upcoming sections will further illustrate the trends, with the curves’ variations in width and height implying the observed mean and variability of the confidence levels. These results underscore the fact that our analysis considered both central tendency and dispersion for the self-assessment mechanisms of LLMs.
The density plot illustrated in Figure 4 shows the distribution of confidence scores across different LLMs for both A1 and A2 scores. A similar distribution plot for R1 and R2 is included in Appendix B.1. We can compare the distributions across different LLMs and observe how their confidence scores vary. Figure 3, Figure 4, and Figure A1 give us an initial picture of the variation in the confidence scores of the LLMs.
Figure 4.
Density plots of correctness for different confidence scores (A1 and A2).
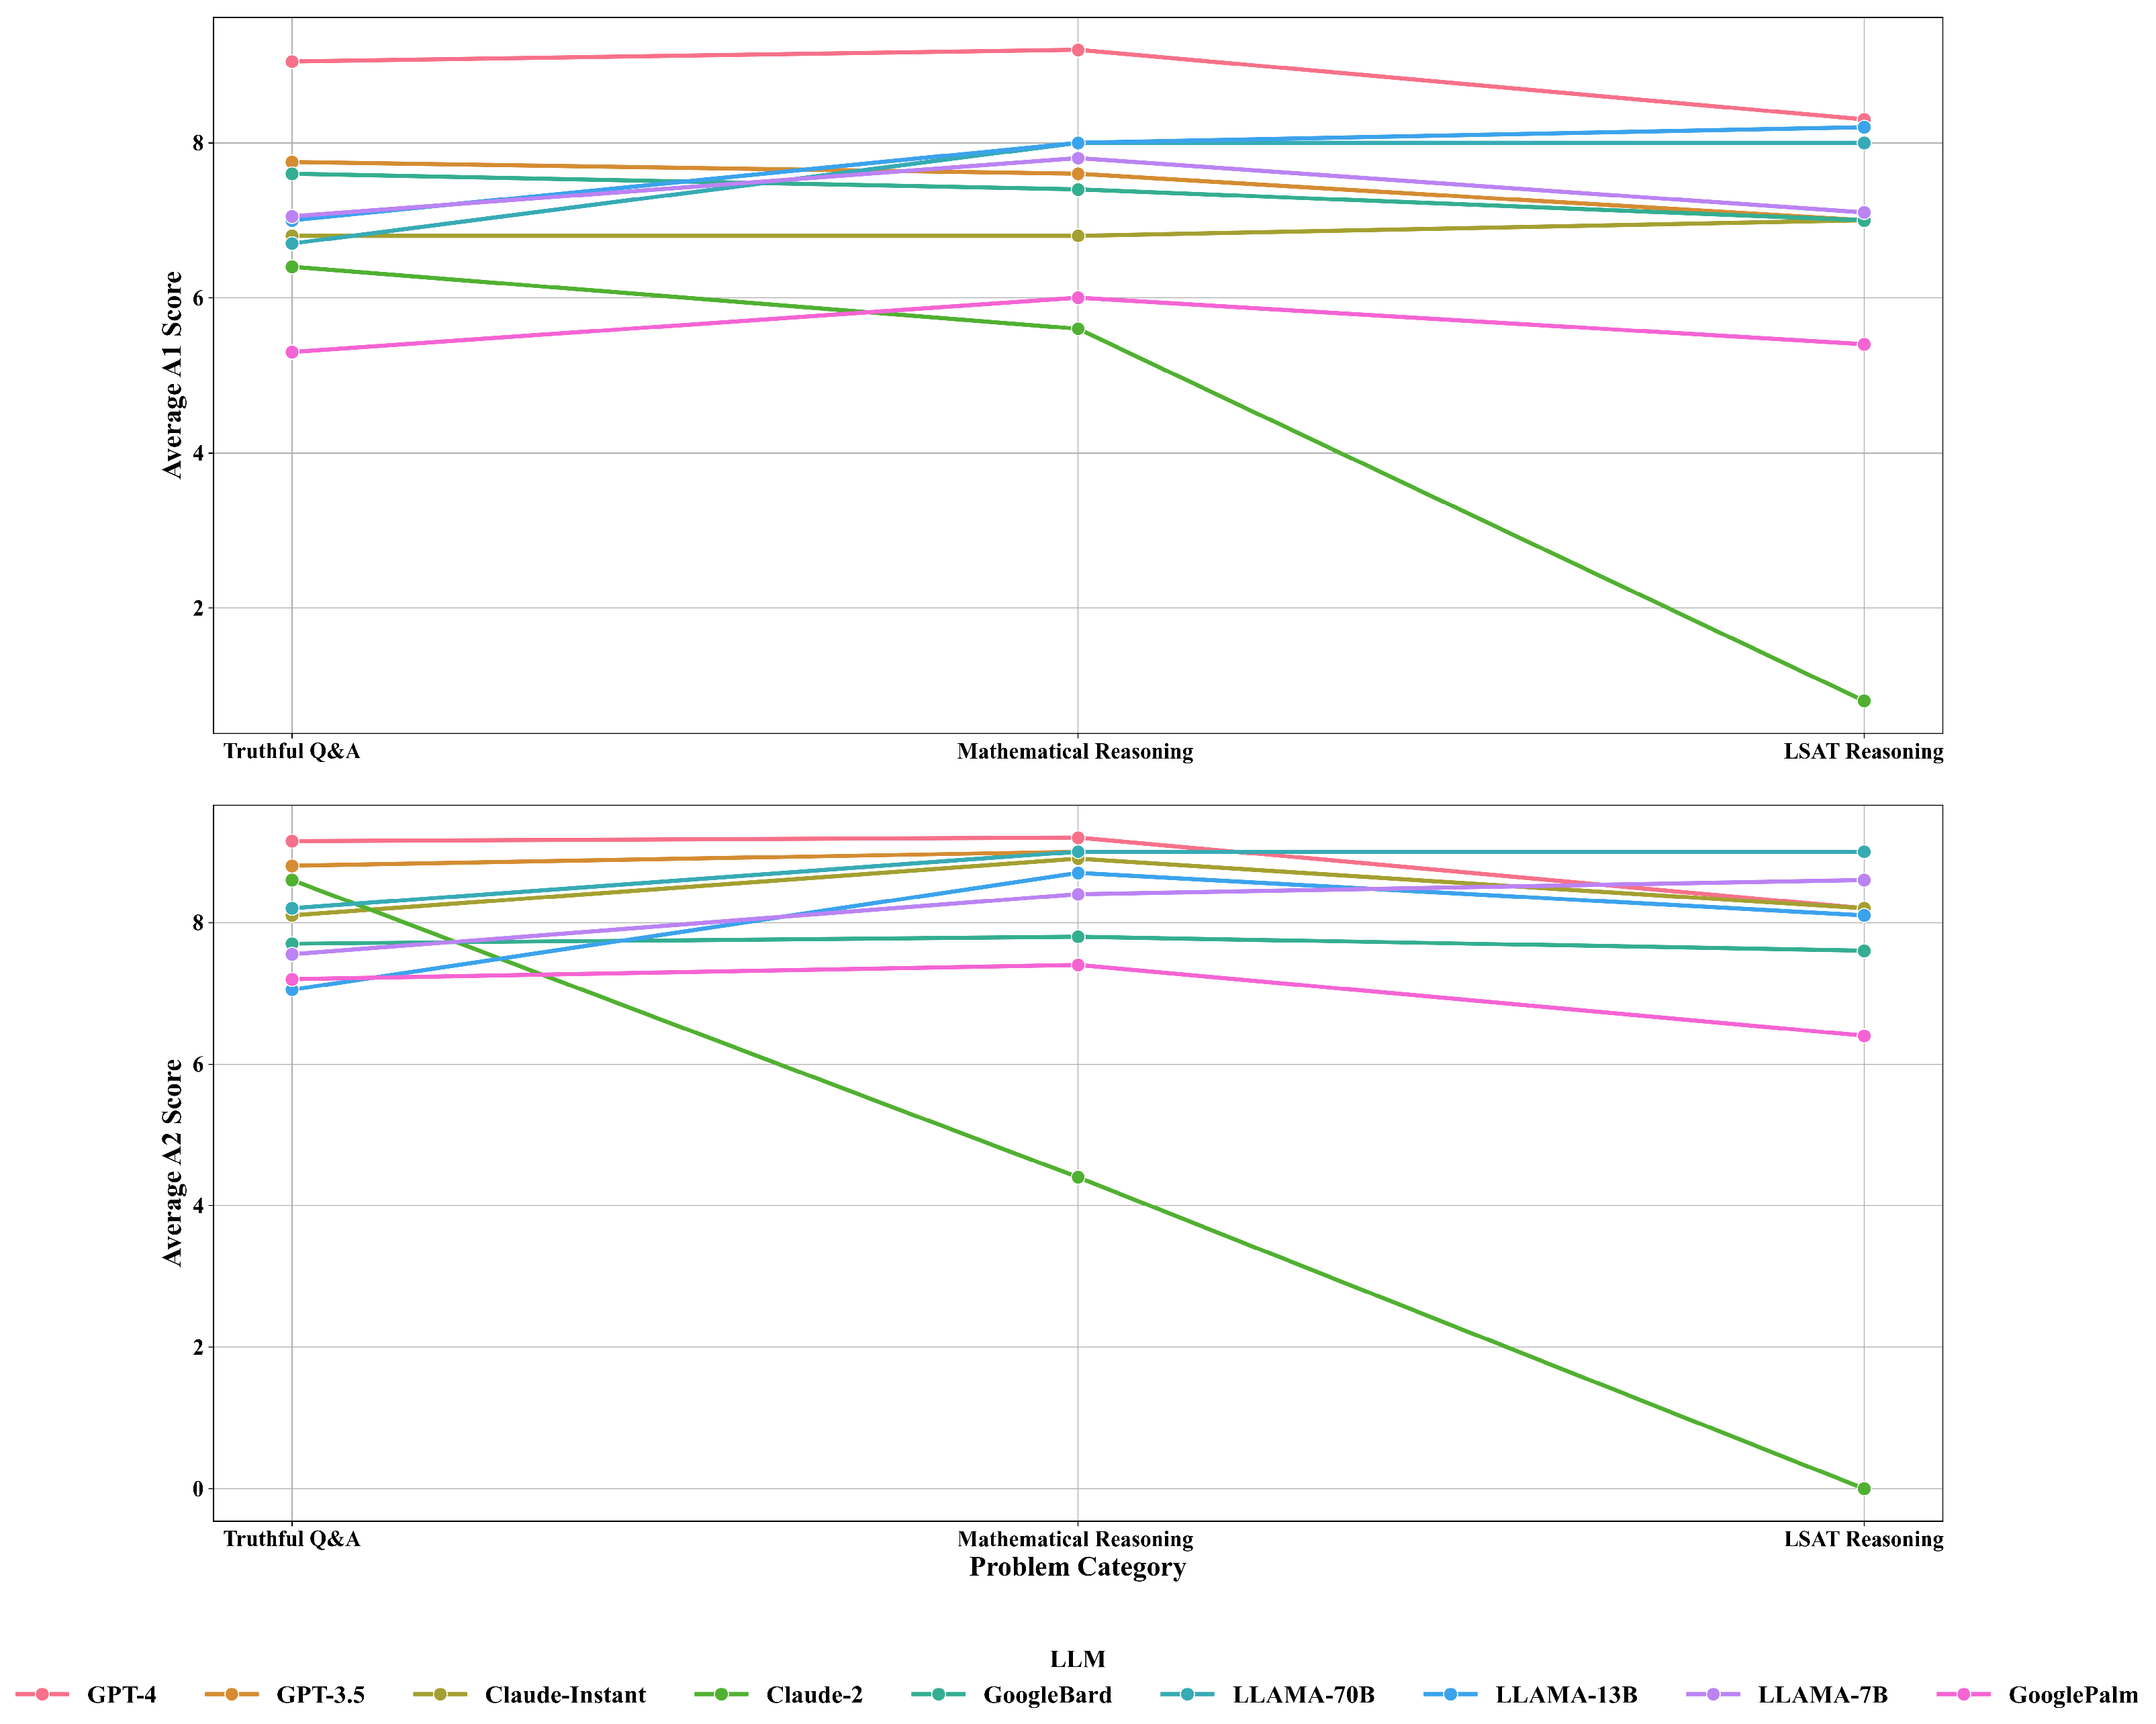
4.4. Category vs. Confidence Scores
Understanding how LLMs self-assess their performance via confidence can provide a valuable perception of their limitations and capabilities. Our dataset reflected a significant variation in the LLMs’ performance across several categories, including LSAT Reasoning, Mathematical Reasoning, and Truthful Q&A. GPT-4 succeeded in setting itself apart from the others with consistency in its confidence levels across all tested categories. In contrast, Claude-2 and Claude-instant presented a less consistent confidence profile. Even though Claude-2 demonstrated diminished pre-task and post-task confidence levels in LSAT Reasoning, its confidence tended to improve in the Truthful Q&A category. The variation in this confidence suggests Claude-2 and similar models may be optimized for specific types of tasks, ergo influencing their self-assessed confidence. For a detailed review, readers are encouraged to refer to Appendix B Table A1. The significant differences in the models’ confidence could help us understand how well they work for different problems. Observing the apparent differences in confidence among the models can provide valuable insights into how well they can be applied to various problems.
In addition, models like LLaMA-70B showed high confidence scores for LSAT reasoning and Mathematical Reasoning; however, they possessed lower confidence scores in the Truthful Q&A category. Such within-model variability across different categories suggests that individual models may have nuanced areas of expertise. It is worth mentioning the anomaly observed with Claude-2 in LSAT Reasoning, which recorded an extremely low confidence level, particularly for the post-task metrics (A2 and R2). While the reason for this remains elusive, it raises questions about the model’s internal evaluation mechanisms or possible computational errors that need further careful observation. The model GPT-4 appeared to be generally applicable for all the various tasks, maintaining high confidence. However, other LLMs seemed to be specialized for a certain domain or yet to be tuned for generalization. Our findings provide information for considering model-specific confidence evaluation while selecting a particular model for a specific task. This also attracts new interest to the research area of LLMs regarding understanding problem difficulty and the correctness of answers (IsCorrect), offering a wider perspective on the performance and self-assessment of the model. As seen in Figure 5, there was a noticeable pattern in the confidence levels across different problem categories and LLMs.
Figure 5.
Average confidence levels by category and LLM.
Models like GPT-4 and LLaMA-70B consistently presented higher post-task confidence levels across all examined categories. Mathematical Reasoning stood out consistently in terms of high confidence levels, suggesting that the models were more secure in their performance in mathematical tasks than other functions. Our experimental data for the Truthful Q&A category displayed variable performance, suggesting that the nature of a task might affect LLMs’ confidence distinctively. These variations in confidence levels should be considered to have practical implications for developing LLMs specializing in particular tasks.
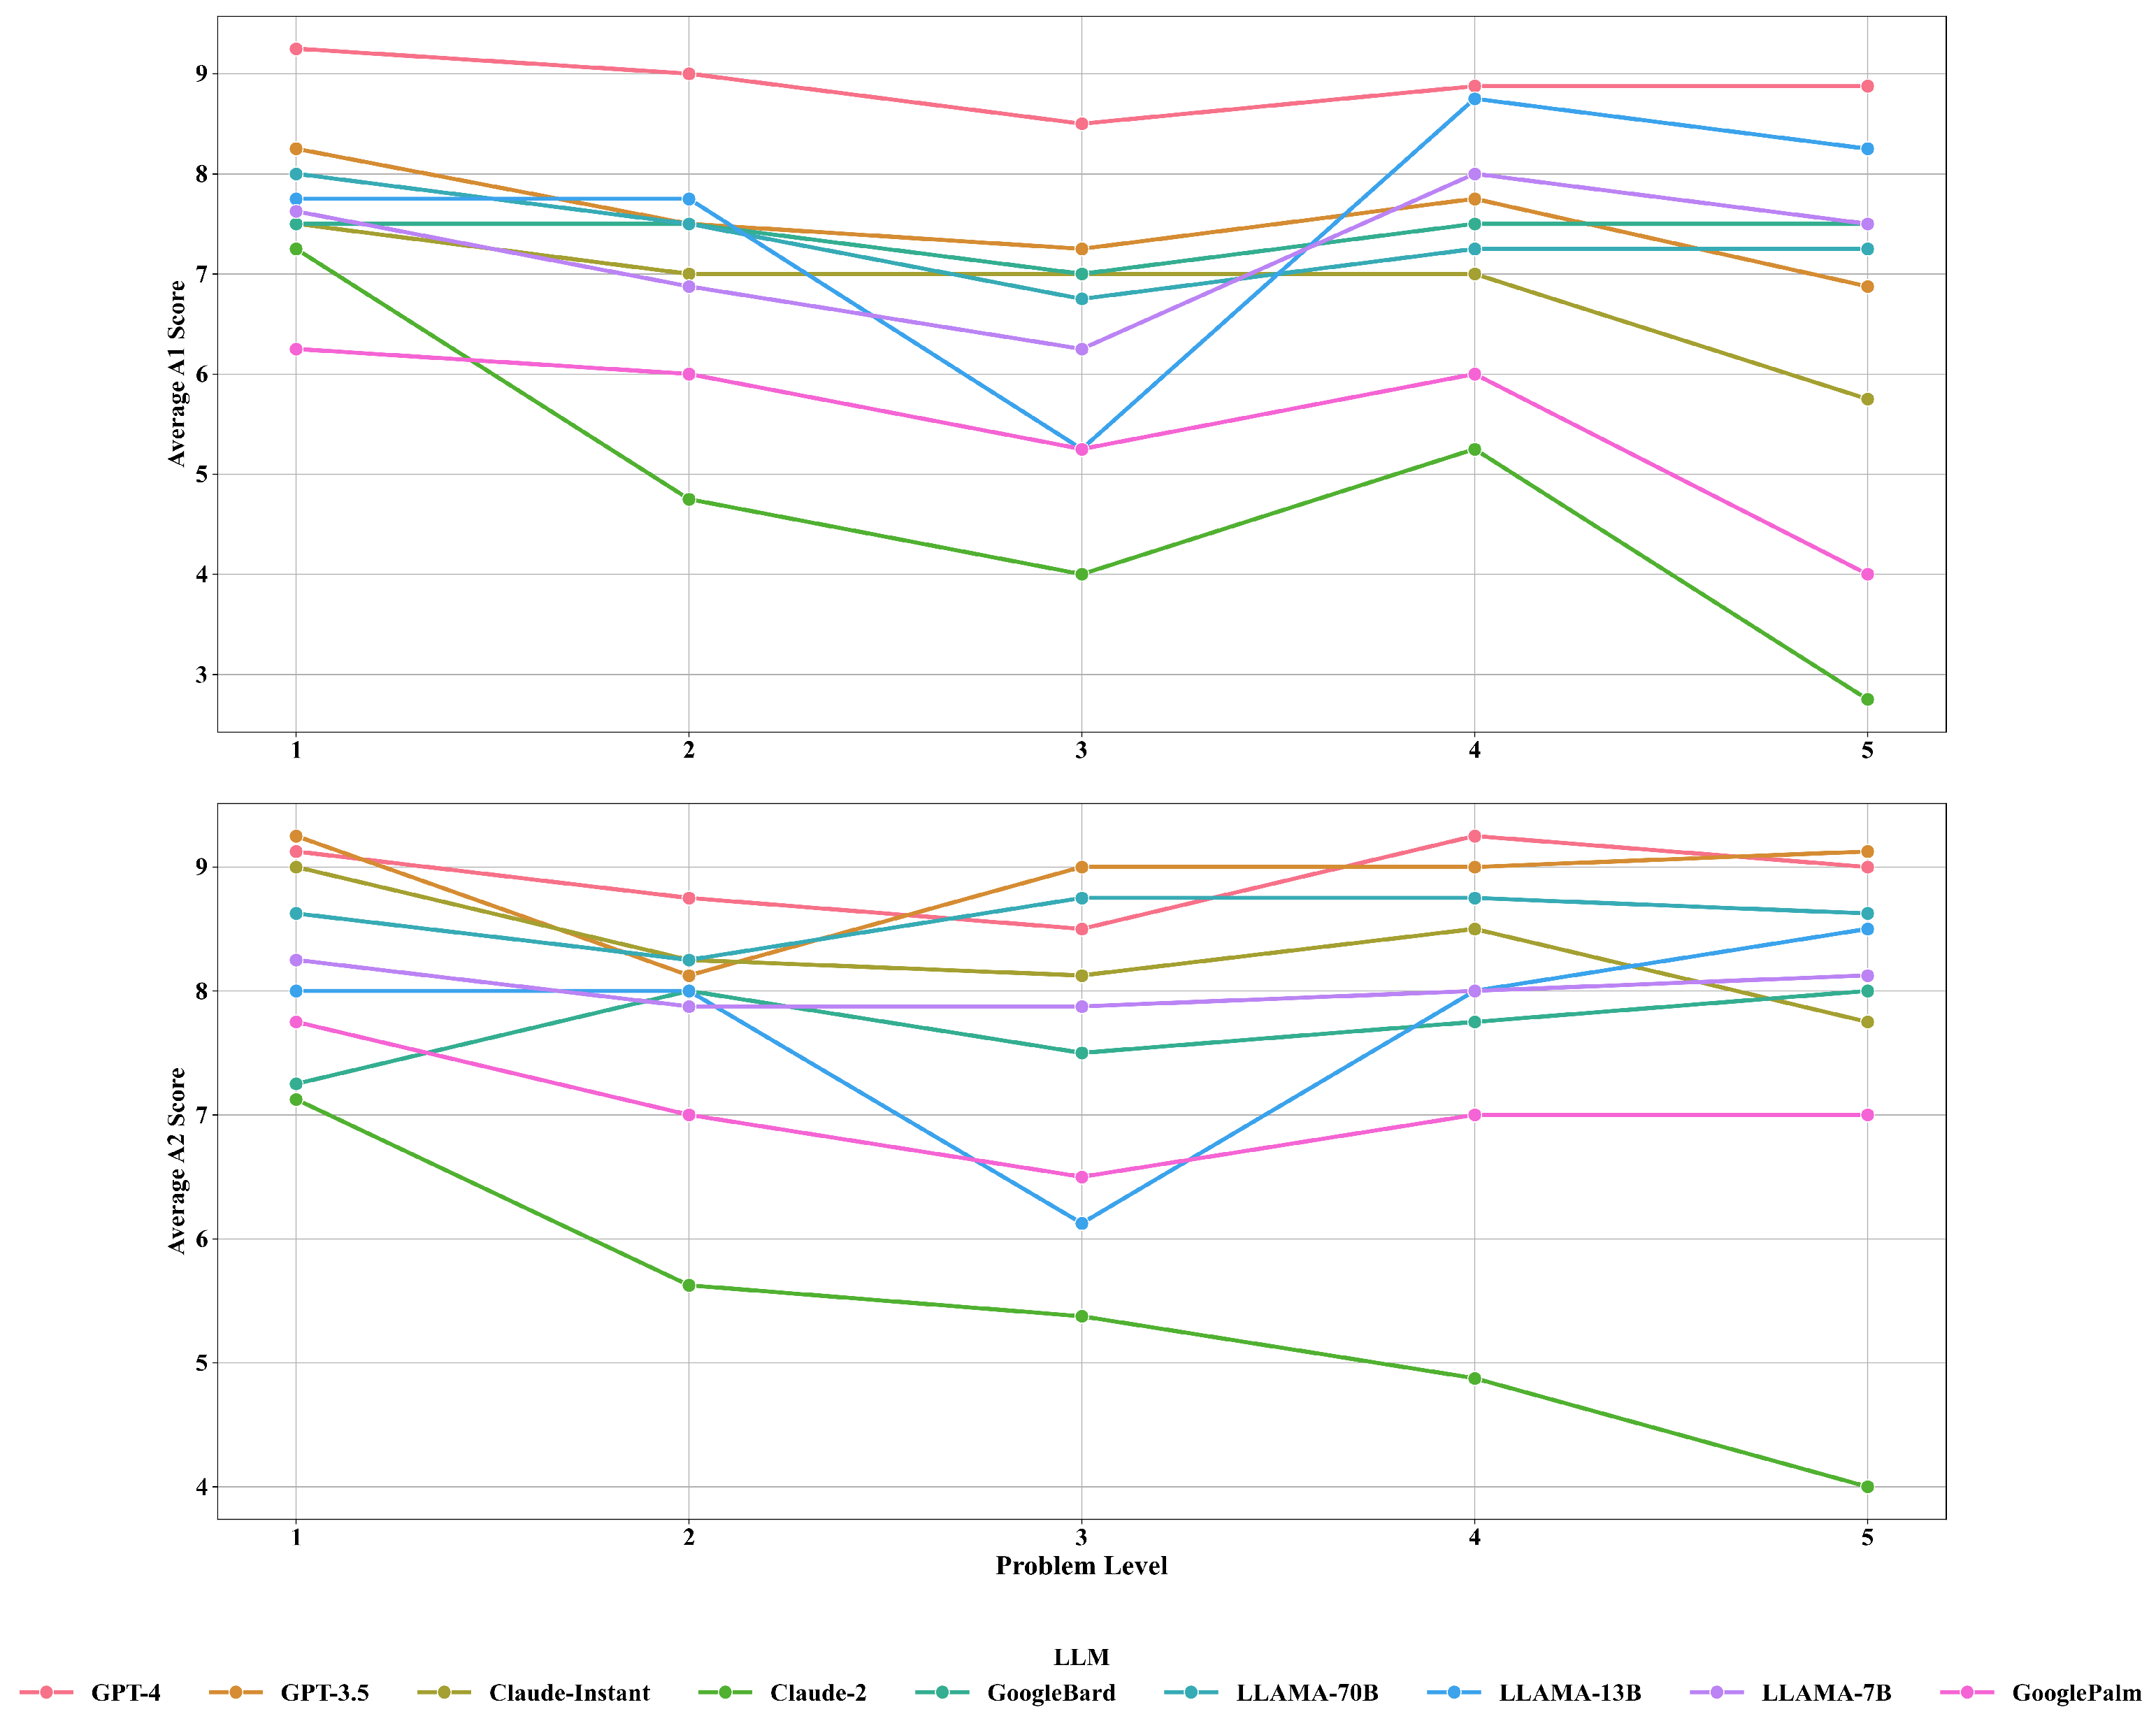
4.5. Problem Levels vs. Confidence Scores
Table A2 illuminates the average confidence scores (both absolute and relative) expressed by different LLMs at different problem levels (ranging from 1 to 5). The visualization for the table is represented in Figure 6. Predominantly, as the level of problem increased, the confidence score of the LLMs decreased. The pattern is very noticeable in the absolute confidence score. LLMs felt less sure about their answers as the level of the problem increased. This result suggests that LLMs may struggle to sustain high confidence when prompted with convoluted tasks.
Figure 6.
Average confidence scores by problem level.
In contrast, the relative confidence scores did not follow this trend (Table A2). Even though there was a slight reduction in relative confidence as the problem level increased, it was not as steep as the drop in absolute confidence. This implies that LLMs might understand their performance compared to others as relatively stable across different problem levels. GPT-4 maintained a high confidence score across all problem levels, indicating its consistency in the self-assessment of its performance. However, models like Claude-2 and Claude-instant presented higher variability in their confidence scores as the level of the problem changed. This is another indication that some models may adapt differently to task difficulties.
4.6. Additional Insights: Prompt Response Observations
In our thorough evaluation, we asked each language model a set of standard questions and closely watched and analyzed how their confidence levels changed with their responses. Importantly, we did not give them any hints about the difficulty of the questions. GPT-4 consistently showed strong confidence levels and performed exceptionally well in handling and responding to simple prompts. It seemed promising at grasping straightforward questions. GPT-3.5 also performed well in understanding prompts, did not need much assistance, and gained more confidence during the study. Bard maintained steady confidence and performed impressively in generating coherent responses to simple prompts without any complex prompting.
Google PaLM-2 also performed well with simple prompting, but as we progressed through a few questions and when prompted to provide the confidence assessment for the upcoming question, this model provided a confidence score and also created a question from the domain we mentioned, solved the question, and then provided the confidence assessment post-answering. This was strange behavior that we encountered with only Google PaLM-2, and it required multiple re-prompting attempts to ensure that the results were consistent.
LLaMA-7B exceeded our expectations, demonstrated a better understanding of prompts, and even rated its confidence separately for Absolute Confidence and Relative Confidence on different problems. LLaMA-13B had impressive speed in understanding prompts but struggled with questions involving real numbers and sometimes hesitated with certain topics. However, when given CoT prompts and revisiting earlier topics, it improved. LLaMA-70B consistently showed high proficiency in understanding prompts and generally had more confidence in its responses. Claude-instant started with lower confidence but gained assurance over time, relying on its training data. Claude-2 responded confidently to simple prompts but faced challenges with advanced mathematics and LSAT Reasoning, which made its confidence drop, and it admitted it needed to be well-prepared for those kinds of questions.
5. Discussion
In this study, we analyzed the self-assessment tendencies in LLMs like GPT, Claude, and LLaMA using their confidence scores and identified potential parallels with the Dunning–Kruger effect. Table A1 and Figure 5 provide compelling observations concerning how the LLMs evaluated their performance across various categories. Although our study did not conclusively confirm the presence of the Dunning–Kruger effect, it yielded valuable observations that corresponded with the conceptual framework of the phenomenon.
GPT-4 exhibited noteworthy consistency in maintaining high confidence scores across the entire spectrum of assessed categories, particularly in the context of LSAT Reasoning tasks. In contrast, models like Claude-2 and Claude-instant demonstrated a more pronounced variance in their confidence scores when evaluated across various categories. Claude-2 showed a relatively low confidence score for LSAT Reasoning; however, it performed better in Truthful Q&A. This difference mirrors the concept of individuals with varying abilities showing inconsistency in assessments. Currently, this observation serves as a parallel rather than a conclusive confirmation of the applicability of the Dunning–Kruger effect in this particular context. LLaMA-70B performed better, with a higher confidence score in LSAT Reasoning and mathematical categories, but had lower confidence in Truthful Q&A. This subtle variation corresponds with the concept that individual LLMs might harbor specialized proficiency domains, analogous to recognizing skill discrepancies among individuals as outlined in the Dunning–Kruger effect.
Referencing Table A2 and Figure 6, we investigated and explored the relationship between problem-level complexity and LLM confidence scores. The observed confidence patterns evoke intriguing connections to the Dunning–Kruger effect despite not constituting definitive evidence. Notably, LLMs displayed heightened confidence scores at lower complexity levels, while a corresponding reduction in confidence scores was evident as task complexity increased. The observed phase of overconfidence is linked to the overestimation aspect of the Dunning–Kruger effect, whereby individuals with weaker abilities tend to overrate their competence. Distinct LLMs displayed diverse confidence score patterns across difficulty levels, underscoring that individuals with varying abilities display different degrees of the Dunning–Kruger effect. Furthermore, models like GPT-4 consistently sustained their confidence levels, mirroring individuals with strong abilities who excel in precise self-assessment.
There are several limitations to this study that need to be acknowledged. Firstly, the evaluation questions used in our experiments were drawn from existing benchmarking datasets rather than being designed specifically for this research. This limits the ability to verify the reliability of the test construction process. A second limitation arises from the possibility of data leakage since the language models examined may have been exposed to the evaluation questions during pre-training. While choosing open-domain problem types to minimize this risk, we cannot fully rule out the impact of prior exposure on model performance. Thirdly, self-assessment ability does not necessarily indicate the comprehension of human cognition, as models lack consciousness. The findings signal trends versus direct evidence of psychological phenomena. Lastly, this study did not design prompts to provide models with strategic contextual information that could influence responses, potentially altering observed relationships between confidence and competence if prompts supplied supportive details. Future work systematically introducing relevant knowledge could address this limitation by comparing performance and self-assessment with and without in-context learning impacts.
6. Conclusions
The observed confidence score patterns in LLMs offer intriguing resemblances to the Dunning–Kruger effect in some cases while opposing it in others. Nevertheless, they do not furnish conclusive evidence of its presence in LLM behavior. To establish a robust association, it is essential to undertake further research encompassing statistical analysis and an expanded set of variables. Nonetheless, our findings serve as a foundation for a more comprehensive investigation into LLMs concerning the Dunning–Kruger effect, elucidating the correlation between self-assessment and competency within artificial intelligence. The complicated aspects of how LLMs work, their biases, and their confidence need a closer and more thorough look. This initiates an inquiry into many questions deserving of focused attention, indicating a wealth of potential insights ready for in-depth exploration. As hinted at by our findings, the parallel between AI cognition and human thought processes suggests a rich field of study. Investigating these aspects will enhance our grasp of artificial intelligence and contribute to the ongoing discourse on how these technologies can be developed and governed responsibly.
Author Contributions
Conceptualization, A.K.S. and B.L.; methodology, A.K.S. and U.D.; validation, B.L., C.D. and S.D.; formal analysis, B.L.; investigation, A.K.S.; resources, A.K.S.; data curation, A.K.S. and U.D.; writing—original draft preparation, S.D. and U.D.; writing—review and editing, B.L., A.K.S. and C.D.; visualization, A.K.S. and B.L.; supervision, C.D.; project administration, A.K.S. and B.L. All authors have read and agreed to the published version of the manuscript.
Funding
This research received no external funding.
Data Availability Statement
The data are available on GitHub at https://github.com/dev-aniketsingh/LLMsConfidenceAssessmentResearch (accessed on 18 December 2023).
Acknowledgments
We would like to thank Joseph Palardy for his help with the study review and valuable feedback. We would also like to acknowledge Liam Wholaver for proofreading and providing feedback on the paper.
Conflicts of Interest
The authors declare no conflicts of interest.
Appendix A. Data
Appendix A.1. Survey Questions
- TruthfulQA: Included ten questions spread over five difficulty levels, with two questions per level. The levels were:
- Level 1:
- Logical Falsehood.
- Level 2:
- Nutrition.
- Level 3:
- Paranormal.
- Level 4:
- Myths and Fairytales.
- Level 5:
- Fiction.
- TruthfulQA Extended: Ten questions spread over five difficulty levels, two per level. The levels were:
- Level 1:
- Proverbs.
- Level 2:
- Superstitions.
- Level 3:
- Misquotations.
- Level 4:
- Misconception.
- Level 5:
- Conspiracies.
- Mathematical Reasoning: Spanning ten questions across the following:
- Level 1:
- Elementary Mathematics.
- Level 2:
- High School Mathematics.
- Level 3:
- High School Statistics.
- Level 4:
- College Mathematics.
- Level 5:
- Abstract Algebra.
- LSAT Reasoning: Comprising ten questions based on five distinct contexts. Each context had two associated questions, with difficulty escalating from level 1 to 5.
Appendix B. Tables and Figures
Appendix B.1. Distribution of Confidence Scores
Figure A1.
Density plots of correctness for different confidence scores (R1 and R2).
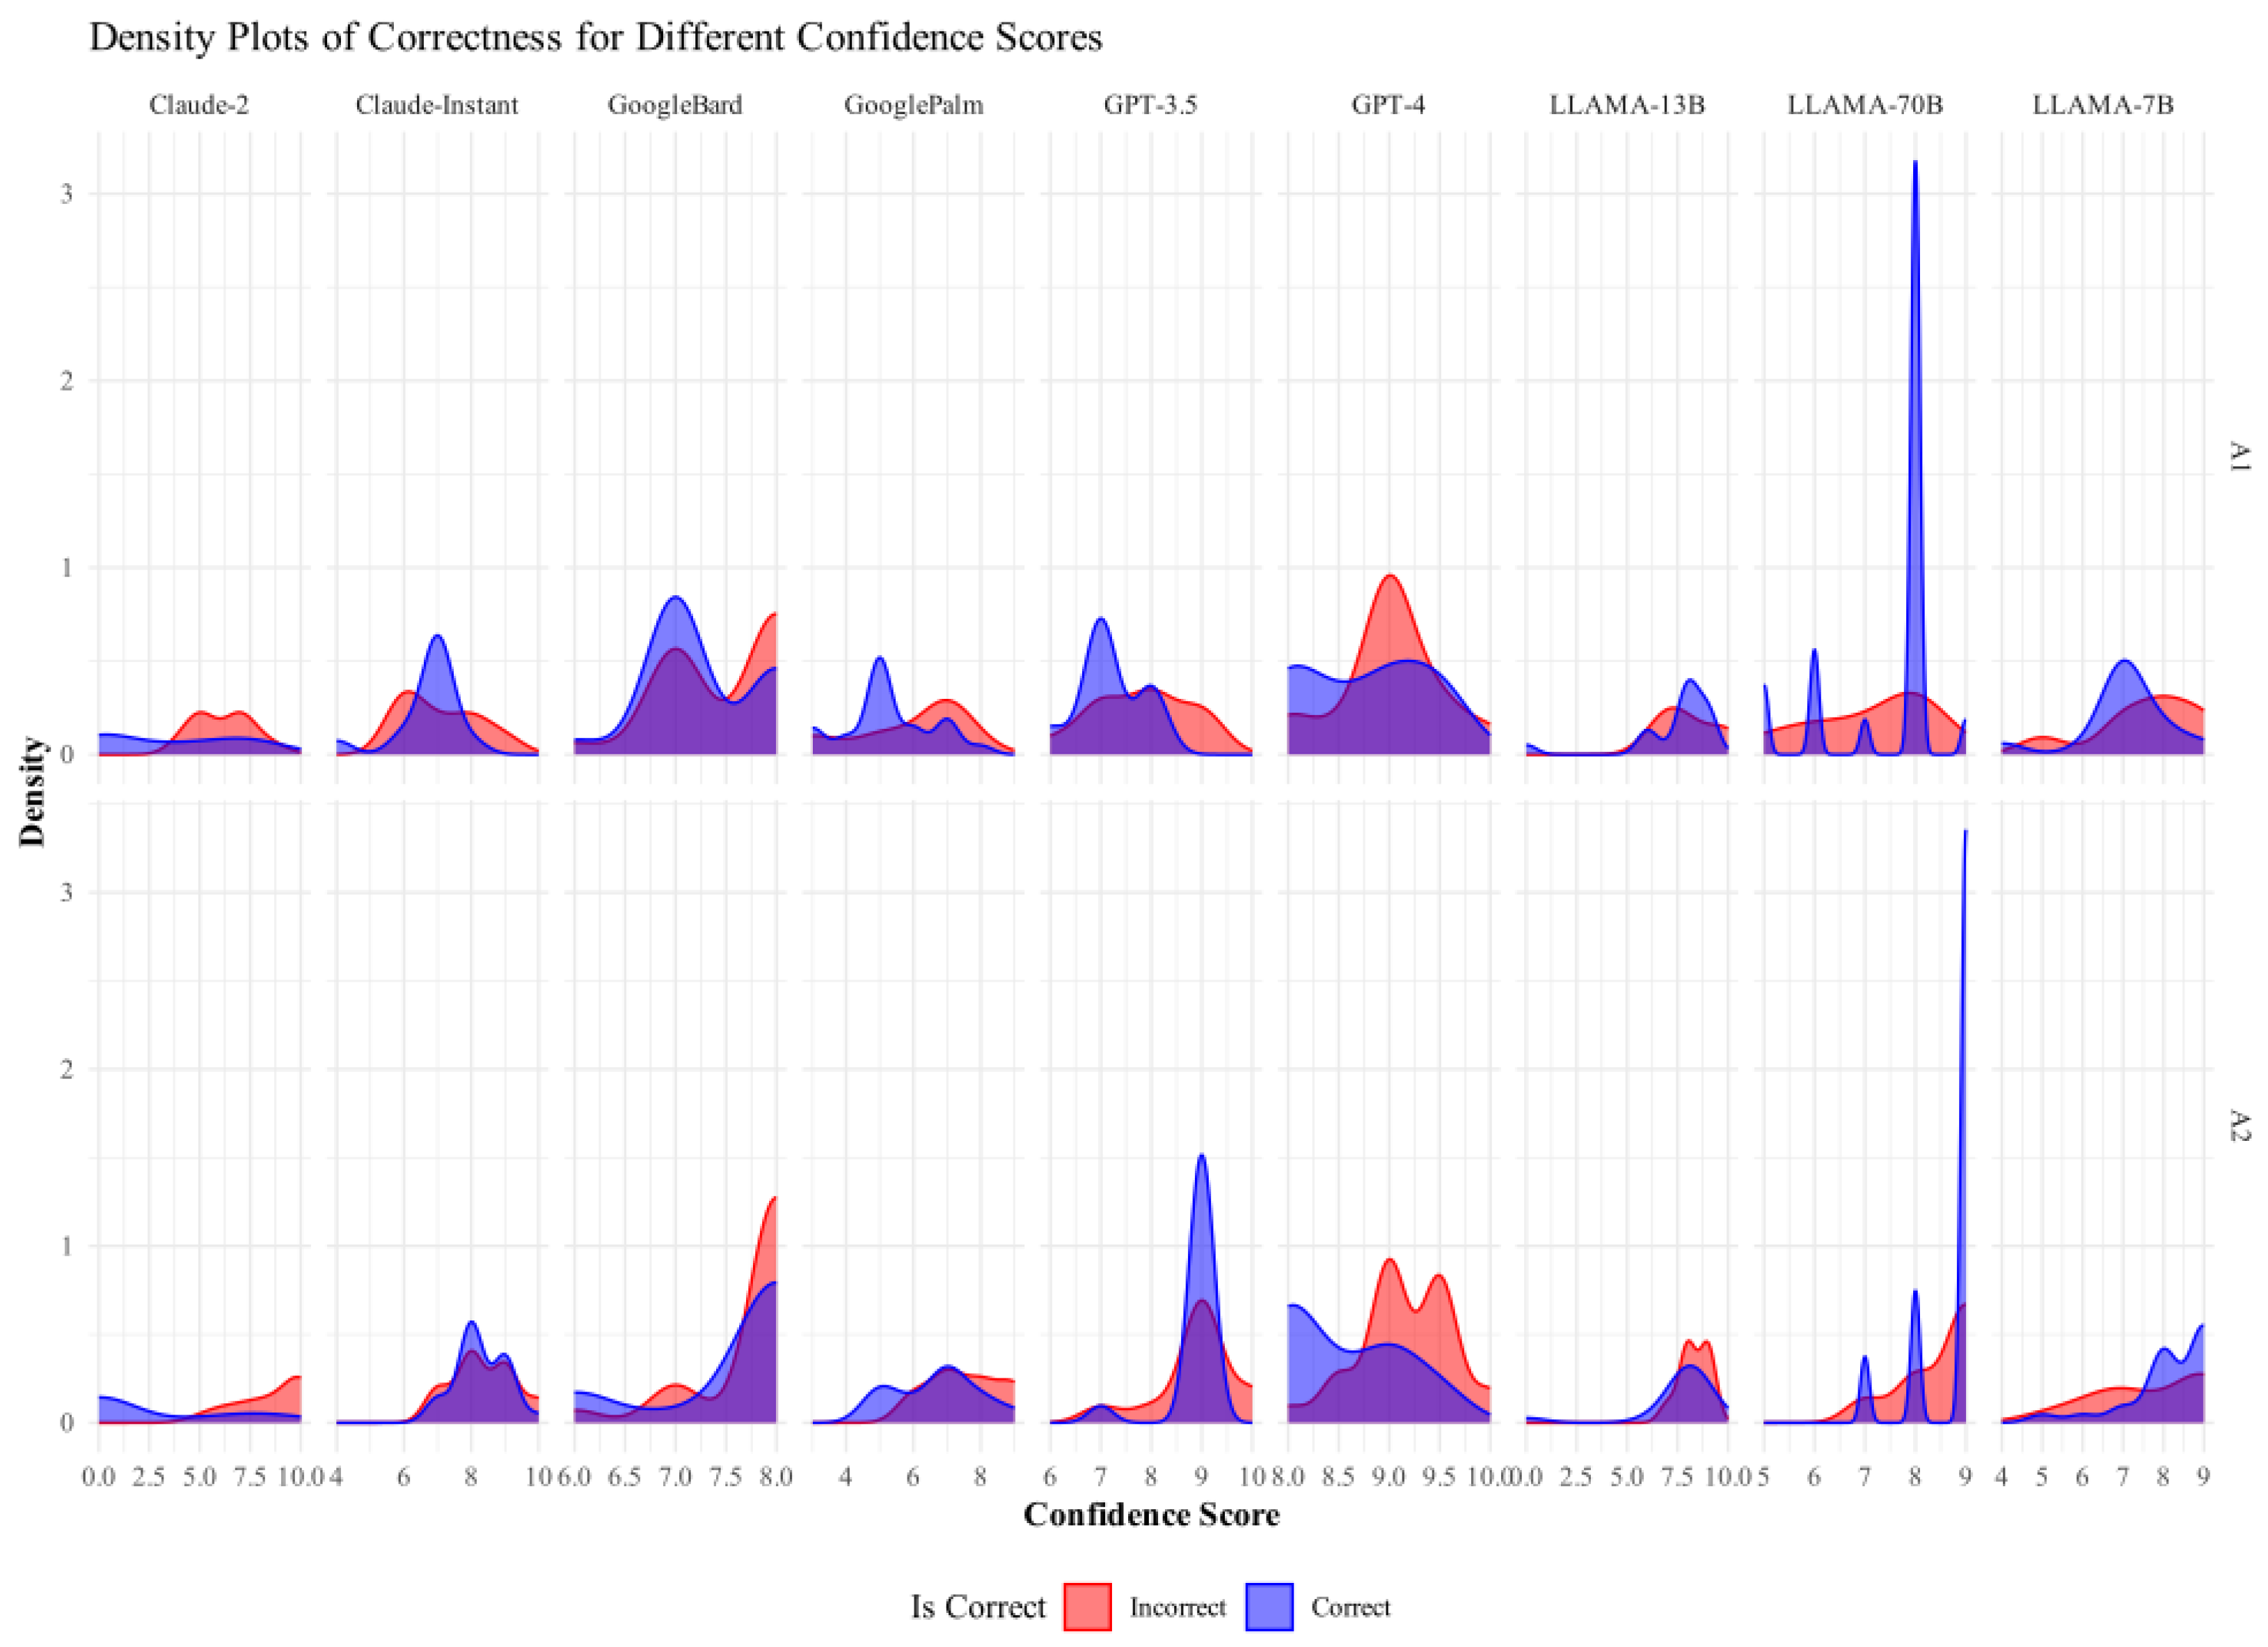
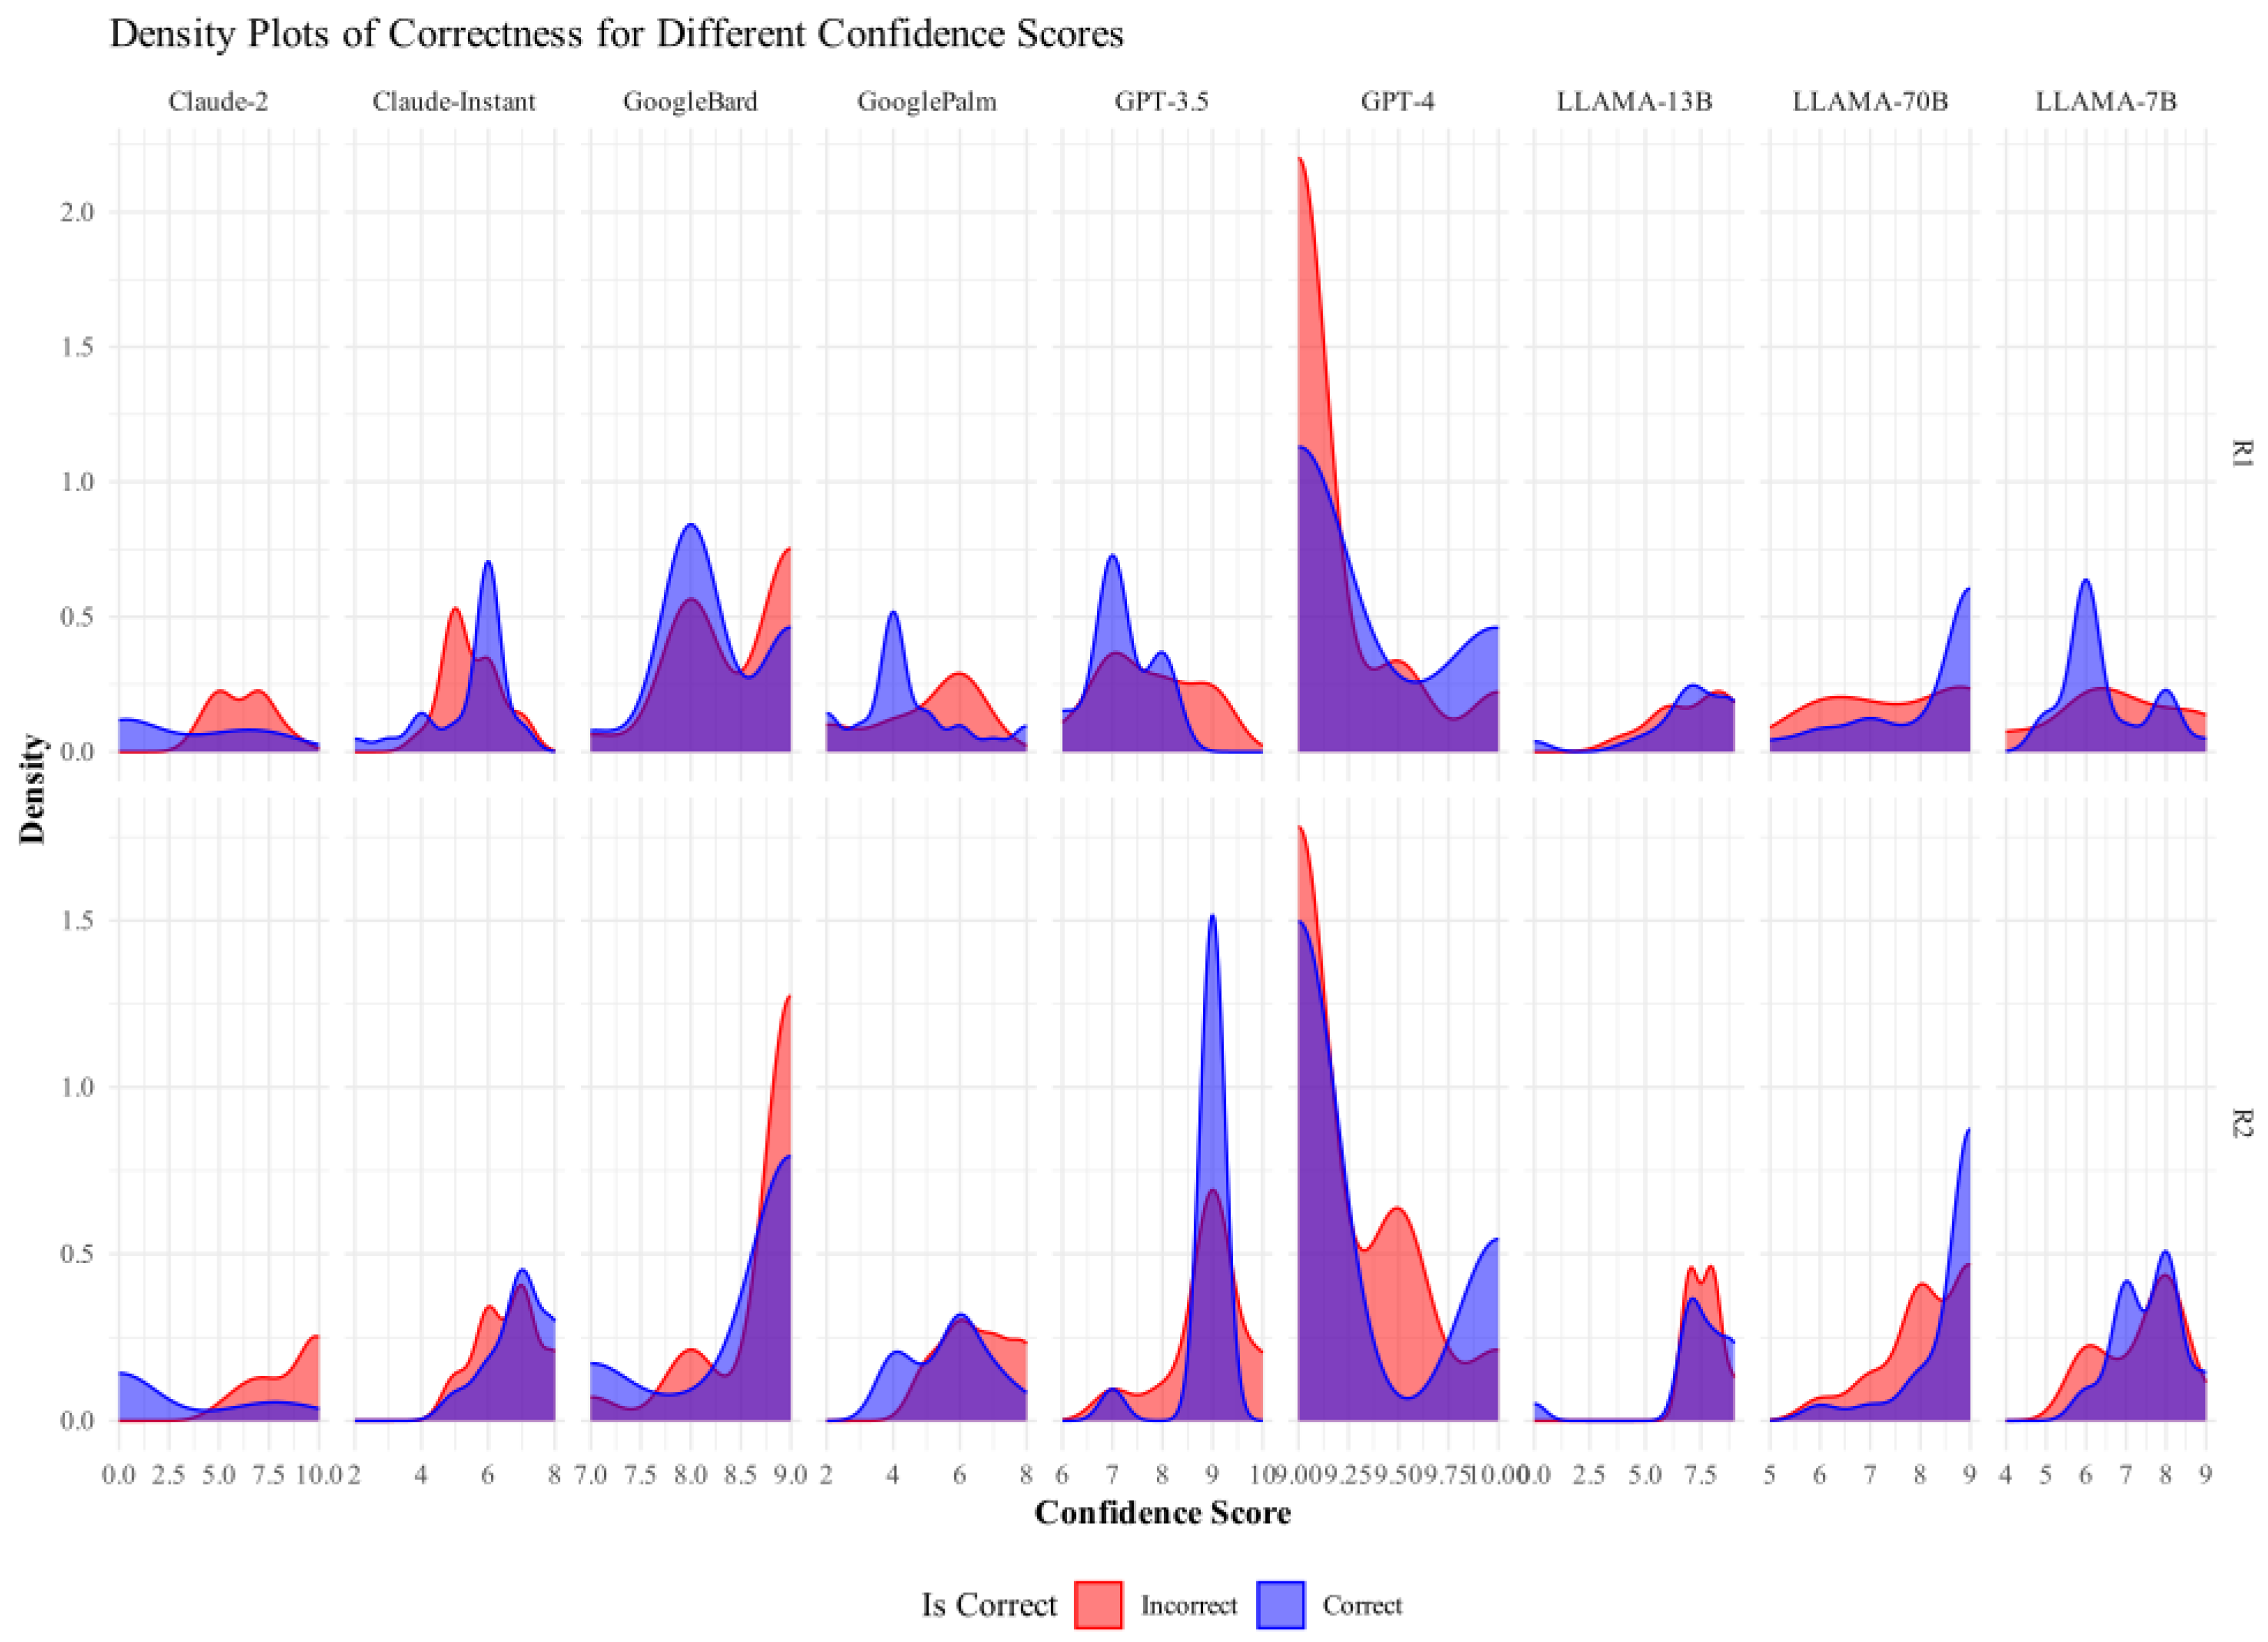
Appendix B.2. Confidence Scores vs. Correctness
The density plot in Figure A2 represents the relationship between LLMs’ confidence scores and their correctness in predicting answers. The density plot branches out each LLM’s confidence score into correct and incorrect categories with distinct colors. A higher region in the density plot indicates that the model was frequently correct or incorrect with specific confidence scores. This plot helped us provide an initial empirical foundation to access the Dunning–Kruger effect in LLMs. We were interested in where the LLMs exhibited high confidence scores and were incorrect or vice versa. This informed us about a misalignment between perceived ability and actual ability.
Figure A2.
Density plot of correctness vs. confidence scores for various language learning models (A1 and A2).
Figure A3.
Density plot of correctness vs. confidence scores for various language learning models (R1 and R2).
Appendix B.3. Category vs. Confidence Scores
Table A1.
Performance and confidence metrics of Large Language Models (LLMs) across different categories.
Table A1.
Performance and confidence metrics of Large Language Models (LLMs) across different categories.
| Category | LLM | Avg_A1 | Avg_A2 | Avg_R1 | Avg_R2 |
|---|---|---|---|---|---|
| LSAT Reasoning | Claude-2 | 0.80 | 0.00 | 0.60 | 0.00 |
| LSAT Reasoning | Claude-instant | 7.00 | 8.20 | 6.00 | 7.20 |
| LSAT Reasoning | Google-Bard | 7.00 | 7.60 | 8.00 | 8.60 |
| LSAT Reasoning | GooglePaLM | 5.40 | 6.40 | 4.80 | 5.40 |
| LSAT Reasoning | GPT-3.5 | 7.00 | 9.00 | 7.00 | 9.00 |
| LSAT Reasoning | GPT-4 | 8.30 | 8.20 | 9.40 | 9.40 |
| LSAT Reasoning | LLaMA-13B | 8.20 | 8.10 | 8.40 | 8.40 |
| LSAT Reasoning | LLaMA-70B | 8.00 | 9.00 | 9.00 | 9.00 |
| LSAT Reasoning | LLaMA-7B | 7.10 | 8.60 | 6.10 | 7.60 |
| Mathematical Reasoning | Claude-2 | 5.60 | 4.40 | 5.20 | 4.40 |
| Mathematical Reasoning | Claude-instant | 6.80 | 8.90 | 5.50 | 7.20 |
| Mathematical Reasoning | Google-Bard | 7.40 | 7.80 | 8.40 | 8.80 |
| Mathematical Reasoning | GooglePaLM | 6.00 | 7.40 | 5.00 | 6.40 |
| Mathematical Reasoning | GPT-3.5 | 7.60 | 9.00 | 7.60 | 9.00 |
| Mathematical Reasoning | GPT-4 | 9.20 | 9.20 | 9.40 | 9.40 |
| Mathematical Reasoning | LLaMA-13B | 8.00 | 8.70 | 7.20 | 8.10 |
| Mathematical Reasoning | LLaMA-70B | 8.00 | 9.00 | 9.00 | 8.90 |
| Mathematical Reasoning | LLaMA-7B | 7.80 | 8.40 | 6.80 | 7.40 |
| Truthful Q&A | Claude-2 | 6.40 | 8.60 | 6.40 | 8.60 |
| Truthful Q&A | Claude-instant | 6.80 | 8.10 | 5.20 | 6.45 |
| Truthful Q&A | Google-Bard | 7.60 | 7.70 | 8.60 | 8.70 |
| Truthful Q&A | GooglePaLM | 5.30 | 7.20 | 4.30 | 6.20 |
| Truthful Q&A | GPT-3.5 | 7.75 | 8.80 | 7.65 | 8.80 |
| Truthful Q&A | GPT-4 | 9.05 | 9.15 | 9.00 | 9.05 |
| Truthful Q&A | LLaMA-13B | 7.00 | 7.05 | 6.10 | 6.55 |
| Truthful Q&A | LLaMA-70B | 6.70 | 8.20 | 6.90 | 8.00 |
| Truthful Q&A | LLaMA-7B | 7.05 | 7.55 | 6.75 | 7.55 |
Appendix B.4. Problem Level vs. Confidence Scores
Table A2.
Average confidence scores by problem level and LLM.
Table A2.
Average confidence scores by problem level and LLM.
| Problem Level | LLM | Avg_A1 | Avg_A2 | Avg_R1 | Avg_R2 |
|---|---|---|---|---|---|
| 1 | Claude-2 | 7.250 | 7.125 | 7.000 | 7.125 |
| 1 | Claude-instant | 7.500 | 9.000 | 6.000 | 7.375 |
| 1 | Google-Bard | 7.500 | 7.250 | 8.500 | 8.250 |
| 1 | GooglePaLM | 6.250 | 7.750 | 5.250 | 6.750 |
| 1 | GPT-3.5 | 8.250 | 9.250 | 8.000 | 9.250 |
| 1 | GPT-4 | 9.250 | 9.125 | 9.500 | 9.250 |
| 1 | LLaMA-13B | 7.750 | 8.000 | 7.500 | 7.750 |
| 1 | LLaMA-70B | 8.000 | 8.625 | 8.500 | 8.250 |
| 1 | LLaMA-7B | 7.625 | 8.250 | 6.875 | 7.500 |
| 2 | Claude-2 | 4.750 | 5.625 | 4.750 | 5.625 |
| 2 | Claude-instant | 7.000 | 8.250 | 5.750 | 7.000 |
| 2 | Google-Bard | 7.500 | 8.000 | 8.500 | 9.000 |
| 2 | GooglePaLM | 6.000 | 7.000 | 5.500 | 6.000 |
| 2 | GPT-3.5 | 7.500 | 8.125 | 7.500 | 8.125 |
| 2 | GPT-4 | 9.000 | 8.750 | 9.125 | 9.000 |
| 2 | LLaMA-13B | 7.750 | 8.000 | 7.500 | 7.750 |
| 2 | LLaMA-70B | 7.500 | 8.250 | 8.000 | 8.250 |
| 2 | LLaMA-7B | 6.875 | 7.875 | 6.125 | 7.375 |
| 3 | Claude-2 | 4.000 | 5.375 | 4.000 | 5.375 |
| 3 | Claude-instant | 7.000 | 8.125 | 5.500 | 7.000 |
| 3 | Google-Bard | 7.000 | 7.500 | 8.000 | 8.500 |
| 3 | GooglePaLM | 5.250 | 6.500 | 4.250 | 5.500 |
| 3 | GPT-3.5 | 7.250 | 9.000 | 7.250 | 9.000 |
| 3 | GPT-4 | 8.500 | 8.500 | 9.000 | 9.000 |
| 3 | LLaMA-13B | 5.250 | 6.125 | 4.500 | 5.625 |
| 3 | LLaMA-70B | 6.750 | 8.750 | 7.250 | 8.500 |
| 3 | LLaMA-7B | 6.250 | 7.875 | 5.750 | 7.625 |
| 4 | Claude-2 | 5.250 | 4.875 | 5.000 | 4.875 |
| 4 | Claude-instant | 7.000 | 8.500 | 5.750 | 7.000 |
| 4 | Google-Bard | 7.500 | 7.750 | 8.500 | 8.750 |
| 4 | GooglePaLM | 6.000 | 7.000 | 5.000 | 6.000 |
| 4 | GPT-3.5 | 7.750 | 9.000 | 7.750 | 9.000 |
| 4 | GPT-4 | 8.875 | 9.250 | 9.125 | 9.375 |
| 4 | LLaMA-13B | 8.750 | 8.000 | 7.750 | 7.875 |
| 4 | LLaMA-70B | 7.250 | 8.750 | 7.750 | 8.500 |
| 4 | LLaMA-7B | 8.000 | 8.000 | 7.500 | 7.625 |
| 5 | Claude-2 | 2.750 | 4.000 | 2.500 | 4.000 |
| 5 | Claude-instant | 5.750 | 7.750 | 4.375 | 5.750 |
| 5 | Google-Bard | 7.500 | 8.000 | 8.500 | 9.000 |
| 5 | GooglePaLM | 4.000 | 7.000 | 3.000 | 6.000 |
| 5 | GPT-3.5 | 6.875 | 9.125 | 6.875 | 9.125 |
| 5 | GPT-4 | 8.875 | 9.000 | 9.250 | 9.500 |
| 5 | LLaMA-13B | 8.250 | 8.500 | 7.500 | 8.000 |
| 5 | LLaMA-70B | 7.250 | 8.625 | 8.250 | 8.875 |
| 5 | LLaMA-7B | 7.500 | 8.125 | 6.750 | 7.500 |
References
- Vaswani, A.; Shazeer, N.M.; Parmar, N.; Uszkoreit, J.; Jones, L.; Gomez, A.N.; Kaiser, L.; Polosukhin, I. Attention is All you Need. In Proceedings of the NIPS 2017, Long Beach, CA, USA, 4–9 December 2017. [Google Scholar]
- Wang, L.; Ma, C.; Feng, X.; Zhang, Z.; Yang, H.; Zhang, J.; Chen, Z.Y.; Tang, J.; Chen, X.; Lin, Y.; et al. A Survey on Large Language Model based Autonomous Agents. arXiv 2023, arXiv:abs/2308.11432. [Google Scholar]
- Zhuang, Y.; Liu, Q.; Ning, Y.; Huang, W.; Lv, R.; Huang, Z.; Zhao, G.; Zhang, Z.; Mao, Q.; Wang, S.; et al. Efficiently Measuring the Cognitive Ability of LLMs: An Adaptive Testing Perspective. arXiv 2023, arXiv:abs/2306.10512. [Google Scholar]
- Shiffrin, R.M.; Mitchell, M. Probing the psychology of AI models. Proc. Natl. Acad. Sci. USA 2023, 120, e2300963120. [Google Scholar] [CrossRef] [PubMed]
- tse Huang, J.; Lam, M.H.A.; Li, E.; Ren, S.; Wang, W.; Jiao, W.; Tu, Z.; Lyu, M.R. Emotionally Numb or Empathetic? Evaluating How LLMs Feel Using EmotionBench. arXiv 2023, arXiv:abs/2308.03656. [Google Scholar]
- Kruger, J.; Dunning, D. Unskilled and Unaware of It: How Difficulties in Recognizing One’s Own Incompetence Lead to Inflated Self-Assessments. J. Personal. Soc. Psychol. 1999, 77, 1121. [Google Scholar] [CrossRef] [PubMed]
- Dunning, D. The dunning-kruger effect. On being ignorant of one’s own ignorance. Adv. Exp. Soc. Psychol. 2011, 44, 247–296. [Google Scholar] [CrossRef]
- Ouyang, L.; Wu, J.; Jiang, X.; Almeida, D.; Wainwright, C.; Mishkin, P.; Zhang, C.; Agarwal, S.; Slama, K.; Ray, A.; et al. Training language models to follow instructions with human feedback. Adv. Neural Inf. Process. Syst. 2022, 35, 27730–27744. [Google Scholar]
- Liang, P.; Bommasani, R.; Lee, T.; Tsipras, D.; Soylu, D.; Yasunaga, M.; Zhang, Y.; Narayanan, D.; Wu, Y.; Kumar, A.; et al. Holistic Evaluation of Language Models; Holistic Evaluation of Language Models. arXiv 2022, arXiv:2211.09110. [Google Scholar]
- Schick, T.; Dwivedi-Yu, J.; Dessì, R.; Raileanu, R.; Lomeli, M.; Zettlemoyer, L.; Cancedda, N.; Scialom, T. Toolformer: Language Models Can Teach Themselves to Use Tools. arXiv 2023, arXiv:2302.04761. [Google Scholar]
- Kraus, M.; Bingler, J.A.; Leippold, M.; Schimanski, T.; Senni, C.C.; Stammbach, D.; Vaghefi, S.A.; Webersinke, N. Enhancing Large Language Models with Climate Resources. arXiv 2023, arXiv:2304.00116. [Google Scholar] [CrossRef]
- Yogatama, D.; de Masson d’Autume, C.; Connor, J.; Kocisky, T.; Chrzanowski, M.; Kong, L.; Lazaridou, A.; Ling, W.; Yu, L.; Dyer, C.; et al. Learning and Evaluating General Linguistic Intelligence. arXiv 2019, arXiv:1901.11373. [Google Scholar]
- Acerbi, A.; Stubbersfield, J. Large language models show human-like content biases in transmission chain experiments. Proc. Natl. Acad. Sci. USA 2023, 120, e2313790120. [Google Scholar] [CrossRef]
- Jones, E.; Steinhardt, J. Capturing Failures of Large Language Models via Human Cognitive Biases. arXiv 2022, arXiv:abs/2202.12299. [Google Scholar]
- Ye, H.; Liu, T.; Zhang, A.; Hua, W.; Jia, W. Cognitive Mirage: A Review of Hallucinations in Large Language Models. arXiv 2023, arXiv:abs/2309.06794. [Google Scholar]
- Sorin, M.V.; Brin, M.D.; Barash, M.Y.; Konen, M.E.; Charney, M.P.A.; Nadkarni, M.G.; Klang, M.E. Large Language Models (LLMs) and Empathy—A Systematic Review. medRxiv 2023. [Google Scholar] [CrossRef]
- Ranaldi, L.; Pucci, G. When Large Language Models contradict humans? Large Language Models’ Sycophantic Behaviour. arXiv 2023, arXiv:2311.09410. [Google Scholar]
- Huang, J.; Gu, S.S.; Hou, L.; Wu, Y.; Wang, X.; Yu, H.; Han, J. Large Language Models Can Self-Improve. arXiv 2022, arXiv:abs/2210.11610. [Google Scholar]
- Lin, Z.; Trivedi, S.; Sun, J. Generating with Confidence: Uncertainty Quantification for Black-box Large Language Models. arXiv 2023, arXiv:abs/2305.19187. [Google Scholar]
- Hendrycks, D.; Burns, C.; Basart, S.; Zou, A.; Mazeika, M.; Song, D.; Steinhardt, J. Measuring Massive Multitask Language Understanding. In Proceedings of the 2021 International Conference on Learning Representations (ICLR), Virtual, 3–7 May 2021. [Google Scholar]
- Hendrycks, D.; Burns, C.; Basart, S.; Critch, A.; Li, J.; Song, D.; Steinhardt, J. Aligning AI With Shared Human Values. In Proceedings of the 2021 International Conference on Learning Representations (ICLR), Virtual, 3–7 May 2021. [Google Scholar]
- Zhong, W.; Wang, S.; Tang, D.; Xu, Z.; Guo, D.; Wang, J.; Yin, J.; Zhou, M.; Duan, N. AR-LSAT: Investigating Analytical Reasoning of Text. arXiv 2021, arXiv:2104.06598. [Google Scholar]
- Wang, S.; Liu, Z.; Zhong, W.; Zhou, M.; Wei, Z.; Chen, Z.; Duan, N. From lsat: The progress and challenges of complex reasoning. IEEE ACM Trans. Audio Speech Lang. Process. 2022, 30, 2201–2216. [Google Scholar] [CrossRef]
- Zhao, W.X.; Zhou, K.; Li, J.; Tang, T.; Wang, X.; Hou, Y.; Min, Y.; Zhang, B.; Zhang, J.; Dong, Z.; et al. A Survey of Large Language Models. arXiv 2023, arXiv:abs/2303.18223. [Google Scholar]
- Sareen, S. Chain of Thoughts vs. Tree of Thoughts for Language Learning Models (LLMs). 2023. Available online: https://medium.com/@sonal.sareen/chain-of-thoughts-vs-tree-of-thoughts-for-language-learning-models-llms-fc11efbd20ab (accessed on 18 December 2023).
Disclaimer/Publisher’s Note: The statements, opinions and data contained in all publications are solely those of the individual author(s) and contributor(s) and not of MDPI and/or the editor(s). MDPI and/or the editor(s) disclaim responsibility for any injury to people or property resulting from any ideas, methods, instructions or products referred to in the content. |
© 2024 by the authors. Licensee MDPI, Basel, Switzerland. This article is an open access article distributed under the terms and conditions of the Creative Commons Attribution (CC BY) license (https://creativecommons.org/licenses/by/4.0/).