Abstract
The existence of missing values reduces the amount of knowledge learned by the machine learning models in the training stage thus affecting the classification accuracy negatively. To address this challenge, we introduce the use of Support Vector Machine (SVM) regression for imputing the missing values. Additionally, we propose a two-level classification process to reduce the number of false classifications. Our evaluation of the proposed method was conducted using the PIMA Indian dataset for diabetes classification. We compared the performance of five different machine learning models: Naive Bayes (NB), Support Vector Machine (SVM), k-Nearest Neighbours (KNN), Random Forest (RF), and Linear Regression (LR). The results of our experiments show that the SVM classifier achieved the highest accuracy of 94.89%. The RF classifier had the highest precision (98.80%) and the SVM classifier had the highest recall (85.48%). The NB model had the highest F1-Score (95.59%). Our proposed method provides a promising solution for detecting diabetes at an early stage by addressing the issue of missing values in the dataset. Our results show that the use of SVM regression and a two-level classification process can notably improve the performance of machine learning models for diabetes classification. This work provides a valuable contribution to the field of diabetes research and highlights the importance of addressing missing values in machine learning applications.
1. Introduction
According to World Health Organization (WHO), 246 million people are affected by diabetes worldwide. It is also expected in 2025 that the number will increase to 380 million. Nearly 3.8 million people die from diabetes each year [1]. Hence, early detection of diabetes will save lots of people.
Diabetes is caused due to prolonged increase of the blood glucose level [2] due to the deficiency of insulin segregation, where the important cells such as beta cells in the pancreas fail to produce the sufficient amount of insulin that is needed for transferring energy from blood to the body cells [3]. This situation causes type 1 diabetes. There is one more type known as type 2 diabetes where the body cells cannot use the insulin produced by the pancreas [4]. The number of patients with type 2 is more than the number of patients with type 1.
The long-term presence of diabetes can cause huge health complications such as retinal hemorrhages [5] and vision blindness [6], stoke, Arterial Stiffness [7], kidney problems, lower limbs amputations and so on [8]. Early detection of diabetes helps the patient to start his treatment to reduce the above-mentioned health risks [9,10]. Research by [11] shows that almost 80% of people can be reversed from diabetes and its harmful effects if the detection is efficiently done at the early stage. The presence of diabetes can be confirmed by taking a blood test and measuring the glucose level.
Recently much research was carried out in the field of machine learning to efficiently detect the presence of diabetes at an early stage [12,13,14,15]. However, the machine learning model needs a complete set of features to learn the relationship between input features and the target class [16]. Most of the time, the machine learning models struggle at the training stage to produce good performance when the number of missing values in the dataset is increased [17,18]. It is an important step in the pre-processing stage where the missing values for each input feature are identified and handled [19].
The missing value is a frequent problem that is caused because of various reason which includes technical problems, lack of data observation, user privacy issues, human error, and so on. Data can be missing both in tabular data and in time series data [20]. This missing value causes a huge uncertainty in the classification. Hence these missing values should be identified and carefully handled. Improper handling of missing values will create an unusual effect such as increased classification time, and a high false rate [21]. The missing value handling should be closely monitored as it should not alter the entire relationship among the data. Usually, missing values are handled in two ways known as deletion and replacement. Deletion of the instances having at least one missing value is the easiest method [22] but it comes with many problems such as imbalance of instances, loss of information, lack of representation of the relationship among the input features, and the target class and so on, hence it is not advised to implement the deletion to overcome missing values. One of the important problems that come with deleting is the high false rate as the important instances are deleted. The second approach is widely used in many research works as it makes use of any statistical approach to calculate a value that is substituted as missing values. Statistical methods such as mean, variance, standard deviation, and so on are used as substitution [23]. This second method also creates few significant problems such as misinterpretation of data. It is preferred to use the second method when the number of data instances is very less [24].
Recently, many studies use more advanced methods to handle missing data such as Support Vector Machines (SVM), Naïve Bayes (NB), expectation maximization, and so on to substitute values for missing values, despite high computation time, the use of these method proves to be effective in terms of classification performance than the other traditional two approaches [25].
In our proposed work we make use of SVM to substitute the missing values in the dataset. Since the machine learning model has been used, the accuracy of recovering missing values is increased, also a second-level classification is been added to the process. This second level gets activated only when the previous classification level classifies as negative, so a second conformation is done. This stage ensures that the false classification rate is reduced significantly. The main purpose of the second-level classification is to recheck the result when the classification returns negative.
The main contributions of this paper are as follows.
- Implement the SVM model to recover the missing values and convert them to a complete dataset.
- Develop secondary classification in the dataset with resolved missing values to help in the classification process.
Firstly, a separate SVM model is trained for each missing feature set and the resultant value is used as the substitution in case of missing values. The SVM model is one of the popular machine learning models and it is most frequently used [26]. Secondly, a next-level classification is done to prevent a false classification rate. ID3 decision trees execution over the dataset with missing values and this result help to reduce the false classification.
The rest of the paper is as follows. Section 2 summarizes a few existing works in the field of machine learning-based diabetes classification. Section 3 contains the work of the proposed methodology. Section 4 presents the results and compares them with existing methods, and finally, Section 5 contains the conclusion.
2. Related Works
Notable research works were carried out in the field of using machine learning models in diabetes detection. Various researchers have proposed many architectures starting from single model-based [27] to complex ensemble-based models [28,29,30] to detect diabetes. A research survey done by [31] shows some comparisons of various machine learning models along with their performance in different scenarios. Table 1 lists a few of the existing works done in the field of missing value handling for classification. Convolution neural network (CNN) is used by a research work [32] on ECG signals data to detect diabetes at an early stage, to handle missing values and to increase the performance, they have used multiple CNNs to classify diabetes. They have compared their work with traditional CNN, RF, LR and their proposed method had the best accuracy of 98.59%. A research work [33] uses SVM and adds an extra layer called an explanation module for improving the performance of the classification. The extra added layer acts as a black box during the learning stage of the classifier. They have compared their proposed method with six existing models and the highest accuracy of 94% was obtained from their proposed method. Shrestha et al. [34] adopted Sparse Balance SVM (SB-SVM) to deal with unbalanced data and obtain high accuracy. SB-SVM is used in the proposed system to produce sparsity and, implicitly, to choose the most important features from the unbalanced data. Statistical analysis and logistic regression were used to choose 12 highly important characteristics for diabetes prediction. The suggested model accurately predicts type 2 diabetes mellitus with a 76.39% accuracy. Arora et al. [35] offers the K-means clustering algorithm with SVM for diabetes prediction. The K-means features are then categorized using an SVM classifier. On the Pima Indians Diabetes Database, the combined technique outperforms the traditional SVM-based classification.
The hyperparameters of the machine learning models can also be optimized to produce good results in various biomedical tasks such as DNA sequence recognition [36] and breast cancer recognition [37], including for diabetes classification, as described by [21]. Heuristic optimization methods could be adopted for hyperparameter optimisation [38]. Features are also selected based on their importance and powerful models such as SVM and RF are optimized by finding the correct hyperparameter values to classify better diabetes.
Voting is one of the methods used when multiple machine learning models were ensembled in the process of classification [39]. Ref. [40] proposes a soft voting process by ensembling Random Forest, Logistic Regression, and Naïve Bayes. They have compared their proposed work with nine existing machine learning models and their proposed ensemble model produces the highest accuracy which is 80.98%.
A work proposed by [41] uses oversampling to avoid missing values in the pre-processing stage. Synthetic Minority Over-sampling Technique (SMOTE) is used to balance the instances across all the classes. Random forest classifier produces the highest accuracy in the experiment with an F1-Score of 0.8453.
Research work carried out in the field of traffic congestion done by [42] uses imputation for resolving missing values. Traffic congestion needs lots of information such as traffic flow, speed and congestion level and so on. The data end up with one or more missing values most of the time. The missing values are completely random with respect to observation. Apart from the normal features such as periodicity, road similarity, and temporal coherence, the authors consider additional features for the imputation using temporal coherence. The proposed joint matrix factorization method shows good results in imputing all the features. Identifying correct neighbors can decrease the inconsistency in imputation. In case, if the data is heterogeneous then the choice of an appropriate neighbor will be very difficult. Similarity rules with a small change in variation can be used as mentioned in [43]. The authors have used both real and synthetic datasets to show the efficiency of their proposed work.
HoloClean [44] is a system for detecting and repairing errors in real-world data. It uses a combination of probabilistic models and active learning techniques to identify and fix errors in large-scale datasets. HoloClean operates on the principle of data cleaning [45] as an interactive process between the system and a human expert, and it provides a comprehensive set of data cleaning operators that allow the user to easily specify cleaning constraints and correct errors. The HoloClean methodology consists of three main stages: error detection, error diagnosis, and error repair. In error detection, HoloClean employs statistical methods to automatically identify and flag data errors. The system uses probabilistic models to estimate the likelihood of errors in different parts of the data, and it presents these probabilities to the user in the form of a ranked list of errors. This allows the user to easily prioritize which errors to address first. In error diagnosis, HoloClean uses active learning techniques to assist the user in diagnosing the cause of errors and determining the correct repair. HoloClean can suggest repair suggestions to the user, and it can also ask the user to provide additional constraints or label examples to help improve the accuracy of its error detection and repair algorithms. In error repair, HoloClean provides a set of repair operators that allow the user to easily apply corrections to the data. These operators include basic operations such as value correction, record deletion, and record insertion, as well as more advanced operations such as record aggregation, record splitting, and record merging. HoloClean also provides a way to keep track of the changes made to the data over time, so that the user can easily revert to previous versions if necessary.
Several extensions or improvements of the HoloClean system exist. One of the papers proposed a data repairing approach that combined constraints and ensemble learning, which outperformed HoloClean in terms of precision and recall [46]. Another paper proposed the use of selection rules as a type of tuple-level constraint and demonstrated that their approach outperformed HoloClean in terms of speed, memory consumption and precision and recall of error detection and correction [47]. Cui et al. [48] proposed a new solution for cleaning multi-source heterogeneous data in Lakehouse MHDP by combining the optimization of HoloClean with an interactive system based on DCs (Denial Constraints). The system includes algorithms for parsing data and a real-time feedback system that allows users to participate in cleaning work.

Table 1.
Comparison of few works in missing value handling.
Table 1.
Comparison of few works in missing value handling.
| Ref. | Method | Description | Comments |
|---|---|---|---|
| [49] | Covariance Matrix Estimation | The authors have analysed the general pattern across the features and predict the values for missing features based on the common pattern. | It is difficult when there is no common pattern in the dataset and the performance will be low. |
| [50] | Autoencoder | Imputation and Classification are done parallelly by using autoencoder. The hidden layer and output nodes are adjusted based on the missing values present in the dataset. | Transfer learning can be incorporated to enhance the performance of the imputation. |
| [51] | kNN model | The existing dataset with missing values is fed into the kNN model to identify the relationship among the features and the target class. Finally, the missing values are replaced with the classification results. | The correctness of relationship can increase when some dimension reduction strategy are applied. |
| [52] | Regression | The authors have used regression and have replaced missing values based on correlation coefficients. | If the instances have high variance between them, the proposed system gives less performance. |
| [53] | Fuzzy C-Means clustering | A threshold value is fixed for each feature and a cluster membership function is developed to find the replacement value for the incomplete instances. | Huge noisy can be avoided by applying hierarchal clustering in the high dimension space. |
| [44] | HoloClean | Missing values are handled by making a probabilistic inference to predict missing values based on available data and denial constraints specified by the user. Predictions are made using the Expectation Maximization (EM) algorithm. | The accuracy of the predictions can be improved by specifying more accurate denial constraints. |
Based on the literature survey, we found a few problems that can be addressed in the diabetes classification. Firstly, there is there is a need for an effective method for recovering missing values and building a classifier that can work in an incomplete dataset. These two problems are addressed in the next section. Despite the large amount of research work in diabetic classification, the following needs to be addressed.
- 1.
- Improve the classification accuracy;
- 2.
- Reduce the rate of false classification;
- 3.
- Effectively handle missing values.
3. Proposed Missing Values Handling Methodology
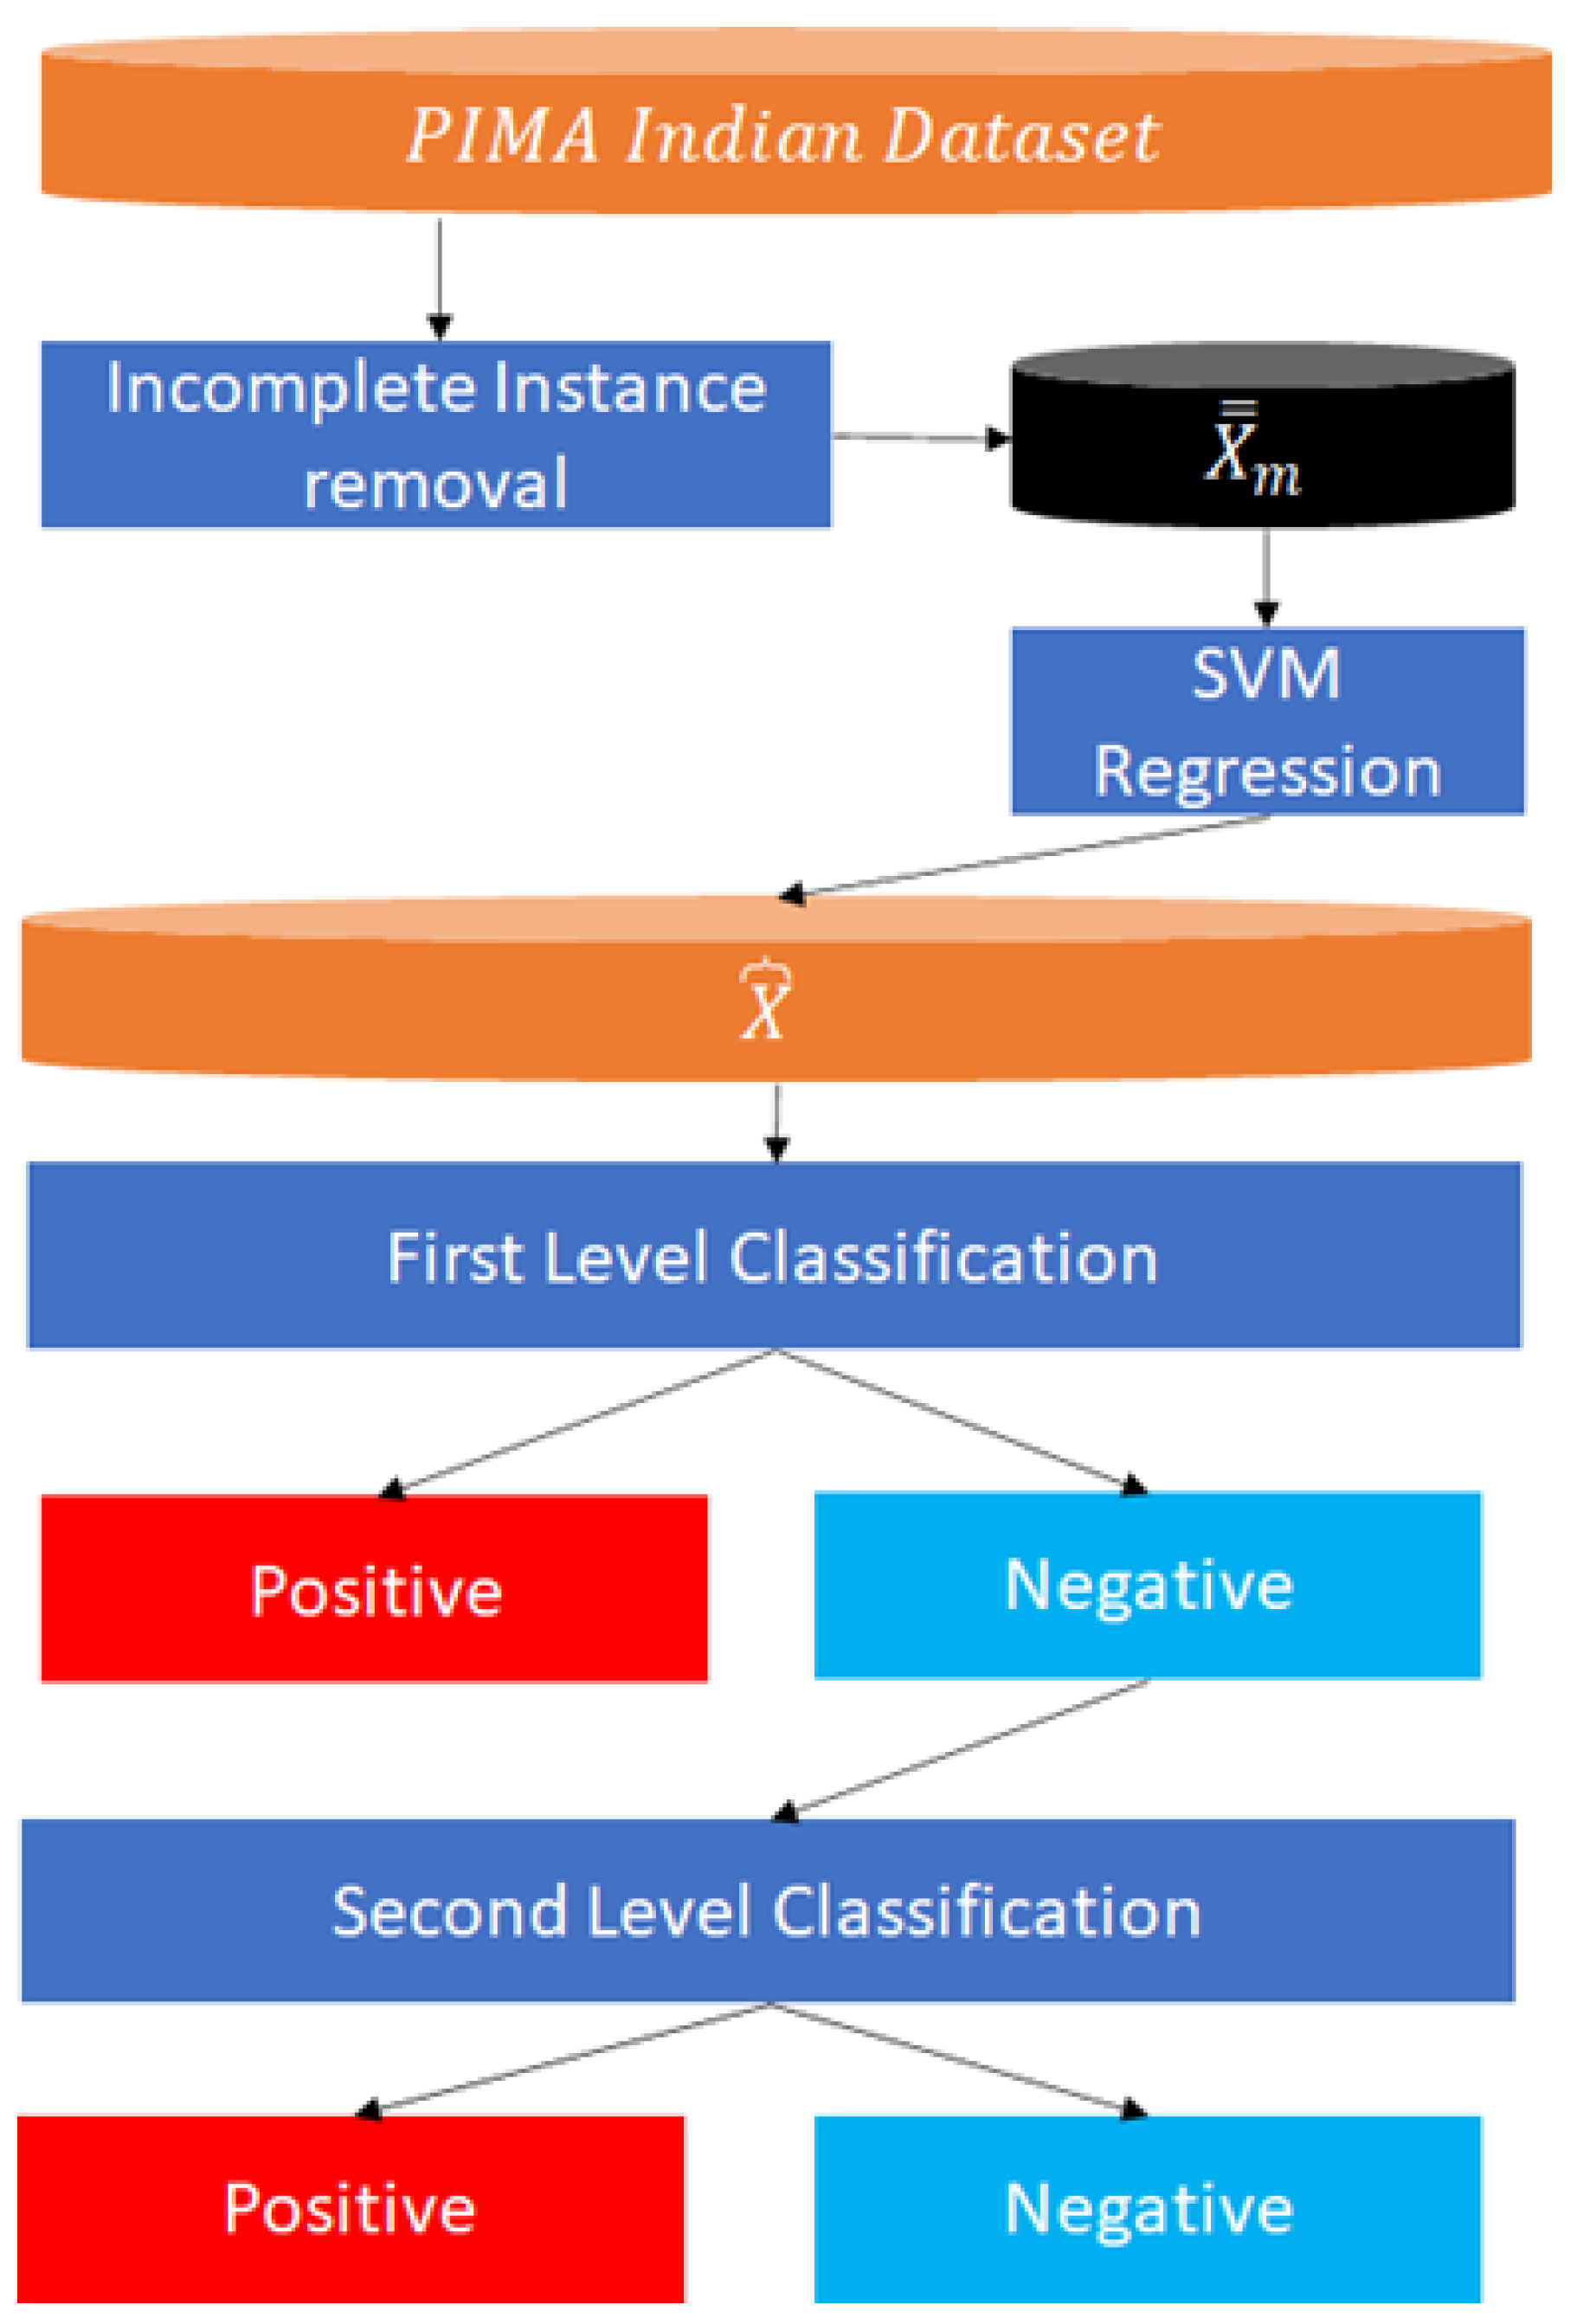
The proposed method using SVM classifier has the ability to recover the missing values and the false classification rate is highly reduced by introducing an extra classifier. Figure 1 shows the architecture of the proposed methodology.
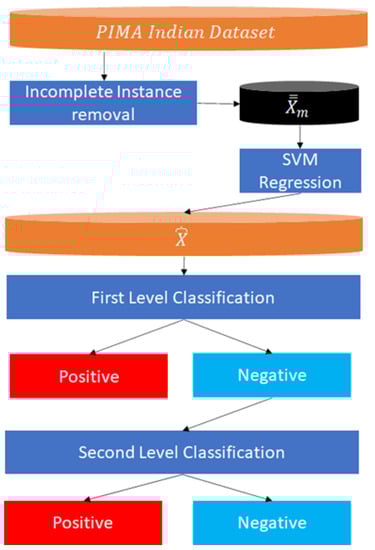
Figure 1.
Workflow of the proposed methodology.
The first step is the separation of incomplete instances from the dataset. These instances are inputted by the SVM regressor and converted into complete instances. These processed instances are then classified into two layers. The second layer is activated only when the first layer gives a negative result. This second-level classification prevents false negative results.
3.1. SVM Based Imputation of Missing Values
The SVM machine learning model is a multipurpose model that can be used for both regressions as well as classification [54,55]. In this section, we describe how SVM can be used for the imputation. The input data for SVM can be represented as X, Y, where i∈ 1, 2, 3, … n and n is the total number of samples. X represents a k dimensional features and Y is either 1 (for diabetes positive) or −1 (for diabetes negative). The SVM draws a hyperplane between the samples which could able to separate the instances based on their class. The hyperplane can be defined as Equation (1) for diabetes positive, or Equation (2) for diabetes negative.
The datapoints which are placed parallel to the hyperplane are known as support vectors () as defined by Equation (3).
In our case, the support vector should be a complete instance (an instance without any missing value), hence the condition is described in Equation (4). A missing value is represented as a Possible Support Vector :
For each feature, a separate SVM is constructed, so the k dimensional input will have k number of SVMs. Each SVM is a regression model dedicated to determining the value of the respective feature. At first, the set of incomplete instances is removed from the dataset as per Equation (5).
Each SVM model is trained using the input . For each SVM model, the target variable is unique and thus, it could reconstruct the dataset by recovering all the missing values. The resultant has no missing values as all the missing values will be imputed by the respective SVM.
Equations (6) and (7) hold during the imputation process, as the number of instances for training the SVM will be equal or lower than the original number of instances because the incomplete instances will be removed. Furthermore, the number of instances after the regression will always be equal to the original number of instances because all the incomplete instances will be converted into complete instances without any missing values. The Algorithm 1 explains the working of the SVM imputation process.
3.2. Second Level of Classification
The cost of false calculation is very important, it is acceptable for a normal patient to get classified as a diabetes patient because, the patient can further confirm his negativity by taking a secondary test, but when a diabetes patient is classified as negative, it is very dangerous, as he might avoid the second level of the test. So, to tackle this problem, an extra layer is added which will get activated whenever the classification results in negative.
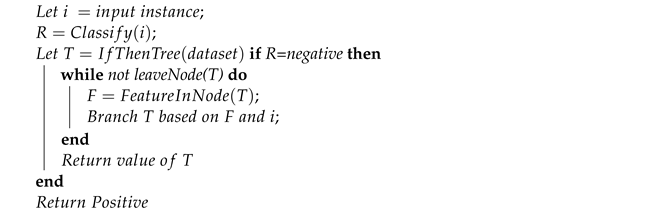
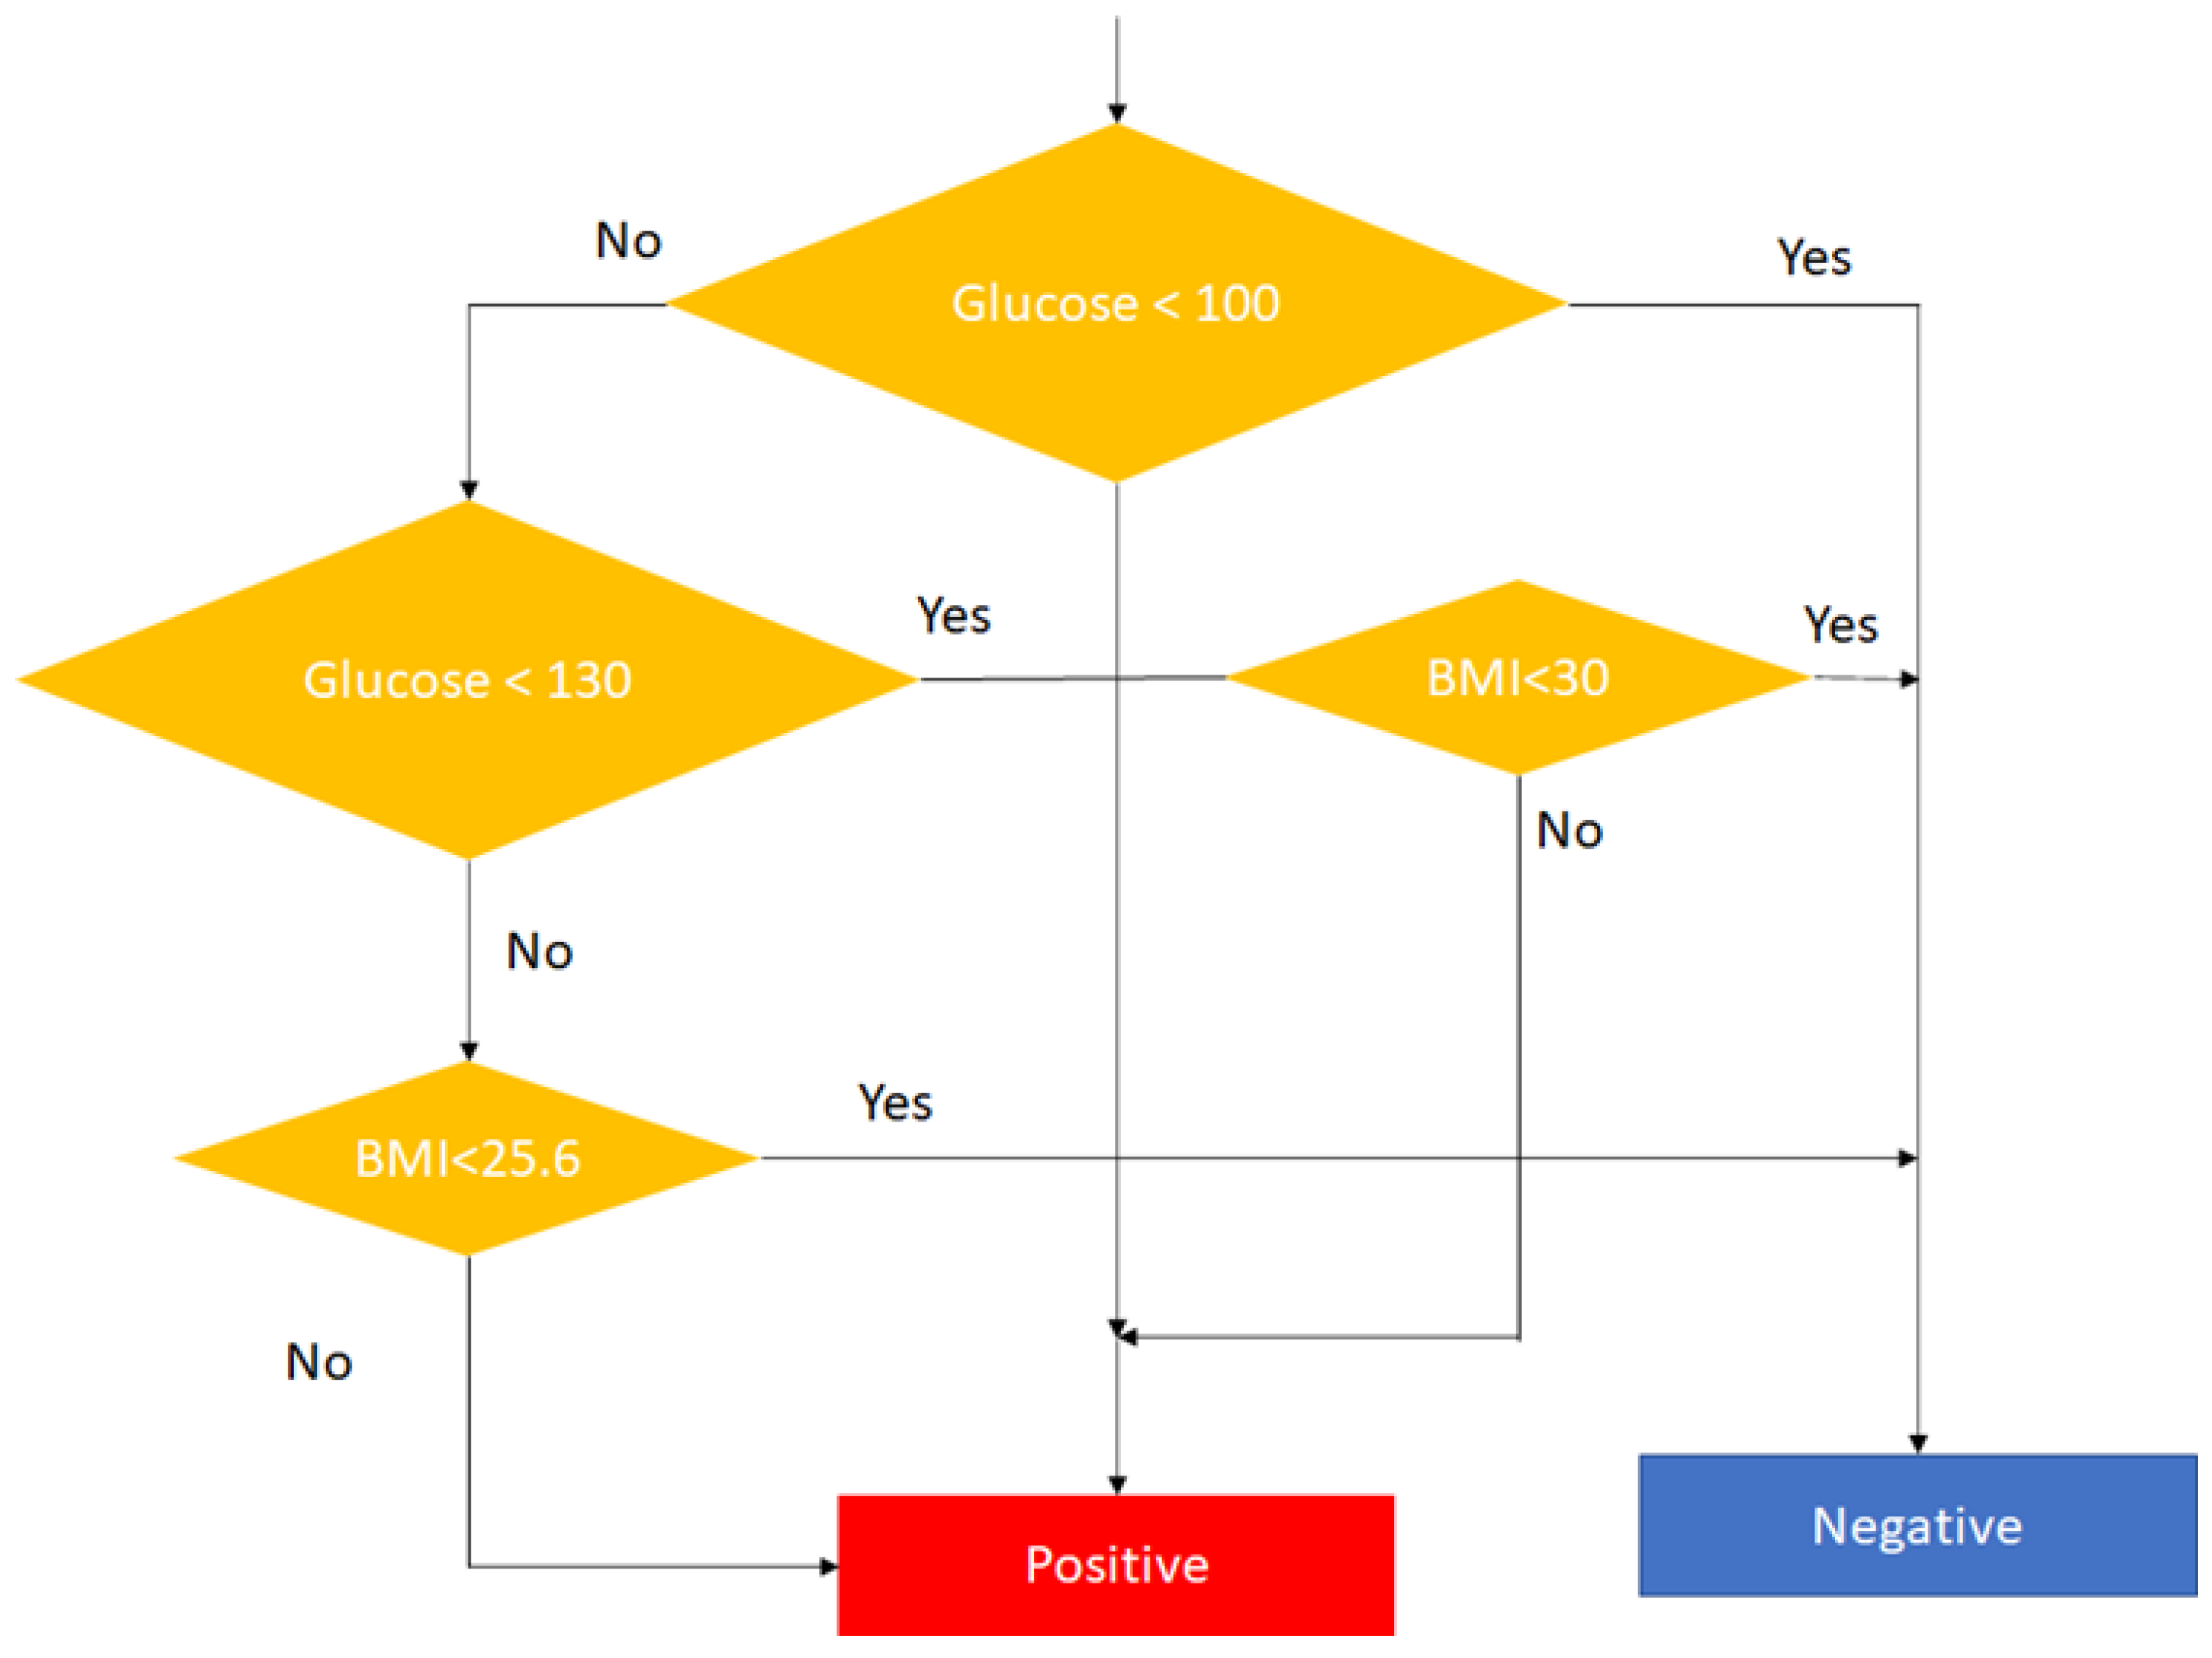
We have implemented the ID3 model as the second-level classification. As all the missing values are now removed, the data is ready for the next stage, which is IF–THEN generation. Two important features (Glucose and BMI) are selected based on the high correlation value and the IF–THEN rules are generated as per Figure 2.
| Algorithm 1: SVM Imputation |
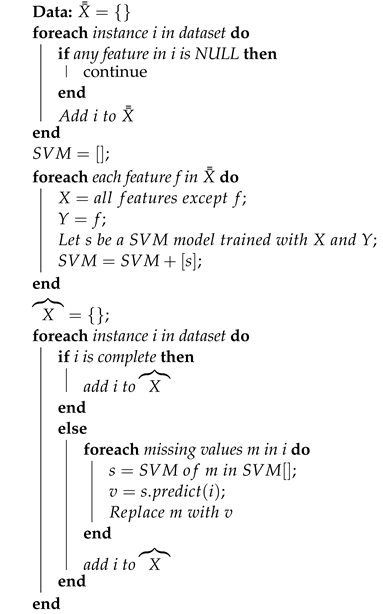 |

Figure 2.
The flow diagram of ID3 classification.
Algorithm 2 exhibits the working of the second level classification using ID3. It can also be noted that the second level classification activates only when the first classification returns negative. The introduction of second-level classification reduces the false classification rate significantly.
| Algorithm 2: Second Level Classification |
 |
4. Results and Discussion
4.1. Dataset
To evaluate the performance of the proposed work, we have used a standard dataset called PIMA Indian for diabetes classification. We have used five classifiers called Naïve Bayes (NB), Support Vector Machine (SVM), k Nearest Neighbours (KNN), Random Forest (RF), and Linear Regression (LR) for the experiment. The 10-fold validation is used in the experiment. Table 2 shows the summary of the features in the dataset. Table 3 displays the frequency of the class distribution in the dataset.
Table 2.
Dataset Description.
Table 3.
Class distribution in the dataset.
The first step is to measure how many missing values are present in each feature. These incomplete instances are first converted to complete instances by the SVM classifier. Table 4 shows the number of missing values for each feature in the dataset. Figure 3 shows the correlation of the features in the dataset. The proposed method expects features should be correlated with the target variable. An uncorrelated feature with the target variable is very difficult to estimate and imputation cannot be done.
Table 4.
Missing values in each feature.
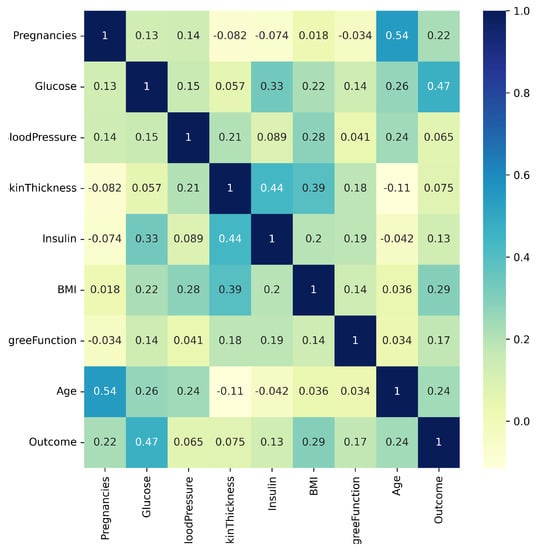
Figure 3.
Correlation between the features.
4.2. Perfromance Evaluation
The performance is measured using four parameters such as accuracy (Equation (8)), precision (Equation (9)), recall (Equation (10)), and F1-Score (Equation (11)). The four parameters used in the experiment are explained as follows
- True Positive (TP): if a diabetes patient is classified as positive.
- True Negative (TN): if a non-diabetes patient is classified as negative.
- False Positive (FP): if a non-diabetes patient is classified as positive.
- False Negative (FN): if a diabetes patient is classified as negative.
4.3. Results
The first and simplest method to solve the missing values is to delete the incomplete instances. The SVM classifier produces the highest accuracy of 71.13% when the incomplete instances are deleted. The LR gives the least accuracy of 61%. As the instances are deleted, the important instances are also deleted. This causes the machine learning models to learn less about the relationship between input features and the target class. Table 5 shows the precision, recall, and F1 score of the five machine learning models.
Table 5.
Performance of ML models (deletion).
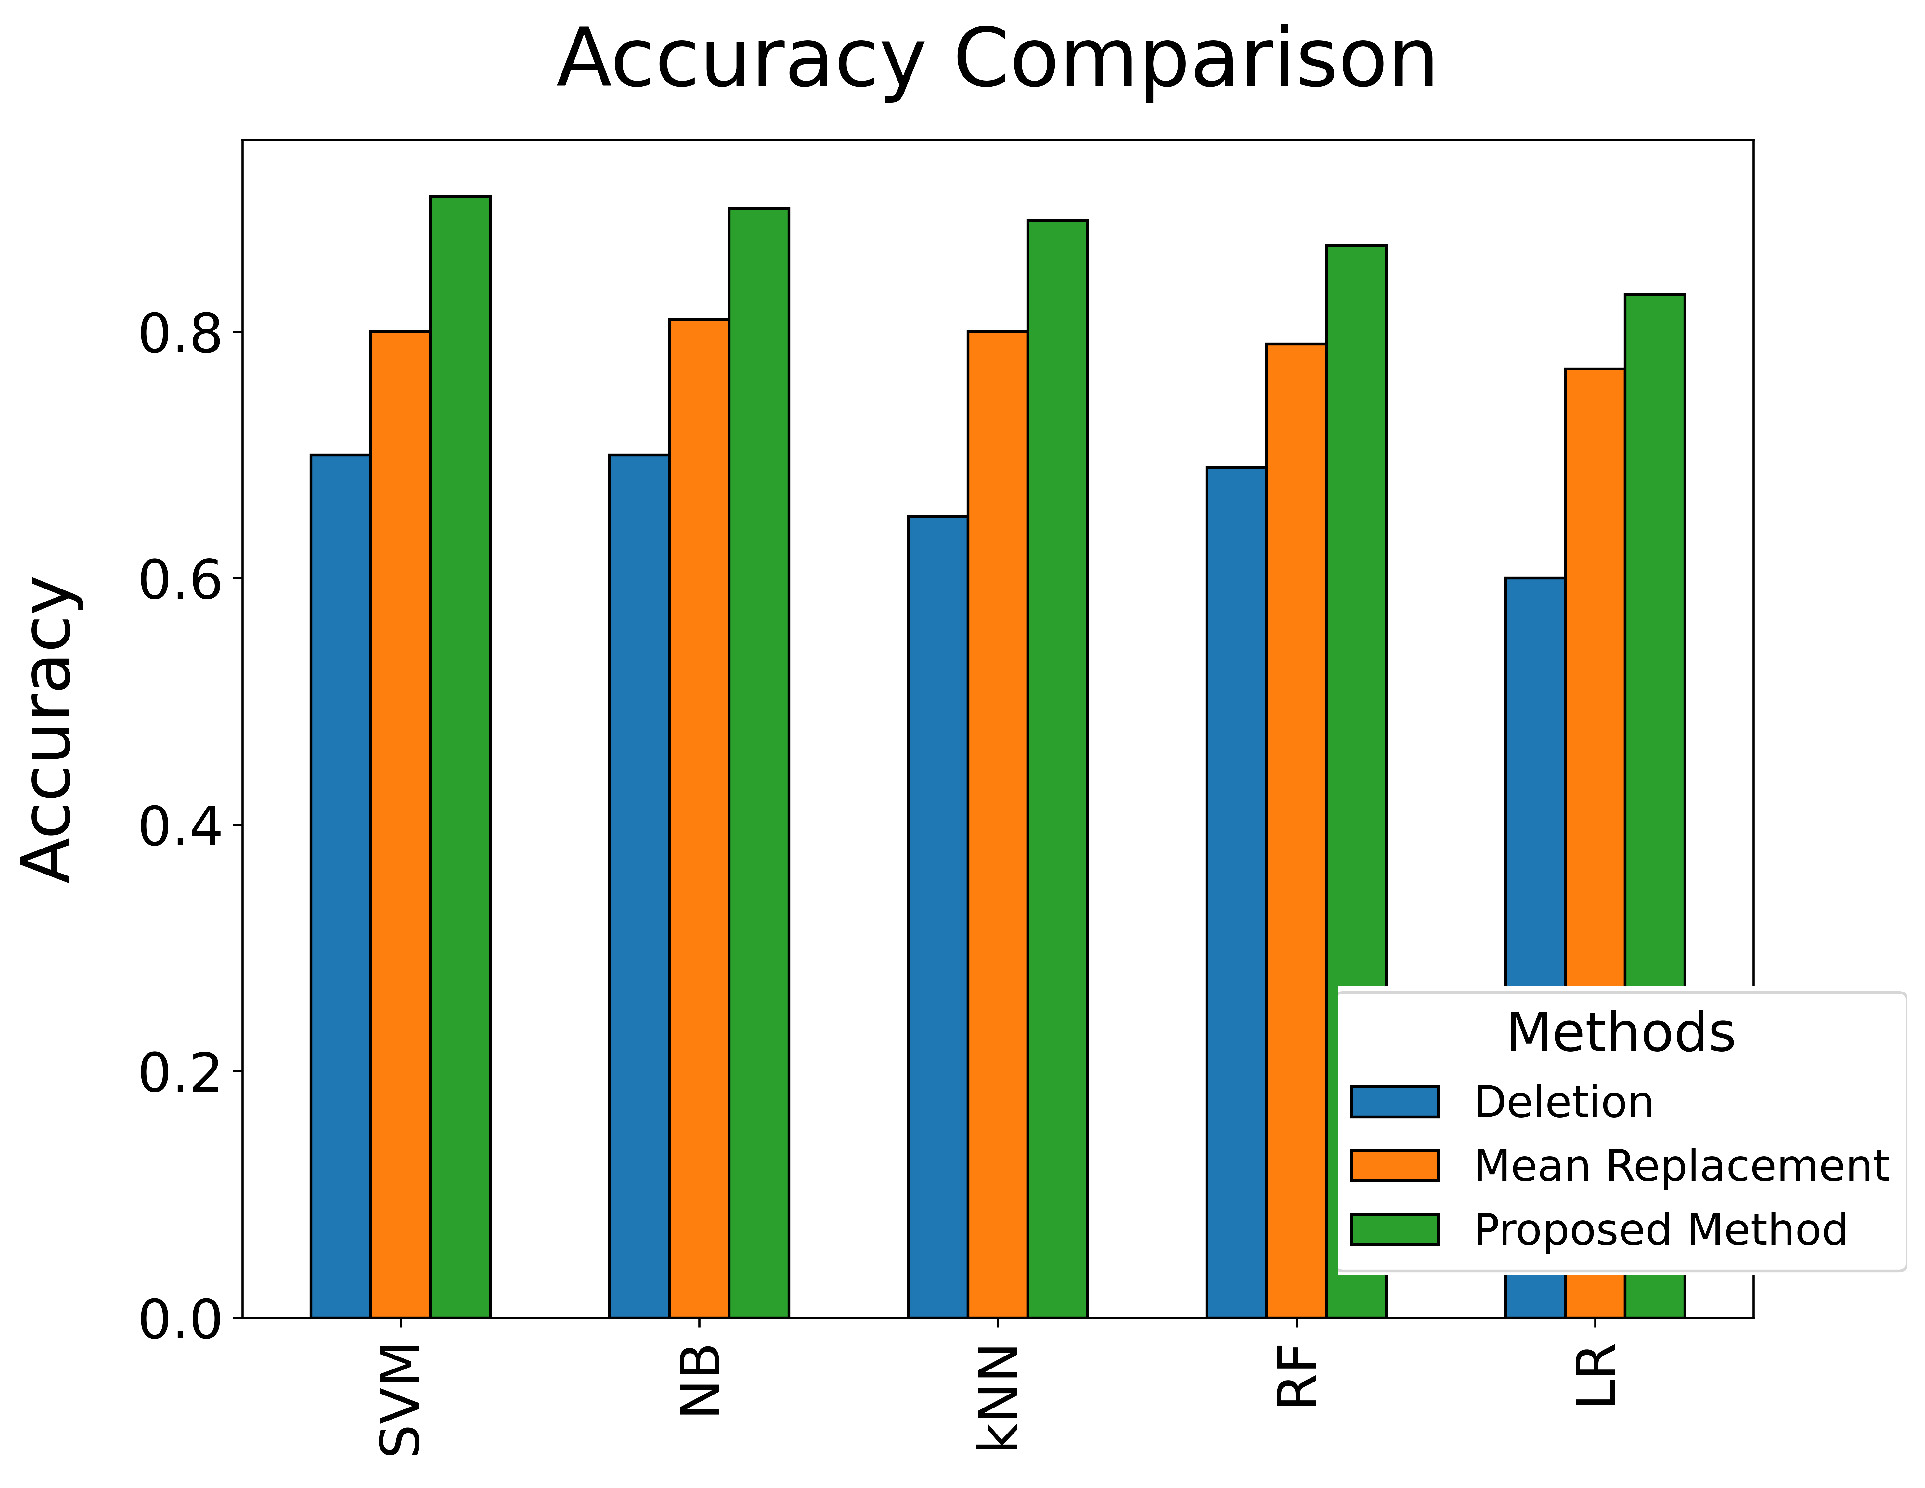
Replacing the missing values with the mean is one of the popular methods followed by the researchers. However, when replaced with mean, it creates a high bias and can significantly reduce the learning quality. When the number of missing values is more then it creates a huge negative performance in classification. For example, the feature insulin which is a very important feature in determining diabetes has a greater number of missing values than other features. This causes the degradation of classification performance. Table 6 presents the precision, recall, and F1 score of the ml models, and Figure 4 shows the accuracy comparison of all the ml models.
Table 6.
Performance of ML models (mean replacement).
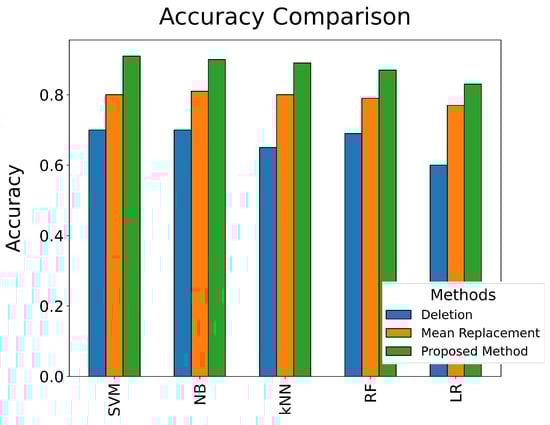
Figure 4.
Accuracy comparison of ML models in all three methods.
The proposed method can regenerate the missing values which have increased the performance of the classification. The introduction of the second layer of classification reduces the number of false classification and thus increase the accuracy. The highest accuracy was obtained by the SVM classifier with 94.89%. Naïve Bayes gives 92.78% accuracy whereas the LR gives the least accuracy of 85.85%. Table 7 shows the precision, recall, and F1 score of the machine learning models when the proposed methodology is used.
Table 7.
Performance of ML models (proposed).
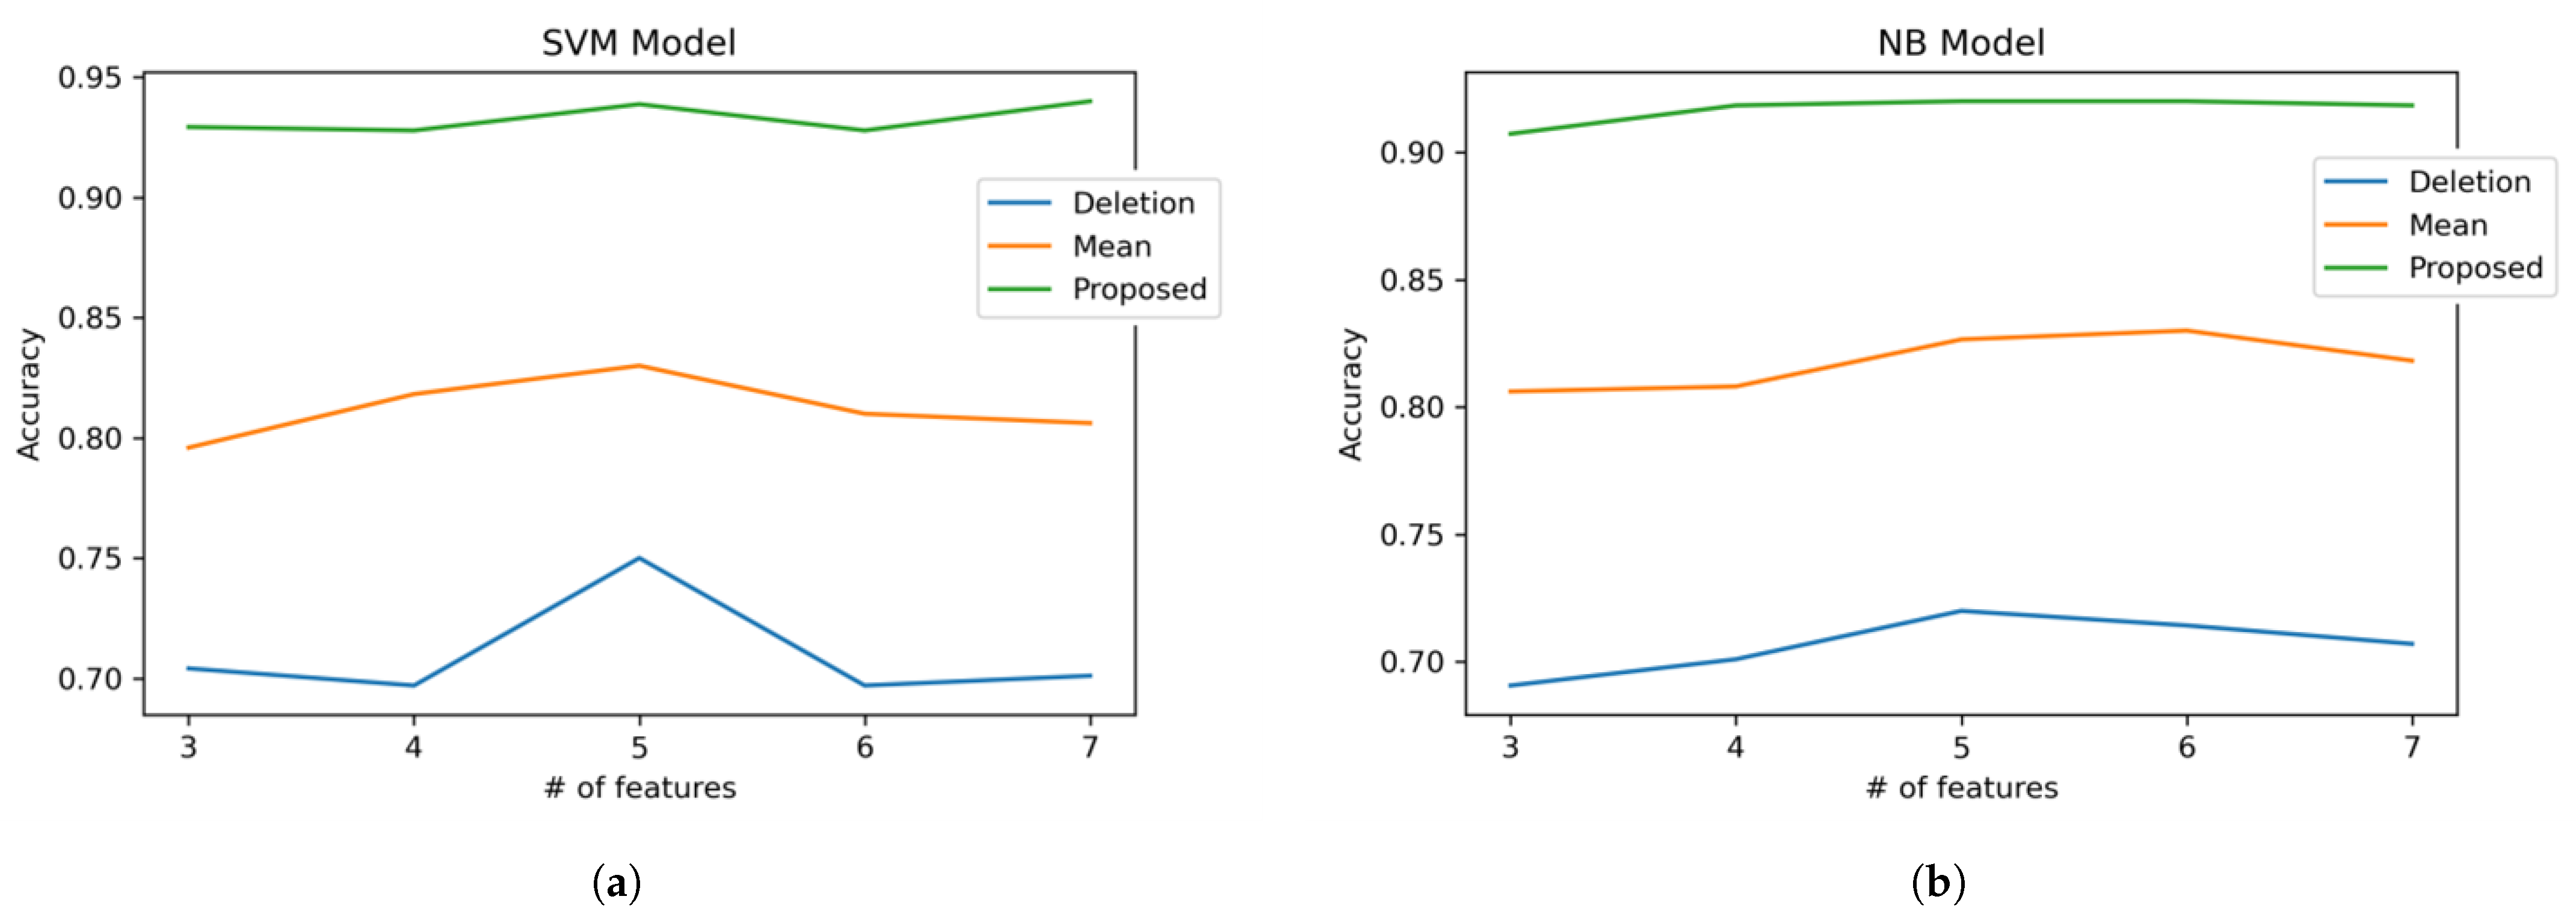
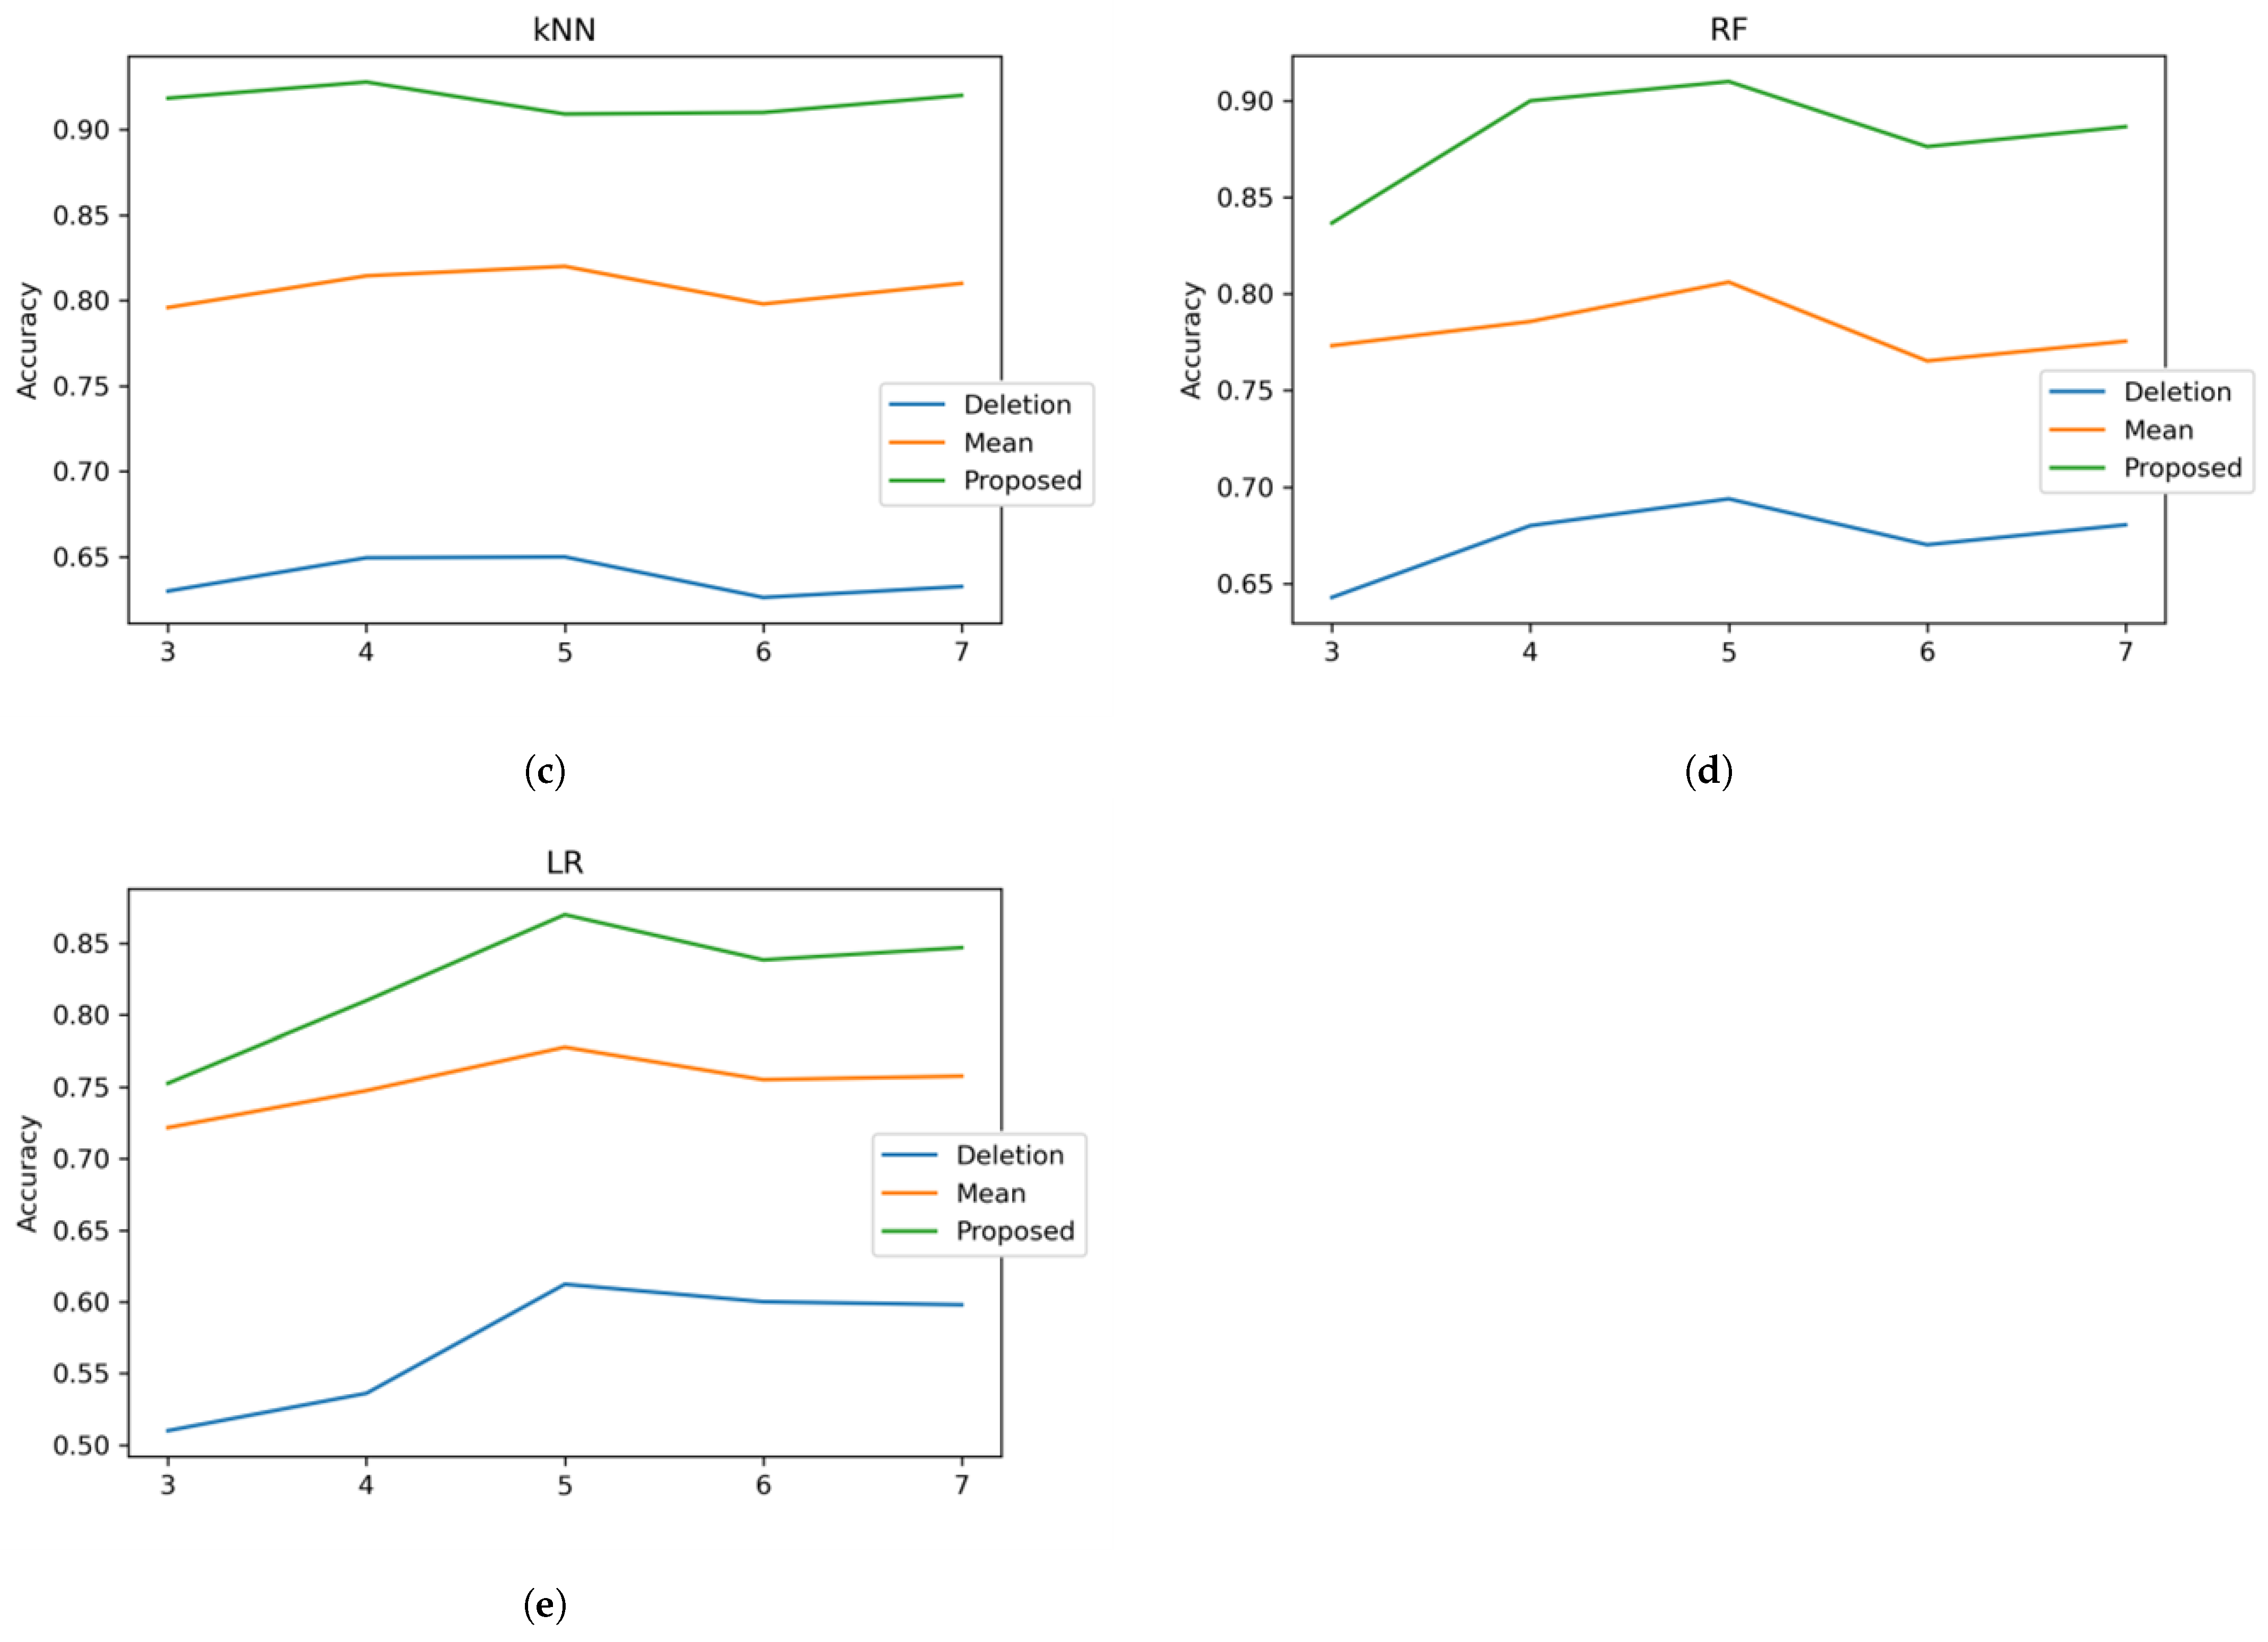
We have compared the performance of all the machine learning models when a different number of features are selected. The features are ranked according to the correlation between them with the target class. We have considered the top 3 features and gradually increased up to 7. We observed that all models produce maximum accuracy when the top 5 features are selected. Figure 5 shows the performance of SVM, NB, kNN, RF and LR classifiers, respectively.
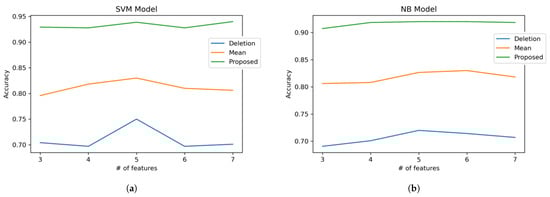
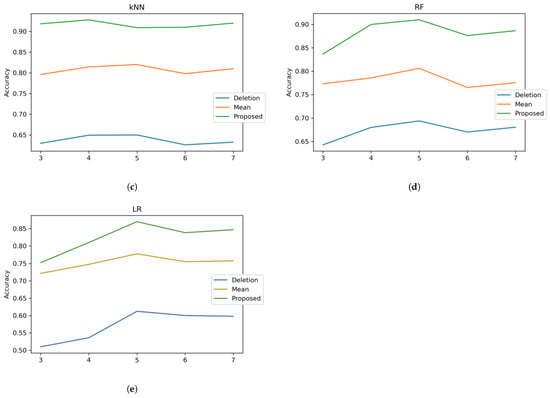
Figure 5.
Accuracy comparison of LR when a different number of features are considered: (a) SVM, (b) NB, (c) kNN, (d) RF and (e) LR.
From the accuracy comparison, we observe that classifiers build upon the diabetes dataset exhibit close performance when the proposed methodology is used. The accuracy of those classifiers varies between 85% and 92%. Classifiers using the top 5 features are very close to each other in terms of accuracy. This is because of the high dependency between the top 5 features and the target class. It can also be observed that the classifiers using all the set of features or top 7 features have less accuracy when compared with using less number of features. This indicates that the PIMA Indian dataset needs additional features for classification. SVM exhibits the best accuracy in all cases while LR exhibits the least accuracy. The kNN model is less sensitive when different features are used when compared with other classifiers. These results confirm that using fewer features increases the accuracy of the classification. Thus, we must identify a proper set of rich features and remove noisy features.
4.4. Limitations
The limitations of this study are as follows:
- Dataset Dependence: The results of this study are highly dependent on the PIMA Indian Diabetes dataset used. The results may not be generalized to other datasets with different characteristics.
- Feature Selection: The feature selection process can impact the performance of the proposed method. The results of this study are based on a limited number of features, and different results may be obtained by using a different set of features.
- Model Dependence: The results are specific to the five classifiers used in this study (Naive Bayes, SVM, kNN, Random Forest, and Linear Regression). Other machine learning models may produce different results, and the proposed method may not perform well with other models.
- Overfitting: The proposed method is based on training a separate SVM model for each missing feature set. Overfitting may occur if the models are too complex or if the dataset is small.
- Computational Complexity: The proposed method may be computationally complex, especially when dealing with large datasets with many missing values. This may limit the scalability of the proposed method.
- Two-level Classification may lead to an increased computational cost, as it involves two separate classifiers. In addition, the threshold for activating the second-level classification may need to be carefully chosen to ensure optimal performance.
5. Conclusions
In this paper, we presented a method for handling missing values in a machine-learning model for diabetes classification. The main focus of this study was to overcome the limitations of conventional methods for missing data imputation and to improve the accuracy of the final result. The proposed method makes use of a Support Vector Machine (SVM) regressor to impute missing values, and a two-level classification process to reduce the number of false classifications. The results of the study showed that the proposed method achieved improved accuracy when compared to conventional methods. The maximum accuracy of 94.89% was obtained using the SVM classifier, which demonstrated the effectiveness of the proposed method.
The proposed method has several advantages over conventional methods for handling missing values. Firstly, the use of the SVM regressor ensures that missing values are imputed in a more accurate manner. Secondly, the two-level classification process reduces the number of false classifications, which leads to a more accurate final result. This study demonstrates that the proposed method has the potential to improve the accuracy of machine learning models for other classification tasks as well.
In conclusion, the proposed method for handling missing values in a machine-learning model for diabetes classification has shown promising results. The use of the SVM regressor and two-level classification process is a novel approach to addressing the limitations of conventional methods for missing data imputation. This study provides valuable insights into the field of machine learning and has the potential to be applied to other classification tasks.
In the future, we aim to work on collecting family-related diabetes history and finetune the proposed method further.
Author Contributions
Conceptualization, A.P. and R.D.; methodology, A.P. and R.D.; software, A.P and R.D.; validation, A.P. and R.D.; formal analysis, A.P. and R.D.; investigation, A.P. and R.D.; resources, A.P. and R.D.; data curation, A.P. and R.D.; writing—original draft, A.P. and R.D.; writing—review and editing, A.P. and R.D.; visualization, A.P. and R.D. All authors have read and agreed to the published version of the manuscript.
Funding
This research received no external funding.
Data Availability Statement
Data will be made available on reasonable request.
Conflicts of Interest
The authors declare no conflict of interest.
References
- Tabish, S.A. Is diabetes becoming the biggest epidemic of the twenty-first century? Int. J. Health Sci. (Qassim) 2007, 1, V–VIII. [Google Scholar] [PubMed]
- Khadem, H.; Nemat, H.; Eissa, M.R.; Elliott, J.; Benaissa, M. COVID-19 mortality risk assessments for individuals with and without diabetes mellitus: Machine learning models integrated with Interpretation Framework. Comput. Biol. Med. 2022, 144, 105361. [Google Scholar] [CrossRef]
- Toren, E.; Burnette, K.S.; Banerjee, R.R.; Hunter, C.S.; Tse, H.M. Partners in Crime: Beta-Cells and Autoimmune Responses Complicit in Type 1 Diabetes Pathogenesis. Front. Immunol. 2021, 12, 756548. [Google Scholar] [CrossRef] [PubMed]
- Berbudi, A.; Rahmadika, N.; Tjahjadi, A.I.; Ruslami, R. Type 2 Diabetes and its Impact on the Immune System. Curr. Diabetes Rev. 2020, 16, 442–449. [Google Scholar] [CrossRef]
- Maqsood, S.; Damaševičius, R.; Maskeliūnas, R. Hemorrhage detection based on 3d cnn deep learning framework and feature fusion for evaluating retinal abnormality in diabetic patients. Sensors 2021, 21, 3865. [Google Scholar] [CrossRef] [PubMed]
- Ramasamy, L.K.; Padinjappurathu, S.G.; Kadry, S.; Damaševičius, R. Detection of Diabetic Retinopathy Using a Fusion of Textural and Ridgelet Features of Retinal Images and Sequential Minimal Optimization Classifier. PeerJ Comput. Sci. 2021, 7, 1–21. [Google Scholar] [CrossRef]
- Priya, A.M.; Thilagamani. Prediction of Arterial Stiffness Risk in Diabetes Patients through Deep Learning Techniques. Inf. Technol. Control 2022, 51, 678–691. [Google Scholar] [CrossRef]
- Kumar, M.; Chen, L.; Tan, K.; Ang, L.T.; Ho, C.; Wong, G.; Soh, S.E.; Tan, K.H.; Chan, J.K.; Godfrey, K.M.; et al. Population-centric risk prediction modeling for gestational diabetes mellitus: A machine learning approach. Diabetes Res. Clin. Pract. 2022, 185, 109237. [Google Scholar] [CrossRef]
- Alade, O.M.; Sowunmi, O.Y.; Misra, S.; Maskeliūnas, R.; Damaševičius, R. A Neural Network Based Expert System for the Diagnosis of Diabetes Mellitus. In Advances in Intelligent Systems and Computing; Springer: Berlin/Heidelberg, Germany, 2018; Volume 724, pp. 14–22. [Google Scholar]
- Azeez, N.A.; Towolawi, T.; Van der Vyver, C.; Misra, S.; Adewumi, A.; Damaševičius, R.; Ahuja, R. A fuzzy expert system for diagnosing and analyzing human diseases. In Advances in Intelligent Systems and Computing; Springer: Berlin/Heidelberg, Germany, 2019; Volume 939, pp. 474–484. [Google Scholar]
- Hallberg, S.J.; Gershuni, V.M.; Hazbun, T.L.; Athinarayanan, S.J. Reversing Type 2 Diabetes: A Narrative Review of the Evidence. Nutrients 2019, 11, 766. [Google Scholar] [CrossRef]
- Sun, Y.; Zhang, D. Machine learning techniques for screening and diagnosis of diabetes: A survey. Teh. Vjesn. 2019, 26, 872–880. [Google Scholar]
- Khan, F.A.; Zeb, K.; Al-Rakhami, M.; Derhab, A.; Bukhari, S.A.C. Detection and Prediction of Diabetes Using Data Mining: A Comprehensive Review. IEEE Access 2021, 9, 43711–43735. [Google Scholar] [CrossRef]
- Jaiswal, S.; Jaiswal, T. Machine Learning-Based Classification Models for Diagnosis of Diabetes. Recent Adv. Comput. Sci. Commun. 2022, 15, 813–821. [Google Scholar] [CrossRef]
- Chaki, J.; Thillai Ganesh, S.; Cidham, S.K.; Ananda Theertan, S. Machine learning and artificial intelligence based Diabetes Mellitus detection and self-management: A systematic review. J. King Saud Univ.-Comput. Inf. Sci. 2022, 34, 3204–3225. [Google Scholar]
- Palanivinayagam, A.; Gopal, S.S.; Bhattacharya, S.; Anumbe, N.; Ibeke, E.; Biamba, C. An optimized machine learning and Big Data Approach to crime detection. Wirel. Commun. Mob. Comput. 2021, 2021, 1–10. [Google Scholar] [CrossRef]
- Karim, F.K.; Elmannai, H.; Seleem, A.; Hamad, S.; Mostafa, S.M. Handling Missing Values Based on Similarity Classifiers and Fuzzy Entropy Measures. Electronics 2022, 11, 3929. [Google Scholar] [CrossRef]
- Phiwhorm, K.; Saikaew, C.; Leung, C.K.; Polpinit, P.; Saikaew, K.R. Adaptive multiple imputations of missing values using the class center. J. Big Data 2022, 9, 52. [Google Scholar] [CrossRef]
- Wang, Q.; Cao, W.; Guo, J.; Ren, J.; Cheng, Y.; Davis, D.N. DMP MI: An effective diabetes mellitus classification algorithm on imbalanced data with missing values. IEEE Access 2019, 7, 102232–102238. [Google Scholar] [CrossRef]
- Sidekerskiene, T.; Damasevicius, R. Reconstruction of missing data in synthetic time series using EMD. In Proceedings of the CEUR Workshop Proceedings; CEUR-WS Team: Aachen, Germany, 2016; Volume 1712, pp. 7–12. [Google Scholar]
- Moinul, M.; Amin, S.A.; Kumar, P.; Patil, U.K.; Gajbhiye, A.; Jha, T.; Gayen, S. Exploring sodium glucose cotransporter (SGLT2) inhibitors with Machine Learning Approach: A novel hope in anti-diabetes drug discovery. J. Mol. Graph. Model. 2022, 111, 108106. [Google Scholar] [CrossRef]
- Kang, H. The prevention and handling of the missing data. Korean J. Anesthesiol. 2013, 64, 402. [Google Scholar] [CrossRef]
- Dong, Y.; Peng, C.Y.J. Principled missing data methods for researchers. SpringerPlus 2013, 2, 222. [Google Scholar] [CrossRef]
- Delpino, F.; Costa, A.; Farias, S.; Chiavegatto Filho, A.; Arcencio, R.; Nunes, B. Machine learning for predicting chronic diseases: A systematic review. Public Health 2022, 205, 14–25. [Google Scholar] [CrossRef] [PubMed]
- Hasan, M.K.; Alam, M.A.; Roy, S.; Dutta, A.; Jawad, M.T.; Das, S. Missing value imputation affects the performance of machine learning: A review and analysis of the literature (2010–2021). Inform. Med. Unlocked 2021, 27, 100799. [Google Scholar] [CrossRef]
- Fatima, M.; Pasha, M. Survey of machine learning algorithms for disease diagnostic. J. Intell. Learn. Syst. Appl. 2017, 9, 1–16. [Google Scholar] [CrossRef]
- Kopitar, L.; Kocbek, P.; Cilar, L.; Sheikh, A.; Stiglic, G. Early detection of type 2 diabetes mellitus using machine learning-based prediction models. Sci. Rep. 2020, 10, 11981. [Google Scholar] [CrossRef] [PubMed]
- Dutta, A.; Hasan, M.K.; Ahmad, M.; Awal, M.A.; Islam, M.A.; Masud, M.; Meshref, H. Early Prediction of Diabetes Using an Ensemble of Machine Learning Models. Int. J. Environ. Res. Public Health 2022, 19, 12378. [Google Scholar] [CrossRef]
- Khan, A.; Khan, A.; Khan, M.M.; Farid, K.; Alam, M.M.; Su’ud, M.B.M. Cardiovascular and Diabetes Diseases Classification Using Ensemble Stacking Classifiers with SVM as a Meta Classifier. Diagnostics 2022, 12, 2595. [Google Scholar] [CrossRef]
- Geetha, G.; Prasad, K.M. Stacking Ensemble Learning-Based Convolutional Gated Recurrent Neural Network for Diabetes Miletus. Intell. Autom. Soft Comput. 2023, 36, 703–718. [Google Scholar] [CrossRef]
- Canivell, S.; Gomis, R. Diagnosis and classification of autoimmune diabetes mellitus. Autoimmun. Rev. 2014, 13, 403–407. [Google Scholar] [CrossRef]
- Mercaldo, F.; Nardone, V.; Santone, A. Diabetes mellitus affected patients classification and diagnosis through Machine Learning Techniques. Procedia Comput. Sci. 2017, 112, 2519–2528. [Google Scholar] [CrossRef]
- Wen, D.; Li, P.; Zhou, Y.; Sun, Y.; Xu, J.; Liu, Y.; Li, X.; Li, J.; Bian, Z.; Wang, L.; et al. Feature classification method of resting-state EEG signals from amnestic mild cognitive impairment with type 2 diabetes mellitus based on multi-view convolutional neural network. IEEE Trans. Neural Syst. Rehabil. Eng. 2020, 28, 1702–1709. [Google Scholar] [CrossRef]
- Shrestha, B.; Alsadoon, A.; Prasad, P.W.C.; Al-Naymat, G.; Al-Dala’in, T.; Rashid, T.A.; Alsadoon, O.H. Enhancing the prediction of type 2 diabetes mellitus using sparse balanced SVM. Multimed. Tools Appl. 2022, 81, 38945–38969. [Google Scholar] [CrossRef]
- Arora, N.; Singh, A.; Al-Dabagh, M.Z.N.; Maitra, S.K. A Novel Architecture for Diabetes Patients’ Prediction Using K -Means Clustering and SVM. Math. Probl. Eng. 2022, 2022, 4815521. [Google Scholar] [CrossRef]
- Damaševičius, R. Optimization of SVM parameters for recognition of regulatory DNA sequences. TOP 2010, 18, 339–353. [Google Scholar] [CrossRef]
- Ogundokun, R.O.; Misra, S.; Douglas, M.; Damaševičius, R.; Maskeliūnas, R. Medical Internet-of-Things Based Breast Cancer Diagnosis Using Hyperparameter-Optimized Neural Networks. Future Internet 2022, 14, 153. [Google Scholar] [CrossRef]
- Połap, D.; Woźniak, M.; Hołubowski, W.; Damaševičius, R. A heuristic approach to the hyperparameters in training spiking neural networks using spike-timing-dependent plasticity. Neural Comput. Appl. 2022, 34, 13187–13200. [Google Scholar] [CrossRef]
- Su, X.; Khoshgoftaar, T.M.; Greiner, R. Making an accurate classifier ensemble by voting on classifications from imputed learning sets. Int. J. Inf. Decis. Sci. 2009, 1, 301–322. [Google Scholar] [CrossRef]
- Barakat, N.; Bradley, A.P.; Barakat, M.N. Intelligible support vector machines for diagnosis of diabetes mellitus. IEEE Trans. Inf. Technol. Biomed. 2010, 14, 1114–1120. [Google Scholar] [CrossRef]
- Lama, L.; Wilhelmsson, O.; Norlander, E.; Gustafsson, L.; Lager, A.; Tynelius, P.; Warvik, L.; Ostenson, C.G. Machine learning for prediction of diabetes risk in middle-aged Swedish people. Heliyon 2021, 7, e07419. [Google Scholar] [CrossRef]
- Jia, X.; Dong, X.; Chen, M.; Yu, X. Missing data imputation for traffic congestion data based on joint matrix factorization. Knowl.-Based Syst. 2021, 225, 107114. [Google Scholar] [CrossRef]
- Song, S.; Sun, Y.; Zhang, A.; Chen, L.; Wang, J. Enriching Data Imputation under Similarity Rule Constraints. IEEE Trans. Knowl. Data Eng. 2020, 32, 275–287. [Google Scholar] [CrossRef]
- Rekatsinas, T.; Chu, X.; Ilyas, I.F.; Ré, C. HoloClean: Holistic Data Repairs with Probabilistic Inference. Proc. VLDB Endow. 2017, 10, 1190–1201. [Google Scholar] [CrossRef]
- Wang, X.; Wang, C. Time Series Data Cleaning: A Survey. IEEE Access 2020, 8, 1866–1881. [Google Scholar] [CrossRef]
- Ataeyan, M.; Daneshpour, N. A novel data repairing approach based on constraints and ensemble learning. Expert Syst. Appl. 2020, 159, 113511. [Google Scholar] [CrossRef]
- Boeckling, T.; De Tre, G.; Bronselaer, A. Cleaning Data With Selection Rules. IEEE Access 2022, 10, 125212–125229. [Google Scholar] [CrossRef]
- Cui, Q.; Zheng, W.; Hou, W.; Sheng, M.; Ren, P.; Chang, W.; Li, X.Y. HoloCleanX: A Multi-source Heterogeneous Data Cleaning Solution Based on Lakehouse. In Lecture Notes in Computer Science (Including Subseries Lecture Notes in Artificial Intelligence and Lecture Notes in Bioinformatics); Springer: Cham, Switzerland, 2022; Volume 13705 LNCS, pp. 165–176. [Google Scholar]
- Kumari, S.; Kumar, D.; Mittal, M. An ensemble approach for classification and prediction of diabetes mellitus using soft voting classifier. Int. J. Cogn. Comput. Eng. 2021, 2, 40–46. [Google Scholar] [CrossRef]
- Syed, A.H.; Khan, T. Machine learning-based application for predicting risk of type 2 diabetes mellitus (T2DM) in Saudi Arabia: A retrospective cross-sectional study. IEEE Access 2020, 8, 199539–199561. [Google Scholar] [CrossRef]
- Hippert-Ferrer, A.; El Korso, M.; Breloy, A.; Ginolhac, G. Robust low-rank covariance matrix estimation with a general pattern of missing values. Signal Process. 2022, 195, 108460. [Google Scholar] [CrossRef]
- Lai, X.; Wu, X.; Zhang, L. Autoencoder-based multi-task learning for imputation and classification of Incomplete Data. Appl. Soft Comput. 2021, 98, 106838. [Google Scholar] [CrossRef]
- Ma, Z.f.; Tian, H.p.; Liu, Z.c.; Zhang, Z.w. A new incomplete pattern belief classification method with multiple estimations based on Knn. Appl. Soft Comput. 2020, 90, 106175. [Google Scholar] [CrossRef]
- Li, X.; Sui, Y. Multiple regression and K-nearest-neighbor based algorithm for estimating missing values within sensor. In Proceedings of the 2021 7th Annual International Conference on Network and Information Systems for Computers (ICNISC), Guiyang, China, 23–25 July 2021. [Google Scholar] [CrossRef]
- Khan, H.; Wang, X.; Liu, H. Missing value imputation through shorter interval selection driven by fuzzy c-means clustering. Comput. Electr. Eng. 2021, 93, 107230. [Google Scholar] [CrossRef]

Disclaimer/Publisher’s Note: The statements, opinions and data contained in all publications are solely those of the individual author(s) and contributor(s) and not of MDPI and/or the editor(s). MDPI and/or the editor(s) disclaim responsibility for any injury to people or property resulting from any ideas, methods, instructions or products referred to in the content. |
© 2023 by the authors. Licensee MDPI, Basel, Switzerland. This article is an open access article distributed under the terms and conditions of the Creative Commons Attribution (CC BY) license (https://creativecommons.org/licenses/by/4.0/).