Abstract
Mining opinion on social media microblogs presents opportunities to extract meaningful insight from the public from trending issues like the “yahoo-yahoo” which in Nigeria, is synonymous to cybercrime. In this study, content analysis of selected historical tweets from “yahoo-yahoo” hash-tag was conducted for sentiment and topic modelling. A corpus of 5500 tweets was obtained and pre-processed using a pre-trained tweet tokenizer while Valence Aware Dictionary for Sentiment Reasoning (VADER), Liu Hu method, Latent Dirichlet Allocation (LDA), Latent Semantic Indexing (LSI) and Multidimensional Scaling (MDS) graphs were used for sentiment analysis, topic modelling and topic visualization. Results showed the corpus had 173 unique tweet clusters, 5327 duplicates tweets and a frequency of 9555 for “yahoo”. Further validation using the mean sentiment scores of ten volunteers returned R and R2 of 0.8038 and 0.6402; 0.5994 and 0.3463; 0.5999 and 0.3586 for Human and VADER; Human and Liu Hu; Liu Hu and VADER sentiment scores, respectively. While VADER outperforms Liu Hu in sentiment analysis, LDA and LSI returned similar results in the topic modelling. The study confirms VADER’s performance on unstructured social media data containing non-English slangs, conjunctions, emoticons, etc. and proved that emojis are more representative of sentiments in tweets than the texts.
1. Introduction
The continuous rise in Internet technology and various social media (SM) platforms has made it possible for effective communication and interaction among various people from diverse social and cultural backgrounds [1,2]. This growth in technology advancement has also introduced some downsides such as proliferation of cyber-crime [3]. SM has become a significant aspect of online activity [4] and plays a crucial part in cybercrime such as in [5] and cyber terrorism-related operations [6]. Cybercrime, which is one of the popular forms of deviance among youth in Nigeria, is still a serious problem affecting the country’s image [7,8]. The perpetrators are supported by some people and social institutions when they make illegitimate money; hence, the increasing justification of illegality [9,10]. The phrase Yahoo-Yahoo originated from the use of Yahoo emails and Yahoo instant messenger as a dominant medium of communication between perpetrators and victims [11]. This popular term refers to the activities that entail using computers, phones, and the Internet to defraud unsuspecting victims, especially those outside the country. The likelihood of fraudulent users integrating new approaches without necessarily applying extensive technical knowledge on the Internet could result in fraudulent activity [12].
The rising popularity of cyber-crime in Nigeria [13] can be connected to the current state of economic instability, the high unemployment rate among able-bodied youths, erosion of traditional values of integrity quick-money syndrome, etc. To curb these illegal activities, institutions such as the Economic and Financial Crimes Commission (EFCC) were established in Nigeria and have recorded several arrests and prosecution of cyber-crime suspects [14]. However, it is expected that with the apprehensions and prosecutions, more understanding of the “modus operandi” of culprits will emerge. However, crime may not be static as suspects could adopt new methods when the old ones are known to the public and law enforcement agencies. Cybercrime has gone beyond the notorious 419 email and SMS scams [15] to apply more sophisticated methods making SM users even more vulnerable [16]. Recently, SM platforms such as Facebook, Instagram, Twitter, Google+, and Pinterest are becoming popular for crucial data sources in research studies relating to sentiment analysis [17,18]. SM can accommodate information on different subjects, thus increasing and improving communication between them, and participants can form groups with a common interest and express themselves freely [19].
The importance of SM opinion cannot be over-emphasized as this medium serves as the most accessible way to get large, valuable, and rich details of information (especially on the subject matter) within a short period. The Twitter platform is a social microblog site and has generated about 330 million tweets every month across different countries [20]. Twitter has recently been used to mine opinions and trending topics to understand users’ behaviors and attitudes through predefined information such as user description, location, status, and other attributes. Also, Twitter allows the exchange of media such as text, images, videos, etc. and the potential to facilitate research over social phenomena based on sentiment analysis, using Natural Language Processing and Machine Learning techniques to interpret sentimental tendencies related to users’ opinions and make predictions about real-world events [21].
Analyzing different trending topics on Twitter may create insight into polarized opinions in various issues such as politics, celebrities, national disasters, corporations, etc., for real-world event prediction. Previous studies by researchers have shown that this practice falls within the socioeconomic cyber-crime [22], and its continued popularity can be attributed to the influence of friends [7,8,23]. The relationships between factors influencing these activities and the learning process are depicted in Figure 1 as adapted from [24].
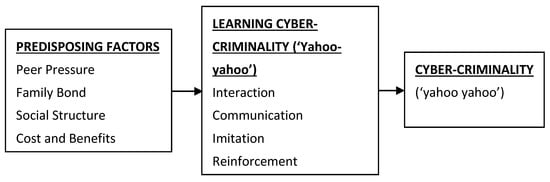
Figure 1.
Relationships between predisposing factors and cyber-crime in Nigeria.
However, this study is motivated by increasing information on SM, majorly Twitter, considering the great benefit to the Government and all related stakeholders. We have considered the effect on a developing country—Nigeria (as a case study), a fast-growing economy, the largest populated country in Africa.
This paper aims to analyze the Yahoo-Yahoo hashtag tweets on SM using sentiment analysis and opinion mining algorithms with the following specific objectives:
- Collect tweets based on the Yahoo-yahoo hashtags using the Orange Twitter API.
- Pre-process and tokenize the tweets using a pre-trained tweet tokenizer.
- Conduct unsupervised lexicon-based sentiment analysis on the tweet corpus using the Liu Hu and VADER techniques, respectively.
- Carry out Topic modeling to detect abstract topics on corpus using Latent Dirichlet Allocation (LDA) and Latent Semantic Indexing (LSI) algorithms, respectively.
- Validate the topic modeling using Multidimensional Scaling (MDS) graph and Marginal Topic Probability (MTP).
2. Literature Review
This section discusses previous research endeavors on sentiment analysis and opinion mining using Twitter data in detail. The specific focus is on cyber-crime and Twitter data, and state-of-the-art methods proposed in the literature will be carefully studied for contributions and future recommendations.
In [25], the Authors proposed a temporal topic detection model to infer predictive topics over time. Authors developed a dynamic vocabulary to detect topic trends rather than word dictionaries using Twitter data to predict the Chicago crime trend. The study concluded that the use of content-based features improves overall prediction performance. In [21], the Authors presented a statistical analysis based on ℓ1 regularization regression algorithm for detecting cyber-attacks using social sentiment sensors on Twitter. Kounadi et al. in [26] examined Twitter messages for detecting homicide crime in London based on spatial and temporal analysis. The Authors adopted two pre-processing methods from link correspondence and the home estimation model. Hariani and Riadi in [3] analyzed Twitter data for cyberbullying using a naïve Bayes classifier and TF-IDF weighting. Authors claimed their classification results were able to detect cyberbullying on SM, and the effect of this bullying is more psychological, with a prediction of 77.73%. Sharma et al. in [27] proposed a sentiment analysis of Twitter data using the Valence Aware Dictionary for Sentiment Reasoning (VADER) method for detecting cybersecurity and cyber-crime. The Author concluded that Asian nations are majorly affected by cybersecurity challenges when compared to other European Union countries. Al-Garadi et al. in [28] proposed a supervised machine learning approach using four classifiers, namely support vector machine (SVM), Naïve Bayes (NB), K-Nearest Neighbor (KNN), and the Random Forest (RF) classifier for detecting cyber-crime on the Twitter network. The methods show that integrating Synthetic Minority Over-Sampling Technique (SMOTE) with RF gave the best performance of 94.3% compared with the other machine learning classifier.
The application of Deep Learning (DL) methods has also been proposed in previous studies. Al-Smadi et al. [29] carried out a sentiment analysis of Arabic hotel reviews using Deep Recurrent Neutral Network (DRNN) and SVM. The DRNN had a faster execution time during the training and testing of the models. Founta et al. in [30] presented an architecture based on DL for detecting online multiple abusive behaviors among Twitter users. The proposed approach gave a significant performance in detection rate and increasing AUC from 92–98%. Like the previous study, [31] also applied a DL method based on a Convolutional Neural Network (CNN) to detect cyber-bullying using Instagram images and text data. The detected bullying words are further analyzed using the N.B. classifier to detect potential cyberbullying threats effectively.
After a review of previous studies, to the best of our knowledge, this study is the first to analyze the Twitter dataset for understanding and identifying sentiments towards yahoo-yahoo cyber-crime. The summary of the related work on cybercrime analysis using Twitter data is shown in Table 1.

Table 1.
Summary of related work on cybercrime analysis using Twitter Data.
3. Research Method
The research methodology employed in this study is presented in this section. The data analyzed is based on the content of the tweets and other metadata. Duplicated tweets were detected and filtered to analyze unique tweets from the dataset. This study adopted Liu Hu [39] and VADER [40] methods for sentiment analysis. The research approach was divided into three modules, as shown in Figure 2, including Data Collection, Pre-processing, and Data Analysis.
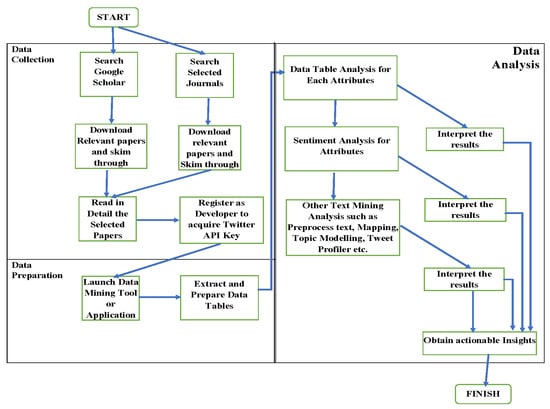
Figure 2.
Proposed Content Analysis Framework.
3.1. Data Collection
Twitter data was chosen based on its popularity with microblog services for sentiment and opinion analysis in detecting cyber-bullying, cyber-terrorism, etc. [17]. Twitter API was employed in streaming live tweets for the past 14 days on the Orange Data mining toolbox [41]. To use the Twitter API, it is required to obtain the Twitter API credentials, which contain the key and secret passwords. With the API, query parameters relating to specific keywords such as ‘wordlist query’, ‘search by’, ‘language’, ‘allow retweets’, etc., can be set, and the data obtained can be saved as Comma-Separated Value (CSV) format. For this study, the search query’s keyword was “yahoo-yahoo”, and a maximum tweet of 5500 tweets was returned. The complete dataset is available in the Zenodo repository at [42]. Figure 3 shows the Twitter dataset obtained using the #yahooyahoo on a data table containing the tweets content as well as 17 other metadata, which includes ‘Author ID’, ‘Date’, ‘Language’, ‘Location’, ‘Number of Likes’, ‘Number of Retweets’, ‘In Reply To’, ‘Author Name’, ‘Author Description’, ‘Longitude and Latitude’, etc.
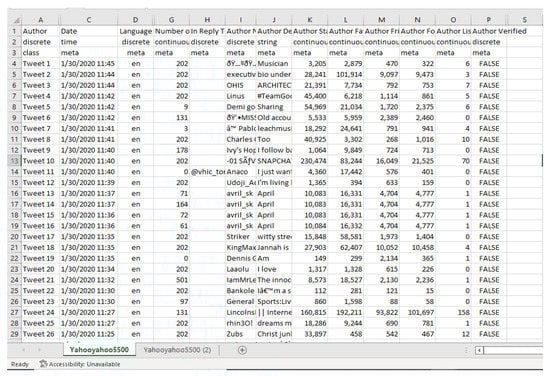
Figure 3.
Screenshot showing the Data Table with the Tweet contents and other metadata.
3.2. Data Pre-Processing
The Twitter dataset was pre-processed by breaking the tweets into smaller pieces like words, phrases, or bi-grams called tokens. Normalization was done on the tweets to generate n-grams, tags with spoken tags, and partial language markings. Other pre-processing tasks carried out on the tweets include:
- Converting all characters in the corpus to lowercase;
- Remove all HTML tags from a string;
- Removing all text-based diacritics and accents;
- Removing URLs, articles, and punctuations;
- Filtering stop words, lexicon, Regular expressions.
3.3. Sentiment Analysis
Sentiment analysis aims to extract users’ emotions from texts at sentence, document, or aspect/feature level. It determines the feeling being projected from each tweet as either positive, negative, or neutral. The NLTK emotion modules in Orange are based on sentiment lexicons approaches and contain Liu Hu [39] and VADER [40] techniques. The lexicon-based process is an unsupervised machine learning method that employs a dictionary or lexicon list. Each lexicon is associated with a sentiment strength which represents a positive or negative orientation [43].
The Liu Hu method [39] involves an examination of the lexicon. It classifies the tweets into negative, positive, and neutral sentiment while the VADER examines the lexicon and uses the thumb rule. It simply sums up the sentiment scores of all sentiment words in a tweet or sentence segment.
VADER was proposed in [40]. Unlike Liu Hu in [39], VADER [40] has its sentiment orientation divided into four categories which are: positive, negative, neutral, and final compound scores for analyzing sentiment. The compound score is calculated in Equation (1) by finding the sum of each word’s valence scores in the lexicon, which are adjusted according to the rules.
where x = sum of valence scores of constituent words, and = Normalization constant (default value is 15).
The costs are then normalized in a continuous polarity annotation between −1 and +1, representing the most extreme negative and most extreme positive sentiments. The VADER compound score is a single unidimensional measure of a tweet’s sentiment.
The tweet corpus was collected, duplicate tweets were removed using Manhattan distance for distance measures between tweets with a single linkage and distance threshold of 0.5. The VADER and Liu Hu sentiment analysis methods were applied, and the results were obtained using the heat maps and sentiment scores. Algorithm 1 represents the duplicate detection and sentiment analysis workflow.
| Algorithm 1: Duplicate Detection and Sentiment Analysis Workflow. |
| Input: {Corpus C; Tweet T (T1, T2, …Tn), Tweet contents: X = {x1, x2, …xn}, distance between rows, d distance threshold, dT = 0.5; distance metrics, m} Output: {Liu Hu: Sentiment Score; VADER: Sentiment Scores (Neg, Neutral, Positive, Score); Heat maps} Start: Procedure Step 1: For ∀ T ϵ C T ← {T1, T2, … Tm} T1 = {, , … }, T2 = {, , … }, ⠇ ⠇ ⠇ ⠇ Tn = {, , … } Step 2: Detect Duplicate Tweets T using Manhattan Distance (d) For i = 1: n \\ distance between rows Calculate: d = ( == ) && ( == ) && … ( == ) Linkage L= single d > =dT remove duplicate Step 3: Apply Sentiment Analysis Method (Liu Hu; VADER) Generate output end |
3.4. Ground Truth Generation for Sentiment Analysis
To evaluate and validate VADER and Liu Hu models for sentiment analysis, we took a cue from [40] by employing a human-centered approach using ten human experts to individually review all 173 unique tweets and give their sentiment score on a scale of −3 to +3 representing extreme Negative to extreme Positive sentiments for each of the tweets, while a score of zero to a tweet was considered a neutral sentiment. The mean opinion score (MOS) of the human subjective scores is thus obtained from the averaged result of a set of individual human subjective sentiment scores. The Mean opinion score (MOS) is defined as:
where tweet sentiment score, = tweet sentiment score probability, and S = number of independent observers. Ten observers were assigned to grade the 173 tweets, thus S = 10 and = 173. The grading scales were maintained as −3, 2, 1, 0, 1, 2, and 3 representing −3 to +3 representing extreme negative sentiments to extreme positive sentiments.
3.5. Topic Modelling
Topic modeling is used to detect abstract topics in the corpus or data table based on word clusters and their respective frequency in each document or tweet, as in this case study. It has been applied in Natural Language Processing (NLP) to discover topics and extract semantic meaning from unordered documents, especially in applications such as SM, text mining, and information retrieval. This study aims to use the topic to facilitate understanding of the emotion and conversations between the respondent in the corpus under study.
The orange topic modeling widget wraps Gensim’s topic models [44] that contain Latent Dirichlet Allocation (LDA), Latent Semantic Indexing (LSI), and Hierarchical Dirichlet Processing (HDP) algorithms, respectively.
LDA is a three-level hierarchical Bayesian model in which each item of a collection is modeled as a finite mixture over an underlying set of topics. It is interpreted easily but slower than LSI.
LSI model returns topics with negative and positive keywords that have negative and positive weights on the topic. The positive weights are words that are highly representative of the topic and contribute to its occurrence. For negative weights, the topic is more likely to occur if they appear less in it. The modeled topics were visualized using Multidimensional Scaling (MDS) graphs, which is a low-dimensional projection of the topics as points. MDS attempt to fit distances between the points as much as possible. Algorithm 2 represents the workflow for topic modeling as conducted in this study.
| Algorithm 2: Workflow for the Topic Modelling. |
| Input: {Corpus C; Tweet T (T1, T2, …Tn), Tweet contents: X (x1, x2, …xn), Authors} Output: {MDS: Marginal Topic Probability (MTP) of LDA topics, Word Cloud for LSI and LDA topics, Boxplots: MTP for LDA topics 1 to 6} Start: Step 1: Pre-process Text 1.1 Transformation {Lower case, remove accents, parse html, Remove all html tags from strings, and remove URLs} 1.2 Tokenization: Regexp (\w+) 1.3 Filtering: {Remove stopwords, Regexp (\. |,|:|;|!|\?|\ (|\ )|\||\+|’|”|‘|’|“|”|’|\’|…|\-|–|— |\$|&|\*|>|<|\/|\ [|\ ]), Document Frequency DF = (0.10–0.90)} Step 2: Topic Modelling Methods Apply Latent Semantic Indexing (LSI) Apply Latent Dirichlet Allocation (LDA); Step 3: Plot Multidimensional Scaling (MDS) graph Generate outputs end |
4. Results and Discussion
As outlined in section three, the result obtained from implementing the research methodology is presented and discussed in this session. The Twitter data mining API, widgets, and workflow engine for text mining in the Orange Data mining toolbox [41] were used primarily for the data collection and implementation of the study.
4.1. Results of Pre-Processing and Tokenization
A pre-trained tweet tokenizer was used for pre-processing of the corpus texts. By setting the document frequency range, tokens outside the range will be removed. 75,280 tokens of 3968 types were generated using a document frequency of 0.00–1.00, while 16,620 tokens of 5 types were returned for document frequency in the range 0.10–0.90. Figure 4 shows the tokens’ visualization and their frequency in the tweet dataset through a word cloud. The word cloud showed that the larger the word in the cloud, the higher its frequency. Only a record of tokens with frequencies higher than 100 was stored while 3960 tokens appeared more than a hundred times. Table 2 shows the 12 most frequent tokens with “yahoo” on top of the chart, having 9555 frequencies.
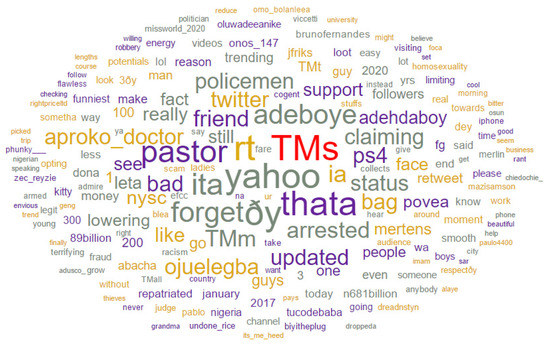
Figure 4.
Word Cloud showing the tokens and their frequency/weight from the pre-processed tweet dataset.
Table 2.
The topmost frequent tokens with their frequency/weight.
4.2. Results of Geolocation
From Figure 5, the color bar differentiates the number of tweets originating from each country in the range 0 to 20 on a scale of 0–4, 5–9, 10–14, and 15–20, respectively. The white locations had no tweets from the #yahooyahoo, while the colored ones had tweets of varying amounts.
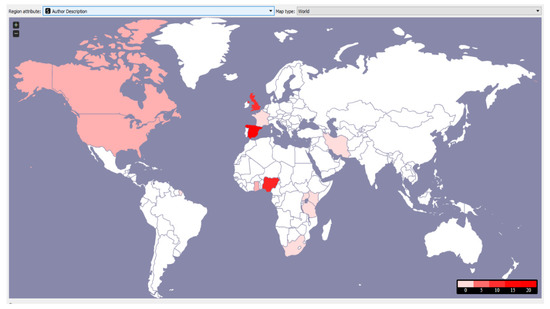
Figure 5.
Map Showing Location of Author representing the frequency with color weight.
From the geolocation analysis in Figure 5, Some of the countries in the range 0–4 (color code 1) on the world map are Ghana, French Guyana, South Africa, Tanzania, Uganda, Kenya, France, and Iran; Canada and the United States of America are in the range 5–9 (color code 2) while Northern Ireland, United Kingdom, and Nigeria are in the range 10–14 (color code 3) with 9, 10 and 11, respectively. Finally, Spain fell into the last category with the color 16. From the dataset and contrary to expectation, Spain has the highest number of tweets with the #yahooyahoo on Twitter, followed by Nigeria. However, our tweet dataset also confirmed that most Twitter users prefer to set their location as anonymous.
4.3. Results of Duplicate Detection
The dataset was filtered for unique tweets using duplicate detection to remove duplicate tweets from the 5500 tweets. With the linkage set to single and distance threshold = 0.5, the duplicate detection workflow returned 173 unique clusters and their sizes. Where a cluster represents a unique tweet, and the size is the frequency of retweets or duplication in the dataset. Thus, 173 unique tweets and 5327 duplicates were returned. Tweet C91 is the largest cluster with 484 retweets. Table 3 shows the top twenty tweets, cluster, number of retweets, and content. The 173 unique tweet clusters were adopted for further analysis in the study. To maintain the privacy and the ‘right to be forgotten’ of the tweet’s Authors, their Twitter handles were anonymized using serial uTweet1, …, uTweet 173 for Unique tweet 1 to 173, respectively.
Table 3.
Top twenty tweets showing the cluster, number of retweets, and content.
4.4. Result of Sentiment Analysis
From the result of the sentiment analysis, the Liu Hu method returned a single sentiment score 173 tweets in the range +12.5 and −12.5 classified as 43 (24.86%), 86 (49.71%) and 44 (25.43%) for Positive, Neutral and Negative tweets, respectively. Figure 6 presents the visualization of Liu Hu sentiment classification using the heat map.
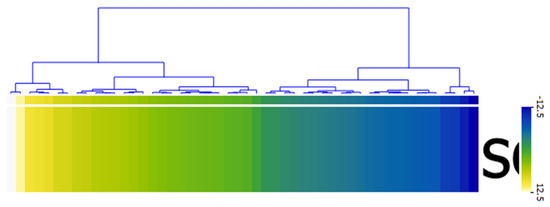
Figure 6.
Heat map showing sentiments classification using Liu Hu method.
The VADER method classified the 173 unique tweets by returning the negative, neutral, positive, and compound scores as shown in Figure 7 using the heat map. The right-hand side (RHS) consist of 142 tweets. 73 (42.20%) tweets were negative as depicted by the blue color on the heat map; their compound sentiment scores ranged between −0.0516 to −0.9393 with very low positive sentiment scores, close to zero (0). For the tweets classified as neutral, the positive, negative, and compound sentiment orientation scores, all returned zero (0), while the neutral scores were all one (1). This returned 43 (24.86%) neutral tweets. The third class in the heat map’s RHS are tweets whose compound sentiment scores are above zero (0) but below 0.5. They do not represent negative or neutral sentiments and are also below the 0.5 thresholds to be considered as positive sentiment tweets. These classes of tweets are referred to as no-zone sentiment tweets with 26 (15.03%) tweets. Their compound sentiment scores ranged between 0.0202 and 0.4767, and their color on the heat map is not distinct. The left-hand side (LHS) of the heat map in Figure 7 has 31 instances. These are classified by VADER as positive tweets, their compound scores range between 0.5106 to 0.9508. They are represented with the visible yellow color on the heat map. The result showed that a chunk of the tweets classified as Neutral by Liu Hu are in the RHS of the VADER heat map.
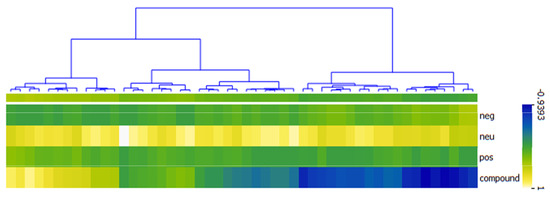
Figure 7.
Heat map showing sentiments classification using VADER method.
4.5. Results of Ground Truth Generation for Sentiment Analysis
Figure 8 shows the summary of the ground truth generation and validation of the sentiment analysis using subjective human scores along the VADER and Liu Hu methods. The mean opinion Score (MOS) of 10 volunteers on the 173 unique tweets was obtained. Figure 8a,c,e shows the line plots of VADER compound, Liu Hu, and Human sentiment scores, respectively. The Figures show the trends between the sentiment scores returned by each approach and ultimately how the classification for each tweets sentiments differs. The Figure 8b,d,f are scatter plots between Human and VADER, Human and Liu Hu, and Liu Hu and VADER sentiment scores, with 0.8038 and 0.6402; 0.5994 and 0.3463; 0.5999 and 0.3586 as correlation score (R) and Co-efficient of Determination (R2), respectively. The blue line across the plots shows the intercept. The relationship between Human and VADER sentiment scores was more significant as in Figure 8b. We can also roughly consider each of the subplots as having four quadrants, which are: true negatives (lower left), true positives (upper right), false negatives (upper left), and false positives (lower right) representing the accuracy of the tweet’s sentiment classification. The more the data point in the false negatives and false positives quadrants implies decrease in the sentiment classification accuracy.
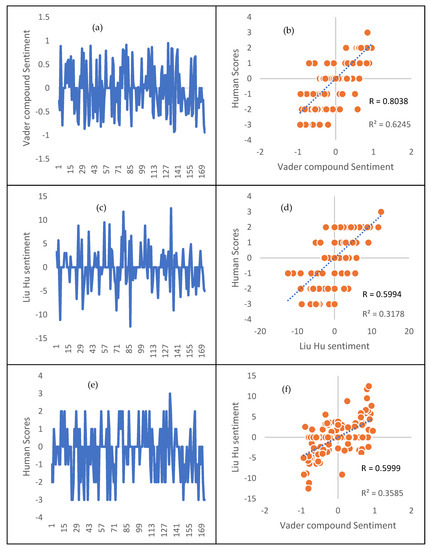
Figure 8.
Subplots showing validation results of the tweet sentiment classification. Subplot: (a) Line plot of VADER sentiment scores; (b) Scatter plot of Human and VADER sentiment scores; (c) Line plot of Liu Hu sentiment scores; (d) Scatter plot of Human and Liu Hu sentiment scores; (e) Line plot of Human sentiment scores; (f) Scatter plot of Liu Hu and VADER sentiment scores.
4.6. Results of Topic Modelling
The LDA and LSI models were applied for topic modelling. Using a document frequency of range 0.10 and 0.90, only 16617 tokens were returned with five (5) types.
In this case, the LDA and LSI models returned only one topic with the same keywords: yahoo, rt, pastor, forget, and adeboye. However, using the document frequency range between 0.00–1.00, 75280 tokens of 3968 types were returned. We set out for six topics using LDA and LSI; the topics and their keywords are shown in Table 4. Figure 9 shows the cloud of words that constitutes LDA and LSI generated topics 1 to 6, while the topics selected top ten key words and weights are presented in Table 5 and Table 6.
Table 4.
Showing LDA and LSI generated topics with keywords.
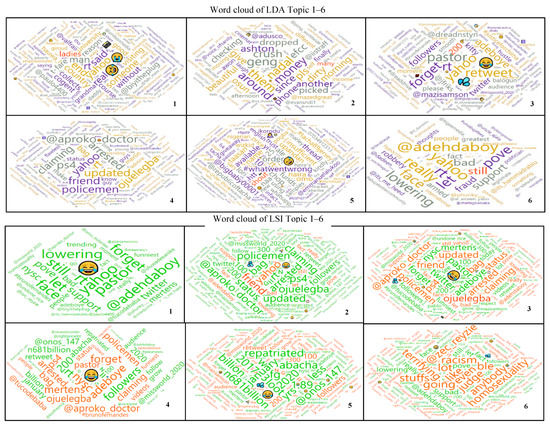
Figure 9.
The cloud of words that constitutes LDA and LSI generated topics 1, 2, 3, 4, 5 and 6.
Table 5.
LDA selected topics with top 10 words and weights.
Table 6.
LSI selected topics with top 10 words and weights.
The topics represent the point in the Multidimensional Scaling (MDS) graph, where the size of the point is a function of the Marginal Topic Probability (MTP) for each topic extracted from the tweet corpus. The bigger the size of the point, the stronger the topic is represented by the words in the corpus. Only the LDA topics are visualized using MDS because LDA is easier to interpret than LSI even though it is more computationally intensive. The visualization of the LDA topics with MDS shows that topic 6 has the highest marginal probability of 0.244889, followed by topic 3 and topic 4. Figure 10 shows the LDA topics using MTP with multidimensional scaling points.
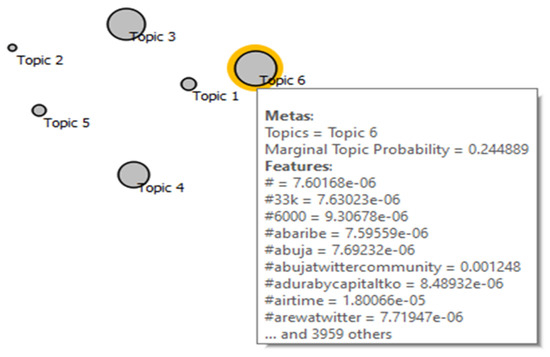
Figure 10.
Visualizing LDA topics using MTP with multidimensional scaling points.
We further used the box plots to visualize the words that are most representative of each topic. The box plot sorts the variables (words) by separating the selected subgroup values. The subgroup ‘yes’ represents the weights of the most representative words of the topic selected on the MDS graph. Table 7 shows the top ten most representative words for LDA topics 1–6 selected on the MDS graph and visualized on the box plot. The words are sorted by their order of relevance to the topics.
Table 7.
Top ten words by order of relevance to the topic in the corpus extracted from the box plot.
In Figure 11 and Figure 12, we present subplots of selected LDA topics from the MDS graph as displayed on the box plot. The box plot changes by closing the separation between the yes and no subgroups.
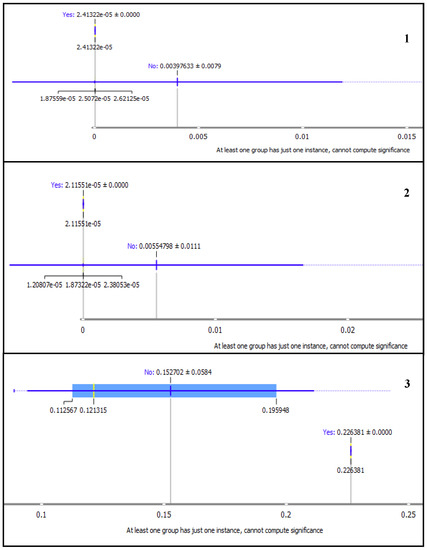
Figure 11.
Box plots showing Marginal Topic Probability of the topics 1, 2, and 3 using Latent Dirichlet Allocation (LDA).
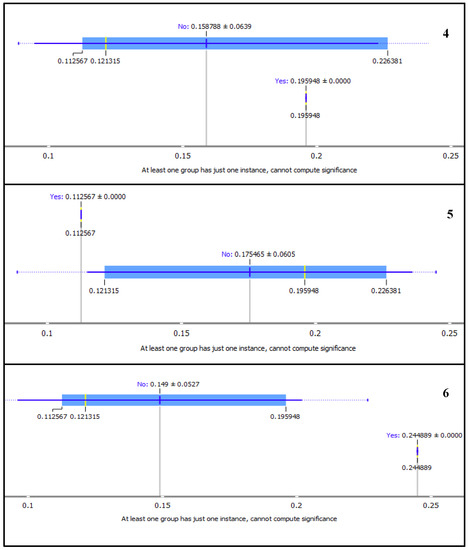
Figure 12.
Box plots showing Marginal Topic Probability of the topics 4, 5 and 6 using Latent Dirichlet Allocation (LDA).
4.7. Discussion
From the Pre-processing and tokenization, one would be wondering what a token or word like a ‘pastor’ has to do with cyber-crime. This does not mean pastors are involved, but, in this context, based on the tweets mined, some Authors classified the way of life of some Nigeria-based pastors as a form of “yahoo”, which means cyber-crime in Nigeria. The word ‘arrested’ has to do with the Landlord who harboured fraudsters in Ibadan, a city in Southwest Nigeria; a man found with PS4 was also ‘arrested’ at Ojuelegba in Lagos, whom the policemen assumed to be a “yahoo-boy”. ‘Pastor Adeboye’ appeared among others due to a statement he made which was, “one of my sons once told me that he was always excited to resume in the office every Monday because he would get to see his secretary again. I told him to fire (sack) her immediately. Nothing and no one is worth your marriage”. With this, pastor Adeboye was hash tagged with “yahooyahoo”. uTweet 90: “My friend just updated on his status that policemen arrested him at Ojuelegba for having a ps4 in his bag, claiming that he was a yahoo boy”, generated many retweets that were responsible for tokens such bag, ps4, arrested, and rt. Another user, uTweet 84 was quite sentimental with his opinion as: “I’m not in support of Yahoo yahoo, it’s really bad but let’s face the fact that it’s yahoo yahoo that’s still lowering poverty” while uTweet164 supported that “it has saved people and promoted more business.”
The sentiments analysis results confirm the advantage of VADER which aside its simplicity and computationally efficiency is its accuracy across domains especially on social media text. The result showed good performance of the sentiment analysis on the ‘yahoo-yahoo’ text which contains several popular slangs among Nigerian youths, capital letters, conjunctions, emoticons, punctuations, etc. The result also confirmed the strength of VADER on English and non-English text, as our corpus contains a lot of broken or informal English grammar. This was a clear challenge for Liu Hu method which classified 86 (49.71%) tweets as Neutral, many of which were misclassified as also noted in [40].
The topics obtained from LDA, and LSI contain words that are consistent with those that appear more than 100 times. There are strong similarities between the keywords in the topics obtained from the LSI and LDA models. The word ‘yahoo’ is highly positively representative of topics 1, 3, 4 and 6 in the LDA with weights 0.170, 0.101, 0.092, 0.234, respectively, and topic 1 in LSI with a weight of 0.087. ‘Yahoo’ is also representative of LSI topic 2 with a negative weight of −0.232 in Table 5. It was observed from Figure 9 (subplot 5) of LDA-generated topics and Table 4 that LDA topic five is made up of words with very low weights when compared to other LDA topics. It was also observed from Table 5, that LDA topics 1, 4, and 6 have top keywords that formed the tweets below when combined. It may not be unconnected with the fact that the tweets created by these top words of topics 1, 4, and 6 had retweet of 72, 1418, and 501, respectively, in the corpus.
Topic 1: uTweet82, Someone said yahoo yahoo is youth empowerment, i weep for my country.
Topic 4: uTweet90, My friend just updated on his status that policemen arrested him at Ojuelegba for having a ps4 in his bag, claiming that.
Topic 6: uTweet84, Iâm not in support of yahoo yahoo, it is really bad but let us face the fact that its yahoo yahoo thats still lowering poverty.
It was observed from the topic modelling that the words racism, judge, homosexuality, terrifying, etc., with red font color in the LSI topics have very strong negative weights. Topic 1 contain positive words only, topics 2 to 5 had a mix of negative and positive words, while topic 6 has only negatively representative words. Emoji have strong weights in both LDA and LSI-generated topics with positive contributions towards their respective topics, as shown in Figure 9, Table 5 and Table 6. This observation is consistent with [45] that emoticons and their associated sentiment usually dominates the sentiment conveyed by textual data analysis whenever they are used. They express emotions and sentiments such as ‘laughing and rolling on the floor’, ‘face with tears of joy’, ‘sweat droplets’, ‘loudly crying face’, ‘grinning face with sweat’, etc. Hence, the sentiment expressed by the emoticons usually convey the central sentiment conveyed by the tweet’s textual content.
Also observed from the box plots in Figure 11 and Figure 12, is the notable separation between yes and no subgroups for topics with high MTP. The ‘yes’ subgroup represents the words for the selected topic, while ‘no’ subgroup are the other words in the corpus. Subplot 6 in Figure 12 shows the good separation between the word frequency for LDA topic six and all others. The MTP of each topic is shown by the ‘yes’ subgroup of each topic as 2.41322 × 10⁻⁵, 2.1151 × 10⁻⁵, 0.226381, 0.195948, 0.112567 and 0.244889 for topic 1, 2, 3, 4, 5 and 6, respectively. The gap between the subgroups is consistent with the sizes of the points and MTP values of the topics, as shown in Figure 10.
5. Conclusions
In this study, a content analysis of Twitter data using 5500 tweets from the #yahooyahoo was conducted to assess SM user’s opinions on the cyber-crime popularly called “yahoo-yahoo”. A convenient sample of opinions (tweets) is used for the study collected from the Twitter application. A semi-structured Twitter data was collected from various verified and unverified Authors. The result gives a detailed analysis of the sentimental view of people towards yahoo yahoo. Although the geolocation showed more users tweeted on the topic from Spain, a closer look into the corpus shows otherwise because of privacy concerns, because many users don’t declare their location on Twitter. It can also be concluded that LDA and LSI modelled topics showed a more representative reflection of the tweet corpus. Although LSI is said to be more computationally demanding in literature and is often less preferable to LDA, we observed that the insight it provided by identifying negative representative words along with the positive representative ones is very significant to topic modelling and gaining insights from tweets. Emojis have strong weights in determining sentiments and contribution to topics modelling and more attention should be paid to sentiment analysis using emojis. The discussion towards yahoo-yahoo as a cybercrime was largely seen as negative to the society from the sentiment distributed using VADER as 42.20%, 24.86%, 15.03%, and 17.92% for negative, neutral, no-zone, and positive sentiment tweets, respectively.
For future research, the Authors plan to create long short-term memory (LSTM) deep learning models for sequence-to-label classification problems in tweets; test the model with new narratives to evaluate their performance; conduct internal and external validity of the study to ascertain that the result obtained are meaningful and trustworthy; we also plan to collect very large historical tweet datasets on trending national issues such as #COVID-19Nigeria, #EndSARS, #LekkiMassacre, etc. for evaluating the proposed future research directions.
Author Contributions
The following statements specifies the Author’s contributions: Conceptualization, A.A.-A.; methodology, A.A.-A., O.A.-A., S.M. and L.F.-S.; software, A.A.-A.; validation, A.A.-A., O.A.-A., S.M. and L.F.-S.; formal analysis, A.A.-A., O.A.-A., S.M. and L.F.-S.; investigation, A.A.-A., O.A.-A., S.M. and L.F.-S.; resources, A.A.-A., O.A.-A., S.M. and L.F.-S.; data curation, A.A.-A. and S.M.; writing—original draft preparation, A.A.-A.; writing—review and editing, A.A.-A., O.A.-A., S.M. and L.F.-S.; visualization, A.A.-A., O.A.-A., S.M. and L.F.-S.; supervision, A.A.-A.; project administration, A.A.-A. and S.M. All authors have read and agreed to the published version of the manuscript.
Funding
This research received no external funding.
Institutional Review Board Statement
Not applicable.
Informed Consent Statement
Not applicable.
Data Availability Statement
The dataset containing the tweets used in this study is curated as “Yahoo-Yahoo Hash-Tag Tweets Using Sentiment Analysis and Opinion Mining Algorithms” [Data set], and publicly available on Zenodo at doi:10.5281/zenodo.4748717.
Acknowledgments
We acknowledge the support of affiliated Universities of each Author for providing conducive research environments.
Conflicts of Interest
The Authors declare no conflict of interest.
References
- Appel, G.; Grewal, L.; Hadi, R.; Stephen, A.T. The future of social media in marketing. J. Acad. Mark. Sci. 2020, 48, 79–95. [Google Scholar] [CrossRef] [PubMed] [Green Version]
- Sahoo, S.R.; Gupta, B.B. Real-Time Detection of Fake Account in Twitter Using Machine-Learning Approach. Adv. Intell. Syst. Comput. 2020, 1086, 149–159. [Google Scholar] [CrossRef]
- Hariani, K.; Riadi, I. Detection of cyberbullying on social media using data mining techniques. Int. J. Comput. Sci. Inf. Secur. 2017, 15, 244–250. [Google Scholar]
- Sahoo, S.R.; Gupta, B. Multiple features based approach for automatic fake news detection on social networks using deep learning. Appl. Soft Comput. 2021, 100, 106983. [Google Scholar] [CrossRef]
- Sahoo, S.R.; Gupta, B. Hybrid approach for detection of malicious profiles in twitter. Comput. Electr. Eng. 2019, 76, 65–81. [Google Scholar] [CrossRef]
- Boyer, H. Emerging Technologies—Social Media. INALJ Virginia. 2014. Available online: http://inalj.com/?p=62623 (accessed on 15 June 2021).
- Ojedokun, U.A.; Eraye, M.C. Socioeconomic lifestyles of the yahoo-boys: A study of perceptions of university stu-dents in Nigeria. Int. J. Cyber Criminol. 2012, 6, 1001–1013. [Google Scholar]
- Tade, O.; Aliyu, I. Social organization of Internet fraud among university undergraduates in Nigeria. Int. J. Cyber Criminol. 2011, 5, 860–875. [Google Scholar]
- Adeniran, A.I. The Internet and emergence of yahoo-boys sub-culture in Nigeria. Int. J. Cyber Criminol. 2008, 2, 368–381. [Google Scholar]
- Ninalowo, A. Nexus of State and Legitimation Crisis; Prime Publications: Lagos, Nigeria, 2016. [Google Scholar]
- Lazarus, S.; Okolorie, G.U. The bifurcation of the Nigerian cybercriminals: Narratives of the Economic and Financial Crimes Commission (EFCC) agents. Telemat. Inform. 2019, 40, 14–26. [Google Scholar] [CrossRef]
- Rossy, Q.; Ribaux, O. Orienting the Development of Crime Analysis Processes in Police Organisations Covering the Digital Transformations of Fraud Mechanisms. Eur. J. Crim. Policy Res. 2020, 26, 335–356. [Google Scholar] [CrossRef]
- Longe, O.; Abayomi-Alli, A.; Shaib, I.L.; Longe, F. Enhanced content analysis of fraudulent Nigeria electronic mails using e-STAT. In Proceedings of the 2009 2nd International Conference on Adaptive Science & Technology (ICAST), Accra, Ghana, 14–16 December 2009; IEEE: Manhattan, NY, USA, 2009; pp. 238–243. [Google Scholar]
- Omoroghomwan, O.B. An Appraisal of the Activities of Economic and Financial Crime Commission (EFCC) on the Administration of Criminal Justice in Nigeria. Acta Univ. Danubius. Relat. Int. 2018, 11, 174–193. [Google Scholar]
- Abayomi-Alli, O.; Misra, S.; Abayomi-Alli, A.; Odusami, M. A review of soft techniques for SMS spam classification: Methods, approaches and applications. Eng. Appl. Artif. Intell. 2019, 86, 197–212. [Google Scholar] [CrossRef]
- AUC: African Union Commission. Cyber Crime & Cyber Security Trends in Africa. 2016. Available online: https://www.thehaguesecuritydelta.com/media/com_hsd/report/135/document/Cyber-security-trends-report-Africa-en.pdf (accessed on 12 July 2021).
- Gupta, B.; Sharma, S.; Chennamaneni, A. Twitter Sentiment Analysis: An Examination of Cybersecurity Attitudes and Behaviour. In Proceedings of the 2016 Pre-ICIS SIGDSA/IFIP WG8.3 Symposium: Innovations in Data Analytics, Dublin, Ireland, 11 December 2016; Available online: https://aisel.aisnet.org/sigdsa2016/17 (accessed on 9 July 2021).
- Kunwar, R.S.; Sharma, P. Social media: A new vector for cyber-attack. In Proceedings of the 2016 International Conference on Advances in Computing, Communication, & Automation (ICACCA) (Spring), Dehradun, India, 8–9 April 2016; IEEE: Manhattan, NY, USA, 2016; pp. 1–5. [Google Scholar]
- Kirik, A.M.; Çetinkaya, A. The Use of Social Media in Online Journalism. In Proceedings of the 3rd International Eurasian Conference on Sport Education and Society, Mardin, Turkey, 15–18 November 2018; Volume 3, pp. 1171–1187. [Google Scholar]
- Can, U.; Alatas, B. A new direction in social network analysis: Online social network analysis problems and applications. Phys. A Stat. Mech. Its Appl. 2019, 535, 122372. [Google Scholar] [CrossRef]
- Hernandez-Suarez, A.; Sanchez-Perez, G.; Toscano-Medina, K.; Martinez-Hernandez, V.; Perez-Meana, H.; Olivares-Mercado, J.; Sanchez, V. Social Sentiment Sensor in Twitter for Predicting Cyber-Attacks Using ℓ1 Regularization. Sensors 2018, 18, 1380. [Google Scholar] [CrossRef] [Green Version]
- Ibrahim, S. Social and contextual taxonomy of cybercrime: Socioeconomic theory of Nigerian cybercriminals. Int. J. Law Crime Justice 2016, 47, 44–57. [Google Scholar] [CrossRef] [Green Version]
- Arimi, C.N. Social-economic factors influencing the crime rate in Meru Municipality Kenya. Master’s Thesis, University of Nairobi, Nairobi, Kenya, 2011. Available online: http://erepository.uonbi.ac.ke:8080/handle/123456789/4688 (accessed on 15 June 2021).
- Adejoh, S.O.; Alabi, T.A.; Adisa, W.B.; Emezie, N.M. “Yahoo Boys” Phenomenon in Lagos Metropolis: A Qualitative Investigation. Int. J. Cyber Criminol. 2019, 13, 1–20. [Google Scholar] [CrossRef]
- Aghababaei, S.; Makrehchi, M. Mining Twitter data for crime trend prediction. Intell. Data Anal. 2018, 22, 117–141. [Google Scholar] [CrossRef]
- Kounadi, O.; Lampoltshammer, T.J.; Groff, E.; Sitko, I.; Leitner, M. Exploring Twitter to Analyze the Public’s Reaction Patterns to Recently Reported Homicides in London. PLoS ONE 2015, 10, e0121848. [Google Scholar] [CrossRef] [Green Version]
- Sharma, K.; Bhasin, S.; Bharadwaj, P. A Worldwide Analysis of Cyber Security and Cyber Crime using Twitter. Int. J. Eng. Adv. Technol. 2019, 8, 1051–1056. [Google Scholar]
- Al-Garadi, M.A.; Varathan, K.D.; Ravana, S.D. Cybercrime detection in online communications: The experimental case of cyberbullying detection in the Twitter network. Comput. Hum. Behav. 2016, 63, 433–443. [Google Scholar] [CrossRef]
- Al-Smadi, M.; Qawasmeh, O.; Al-Ayyoub, M.; Jararweh, Y.; Gupta, B. Deep Recurrent neural network vs. support vector machine for aspect-based sentiment analysis of Arabic hotels’ reviews. J. Comput. Sci. 2018, 27, 386–393. [Google Scholar] [CrossRef]
- Founta, A.M.; Chatzakou, D.; Kourtellis, N.; Blackburn, J.; Vakali, A.; Leontiadis, I. A unified deep learning architecture for abuse detection. In Proceedings of the 10th ACM Conference on Web Science, Boston, MA, USA, 30 June–3 July 2019; pp. 105–114. [Google Scholar]
- Drishya, S.V.; Saranya, S.; Sheeba, J.I.; Devaneyan, S.P. Cyberbully Image and Text Detection using Convolutional Neural Networks. CiiT Int. J. Fuzzy Syst. 2019, 11, 25–30. [Google Scholar]
- Zulfikar, M.T. Suharjito Detection Traffic Congestion Based on Twitter Data using Machine Learning. Procedia Comput. Sci. 2019, 157, 118–124. [Google Scholar] [CrossRef]
- Figueira, Á.; Guimarães, N.; Pinto, J. A System to Automatically Predict Relevance in Social Media. Procedia Comput. Sci. 2019, 164, 105–112. [Google Scholar] [CrossRef]
- Donchenko, D.; Ovchar, N.; Sadovnikova, N.; Parygin, D.; Shabalina, O.; Ather, D. Analysis of Comments of Users of Social Networks to Assess the Level of Social Tension. Procedia Comput. Sci. 2017, 119, 359–367. [Google Scholar] [CrossRef]
- Liu, X.; Fu, J.; Chen, Y. Event evolution model for cybersecurity event mining in tweet streams. Inf. Sci. 2020, 524, 254–276. [Google Scholar] [CrossRef]
- van der Walt, E.; Eloff, J.; Grobler, J. Cyber-security: Identity deception detection on social media platforms. Comput. Secur. 2018, 78, 76–89. [Google Scholar] [CrossRef] [Green Version]
- Cheng, L.; Guo, R.; Liu, H. Robust Cyberbullying Detection with Causal Interpretation. In Proceedings of the Companion Proceedings of the 2019 World Wide Web Conference, San Francisco, CA, USA, 13–17 May 2019; pp. 169–175. [Google Scholar]
- Burnap, P.; Williams, M.L. Cyber Hate Speech on Twitter: An Application of Machine Classification and Statistical Modeling for Policy and Decision Making. Policy Internet 2015, 7, 223–242. [Google Scholar] [CrossRef] [Green Version]
- Hu, M.; Liu, B. Mining opinion features in customer reviews. In Proceedings of the 19th national conference on Artificial Intelligence (AAAI’04), San Jose, CA, USA, 25–29 July 2004; pp. 755–760. [Google Scholar]
- Hutto, C.J.; Gilbert, E. VADER: A Parsimonious Rule-based Model for Sentiment Analysis of Social Media Text. In Proceedings of the 8th International AAAI Conference on Weblogs and Social Media, Ann Arbor, MI, USA, 1–4 June 2014; AAAI Press: San Jose, CA, USA, 2015; pp. 1–10. [Google Scholar]
- Demšar, J.; Curk, T.; Erjavec, A.; Gorup, C.; Hočevar, T.; Milutinovič, M.; Polajnar, M.; Toplak, M.; Starič, A.; Štajdohar, M.; et al. Orange: Data mining toolbox in Python. JMLR 2013, 14, 2349–2353. [Google Scholar]
- Abayomi-Alli, A.; Abayomi-Alli, O.; Misra, S.; Fernandez-Sanz, L. Yahoo-Yahoo Hash-Tag Tweets Using Sentiment Analysis and Opinion Mining Algorithms. Zenodo 2021. [Google Scholar] [CrossRef]
- Labille, K.; Gauch, S.; Alfarhood, S. Creating Domain-Specific Sentiment Lexicons via Text Mining. In Proceedings of the Workshop on Issues of Sentiment Discovery and Opinion Mining (WISDOM’17), Halifax, NS, Canada, 14 August 2017; pp. 1–8. [Google Scholar] [CrossRef]
- Rehurek, R.; Sojka, P. Software framework for topic modelling with large corpora. In Proceedings of the LREC 2010 workshop on new challenges for NLP frameworks, Valletta, Malta, 22 May 2010; pp. 45–50. [Google Scholar]
- Ullah, M.A.; Marium, S.M.; Begum, S.A.; Dipa, N.S. An algorithm and method for sentiment analysis using the text and emoticon. ICT Express 2020, 6, 357–360. [Google Scholar] [CrossRef]
Publisher’s Note: MDPI stays neutral with regard to jurisdictional claims in published maps and institutional affiliations. |
© 2022 by the authors. Licensee MDPI, Basel, Switzerland. This article is an open access article distributed under the terms and conditions of the Creative Commons Attribution (CC BY) license (https://creativecommons.org/licenses/by/4.0/).