
A Semi-Supervised Approach to Sentiment Analysis of Tweets during the 2022 Philippine Presidential Election

 ,
,  ,
, 
Abstract
:1. Introduction
1.1. Contributions of this Paper
- Automatic labeling of polarity of English and Filipino/Tagalog language tweets.
- Reporting of the sentiment of the public toward either or both of the candidates.
- Using the study as a topic in Philippine sociology or political science.
- Using the proposed model to further analyze tweets for the next general elections.
- Help advance the NLP research and practice in Filipino/Tagalog language.
1.2. Organization of This Paper
2. The Related Literature
2.1. Sentiment Analysis in the Context of Elections
2.2. Sentiment Analysis Using Mixed English and Filipino Language
3. Methodology
3.1. Data Collection
3.2. Data Annotation
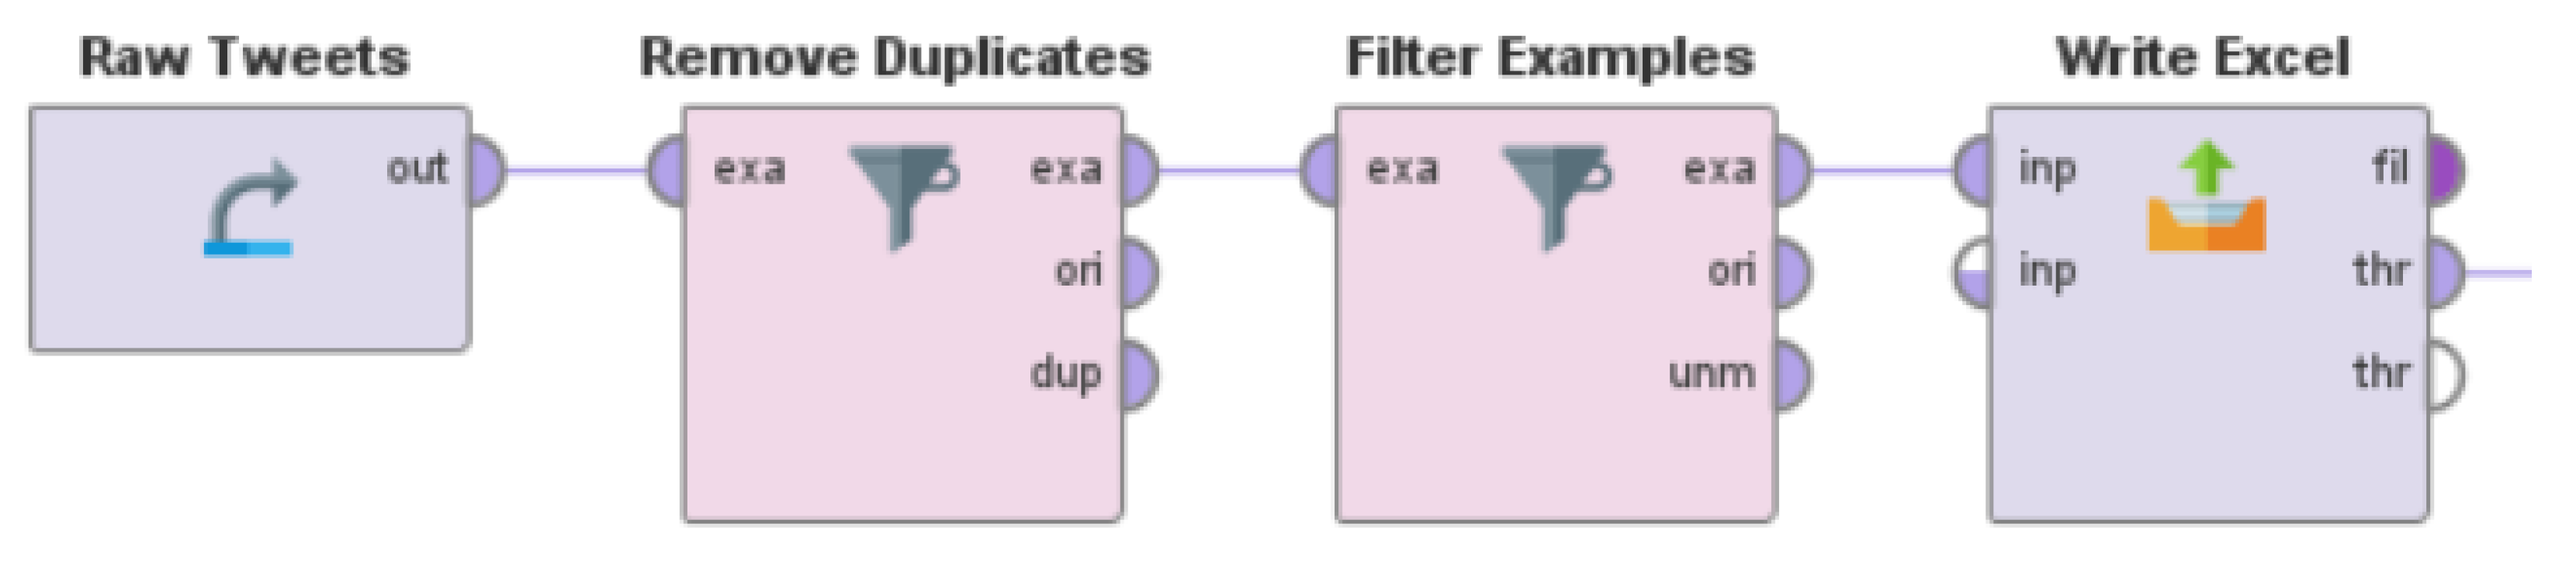
3.3. Data Preparation and Pre-Processing
3.3.1. Tag Replacement
3.3.2. Case Transformation
3.3.3. Tokenization
3.3.4. Token Filtering by Length
3.3.5. Lemmatization
3.3.6. Stop Word Removal
3.3.7. n-Grams Generation
3.3.8. Training and Testing Data Segmentation
3.4. Word Embedding Using TF-IDF
3.5. Hyperparameter Tuning
3.6. Semi-Supervised Learning
3.7. Performance Evaluation
4. Results and Discussion
5. Conclusions
Author Contributions
Funding
Data Availability Statement
Acknowledgments
Conflicts of Interest
References
- Official Gazette of the Republic of the Philippines. The Constitution of the Republic of the Philippines. 1987. Available online: https://www.officialgazette.gov.ph/constitutions/1987-constitution/ (accessed on 10 June 2022).
- Palatino, M. Why the Fight for the Philippines Vice Presidency Matters. The Diplomat, 3 December 2021. Available online: https://thediplomat.com/2021/12/why-the-fight-for-the-philippines-vice-presidency-matters/ (accessed on 10 June 2022).
- Baclig, C.E. TIMELINE: The 4-Year Robredo-Marcos POLL case, INQUIRER.NET, 16 February 2021. Available online: https://newsinfo.inquirer.net/1396547/the-4-year-robredo-marcos-vice-presidential-case (accessed on 10 June 2022).
- DW. Philippines: Marcos Jr. Wins Presidential Election Landslide, 9 May 2022. Available online: https://www.dw.com/en/philippines-marcos-jr-wins-presidential-election-landslide/a-61727645 (accessed on 10 June 2022).
- Mendoza, D.J. Reflections on the Philippine Presidential Race, 9 May 2022. Available online: https://www.bworldonline.com/opinion/2022/05/09/447235/reflections-on-the-philippine-presidential-race/ (accessed on 10 June 2022).
- StatCounter. Social Media Stats Philippines, June 2022. Available online: https://gs.statcounter.com/social-media-stats/all/philippines. (accessed on 23 July 2022).
- Mateo, J. Philippines Still World’s Social Media Capital–sudy. The Philippine Star, 3 February 2018. Available online: https://www.philstar.com/headlines/2018/02/03/1784052/philippines-still-worlds-social-media-capital-study/amp/ (accessed on 23 July 2022).
- Investopedia. Web 2.0 and Web 3.0, 21 May 2022. Available online: https://www.investopedia.com/web-20-web-30-5208698 (accessed on 10 June 2022).
- Hubspot. What Is Twitter and How Does It Work? 29 January 2019. Available online: https://blog.hubspot.com/marketing/what-is-twitter (accessed on 10 June 2022).
- Bansala, B.; Srivastava, S. On predicting elections with hybrid topic based sentiment analysis of tweets. Procedia Comput. Sci. 2018, 135, 346–353. [Google Scholar] [CrossRef]
- Sharma, A.; Ghoseb, U. Sentimental Analysis of Twitter Data with respect to General Elections in India. Procedia Comput. Sci. 2020, 173, 325–334. [Google Scholar] [CrossRef]
- Rodríguez-Ibáñez, M.; Gimeno-Blanes, F.-J.; Cuenca-Jiménez, P.M.; Soguero-Ruiz, C.; Rojo-Álvarez, J.L. Sentiment Analysis of Political Tweets From the 2019 Spanish Elections. IEEE Access 2021, 9, 101847–101862. [Google Scholar] [CrossRef]
- Yaqub, U.; Malik, M.A.; Zaman, S. Sentiment Analysis of Russian IRA Troll Messages on Twitter during US Presidential Elections of 2016. In Proceedings of the 7th International Conference on Behavioural and Social Computing (BESC), Bournemouth, UK, 5–7 November 2020. [Google Scholar]
- Bansal, B.; Srivastava, S. Lexicon-based Twitter sentiment analysis for vote share prediction using emoji and N-gram features. Int. J. Web Based Commun. 2019, 15, 85–99. [Google Scholar] [CrossRef]
- Praciano, B.J.G.; da Costa, J.P.C.L.; Maranhão, J.P.A.; de Mendonça, F.L.L.; Junior, R.T.d.; Prettz, J.B. Spatio-Temporal Trend Analysis of the Brazilian Elections based on Twitter Data. In Proceedings of the IEEE International Conference on Data Mining Workshops, Singapore, 17–20 November 2018. [Google Scholar]
- Kovács, T.; Kovács-Győri, A.; Resch, B. #AllforJan: How Twitter Users in Europe Reacted to the Murder of Ján Kuciak—Revealing Spatiotemporal Patterns through Sentiment Analysis and Topic Modeling. Int. J. Geo-Inf. 2021, 10, 585. [Google Scholar]
- Kramer, J.; Gordon, C. Improvement of a Naive Bayes Sentiment Classifier Using MRS-Based Features. In Proceedings of the Third Joint Conference on Lexical and Computational Semantics, Dublin, Ireland, 23–24 August 2014. [Google Scholar]
- Herrera, M.; Aich, A.; Parde, N. TweetTaglish: A Dataset for Investigating Tagalog-English Code-Switching. In Proceedings of the 13th Language Resources and Evaluation Conference, Palais du Pharo, Marseille, France, 20–25 June 2022. [Google Scholar]
- Villavicencio, C.; Macrohon, J.J.; Inbaraj, X.A.; Jeng, J.-H.; Hsieh, J.-G. Twitter Sentiment Analysis towards COVID-19 Vaccines in the Philippines Using Naïve Bayes. Information 2021, 12, 204. [Google Scholar] [CrossRef]
- Samonte, M.J.C.; Garcia, J.M.R.; Lucero, V.J.L.; Santos, S.C.B. Sentiment and opinion analysis on Twitter about local airlines. In Proceedings of the ICCIP ’17: Proceedings of the 3rd International Conference on Communication and Information Processing, Tokyo, Japan, 24–29 November 2017. [Google Scholar]
- Delizo, J.P.D.; Abisado, M.B.; de los Trinos, M.I.P. Philippine Twitter Sentiments during COVID-19 Pandemic using Multinomial Naïve-Bayes. Int. J. Adv. Trends Comput. Sci. Eng. 2020, 9, 408–412. [Google Scholar]
- Lutkevich, B. Natural Language Processing (NLP); TechTarget: Newton, MA, USA, 2021; Available online: https://www.techtarget.com/searchenterpriseai/definition/natural-language-processing-NLP (accessed on 10 June 2022).
- Harshith. Text Preprocessing in Natural Language Processing, Towards Data Science, 21 November 2019. Available online: https://towardsdatascience.com/text-preprocessing-in-natural-language-processing-using-python-6113ff5decd8 (accessed on 10 June 2022).
- StackOverflow. How nltk.TweetTokenizer Different from nltk.word_tokenize? Available online: https://stackoverflow.com/questions/61919670/how-nltk-tweettokenizer-different-from-nltk-word-tokenize (accessed on 10 June 2022).
- Beri, A. Stemming vs. Lemmatization, Towards Data Science, 14 May 2020. Available online: https://towardsdatascience.com/stemming-vs-lemmatization-2daddabcb221 (accessed on 10 June 2022).
- Borisov, O. Text Generation Using N-Gram Model, Towards Data Science, 28 October 2020. Available online: https://towardsdatascience.com/text-generation-using-n-gram-model-8d12d9802aa0 (accessed on 10 June 2022).
- Clarke, M. How to Use CountVectorizer for n-Gram Analysis, Practical Data Science, 24 December 2021. Available online: https://practicaldatascience.co.uk/machine-learning/how-to-use-count-vectorization-for-n-gram-analysis (accessed on 10 June 2022).
- Sci-Kit Learn. Sklearn.feature_extraction.text.TfidfTransformer. Available online: https://scikit-learn.org/stable/modules/generated/sklearn.feature_extraction.text.TfidfTransformer.html (accessed on 10 June 2022).
- Sci-Kit Learn. 1.9. Naive Bayes. Available online: https://scikit-learn.org/stable/modules/naive_bayes.html#multinomial-naive-bayes (accessed on 10 June 2022).
- Standford University. Naive Bayes Text Classification; Cambridge University Press: Cambridge, UK, 2009; Available online: https://nlp.stanford.edu/IR-book/html/htmledition/naive-bayes-text-classification-1.html (accessed on 10 June 2022).


| Authors | Language | Classifier | Accuracy | References |
|---|---|---|---|---|
| Samonte et al. | English | Naïve Bayes | 66.67% | [20] |
| Abisado et al. | English, Tagalog | Multinomial Naïve Bayes | 72.17% | [21] |
| Villavicencio et al. | English, Tagalog | Naïve Bayes | 81.77% | [19] |
| Proposed Method | English, Tagalog | Multinomial Naïve Bayes with Self-Training | 84.83% |
| Date of Creation | Tweet |
|---|---|
| 27 February 2022 | #IpanaloNa10To 9 out of 10 Presidential candidates agreed to show their SALN. BONG-BONG MARCOS, KAYA MO RIN BA??? |
| 02 March 2022 | OCTA’s recent survey showed the Bongbong Marcos-Sara Duterte tandem topping the list of preferred presidential and VP bets |
| 03 March 2022 | Vice President Leni Robredo and her running mate Senator Kiko Pangilinan held a dialogue with farmers and fishermen |
| 18 March 2022 | Celebs endorse bets: Willie Revillame for Sara Duterte, Mocha Uson for Isko Moreno #Halalan2022 |
| 3 April 2022 | “Ang tatanglaw sa buong bayan, ilaw ng tahanan.”—VP @lenirobredo #LetLeniLead #10RobredoPresident |
| 18 April 2022 | #BataanIsPink #CatrionaIsPink #HindiIsusukoAngBataan #LetLeniLead |
| 24 April 2022 | @BBMSARAH22 I BELIEVE NA MAS MALAKAS SI SIR BONG BONG MARCOS KESA KAY HESU KRISTO!! LIKE IF YOU AGREE #LeniWithdraw #taguigispulaasf*ck |
| 24 April 2022 | “It’s okay to disagree, but don’t let your hate overcome your humanity.”-BBM #BBMIsMyPresident2022 |
| 28 April 2022 | #1 Trending parin. BBM FOR PRESIDENT PULA ANG PAMPANGGA #PampamBNK48 #BBMIsMyPresident2022 #BBMSaraUNITEAM |
| 03 May 2022 | ILALABAN PO NAMIN KAYO AT ANG PILIPINAS! @kikopangilinan @lenirobredo #LeniKikoAllTheWay2022 #KulayRosasAngBukas #Halalan2022 |
| Polarity | Tweet |
|---|---|
| Positive | Breaking News Bong Bong Marcos to hold rally at Philippine Arena, a good political tactic to potentially be endorsed by Iglesia in 2022. |
| You nailed it soon to be President of the Philippines Ferdinand “Bong-Bong” Marcos. #SMNIpresidentialdebate | |
| WOMEN CAN LEAD #LetLeniKikoLead2022 #LetLeniLead #KulayRosasAngBukas | |
| @trsrhaul GOBYERNONG TAPAT, ANGAT BUHAY LAHAT #LeniKiko2022 #IpanaloNa10ParaSaLahat #AbanteBabae | |
| Neutral | Bong bong marcos Leni robredo double filter success |
| ICYMI: Last April 28, supporters of presidential candidates Leni Robredo and Ferdinand “Bongbong” Marcos Jr. locked horns inside Power Plant Mall in Rockwell Center, Makati. The reason? Read: | via @philstarlife | |
| @iMthinkingPinoy @bongbongmarcos @indaysara @srsasot @smninews @manilabulletin | |
| @JervisManahan @lenirobredo @ABSCBNNews | |
| Negative | @manilabulletin Bong Bong Marcos leading na naman daw. That’s another f*cking lie. #MarcosMagnanakaw |
| Bakit si Imelda wala sa mga rallies ni BONG BONG MARCOS? #babakoutmuli | |
| @WinwinEklabu dream on KIKO PANGILINAN!! | |
| Good morning sa lahat, except kay Leni Robredo na hindi pa rin sumusunod sa comelec rules. #LeniTangaSaLahat |
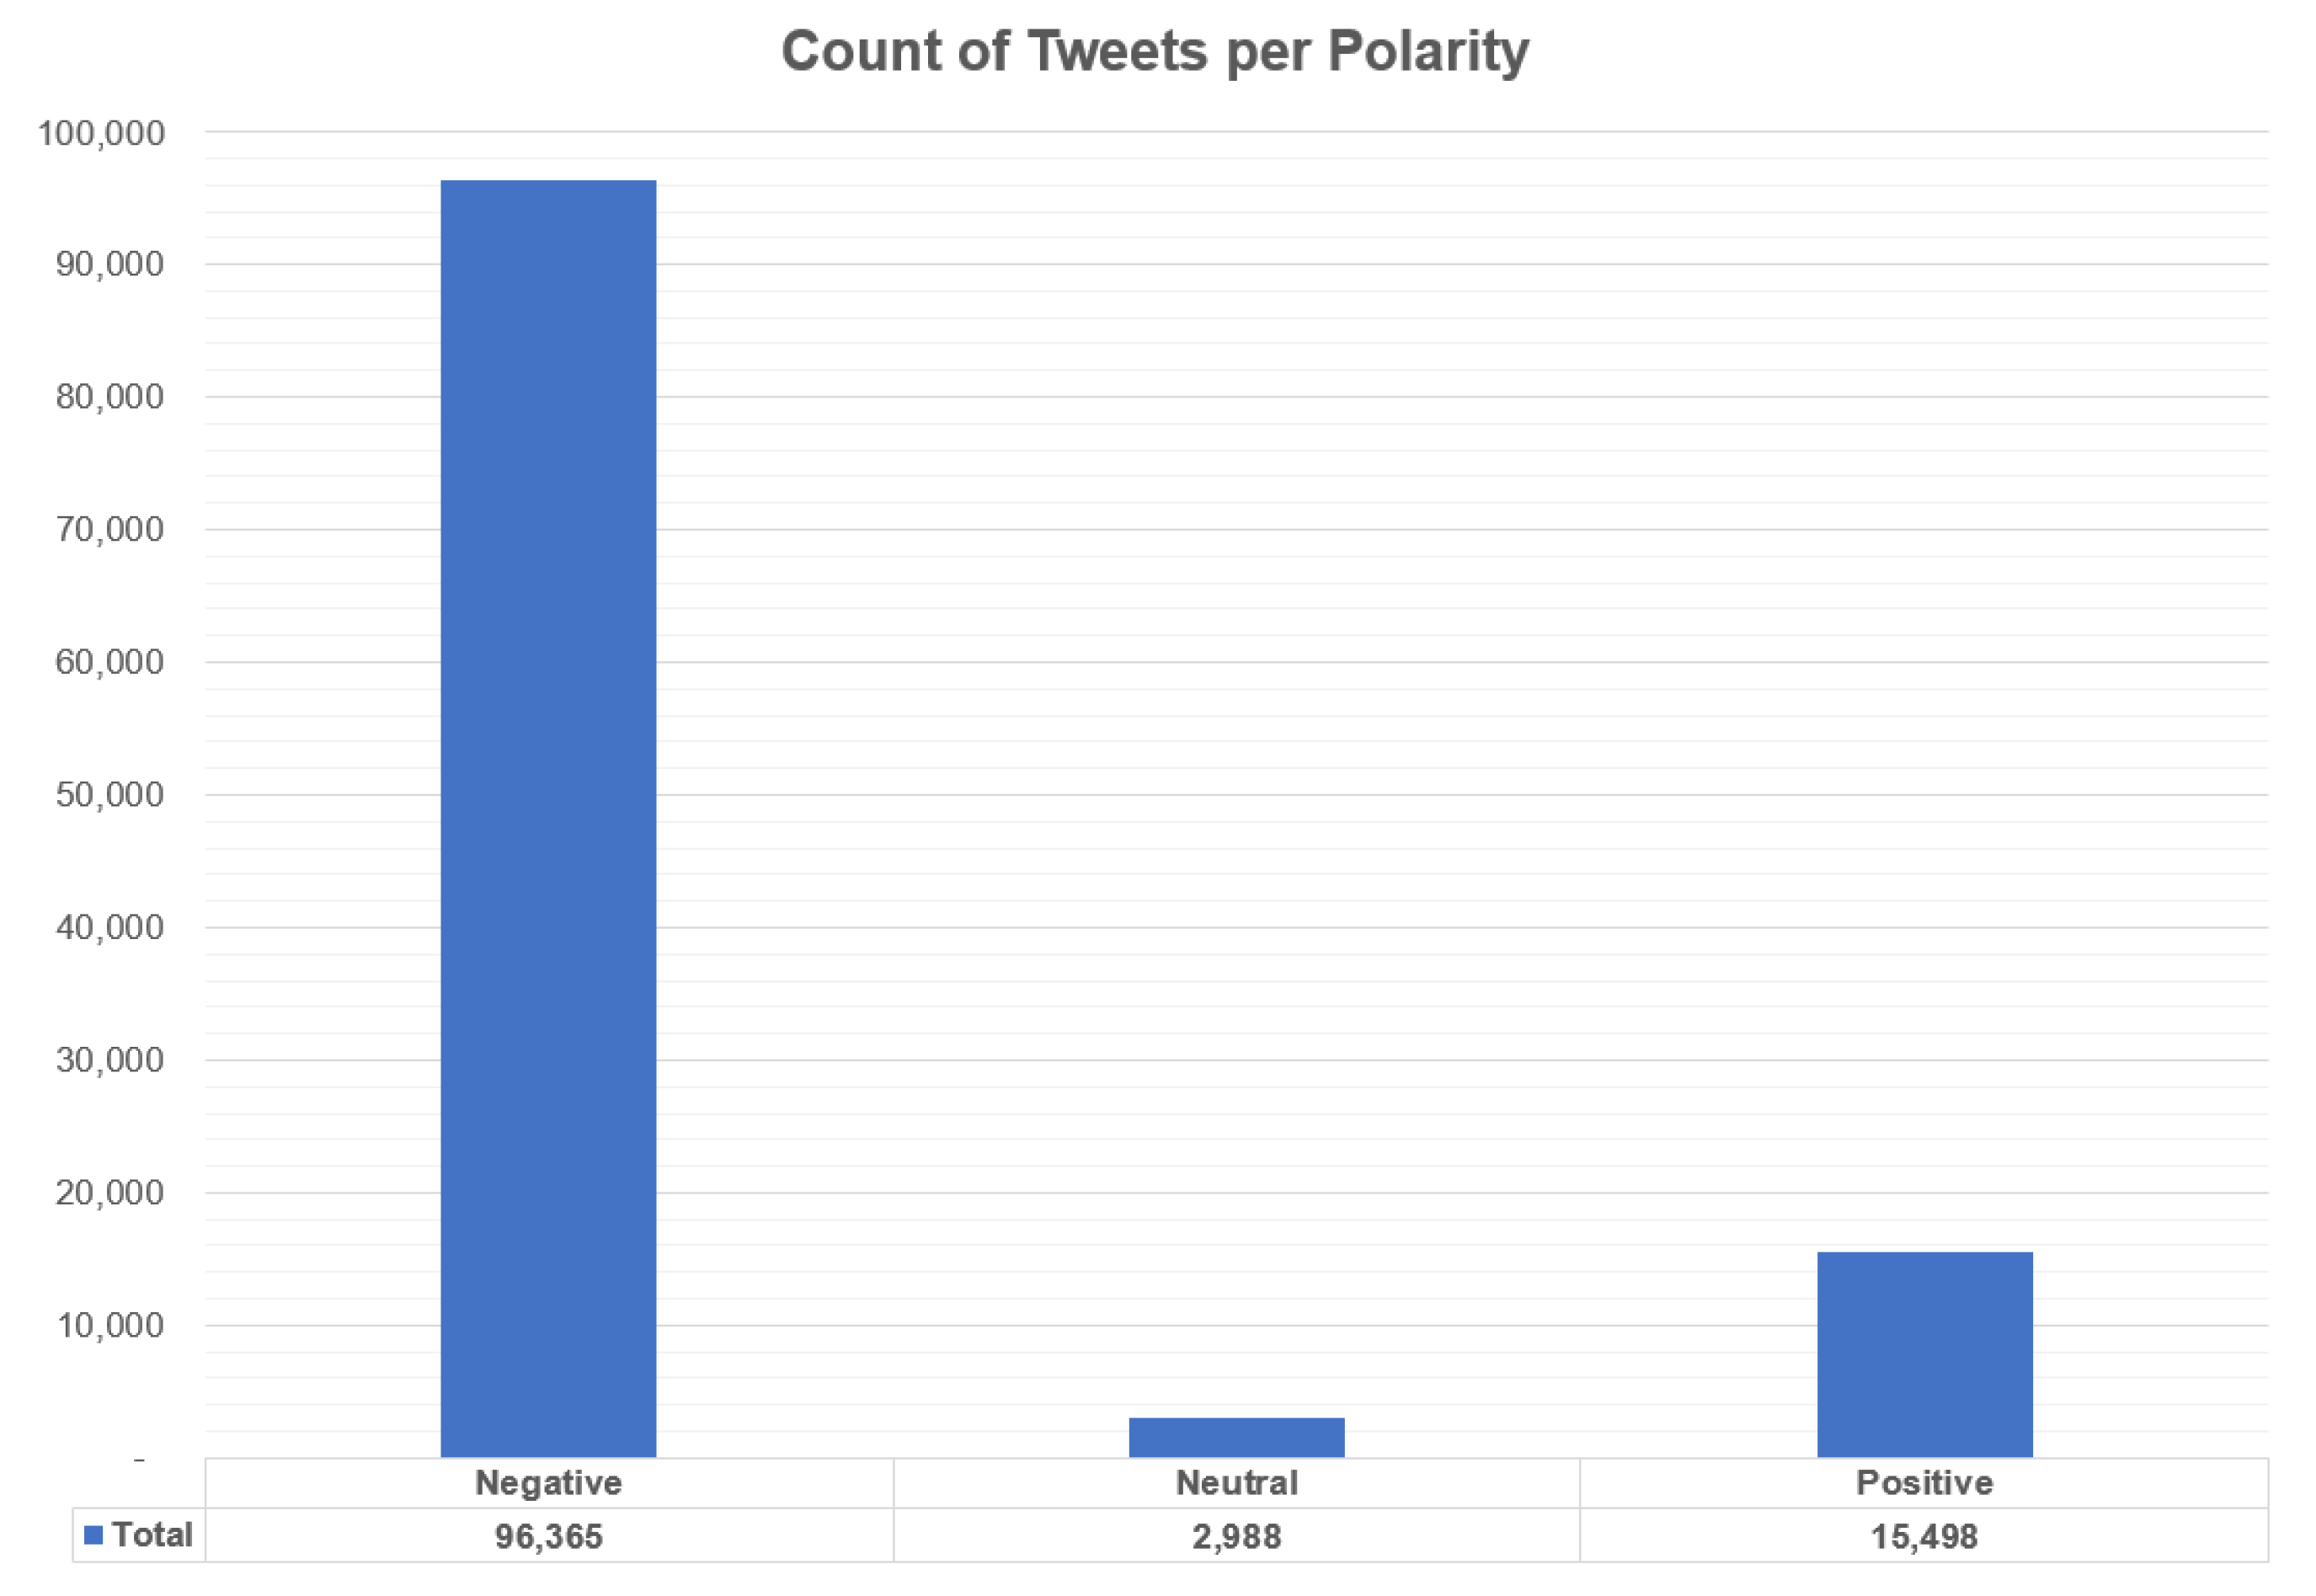
| Campaign | Polarity | Tweet Count |
|---|---|---|
| Marcos | Positive | 752 |
| Neutral | 426 | |
| Negative | 21,506 | |
| Total | 22,670 | |
| Robredo | Positive | 13,587 |
| Neutral | 2589 | |
| Negative | 76,015 | |
| Total | 92,192 | |
| Total Tweets Annotated | 114,851 | |
| n-Gram | Training Score | Validation Score |
|---|---|---|
| Unigram (1-Gram) | 0.94 | 0.82 |
| Bigram (2-Gram) | 0.99 | 0.82 |
| Trigram (3-Gram) | 1.00 | 0.82 |
| n-Gram | Training Score | Validation Score |
|---|---|---|
| Unigram (1-Gram) | 0.85 | 0.83 |
| Bigram (2-Gram) | 0.86 | 0.82 |
| Trigram (3-Gram) | 0.86 | 0.81 |
| Alpha | Test Score | Ranking |
|---|---|---|
| 0.4 | 0.839705 | 1 |
| 0.5 | 0.838795 | 2 |
| 0.3 | 0.838156 | 3 |
| 0.6 | 0.838102 | 4 |
| 0.7 | 0.837476 | 5 |
| 0.8 | 0.837109 | 6 |
| 0.9 | 0.836770 | 7 |
| 1.0 | 0.836362 | 8 |
| 0.2 | 0.804504 | 9 |
| 0.1 | 0.665983 | 10 |
| Label | Predicted Positive | Predicted Neutral | Predicted Negative | Class Recall |
|---|---|---|---|---|
| True Positive | 1187 | 0 | 13,454 | 8.11% |
| True Neutral | 2 | 377 | 2456 | 13.30% |
| True Negative | 31 | 0 | 87,604 | 99.97% |
| Class Precision | 97.30% | 100.00% | 84.63% |
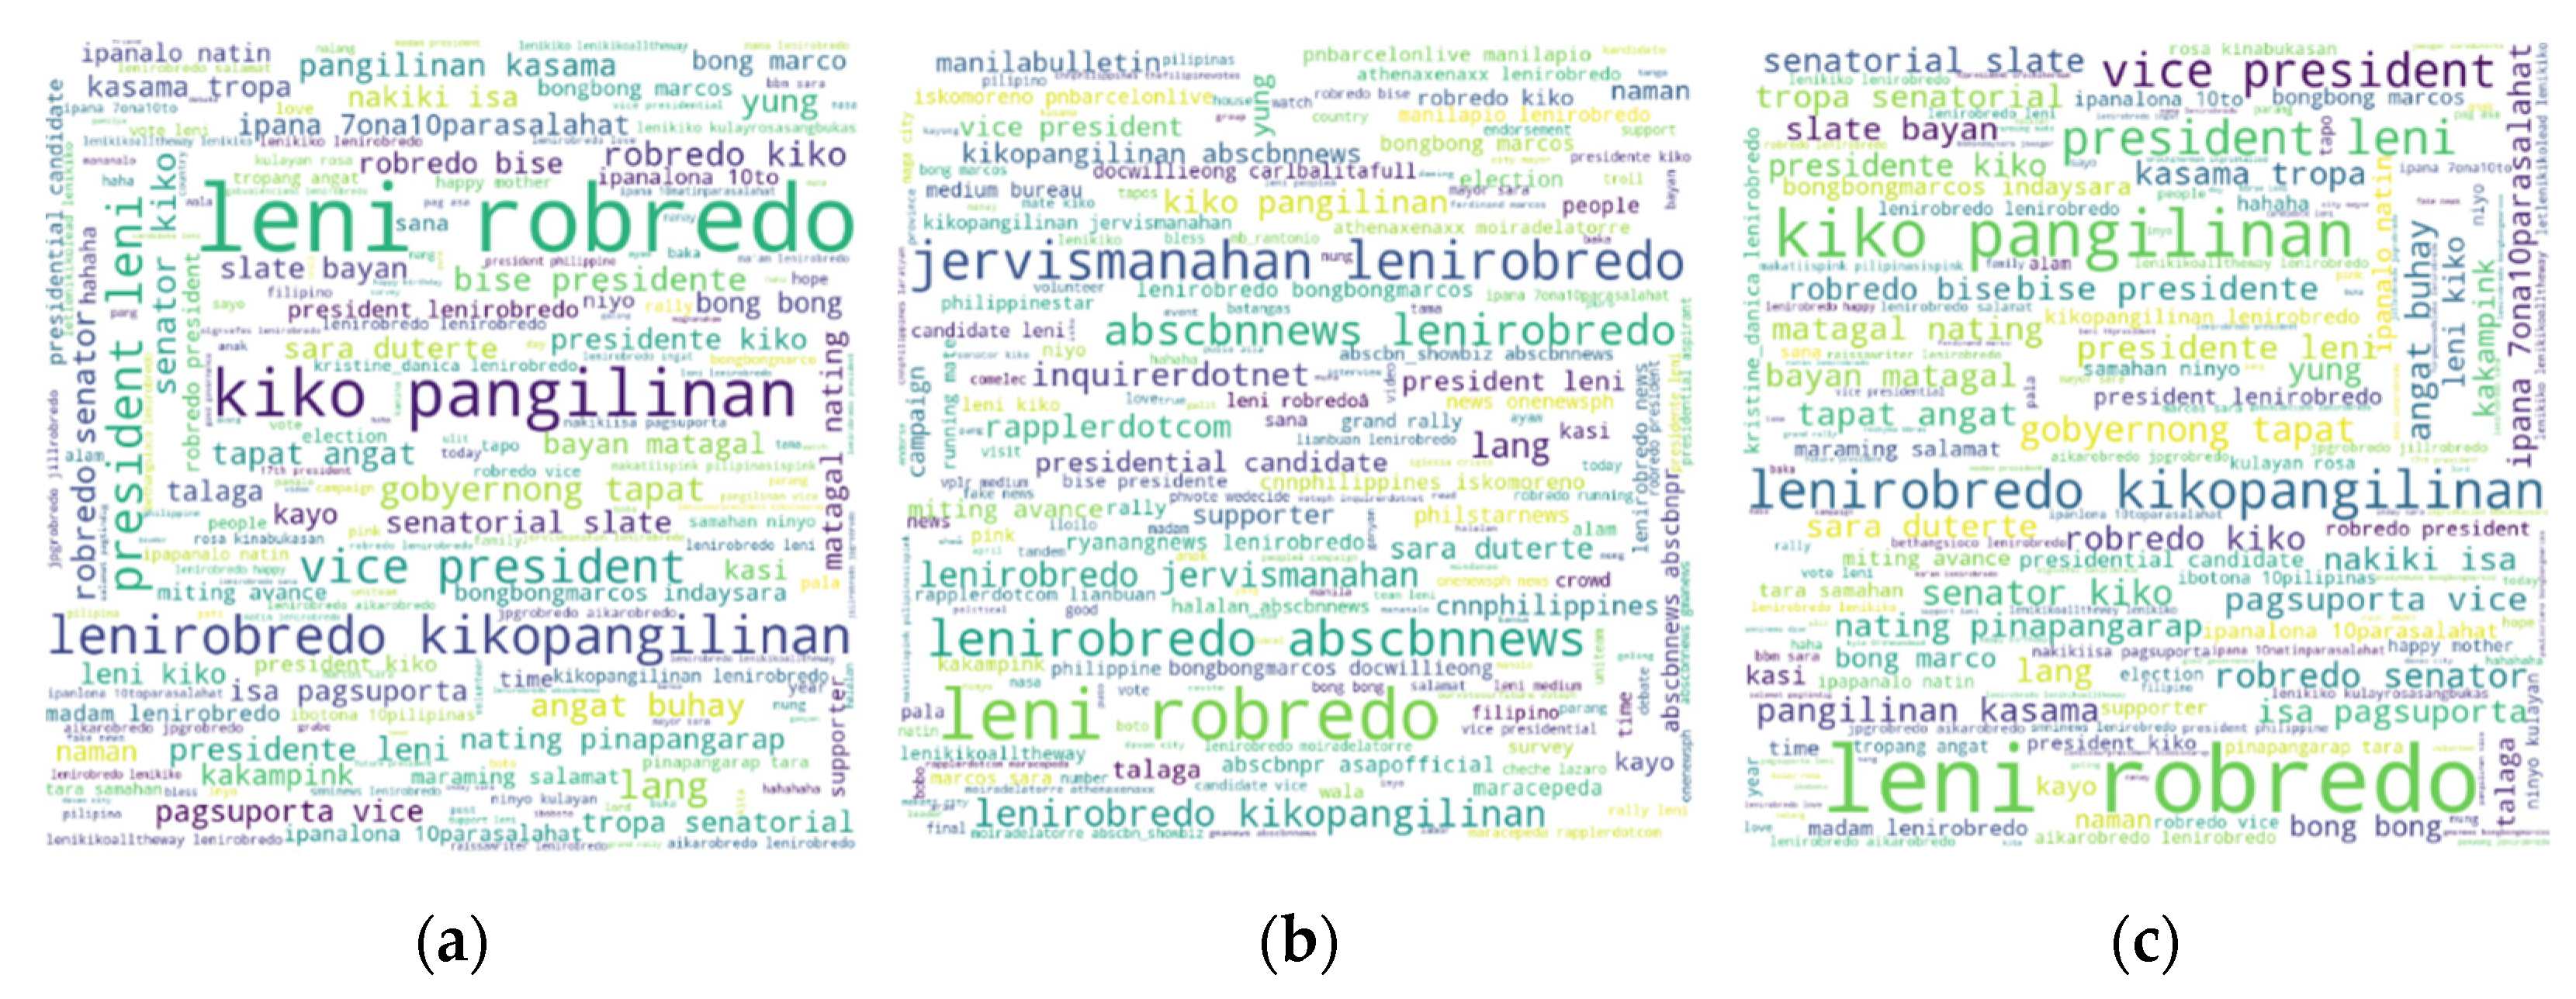
| Positive | Neutral | Negative | |||
|---|---|---|---|---|---|
| Word | Count | Word | Count | Word | Count |
| lenirobredo | 8579 | lenirobredo | 1770 | lenirobredo | 47,926 |
| leni | 8613 | abscbnnews | 1284 | leni | 29,432 |
| robredo | 4299 | leni | 970 | robredo | 22,153 |
| 2022 | 2717 | jervismanahan | 843 | 2022 | 15,995 |
| president | 2104 | robredo | 745 | president | 12,964 |
| kiko | 1715 | rapplerdotcom | 367 | bongbongmarcos | 11,628 |
| kikopangilinan | 1392 | inquirerdotnet | 316 | kiko | 10,979 |
| pangilinan | 1380 | cnnphilippines | 272 | pangilinan | 9530 |
| marcos | 1327 | kikopangilinan | 269 | kikopangilinan | 8990 |
| lenikiko | 1118 | president | 259 | marcos | 7036 |
Publisher’s Note: MDPI stays neutral with regard to jurisdictional claims in published maps and institutional affiliations. |
© 2022 by the authors. Licensee MDPI, Basel, Switzerland. This article is an open access article distributed under the terms and conditions of the Creative Commons Attribution (CC BY) license (https://creativecommons.org/licenses/by/4.0/).
Share and Cite
Macrohon, J.J.E.; Villavicencio, C.N.; Inbaraj, X.A.; Jeng, J.-H. A Semi-Supervised Approach to Sentiment Analysis of Tweets during the 2022 Philippine Presidential Election. Information 2022, 13, 484. https://doi.org/10.3390/info13100484
Macrohon JJE, Villavicencio CN, Inbaraj XA, Jeng J-H. A Semi-Supervised Approach to Sentiment Analysis of Tweets during the 2022 Philippine Presidential Election. Information. 2022; 13(10):484. https://doi.org/10.3390/info13100484
Chicago/Turabian StyleMacrohon, Julio Jerison E., Charlyn Nayve Villavicencio, X. Alphonse Inbaraj, and Jyh-Horng Jeng. 2022. "A Semi-Supervised Approach to Sentiment Analysis of Tweets during the 2022 Philippine Presidential Election" Information 13, no. 10: 484. https://doi.org/10.3390/info13100484
APA StyleMacrohon, J. J. E., Villavicencio, C. N., Inbaraj, X. A., & Jeng, J.-H. (2022). A Semi-Supervised Approach to Sentiment Analysis of Tweets during the 2022 Philippine Presidential Election. Information, 13(10), 484. https://doi.org/10.3390/info13100484