Abstract
In conditions of the stock market instability the art assets could be considered as an attractive investment. The fine art market is very heterogeneous which is featured by uniqueness of the goods, specific costs and risks, various peculiarities of functioning, different effects and, hence, needs special treatment. However, due to the diversity of the fine art market’s goods and the absence of the systematic information about the sales, researchers do not come to the same opinion about the merits of the art assets conducting studies on single segments of the market. We make an attempt to investigate attractiveness of the fine art market for investors. Extensive data was collected to obtain a complete pattern of the market analyzing it within different segments. We use the Heckman model in order to estimate the art asset return and find out the most influential factors of art price dynamics. Based on the estimates obtained we construct monthly art price index and compare it with S&P500 benchmark.
1. Introduction
Traditionally, the fine art market is supported by the interest from collectors, but the last 10 years’ buyers pay more attention to the profit to be obtained from investing in the art. Nowadays investing in the fine art is an alternative to the classical instruments of investment, especially, when the stock market falls (like in 2008). Thus, there is a certain class of the art market investors and funds shapes. Over the last ten years not only the structure of the art market participants has been changed, we can also observe the noticeable changes in taste preferences which cause new tendencies on the market. First of all, it is necessary to highlight the increase of sales on the fine art market. The world auction’s revenue has increased more than three times from $4.15 billion in 2005 to $15.2 billion in 2014. Such indicators as the number of million dollars lots and bought-in rate also indicate the positive trends on the market: in 2013 the number of million dollars sales achieved 1519 lots compared to 487 lots in 2005; the bought-in rate keeps the level of 30–35%. From the geographic point of view China has displaced the USA from the leader’s position despite the fact that the USA along with the UK have been predominating on the global fine art market for more than 50 years. The largest art sector is the modern art: it takes more than a half of the market in terms of revenue generated by public sales. However, over the last ten years the share of the postwar art has grown up from 15% to 26% due to the growth of popularity and prices for the art works in this sector. The postwar and contemporary art sectors should be considered as the most speculative ones, the price volatility attributed to these segments is the highest on the market according to the Artprice index (www.artprice.com). Impressionists’ works retire from the turnover steadily as well as old masters’ works which attracted attention last time in 2009 when auctions had reduced the supply of the contemporary art due to the crisis. As for the form of art works, the major part of lots sold are paintings. Besides, a significant amount of drawings sales is observed. Prices for the drawings rise along with the growth of popularity of Chinese art. The leaders among auctions are Christie’s and Sotheby’s, but their shares have decreased in the last decade due to the entrance of Chinese auctions on the fine art market. According to the Artprice rating of artists based on the total revenue generated by public sales of each artist’s work since 2009 the leaders on the market are modern artists: P. Picasso, M. Rothko, A. Giacometti, A. Modigliani, F. Bacon, W. de Kooning, F. Leger and others. Pablo Picasso unalterably takes the first position on the market podium. Every year there are more and more Chinese among the most prosperous artists: Qi Baishi, Zhang Daqian, Xu Beihong, Fu Baoshi, Zao Wou-Ki, Li Keran and others.
Almost all auctions, which operate on the fine art market, are “English” auctions. In an English auction the bidding starts at the minimum bid and then participants raise their bids. When the bidding stops, an item is knocked down at the hammer price. According to the game theory buyers will benefit if they raise the bid until the bid announced by the previous bidder. If the hammer price on an item is less than its reserve price which is set by the seller, the item goes unsold. The percentage of unsold items is called bought-in rate. Auctioneers and sellers keep the reserve price secret, and literature in this field still does not explain exactly such strategy. Some studies disclose reasons for such behavior [1,2], and others [3,4] provide evidence that it is not an optimal strategy [5]. The reserve price of items is considered to be a little bit less than their low auction’s estimation (about 70% of the low estimation). Among other researchers Ashenfelter and Graddy [6] proved this suggestion in 2011. The high and low estimations for each item are published in an auction’s presales catalogs. It is worth mentioning that both the theory and empirical studies confirm the rightfulness of these estimations. The auction house receives commissions from both the buyer and the seller. The buyer’s premium is 10–25% of the hammer price; it is one of the main instruments of competition between auction houses [7]. However, the buyer’s premium could be much smaller for the institutional investors. The seller’s commission varies from 5 to 10% of the sale price. This commission could be negotiable.
The fine art market would be characterized by certain effects. The unsold item is called burned, and some auction houses do not permit owners to sell such item immediately after the unsuccessful auction due to the belief that the failure of unsold items causes the price decrease. Beggs and Graddy [8] argue that an unsold artwork loses of its final price at re-selling. The effect of “masterpiece” implies that, as a rule, dealers recommend to buy one “masterpiece” for $100,000 than 10 art works for $10,000. However, this effect is doubtful, for example, Pesando [5] did not find any evidence supporting such opinion. There is also a hypothesis about an indirect impact of the stock market on the art market via the welfare of their players—the effect of “welfare” [9]. According to the anchoring effect, past prices or auctions estimations of the item could influence the buyer’s and seller’s perceptions of the real value of an item that is reflected in the sale and reserve prices respectively [10].
Several reasons maintain interest in the art market: acknowledgment of the social status by buying a luxury item like a painting, aesthetic pleasure, and acquisition of the potential investment asset. The self-value of artworks, the ability to give an aesthetic pleasure to the buyer as well as high transaction costs for acquisition and storage (auction’s commissions, transportation and storage costs, customs fee) along with the specific risks (theft, fire, forgery) are the factors which determine lower yield compared to securities. Some researchers hold this point of view revealing and explaining a lower return on the fine art market compared to the stock one [11,12]. On the other hand, another group of experts does not share this opinion and provide evidence of a relatively high art market return along with a moderate risk [13,14].
Obviously, empirical studies apply different methods of return assessing: some authors use direct price index construction [15], the second option is the hedonic method (HM) [11,13,16,17], someone prefers repeated sales method (RSM) [12,18,19,20,21]. However, the differences between the results presented in the studies are caused by original data rather than by differences between methods applied: even if researchers use the same time interval and the same methods but make estimation on different samples, inferences will vary because the art market is extremely heterogeneous. Thus this paper is aimed at conducting the analysis of art assets’ prices based on the most possible complete and comprehensive dataset on oil paintings as the representative fine art asset.
We collect information about oil paintings presented in auctions 2005–2015, since before 2005 the data provided is not complete. There are 536,660 observations in the sample. The following information for each observation in the sample was downloaded: information about the author (name, nationality, date of birth) and the auction (date, city, and lot number), individual characteristics of oil paintings (name, height, width, signature, exhibitions, references in literature), hammer price, low and high auction’s estimations. Along with mentioned characteristics we add other indicators such as sale in the capital, macroeconomic region, author’s nationality, art sector and artist’s rating according to Artprice, which, to the best of our knowledge, were not analyzed in the corresponding literature.
As an initial step toward understanding an overall situation on the art market we provide a detailed descriptive analysis identifying key trends on the market and demonstrating its structure. Further we estimate the hedonic art price index taking into account the problem of self-selection via Heckman selection model and compare it with S&P500 benchmark.
The main contribution of the paper is defining factors of oil paintings prices on the sample covering almost all public fine art auctions around the world. We embed self-selection bias correction in the estimation procedure by applying Heckman model for the price equation and add some new regressors.
2. Materials and Methods
2.1. Data and Descriptive Analysis
Data for the study has been collected from Artsalesindex.artinfo using MATLAB. Prices and auction’s estimations is adjusted for inflation based on CPI index.
In the descriptive analysis we focus on median prices rather than on average ones due to the fact that median prices are more informative in the case of the fine art market: from time to time paintings are sold for record prices, which biases the average prices. The descriptive analysis demonstrates the significant heterogeneity of the market, even considering only oil paintings: there is distinguished a small layer of 1–5% of “masterpieces” sold for millions dollars and other artworks the price of which is about only $10,000–50,000. This fact is illustrated in the box graph––Figure 1, which demonstrates a lot of outside values situated higher than upper adjacent value, especially, in 2012-year characterized by price records on the fine art market. A half of paintings, situated between higher and lower hinges, was sold for about $1000–60,000; median log price is closer to the 25th percentile. The box graph also reveals a tendency to increase of the price scattering over time reflected in the length growth of boxes and whiskers.
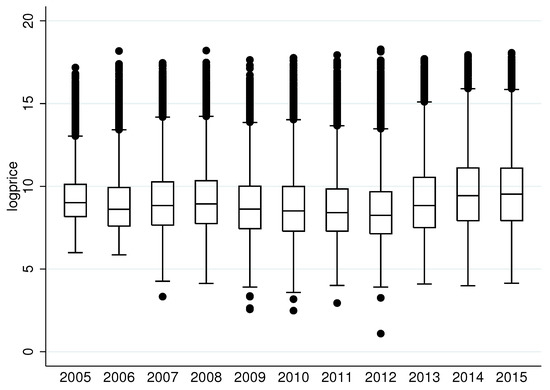
Figure 1.
Box plot for the price logarithm.
The heterogeneity of the art market is observed at the level of countries. According to the map (see Figure 2), the U.S.A. ($15,000 million) and the U.K ($5000 million) are leaders on the market; they accumulated the biggest revenue from the public auctions for the 11 years. Apart from the USA and the UK, France and Italy cross a threshold revenue $1000 million. Such observations do not comply with a market trend regarding an important role of China. However, as we consider only oil paintings, not typical art for the Chinese, their works are represented in the sample by a small number of lots.
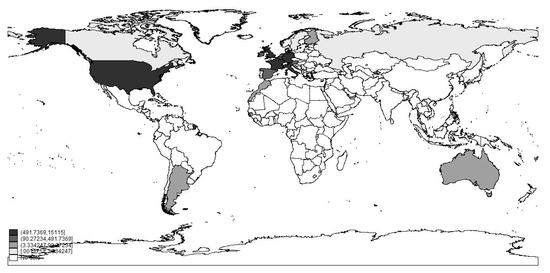
Figure 2.
Map of auction’s revenue distribution among countries.
The major part of the art market belongs to European artists: 422,988 of 536,660 observations are European artworks. American artists are represented in the sample by 70,631 paintings. The third place goes to Russian authors −17,649 observations, remaining 25,392 artworks are distributed among Australian, Asian, Arabs, Africans and Latin Americans artists. Figure 3 and Figure 4 represent the bought-in rate and median/average price of paintings by the artist’s nationality. The demand for Americans paintings seems to be high enough as the bought-in rate attributed to their artworks is relatively low, the moderate median price indicates a possible affordability of their paintings on the market, the highest average price reflects a big price range for the American art; apparently, relatively low bought-in rates along with high median prices of Arabs, Asian and Latin American paintings could reveal a certain fashion for such art; according to the indicators, we also assume, that the market of European art be over-saturated, and Russian paintings be overestimated.
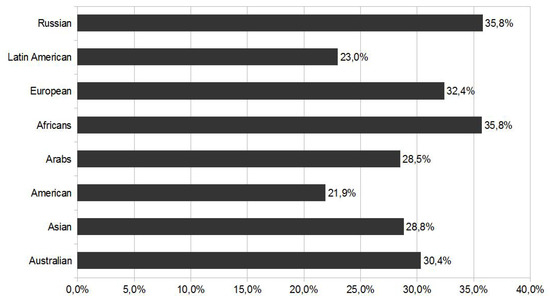
Figure 3.
Share of bought-in paintings by the artist’s nationality.
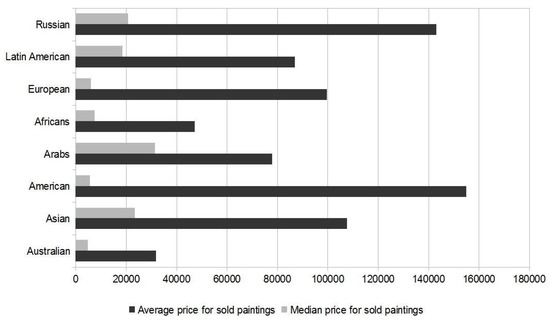
Figure 4.
Distribution of prices by the artist’s nationality.
The structure of the fine art market has not changed too much over 11 years. The pie chart (Figure 5) demonstrates the structure of our sample by the art sectors. The predominance of the modern art complies with the key art trend described above. According to the histograms represented on Figure 6, younger art is priced lower. We would like to point out that the financial crisis has affected the art market: the recession lasted from 2008 to 2012; especially, the contemporary art has been affected by the downturn as the most speculative art sector. The price dynamics supports a tendency to the higher volatility on the market. The evidence is provided by Figure A1 in the Appendix A.
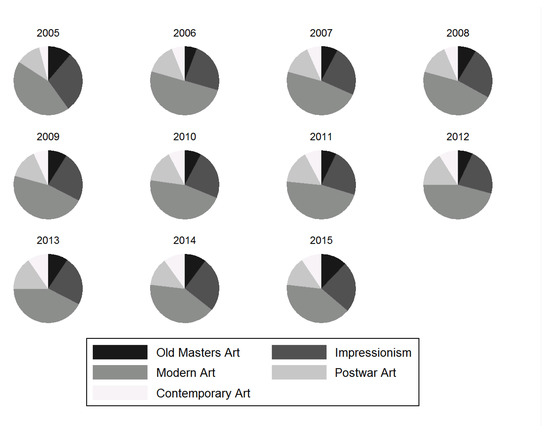
Figure 5.
Shares of sectors by year.
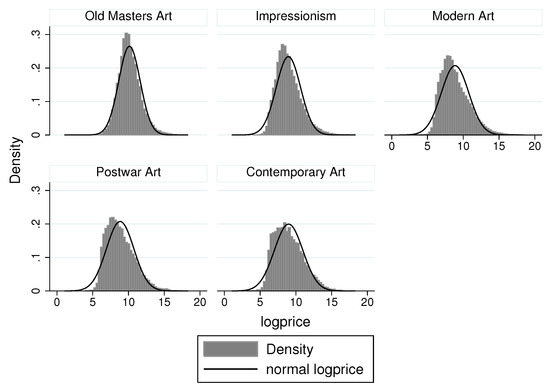
Figure 6.
Histograms of price logarithm by sectors.
2.2. Empirical Model
In this paper we exploit the hedonic approach by means of the Heckman model with sample selection. Despite having a big sample, most observations represent non-repeated sales. Thus, we have chosen the HM instead of RSM in order to avoid discarding the major part of observations. Moreover, the both methodologies bring to the similar results. Finally, Bocart and Hafner [22] in their recent study assume that the hedonic regression framework is an appropriate tool for analyzing heterogeneous goods.
An assumption under the hedonic methodology implies that an individual optimizes the consumption of the product’s characteristics choosing a product with an optimal set of parameters subject to a budget constrain. It means that his choice depends on the income and implicit “prices” of the characteristics, which are estimations of differences between item’s qualities in value terms.
We use the Heckman model, sometimes called Tobit I model, in order to estimate the return because it allows getting rid of biases caused by the fact that in the sample there are some unsold paintings whose hammer prices did not reach their reserve ones. Therefore, we should also consider the probability of sale. Including unsold paintings in the sample is necessary because it allows verifying an importance of the sample selection accounting and getting a more reliable hedonic index. The model to be estimated is presented in (1).
The first equation demonstrates the impact on the logarithm of the sale price of both individual characteristics of oil paintings fixed in time and time varying (, are the vectors of such characteristics respectively), and the influence of time trend characterized by the sum of dummy-variables () constructed for each year/month. The second binary-choice equation is subject to explain the sample selection procedure as the dependent variable () takes 1 if a painting was sold and 0—otherwise. The vectors of individual characteristics in the second equation could differ from the vectors in the first one.
As we have already mentioned, the art market is very heterogeneous at the price level as well as at the sector level. Hence, we estimated the model for each art sector separately.
3. Results
We estimate the Heckman model for each sector on the fine art market. The results for (1a) are shown in Table 1.

Table 1.
The results for oil paintings hedonic art price index model, (1a). The dependent variable is the logarithm of the painting price. We estimate separate equations for each of five art sectors, namely Old masters, Impressionism, Modern art, Postwar art and Contemporary art. Coefficient t-statistics are in parenthesis. Level of significance: *—5%, **—1%, ***—0.1%.
Almost all coefficients in the equation are significant and have expected signs except for the coefficient “author’s signature”, whose negative sign does not comply with theoretical promises. It could be caused by the situation when a painting without any signature is a rare or unusual (atypical) work of an artist which is evaluated at a higher price. We observe high difference between the values of coefficients between sectors. The highest contribution to the explanation of price logarithm is provided by the author’s popularity. If an author falls in the top of 100 best artists according to the Artprice review, the price for his artworks will be almost three times higher than for other paintings compared with the author’s who is not presented in the rating. The same thing can be seen with the top 500. Moreover, the younger the art sector is the higher coefficient values are attributed to these two variables. Also, it should be mentioned that the price increases as a consequence of paintings publications in the literature, exhibitions, sales in the second and fourth quarters in comparison with the first quarter and sales in a capital. Contemporary paintings are sold better among American artists in comparison with Europeans; on the other hand, the price of old American masters artworks is lower. Russian nationality of artists contributes to the higher sale price except for the Contemporary art. According to the negative signs of coefficients of dummy variables for years 2009–2013 the financial crisis of 2008–2009 had impact on the fine art market. In 2009–2013 the log price was 30% lower on average than in 2007. The contemporary art market has been affected by the crisis most of all.
Further, we estimated an extended specification of the model in order to obtain a monthly hedonic index. In particular, we added dummy variables for each month of the period 2007–2015 (a basic variable is January of 2007). We consider the results obtained by estimating the model on the full sample and on a restricted one, which contains only oil paintings under $10,000. The variance of the index is too high even if we impose restrictions on paintings under $10,000. As an example, we present the art price index dynamics in comparison with S&P500 index for the largest sector—the modern art (Figure 7); the indexes constructed for other sectors demonstrate the similar behavior.
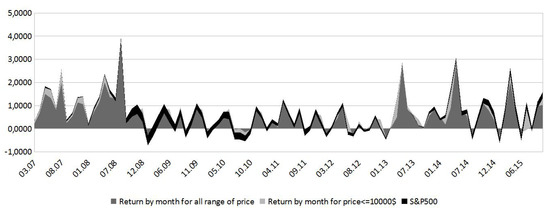
Figure 7.
Cumulative dynamics of the art price index for the modern art.
It should be noted that we use different sets of explaining variables for different art sectors as robustness check and due to the low variation of some regressors (dummy-variables for the author’s nationality and the region of sales) with respect to the relatively small number of observations in some sectors (old masters, impressionism and contemporary art) we suppose that coefficients variances associated with such variables could be overestimated.
4. Discussion and Conclusions
In this paper we focus on oil paintings as the most representative product on the art market, the period of observation is 2005–2015. The data analysis confirms the high level of heterogeneity even upon consideration of oil paintings only. The analysis indicates that the non-uniformity of the market is observed at the countries level and across artists’ nationalities; parameters considered in the study demonstrate a different behavior at the art sectors level; we could also provide evidence of the 2008 crisis impact on the art market.
The comparison with S&P500 shows that the US market index is outperformed by the art price index during the periods of negative returns. Consequently, oil paintings can serve as a “safe haven” asset, which is in line with [23], who show that between 2000 and 2015 art assets do not underperform the market.
For art price index, estimated on broad sample, the average return is about 1% above inflation, which substantially lower, than for some fast growing fine art markets such as Russia, India and China [24]. For more details on art price returns in different countries see [25].
The negative impact of 2008 crises on oil painting prices is supported by the estimation results. During four years after the crisis the coefficients of the corresponding variables are significant and negative and the contemporary art market incurred the highest losses from the crisis.
The study reveals that the sample selection model allows understanding factors that drives art prices, taking into account the bias caused by the presence of unsold paintings. There are at least four factors that have the highest influence on oil paintings prices and, as a result are most important for the investors—the author’s popularity, the novelty of the art sector, mentioning the painting in literature and taking part in exhibitions.
Besides, the works of Russian artists get higher sale price for all sectors except Contemporary art, in opposite to Americans, who have negative price increment in Old Masters sector. The other nationalities have significant and positive coefficients.
The findings of the paper also include the quadratic relation between the size of the paintings and its price, meaning that there is some “optimal” size of the canvas, for which the highest price is given.
To sum up, we investigate factors that influence the pricing of oil paintings on the broad worldwide sample. The results of this analysis could be applied by buyers, as well as sellers of the art assets, while making a decision on the transaction.
The study can be improved by addressing the possible issues of endogeneity, adding more characteristics, describing both the artist and the paintings and examining the long-run dynamics and cointegration of fine art market sectors similarly to [26]. It’d be interesting to continue the work by adding a survival model in order to see how the time of sale affects the price.
Author Contributions
Conceptualization, L.L. and A.Z.; methodology, L.L.; software, A.Z.; validation, L.L. and V.L.; formal analysis, A.Z.; investigation, A.Z., V.L. and L.L.; resources, A.Z.; writing—original draft preparation, A.Z. and L.L.; writing—review and editing, V.L.; visualization, V.L.; supervision, V.L. All authors have read and agreed to the published version of the manuscript.
Funding
This research received no external funding.
Conflicts of Interest
The authors declare no conflict of interest.
Appendix A
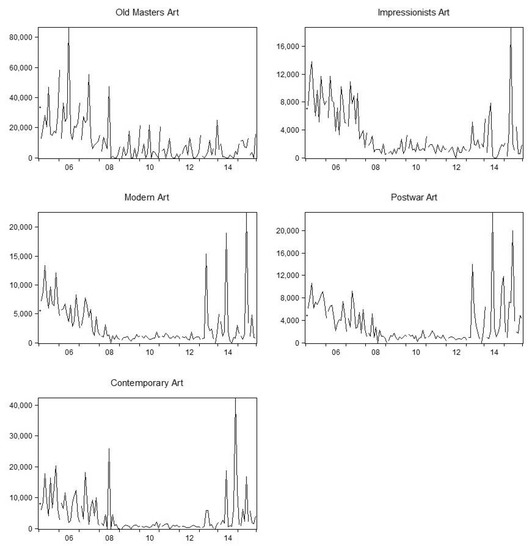
Figure A1.
Dynamics of prices by sectors.
References
- Ashenfelter, O. How auctions work for wine and art. J. Econ. Perspect. 1989, 3, 23–36. [Google Scholar] [CrossRef]
- Horstmann, I.; LaCasse, C. Secret reserve prices in a bidding model with a real option. Am. Econ. Rev. 1997, 87, 663–684. [Google Scholar]
- Milgrom, P.; Weber, R. A theory of auctions and competitive bidding. Econometrica 1982, 50, 1089–1122. [Google Scholar] [CrossRef]
- Vincent, D. Bidding off the wall: Why reserve prices may be kept secret. J. Econ. Theory 1995, 65, 575–584. [Google Scholar] [CrossRef]
- Pesando, J. Art as an investment. The market for modern prints. Am. Econ. Rev. 1993, 83, 1075–1089. [Google Scholar]
- Ashenfelter, O.; Graddy, K. Sale Rates and Price Movements in Art Auctions; Technical Report, Working Papers; Princeton University: Princeton, NJ, USA, 2011. [Google Scholar]
- Ashenfelter, O.; Graddy, K. Art Auctions: A Survey of Empirical Studies; Technical Report, NBER Working Paper Series; Economic Policy Research: London, UK, 2002. [Google Scholar]
- Beggs, A.; Graddy, K. Failure to Meet the Reserve Price: The Impact on Returns to Art; Technical Report, Discussion Paper Series; Springer: Oxford, UK, 2006. [Google Scholar]
- Goetzmann, W.; Renneboog, L.; Spaenjers, C. Art and Money. Am. Econ. Rev. 2011, 101, 222–226. [Google Scholar] [CrossRef]
- Beggs, A.; Graddy, K. Anchoring effects: Evidence from art auctions. Econ. Rev. 2009, 99, 1027–1039. [Google Scholar] [CrossRef]
- Agnello, R. Investment returns and risk for art: Evidence from auctions of American paintings. East. Econ. J. 2002, 28, 443–463. [Google Scholar]
- Pesando, J.E.; Shum, P.M. The auction market for modern prints: Confirmations, contradictions, and new puzzles. Econ. Inq. 2008, 46, 149–159. [Google Scholar] [CrossRef]
- Chanel, O.; Gerard-Varet, L.A.; Ginsburgh, V. Prices and Returns on Paintings: An Exercise on How to Price the Priceless. Geneva Pap. Risk Insur. Theory 1994, 19, 7–21. [Google Scholar] [CrossRef]
- Mei, J.; Moses, M. Art as an investment and the underperformance of masterpieces. Am. Econ. Rev. 2002, 92, 1656–1668. [Google Scholar] [CrossRef]
- Candela, G.; Figini, P.; Scorcu, A.E. Price indices for artists—A proposal. J. Cult. Econ. 2004, 28, 285–302. [Google Scholar] [CrossRef][Green Version]
- Buelens, N.; Ginsburgh, V. Revisiting Baumol’s ‘art as floating crap game’. Eur. Econ. Rev. 1993, 37, 1351–1371. [Google Scholar] [CrossRef]
- Collins, A.; Scorcu, A.E.; Zanola, R. Sample Selection Bias and Time Instability of Hedonic Art Price Indexes; Technical Report, Working Paper DSE; Dipartimento Scienze Economiche, Universita’ di Bologna: Bologna, Italy, 2007. [Google Scholar]
- Baumol, W. Unnatural value: Or art investment as a floating crap game. Am. Econ. Rev. 1986, 76, 10–14. [Google Scholar] [CrossRef]
- Francke, M.K. Repeat sales index for thin markets: A structural time series approach. J. Real Estate Financ. Econ. 2010, 41, 24–52. [Google Scholar] [CrossRef]
- Graddy, K.; Hamilton, J.; Pownall, R. Repeat-sales indexes: Estimation without assuming that errors in asset returns are independently distributed. Real Estate Econ. 2012, 40, 131–166. [Google Scholar] [CrossRef]
- Goetzmann, W. Accounting for taste: Art and financial markets over three centuries. Am. Econ. Rev. 1993, 83, 1370–1376. [Google Scholar]
- Bocart, F.Y.R.P.; Hafner, C.M. Volatility of price indices for heterogeneous goods with application to the fine art market. J. Appl. Econom. 2015, 30, 291–312. [Google Scholar] [CrossRef]
- Shi, Y.; Conroy, P.; Wang, M.; Dang, C. The investment performance of art in mainland China. Emerg. Mark. Financ. Trade 2018, 54, 1358–1374. [Google Scholar] [CrossRef]
- Kraeussl, R.; Logher, R. Emerging art markets. Emerg. Mark. Rev. 2010, 11, 301–318. [Google Scholar] [CrossRef]
- Garay, U. Determinants of art prices and performance by movements: Long-run evidence from an emerging market. J. Bus. Res. 2019. [Google Scholar] [CrossRef]
- Le Fur, E. Dynamics of the global fine art market prices. Q. Rev. Econ. Financ. 2019. [Google Scholar] [CrossRef]
© 2020 by the authors. Licensee MDPI, Basel, Switzerland. This article is an open access article distributed under the terms and conditions of the Creative Commons Attribution (CC BY) license (http://creativecommons.org/licenses/by/4.0/).