You are currently viewing a new version of our website. To view the old version click .
Information
  • Article
  • Open Access

23 November 2019

A Study on Trend Analysis of Applicants Based on Patent Classification Systems

and
Department of Software Convergence Engineering, Kunsan National University, Gunsan-si 54150, Korea
*
Author to whom correspondence should be addressed.
This article belongs to the Special Issue Advances in Knowledge Graph and Data Science

Abstract

In recent times, with the development of science and technology, new technologies have been rapidly emerging, and innovators are making efforts to acquire intellectual property rights to preserve their competitive advantage as well as to enhance innovative competitiveness. As a result, the number of patents being acquired increases exponentially every year, and the social and economic ripple effects of developed technologies are also increasing. Now, innovators are focusing on evaluating existing technologies to develop more valuable ones. However, existing patent analysis studies mainly focus on discovering core technologies amongst the technologies derived from patents or analyzing trend changes for specific techniques; the analysis of innovators who develop such core technologies is insufficient. In this paper, we propose a model for analyzing the technical inventions of applicants based on patent classification systems such as international patent classification (IPC) and cooperative patent classification (CPC). Through the proposed model, the common invention patterns of applicants are extracted and used to analyze their technical inventions. The proposed model shows that patent classification systems can be used to extract the trends in applicants’ technological inventions and to track changes in their innovative patterns.

1. Introduction

In the era of the Fourth Industrial Revolution, new technologies are rapidly being invented, and inventors are making significant efforts to claim rights to sources and core technologies [1,2]. Among the various forms of intellectual property rights, patent literature typically includes the rights of the applicant’s core or base techniques to allow a company or inventor to claim rights to the technologies. Therefore, studies are being conducted to extract key technologies through mining and analysis of the terms specified in the patent documents [3,4,5]. These studies focused on the extraction of patented technical terms using natural language processing and text mining techniques, but because patents guarantee novelty and inventiveness to the rights of the technology, the vocabulary used in these documents generally consists of newly defined terms or similar alternative terms. Thus, the recall rate is low when searching for technology terms from patents.
As the number of patent applications gradually increased, the international patent classification (IPC) was developed in 1968 due to the necessity of classifying patents by various domains [6]. The IPC is composed of five levels—sections, classes, subclasses, main groups, and subgroups—and classifies domains of technologies included in each patent. Therefore, a patent containing various technologies may include multiple classification system codes corresponding to each technology. This classification system can be used to search for prior patents for the evaluation of patent novelty and progress, improve the accessibility of technology and rights information, or contribute to producing basic statistical data. However, with the recent increase in the speed of technology development, new technologies or more detailed element technologies are actively developed, and the effectiveness of the search results using the classification system is decreasing. In addition, it was difficult to extract statistical information reflecting the trend of technological development. Therefore, the EU and the US Patent Office have proposed a new classification system, cooperative patent classification (CPC), to improve the retrieval performance and classification accuracy of patent documents. Although the international patent classification (IPC) system has already been defined for patent classification, it has limitations in terms of the classification of novel technologies as well as detailed classifications. CPC, on the other hand, includes a new domain (Y-section), which allows a broader, more comprehensive range of technology classifications than the IPC, including over 260,000 detailed taxonomies. Additionally, since 2013, CPC codes have been given to patents granted in the EU, the United States, and the Republic of Korea. Therefore, the CPC system plays a vital role in global patent analysis and many studies have been conducted to analyze the trend of technology invention by applying the CPC classification system, not IPC. However, the CPC-based studies replaced the IPC classification scheme and are conducted for similar purposes as the existing IPC-based studies. As a result, based on the CPC classification system, researches such as extracting representative technologies from patents or analyzing trends have been conducted, and these existing studies mainly focus on analyzing the impact of technology from a technology perspective. However, the patent is one of the intellectual property rights invented by an applicant, and its rights are maintained, and it is possible to perform various analyses on the applicant based on the patents invented by the applicant.
Therefore, in this study, we proposes a method of analyzing the applicant’s invention trend using IPC and CPC classification systems for analyzing the applicant’s technical invention trend based on common technology-invention patterns derived from each applicant. Also, the proposed model can help to analyze whether the new technology has been expanded and propagated by comparing the applicant’s technical inventions with the existing applicant’s technologies and conducting a case study on changes in the invention patterns of applicants based on the representative technologies. Since the proposed method can analyze the applicants using codes representing the classification systems, the text preprocessing necessary in the existing text mining method can be omitted, and it is also applicable to the analysis of the multinational applicants. The composition of this paper is as follows. Section 2 discusses the limitations of previous research and the necessity of the proposed approach. In Section 3, a method to extract patented invention trends based on the proposed model is described. The results of a case analysis of an applicant based on the proposed model are presented in Section 4, and conclusions and future work are discussed in Section 5.

3. Proposed Model

The proposed model for analyzing trends in the invention of applicants consists of four steps, as shown in Figure 1. The first is to collect patent data and extract the desired information from it. We acquire raw data using OpenAPI from the Korea Intellectual Property Rights Information Service (KIPRIS), which provides information on patents invented in the Republic of Korea. Patent metadata and specific information such as the title, claim, abstract, invention date, and publication date are extracted from patent documents. In the second step, patent data are clustered based on time-series information (date of invention, year of publication) for the applicant’s invention trend analysis. In the third step, a representative tree of each patent is created using the tree structure of patent classification systems as shown in Table 1. In the fourth step, common patterns are extracted from the experimental data using the IPC and CPC systems as shown in Table 2. Finally, the representative technology classification codes are extracted based on the common patterns of the applicants. After that, the trends of patent inventions are analyzed and compared for various applicants, including universities, companies, and research institutes.
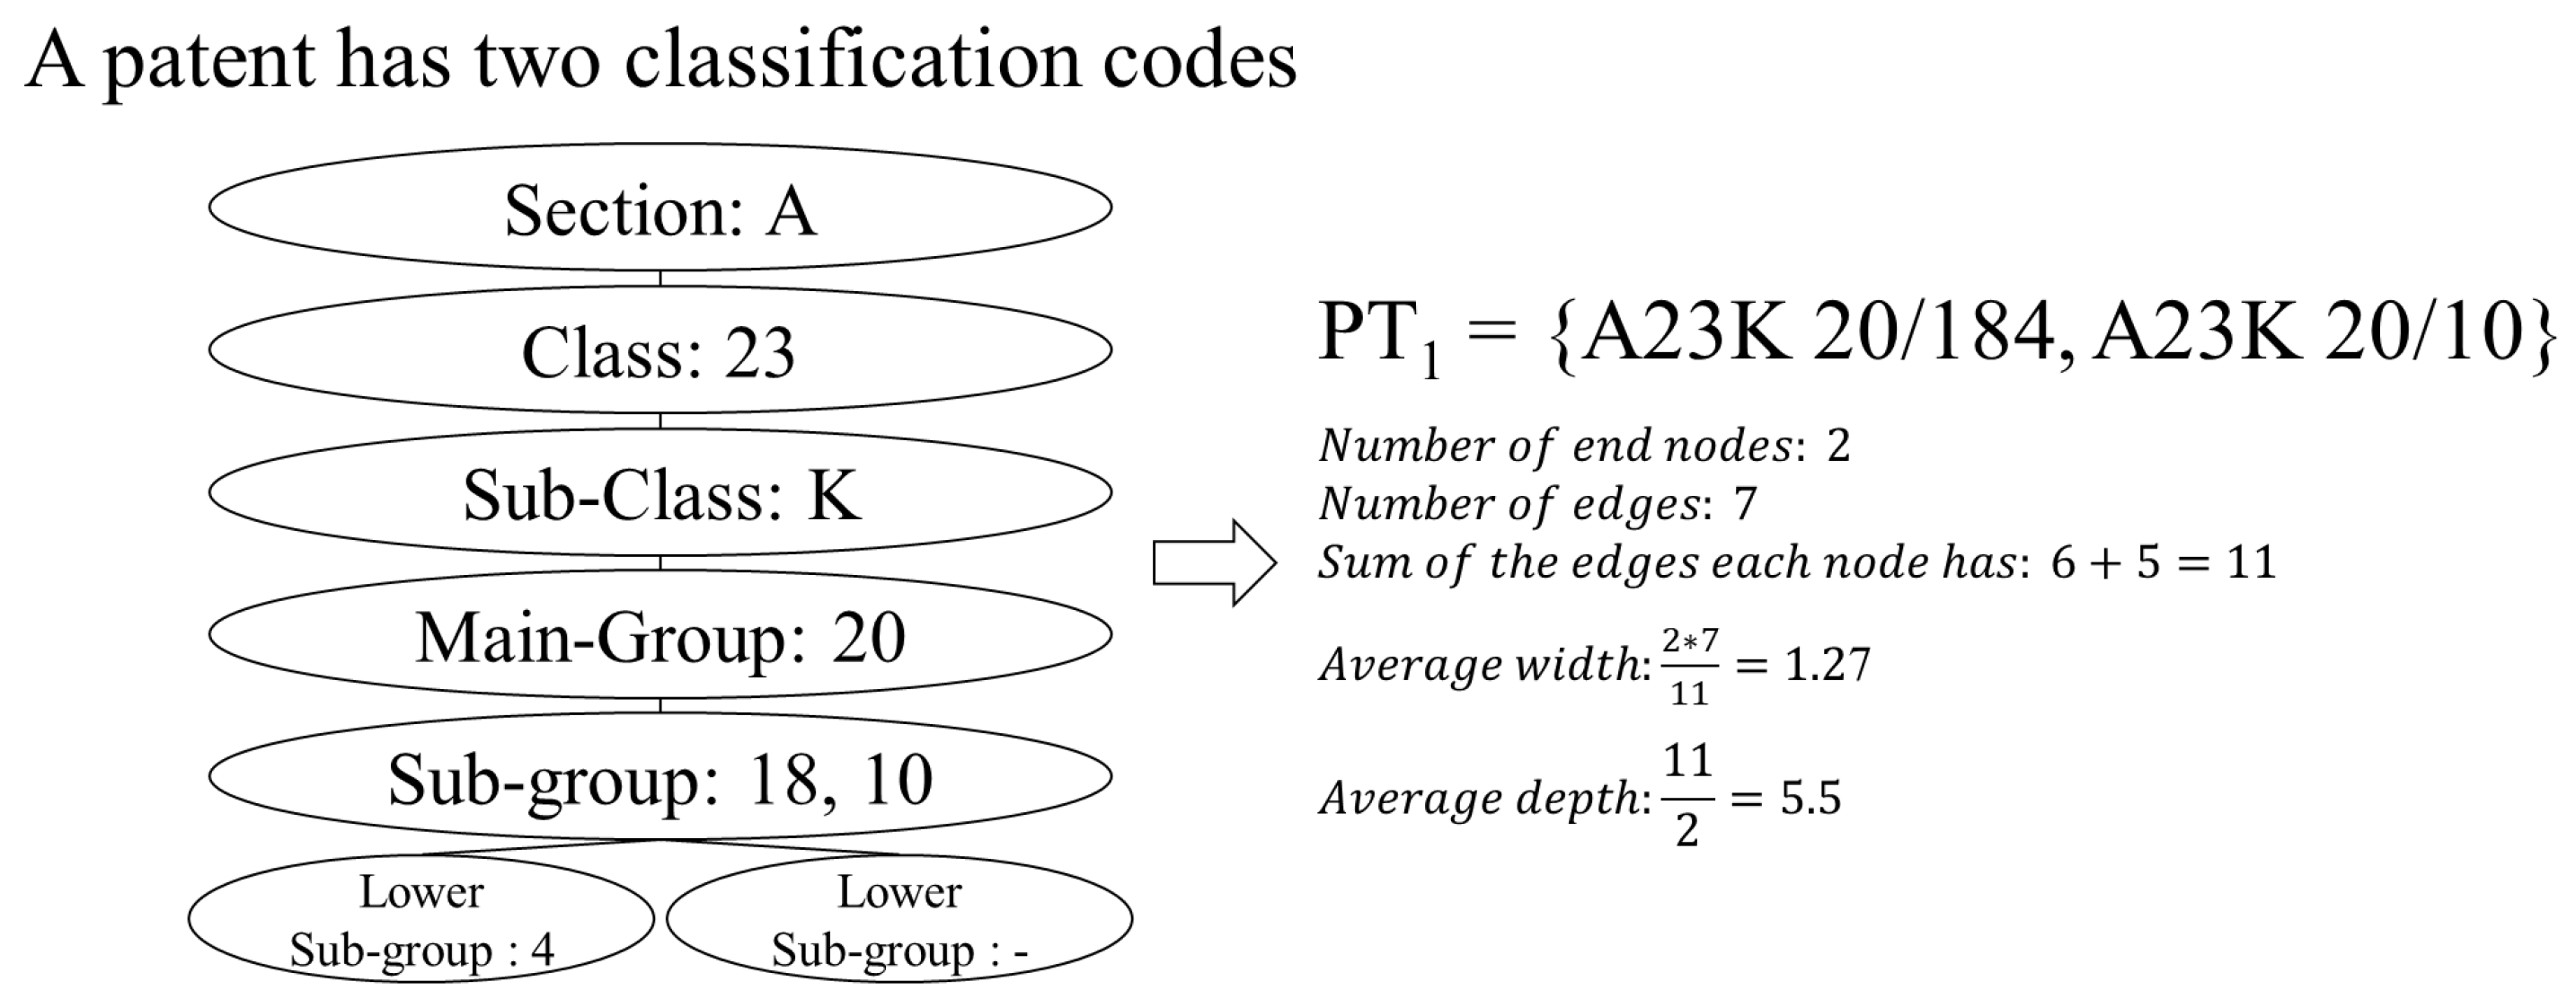
Figure 1. Overall process for analyzing patterns of inventors.
Table 1. Structure of a patent classification code.
Table 2. Definitions of four common patterns (S, T, E, I).
As shown in Figure 2, a patent can contain different classification system codes, and based on their hierarchical structure, these codes can be integrated and merged into a representative tree for the patent, which can, in turn, be used to compare the classification system codes between the patents and thus extract the applicant’s technical invention patterns. Table 2 shows common patterns that can be extracted from the compared patents using the representative tree derived from each patent.
Figure 2. Tree structure of a patent that has two classification codes.
Based on the common patterns defined in Table 2, the patents of applicants were grouped by year, and two compared patents were paired. After that, a patent invented in a specific T year was defined as a prior patent (PP), and a subsequent patent invented in a T + n year was defined as the following patent (FP). The proposed model determined whether the applicant had continued to build on specific techniques persistence or to invent novel techniques novelty. Persistence was divided into three patterns: sameAS (S), transition (T) and expansion (E), and novelty was defined as the independent (I) pattern. It implied that some technologies included in the prior patent appeared in the following patent; essentially, the technology classification code representing the technology was continuously included in the FP as well as the PP. First, the transition pattern showed that some technologies at the sub-group level included in the PP reappeared in FP, indicating that some of the technologies in PP had propagated and influenced the invention of FP. Second, the expansion pattern showed that some technologies at the main-group level emerged with other domain disciplines in the FP; that is, the existing element or common technologies integrated and converged with technologies from other fields. Novelty represented FP with technologies in a completely different field than PP and was defined by an independent pattern. Therefore, FP indicated a case in which the classification code was completely different, or only some of the class level technologies were included from PP. 
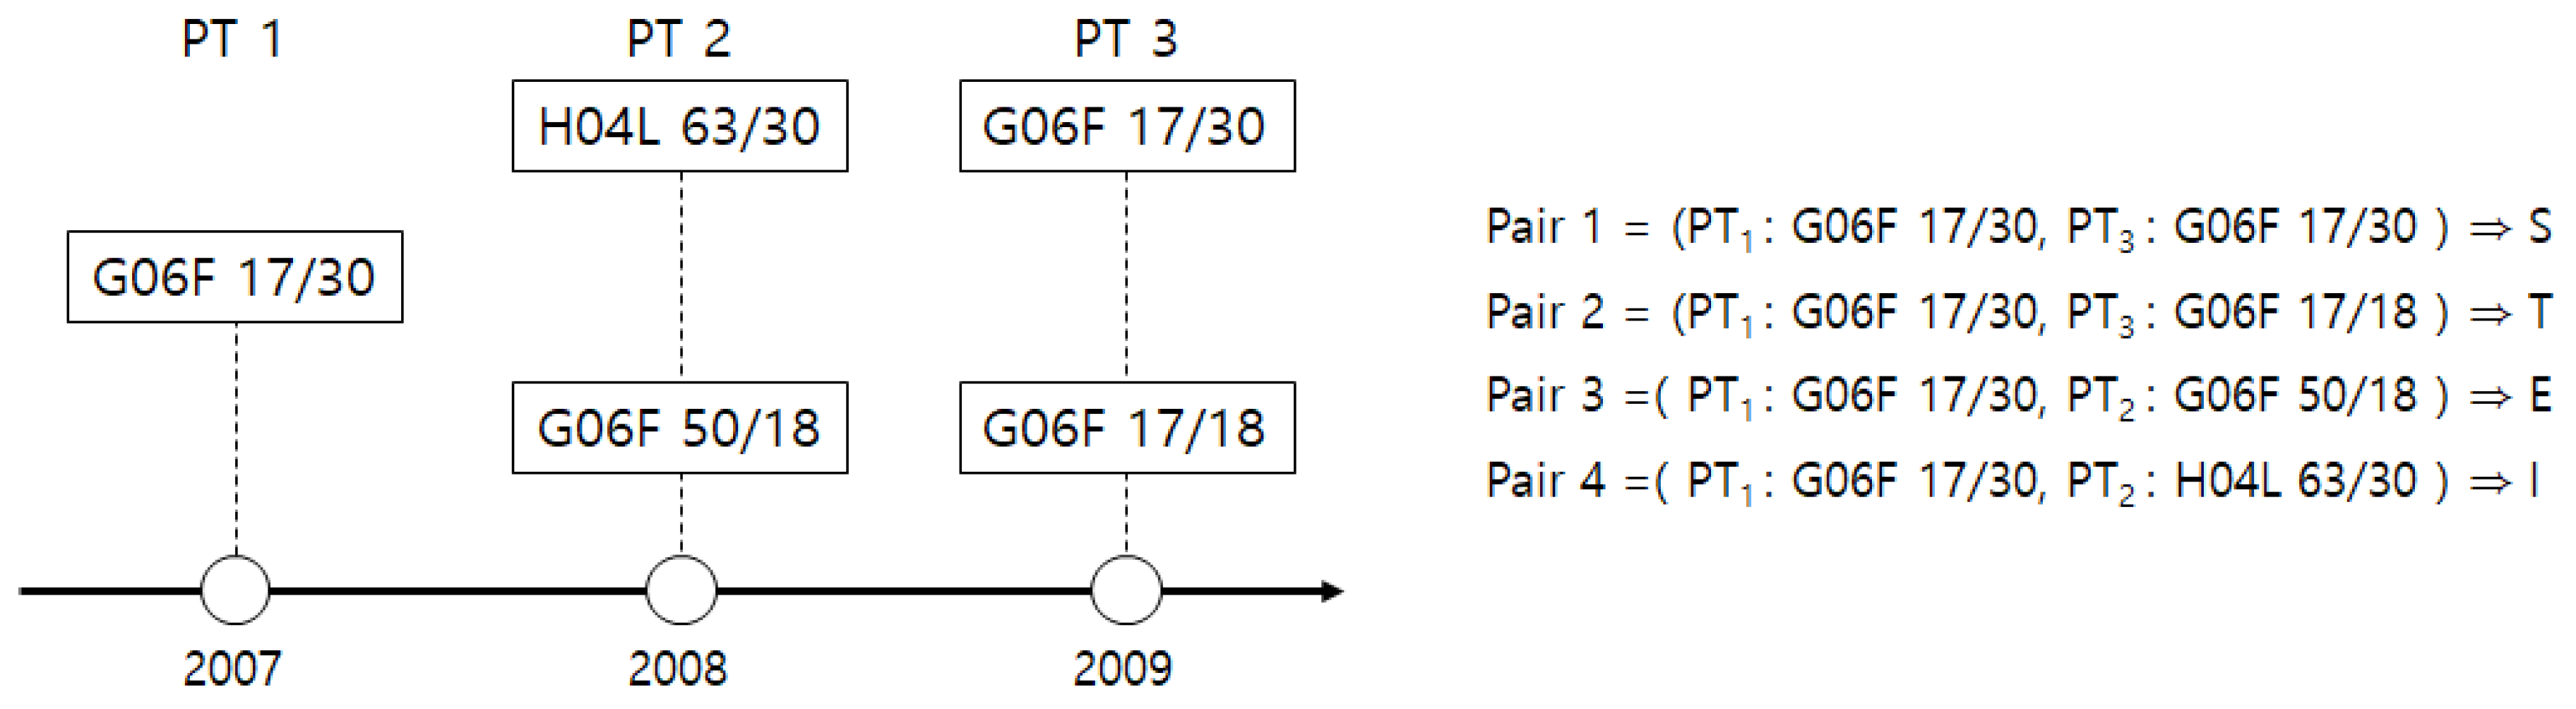
Figure 3 shows a concrete example for depicting common patterns. There were three patents invented in different years; P T 1 contained one classification code, and P T 2 and P T 3 each contained two classification codes. In this case, a total of eight comparison pairs were generated, and in order to compare patent documents, a tree structure was created representing each patent based on its classification codes. In the first comparison pair consisting of P T 1 and P T 3 , P T 1 may be expressed as PP, and P T 3 may be expressed as FP. Because FP contained the complete classification code of PP, the comparison pair was determined to be the same pattern (S). In this manner, the classification codes of the comparison pairs composed of PP and FP were compared to determine the second comparison pair as the transition pattern (T) and the third as the expansion pattern (E), thereby extracting patterns related to the persistence of the patent invention. For the last comparison pair, PP and FP did not have a common classification code, and therefore, the pair was determined to be independent (I) and used as a novelty pattern.
Figure 3. Example pairs with common patterns (S, E, T, I) extracted from each patent.

4. Experiment

KIPRIS provided a database of information on domestic and foreign intellectual property rights, providing open API or bulk files. In this study, the patent information (application number, publication date, abstract, claims, IPC and CPC) of the applicant was collected by using the Open API to analyze the trend in the applicant’s technical inventions based on the proposed model. The patent invention trend selected three different domains (university, company, and research institute) based on the assumption that the respective characteristics of the applicant type would be different and selected three applicants from each domain, making a total of nine. Also, to analyze the applicants’ technical invention trends over the last ten years (2007–2016), the relevant information on their inventions and published patents were collected from KIPRIS. Table 3 shows tree structure information constructed using collected applicant-specific patent data. To do this, we created an applicant-based taxonomy tree using the hierarchical structure of each taxonomy (IPC and CPC) included in the patent and show the average depth and width of the tree. It could be seen that based on the average depth, the difference between the IPC and CPC was not significant, but based on the average width, the CPC was more comprehensive than the IPC. Thus, it was shown that the CPC classification code could represent more types of technical fields than the IPC, which could be understood in the same context as the reason for the development of the CPC despite the prior existence of the IPC. Based on the model proposed in this paper, the collected data were refined for comparative analysis. In addition, through the proposed method, only the patents with both IPC and CPC codes were constructed as experimental data to compare the characteristics of IPC and CPC systems. Table 4 shows the number of collected and purified data by the applicant. In order to analyze the applicant’s technical invention trend based on the purified data, a comparison pair wes generated based on the publication year, and the common patterns same (S), transition (T), expansion (E), and independent (I) were extracted.
Table 3. Average width and average depth of each applicant based on the tree hierarchy.
Table 4. Number of refined international patent classification (IPC) and cooperative patent classification (CPC) codes derived from patents of each applicants.
Table 4 shows the results of the three applicants representing the company domain. They were seen to have significantly higher (E) patterns than (T) patterns. Also, companies had more (S) patterns than the research group. It means that companies focused on the expansion of existing technologies and the development of related technologies more than research institutes.
Table 5, Table 6 and Table 7 show the number of common patterns extracted for each field by IPC and CPC. In all the applicant groups, the pattern I, representing the independence of the applicant’s invention, occupied the most significant ratio compared to S, T, and E, which represented the persistence of the invention. The reason is that patent inventions must be guaranteed novelty and progression fundamentally in order to claim the rights of the patent. Although independent patterns were generated more frequently than other common patterns, the persistence patterns occurred differently by each applicant type such as research institute, company, and university.
Table 5. Frequency and rate of each pattern of research institute applicants.
Table 6. Frequency and rate of each pattern of company applicants.
Table 7. Frequency and rate of each pattern of university applicants.
Table 5 shows the number of common patterns for the group of research institute applicants by IPC and CPC. The results show that E had a relatively higher occurrence than S and T; it can thus be confirmed that inventions were carried out by applying and extending the existing invention patents to different domains. Table 6 shows the experimental results of the group of companies. In the case of company applicants, the E pattern appeared to have the highest frequency, as in the group of research institutes, and of the remaining persistence patterns, S had a higher frequency than T. It appears that the group of company applicants aims to invent new patents in the development and commercialization of services based on the technologies as well as the patent inventions to claim the technology held by the company. Mostly, the group of research institutes focuses on the expansion and propagation of existing technologies in the invention of new technology, while the group of companies invents to develop the core technologies of companies for specific service areas in response to changes in the market trends. Table 7 shows the experimental results for the group of university applicants. In particular, in the case of the group of university applicants, the average pattern of 97.1% of the independent pattern (I) in the university applicants, which is about 30% larger than the research institute applicants (67%) and the company applicants (65.8%). Also, the results show that the same order of S, T, and E patterns shown for the research institute applicants, indicating that universities also focus on R&D research like the research institute applicants, which is a remarkable difference from the group of company applicants.
Table 8 shows the representative technology classification codes extracted by the persistence pattern (S, T, E) for tracking the change in invention trends for the representative technical fields of the applicants. For this purpose, each representative technical classification code was selected as the code that appears with the highest frequency in each pattern (S, T, E). As shown in the experimental results in Table 3, because the IPC and CPC systems have the characteristics of different tree structures, representative technical codes were extracted respectively to compare and analyze the characteristics of each classification system. Trend analysis results based on the representative technology codes of the applicants shown in Table 8, and the invention trends of all applicants are classified into three different types as follows.
Table 8. Representative technology classification codes of all applicants for comparison between IPC and CPC).
-
A case in which the representative technology codes belong to the same field in both classification systems and the representative technology codes are also the same ( I 1 , C 1 , C 3 ).
-
A case in which the representative technology codes belong to different fields of IPC and CPC ( U 2 , U 2 ).
-
A case in which the representative technology codes belong to the same field in both IPC and CPC but more specific in CPC ( I 2 , I 3 , C 2 , U 1 ).
The invention trends based on representative technology codes derived from common patterns of each applicant are shown in Figure 4, Figure 5, Figure 6 and Figure 7.
Figure 4. Invention trends of research institute I 1 based on the S , T , E patterns.
Figure 5. Invention trends of research institute I 2 based on the S, T, and E patterns.
Figure 6. Invention trend of university U 3 based on S, T, E patterns.
Figure 7. Invention trend of company C 2 based on S, T, E patterns.
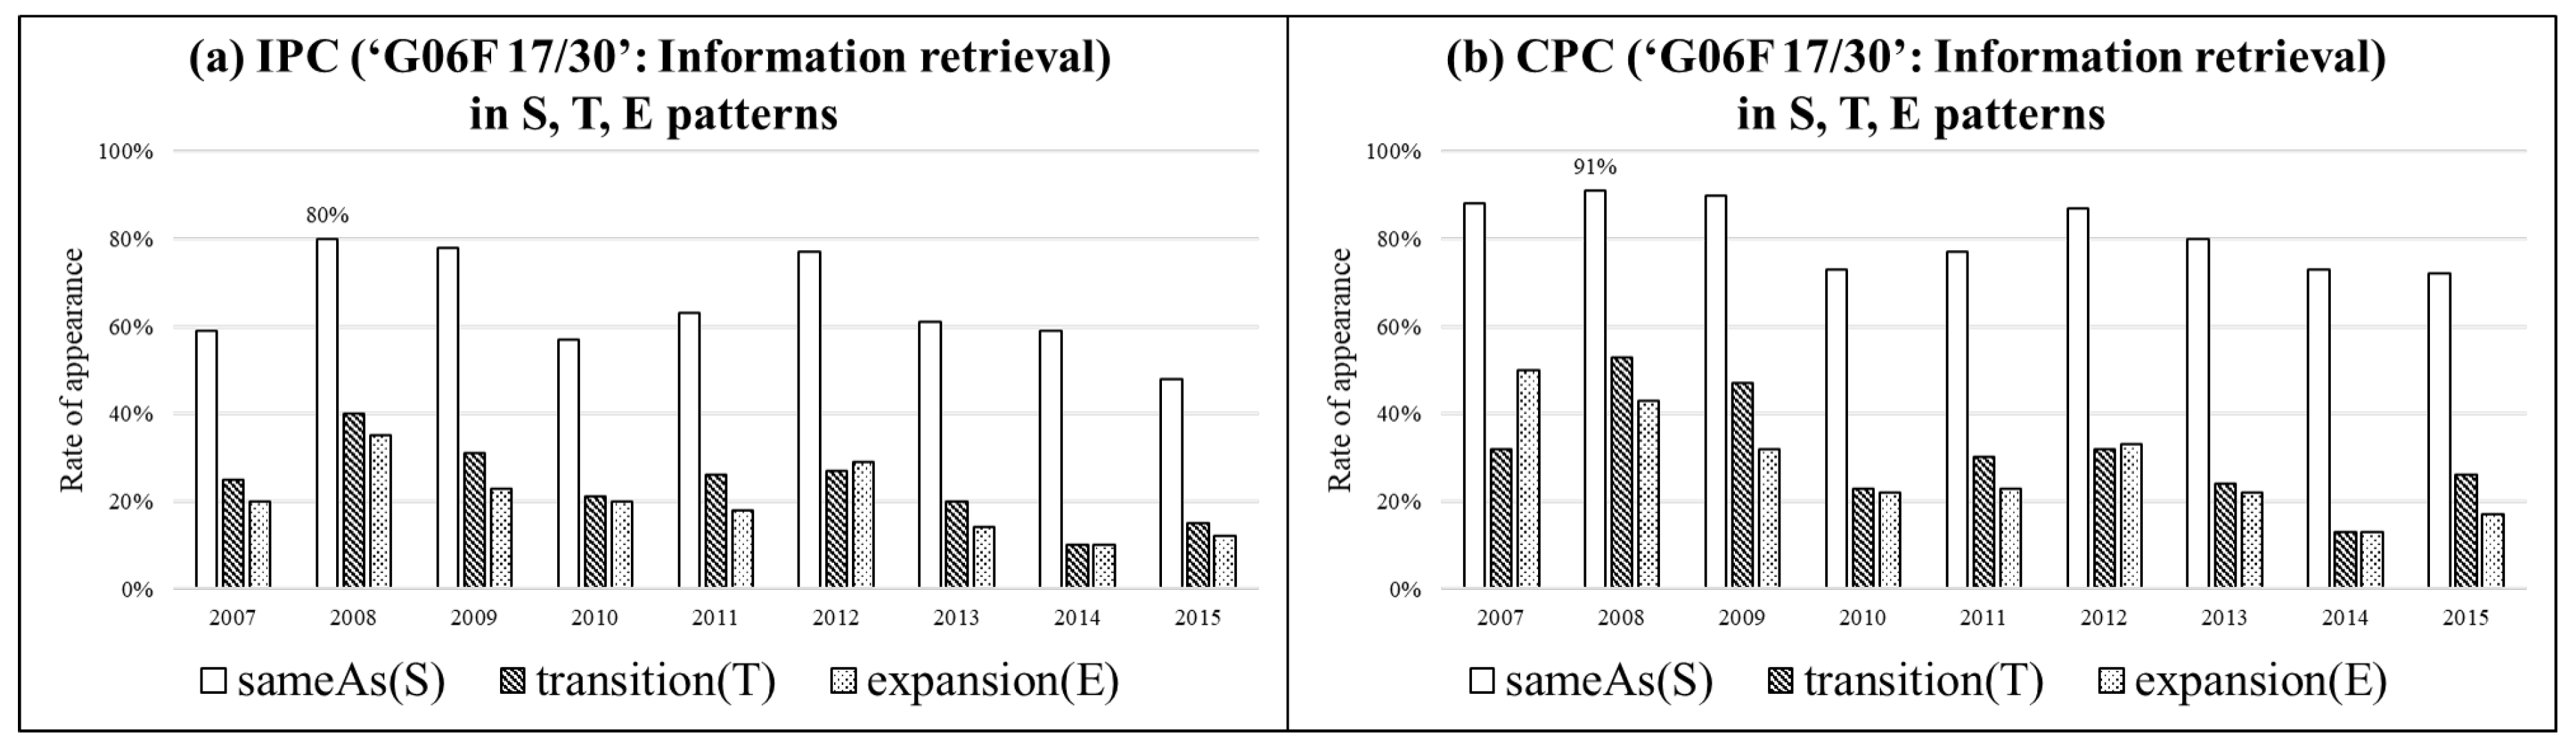
Figure 4 shows that the research institute I 1 has continued the invention of technology in the ‘information retrieval’ field in both S, T, and E patterns, with the same representative technology code (‘G06F 17/30’) in IPC and CPC.
Figure 5 shows the second type of invention patterns, research institute I 2 , whose representative technical code belongs to the same field (‘semiconductor’), but the CPC classification system represents the more detailed technical codes (‘C09K 11/77’, ‘H01L 33/50’) than the IPC classification system. That is, the CPC-based representative technology code (‘C09K 11/77’) indicates that the applicant of I 2 had concentrated on the technical invention related to the rare earth metals, but it was not as specific as the IPC-based code.
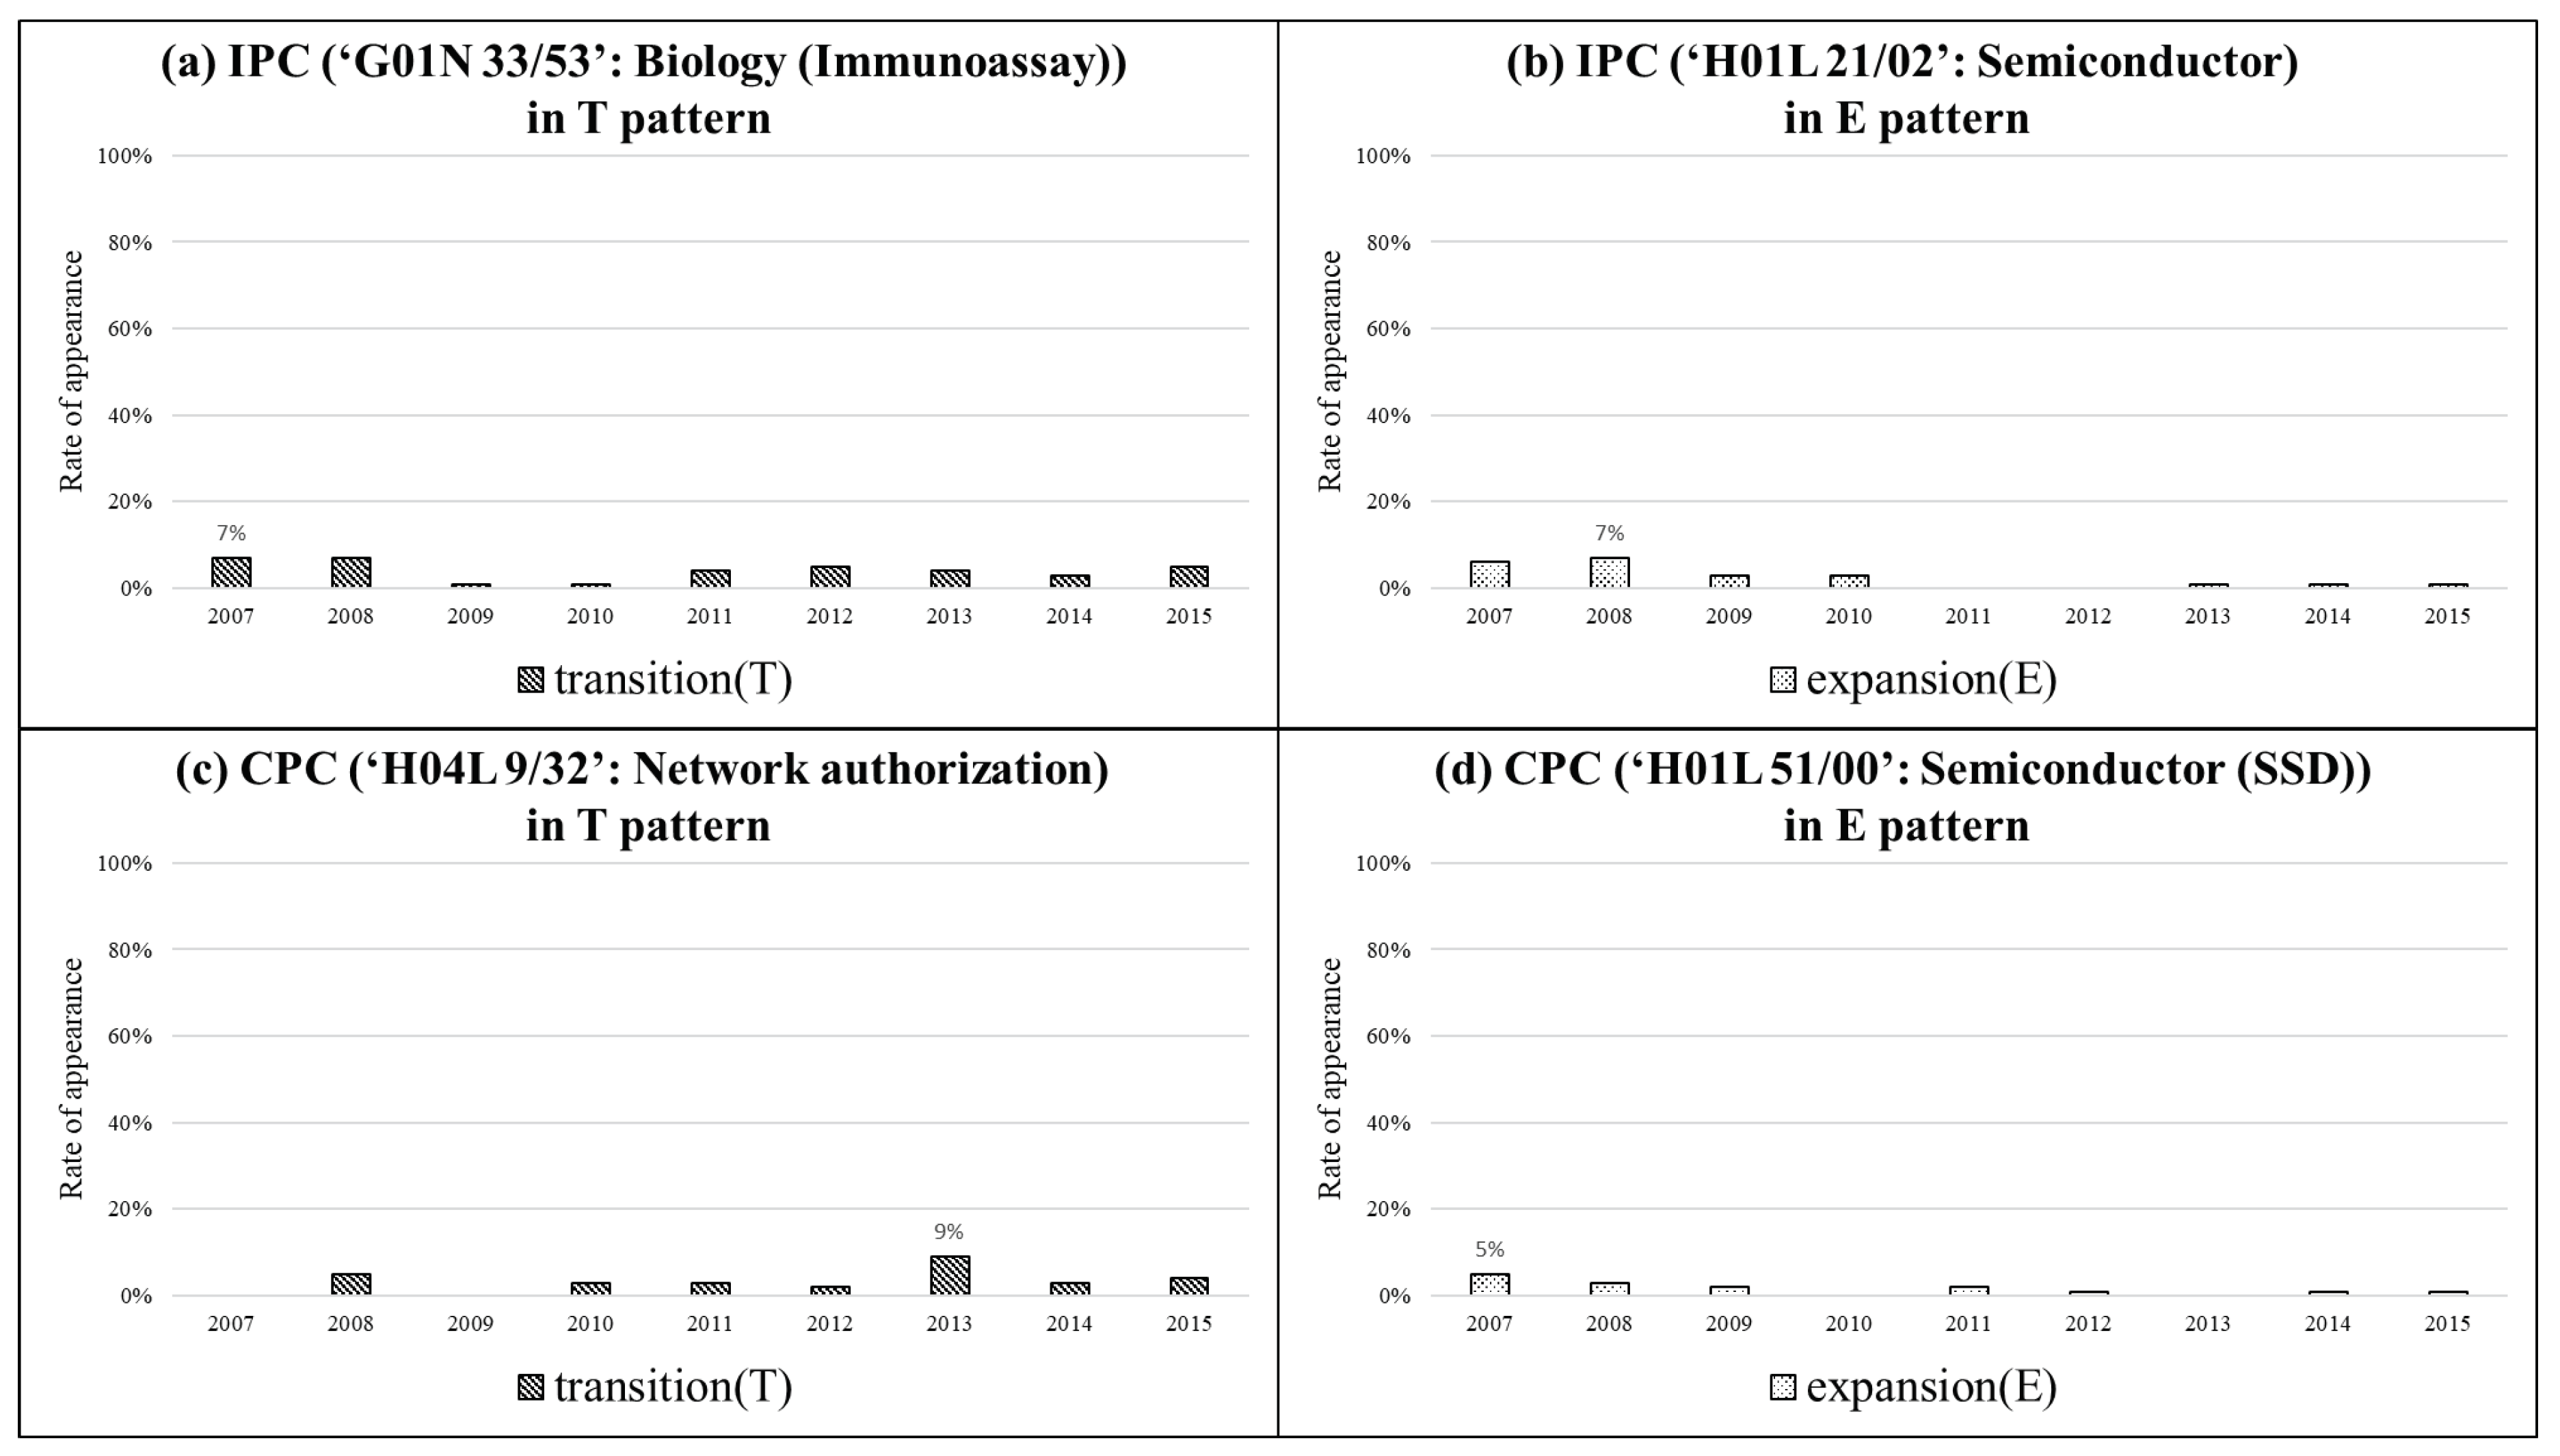
Figure 6 shows the technology invention trend for U 3 , one of the group of university applicants. Figure 6a,b show the technical codes representing the IPC classification scheme, and Figure 6c,d are the technical codes representing the CPC classification scheme. Figure 6d shows the technical code for the solid-state drive (SSD), which specifies a more detailed technical field than the ‘H01L 21/02’ (semiconductor) code of the existing IPC classification scheme. In the case of the T pattern, the representative technology seems to have changed from ‘G01N 33/53’ to ‘H04L 9/32’. This indicates that the inventions that U 3 focused on in the field of biology (immunoassay) are gradually shifting to the field of network authorization in recent years. As a result, it is possible to confirm the state of the art in detail of the technical invention not shown in the IPC classification system through the representative technology code based on the CPC classification system.
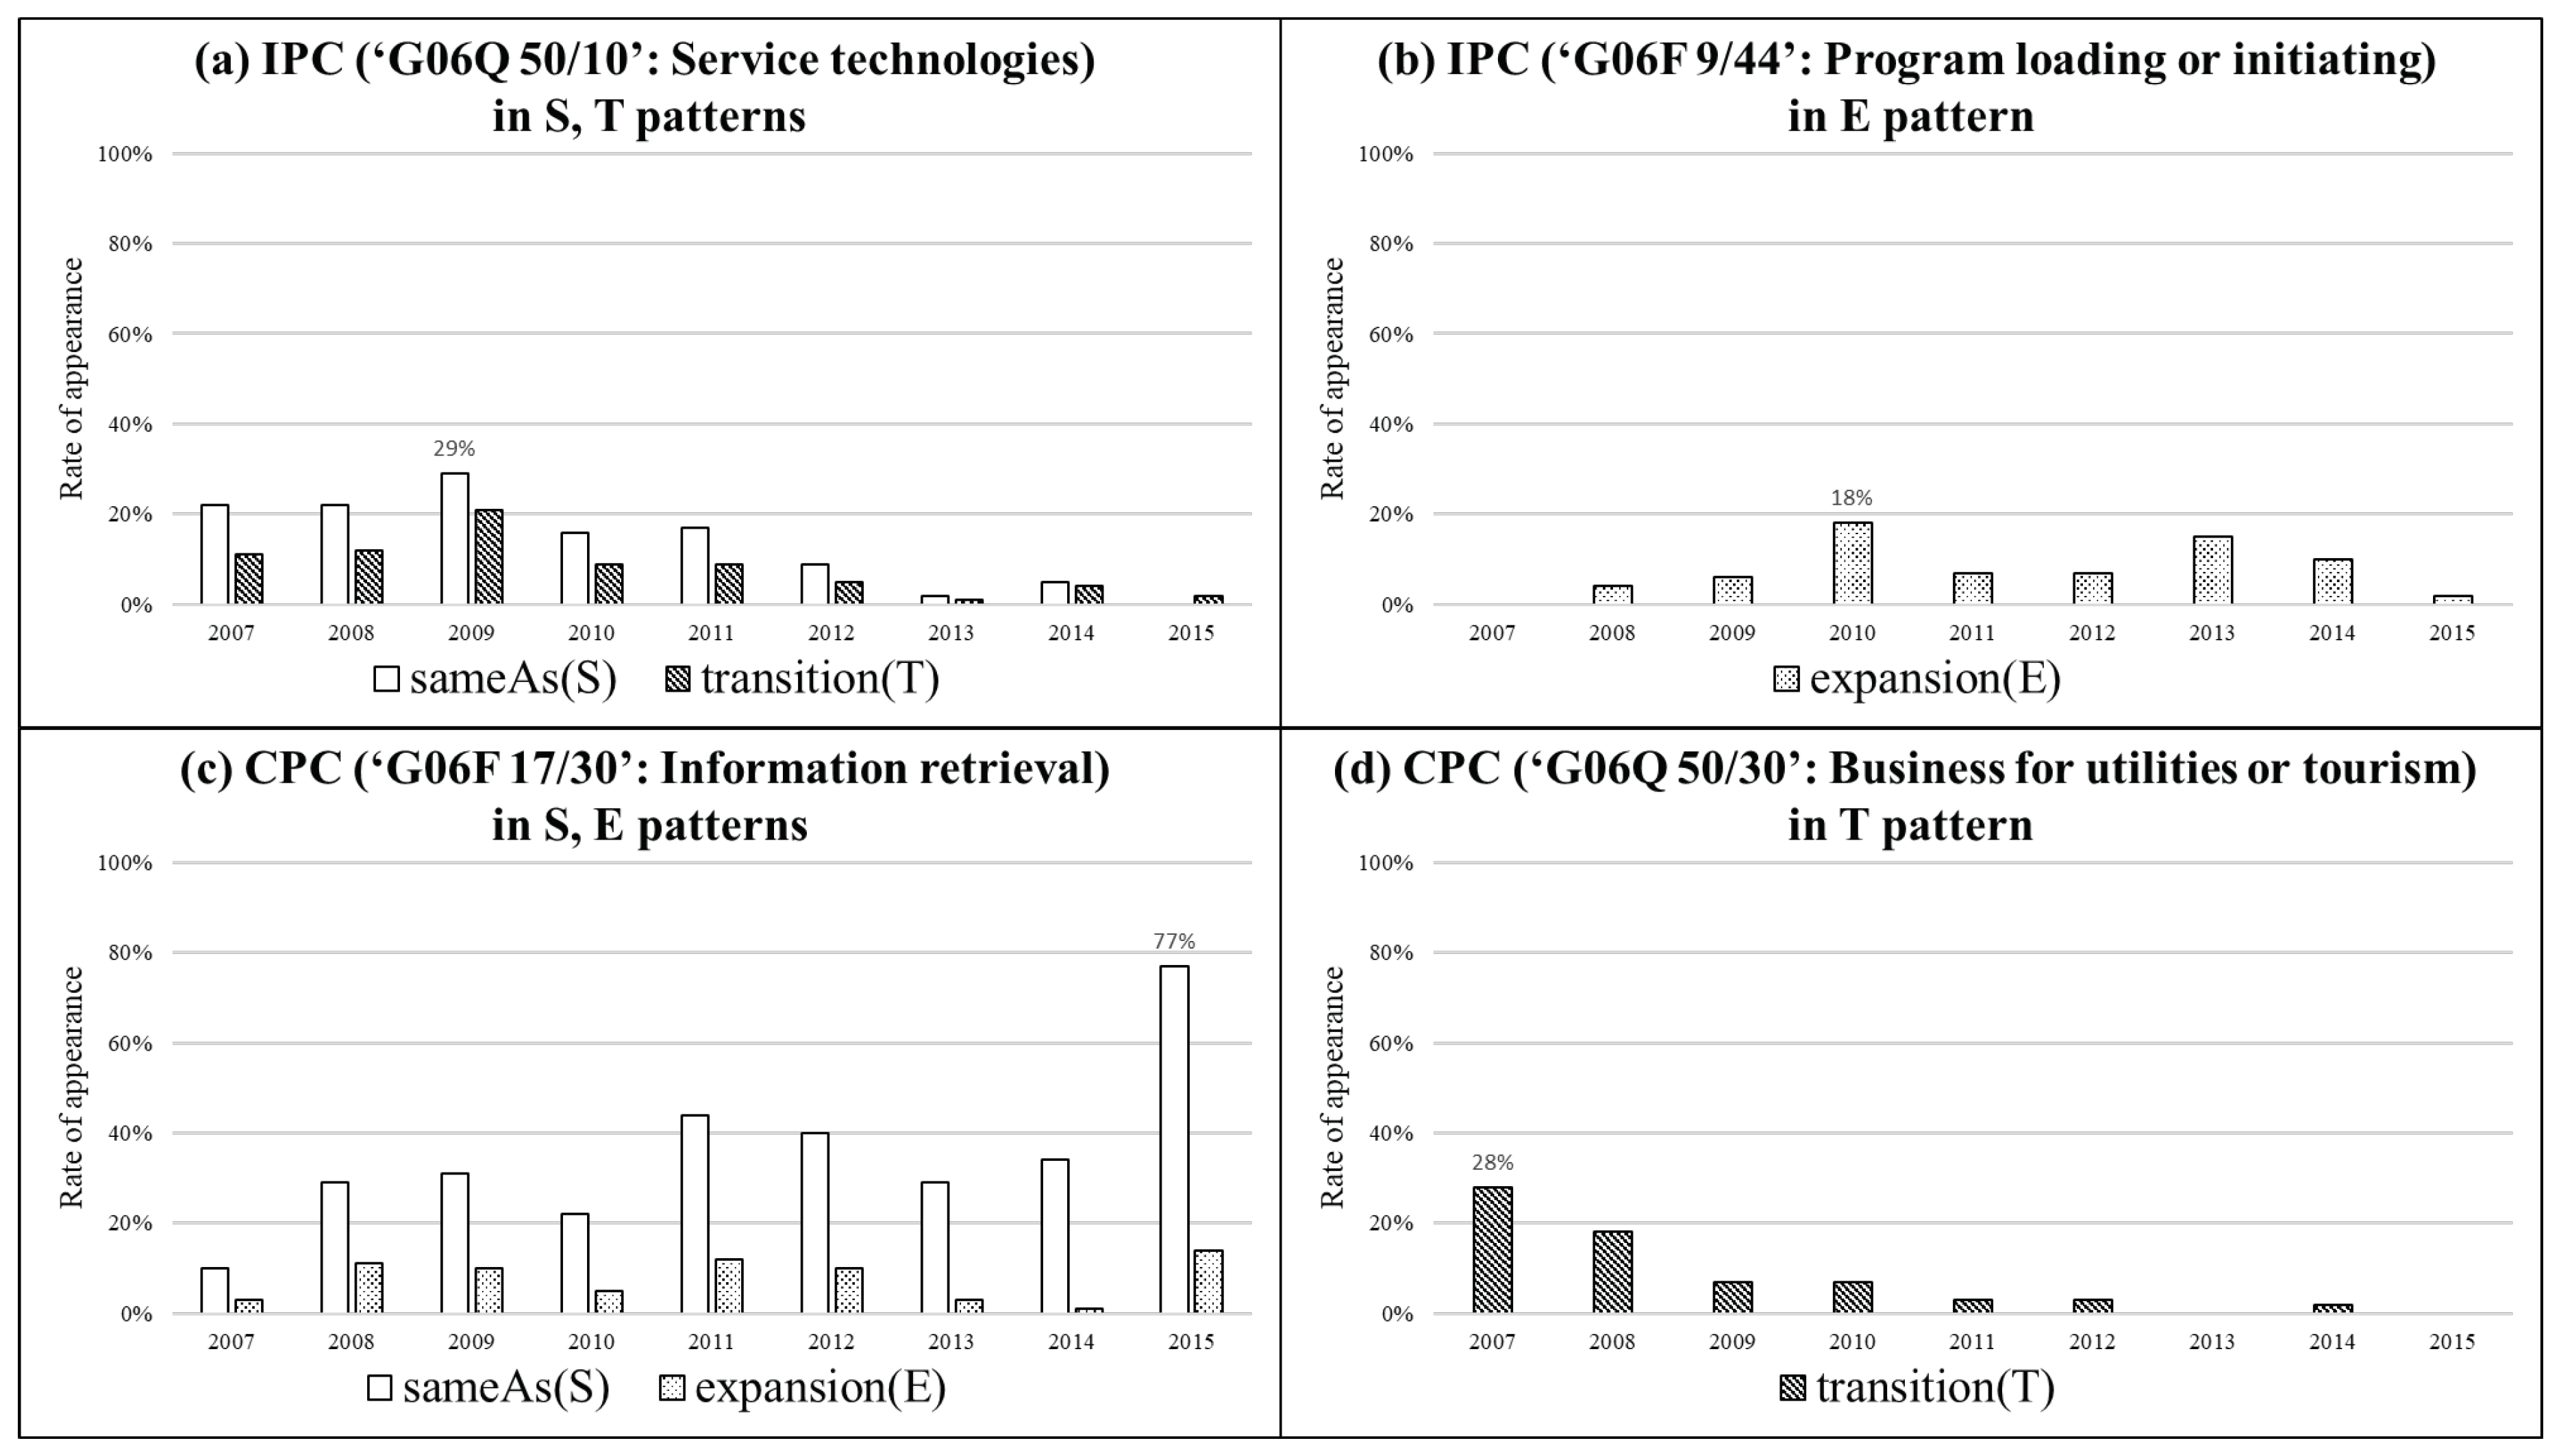
Figure 7 shows the representative technology codes of the company applicant C 2 and the trend of the invention shown in the experimental results of Table 8. From the IPC system, ‘G06Q 50/10’ (Pattern S) and ‘G06F 9/44’ (Pattern T) were derived as representative technical codes. ‘G06Q 50/10’ refers to the service technology field, and in the case of C 2 , the related technology invention showed the highest point in 2009, but gradually decreased after that. On the other hand, the representative technology based on CPC showed that the ‘G06F 17/30’ information technology field has been increasing continuously since 2009. In other words, it can be seen that the technical invention of C 2 primarily changed from service technology to information retrieval technology through S pattern-based representative technology codes extracted from the classification systems. In the service technology field, more detailed technology inventions have been made in the transportation and tourism fields.

5. Conclusions

Patents play an essential role in ensuring the rights of the technology invented by the applicant as one of the representative intellectual property rights. However, with the recent increase in the speed of the invention, the number of patent inventions also increases rapidly. Therefore, when a new patent is invented, many efforts are needed to compare and analyze differences with existing technologies, disputes such as patent litigation among companies, and claim rights of the patented technology. Existing studies have been conducted to improve the accuracy of patent technology searches, evaluate technology value, and analyze technology development trends. Nevertheless, there is a lack of analytical methods for applicants inventing technologies and possessing intellectual property rights. An applicant is an organization or group to which one or more inventors belong, and the applicants are the organizers who claim rights to their technology. Therefore, through the analysis of the technical invention trends of applicants, it is possible to analyze what technologies of the applicants have invented during a specific period. Applicants’ invention patterns help to evaluate the value of existing technologies, as it is possible to identify whether a newly invented patent is derived and extended from existing element technologies. Therefore, the results can play a significant role in predicting future technology market trends, as well as the impact of current technology value on diagnostics. Therefore, this study defines common invention patterns and extracts the representative technical fields of applicants, and compares and analyzes the technical invention trends by each group of applicants. As a result, it is confirmed that the applicant groups had common features, and each applicant also extracted the unique characteristics of each applicant. Also, the proposed model can analyze how the existing technologies contributed to the new patent invention. In addition, the proposed method does not need to consider different linguistic features and shows that text pre-processing can be reduced for extracting common patterns. Therefore, it is possible to apply the same to the global patents to which the patent classification system is applied, so that not only the trend of individual applicants but also the trend of an invention by specific domain and country can be derived and compared.

Author Contributions

S.C.; Performed experiments, analysed data and co-wrote the paper. J.G.; Supervised the research and designed experiments and co-wrote the paper.

Funding

This work was supported by the National Research Foundation of Korea (NRF) grant funded by the Korea government (MSIT) (No.NRF-2018R1C1B6008624).

Conflicts of Interest

The authors declare no conflict of interest.

References

  1. Bongsun, K.; Eonsoo, K. The Relationship between Patent Characteristics and Its Value: An Empirical Study in the Context of a Patent Pool. J. Strateg. Manag. 2014, 17, 163–181. [Google Scholar]
  2. Yonghyeon, K.; Byeongki, J.; Janghyeok, Y. The Effects of Qualitative Patenting Activities on Firm Outcome. In Proceedings of the KIIE: Korean Institute of Industrial Enginners Spring Conference, Jeju, Korea, 8–11 April 2014; pp. 607–610. [Google Scholar]
  3. Griliches, Z.; Pakes, A.; Hall, B.H. The Value of Patents as Indicators of Inventive Activity. In Economic Policy and Technical Performance; Dasgupta, P., Stoneman, P., Eds.; Cambridge University Press: Cambridge, UK, 1987; pp. 97–124. [Google Scholar]
  4. Jiho, K.; Jongchan, K.; Joonhyuck, L.; Sangsung, P.; Dongsik, J. A Patent Trend Analysis for Technological Convergence of IoT and Wearables. J. Korean Inst. Intell. Syst. 2015, 25, 306–311. [Google Scholar]
  5. Jinho, C.; Heesu, K.; Namgyu, I. Keyword Network Analysis for Technology Forecasting. J. Intell. Inf. Syst. 2011, 17, 227–240. [Google Scholar]
  6. Degroote, B.; Held, P. Analysis of the patent documentation coverage of the CPC in comparison with the IPC with a focus on Asian documentation. World Pat. Inf. 2018, 54, S78–S84. [Google Scholar] [CrossRef]
  7. Sungjun, A.; Jongchan, K.; Joonhyuck, L.; Sangsung, P.; Dongsik, J. Business Technology Trend Analysis using Patent Information. In Proceedings of the Korean Institue of Intelligent System Spring Conference, Gyeonggi, Korea, 24–25 April 2015; pp. 13–14. [Google Scholar]
  8. Jongchan, K.; Joonhyuck, L.; Gabjo, K.; Sangsung, P.; Dongsik, J. Time Series Analysis of Patent Keywords for Forecasting Emerging Technology. J. Kips Korean Inf. Process. Soc. Trans. Softw. Data Eng. 2014, 3, 355–360. [Google Scholar]
  9. Hyunwoo, K.; Jongchan, K.; Joonhyuck, L.; Sangsung, P.; Dongsik, J. A Novel Methdology for Extracting Core Technology and Patents by IP Mining. J. Korean Inst. Intell. Syst. 2015, 25, 392–397. [Google Scholar]
  10. Jangwon, G.; Jinpyo, L.; Yunji, J.; Doheon, J.; Hanmin, J. A trend analysis method for iot technologies using patent dataset with goal and approach concepts. Wirel. Pers. Commun. 2016, 91, 1749–1764. [Google Scholar]
  11. Kyoungrae, L.; Junseok, L.; Sangsung, P. Technology Relation for Patent of Technology Transfer based on IPC Code. In Proceedings of the Korean Institute of Intelligent Systems Autumn Conference, Gangwon, Korea, 24–25 October 2014; pp. 181–182. [Google Scholar]
  12. Lim, S.; Kwon, Y. IPC Multi-label Classification Applying the Characteristics of Patent Documents. In Proceedings of the 11st International Conference on Biquitous Information Technologies and Applications (CUTE 2016), Bangkok, Thailand, 19–21 December 2016; pp. 166–172. [Google Scholar]
  13. Leydesdorff, L.; Kushnir, D.; Rafols, I. Interactive overlay maps for US patent (USPTO) data based on International Patent Classification (IPC). Scientometrics 2014, 98, 1583–1599. [Google Scholar] [CrossRef]
  14. Naik, D.A.; Seema, S.; Singh, G.; Singh, A. Exploration and Implementation of Classification Algorithms for Patent Classification. In Proceedings of the International Research Symposium on Computing and Network Sustainability (IRSCNS 2018), Goa, India, 30–31 August 2018; pp. 119–128. [Google Scholar]
  15. Grawe, M.F.; Martins, C.A.; Bonfante, A.G. Automated Patent Classification Using Word Embedding. In Proceedings of the 2017 16th IEEE International Conference on Machine Learning and Applications (ICMLA), Cancun, Mexico, 18–21 December 2017; pp. 408–411. [Google Scholar]
  16. Wu, C.H.; Ken, Y.; Huang, T. Patent classification system using a new hybrid genetic algorithm support vector machine. Appl. Soft Comput. 2010, 10, 1164–1177. [Google Scholar] [CrossRef]
  17. Lyu, L.; Han, T. A Comparative Study of Chinese Patent Literature Automatic Classification Based on Deep Learning. In Proceedings of the 2019 ACM/IEEE Joint Conference on Digital Libraries (JCDL), Champaign, IL, USA, 2–6 June 2019; pp. 345–346. [Google Scholar]
  18. Li, S.; Hu, J.; Cui, Y.; Hu, J. DeepPatent: Patent classification with convolutional neural networks and word embedding. Scientometrics 2018, 117, 721–744. [Google Scholar] [CrossRef]
  19. Zambetti, M.; Sala, R.; Russo, D.; Pezzotta, G.; Pinto, R. A patent review on machine learning techniques and applications: Depicting main players, relations and technology landscapes. In Proceedings of the 23rd Summer School Francesco Turco, Palermo, Italy, 12–14 September 2018; pp. 115–128. [Google Scholar]
  20. Masson, P.K. Searching with combination sets in CPC: An efficient way to retrieve relevant documents. World Pat. Inf. 2018, 54, S93–S98. [Google Scholar] [CrossRef]

Article Metrics

Citations

Article Access Statistics

Multiple requests from the same IP address are counted as one view.