Article

Numerical Analysis of the Effect of Cavitation on the Tip Leakage Vortex in an Axial-Flow Pump

1
Research Center of Fluid Machinery Engineering and Technology, Jiangsu University, Zhenjiang 212013, China
2
School of Mechanical Technology, Wuxi Institute of Technology, Wuxi 214121, China
3
School of Mechanical Engineering, Nantong University, Nantong 226019, China
*
Authors to whom correspondence should be addressed.
J. Mar. Sci. Eng. 2021, 9(7), 775; https://doi.org/10.3390/jmse9070775
Submission received: 23 May 2021 / Revised: 10 July 2021 / Accepted: 13 July 2021 / Published: 16 July 2021
(This article belongs to the Section Ocean Engineering)

Abstract

:
To understand the effect of cavitation on the tip leakage vortex (TLV), turbulent cavitating flows were numerically investigated using the shear-stress transport (SST) k–ω turbulence model and the Zwart–Gerber–Belamri cavitation model. In this work, two computations were performed—one without cavitation and the other with cavitation—by changing the inlet pressure of the pump. The results showed that cavitation had little effect on the pressure difference between the blade surfaces for a certain cavitation number. Instead, it changed the clearance flow and TLV vortex structure. Cavitation caused the TLV core trajectory to be farther from the suction surface and closer to the endwall upstream of the blade. Cavitation also changed the vortex strength distribution, making the vortex more dispersed. The vortex flow velocity and turbulent kinetic energy were lower, and the pressure pulsation was more intense in the cavitating case. The vorticity transport equation was used to further analyze the influence of cavitation on the evolution of vortices. Cavitation could change the vortex stretching term and delay the vortex bending term. In addition, the vortex dilation term was drastically changed at the vapor–liquid interface.

1. Introduction

The tip clearance flow and vortex that develop in the clearance between the tip and the endwall of axial turbomachines occur in many hydraulic machines. The pressure difference between the blade pressure side and the suction side induces a jet flow in the vicinity of the tip gap [1]. The jet flow starts from the pressure side, accelerates in the gap, and transforms into a tip leakage vortex (TLV) as it rolls up on the suction side [2,3,4]. Meanwhile, a tip separation vortex is formed due to the flow separation on the pressure side of the blade [5]. This process is also accompanied by the formation of an induced vortex [6]. The TLV and vortex cavitation often induce instabilities and blockages in the flow passage, which results in vibrations, noise, and performance degradation [7,8,9]. It is crucial and beneficial to investigate the formation mechanisms of the tip clearance vortex and understand the effect of cavitation on the vortices [10,11,12,13].
You et al. [14,15] studied the tip clearance flow using the large eddy simulation method. They focused on studying the instability of the tip leakage vortex structure and the potential mechanism of the low-pressure fluctuations caused by the cavities near the tip clearance. They suggested that the velocity gradient generated by the gap jet was the cause of the production of vorticity and turbulent kinetic energy. Dreyer [16] analyzed the tip vortex characteristics of the NACA16-020 hydrofoil under different cavitation numbers and suggested that cavitation caused the tangential and axial velocities of the nearby vortex to decrease. Zhang et al. [17] analyzed the influence of cavitation on the hydrodynamic load coefficient and the surrounding flow structure using a Clark-Y hydrofoil and obtained the relationship between cavitation and vortex. Decaix et al. [18] studied the NACA0009 hydrofoil and performed numerical calculations of the tip leakage vortex under cavitation and non-cavitation conditions and found that cavitation changed the vortex core trajectory and the vorticity distribution in the vortex core region. Ji et al. [19,20] compared the vorticity distribution of the flow around the hydrofoil with and without cavitation, finding a strong correlation between the vortex and cavitation. Chen et al. [21] performed large eddy simulations on hydrofoils, analyzed how cavitation affected the vorticity and turbulence, and suggested that the vortex stretching term dominated the evolution of the vortex. In contrast, the vortex dilation term reduced the vorticity. Zhao et al. [22] analyzed the hydraulic characteristics of the hydrofoil and the tip leakage cavitation flow for different cavitation numbers. They found that the tip leakage vortex strength decreased with the decrease in the cavitation number, especially near the trailing edge of the hydrofoil. Guo et al. [23] analyzed the cavitation characteristics of the tip leakage vortex for an axial-flow propulsion pump with different cavitation numbers and found that cavitation reduced the leakage flow and increased the pressure pulsation amplitude.
The influence of cavitation on the vortex and the mechanism of the vorticity evolution of the axial-flow pump are still unclear. When cavitation occurs, it is difficult to obtain accurate flow information inside the cavity by experimental methods due to technical limitations [7,24]. Numerical approaches based on the Reynolds-averaged Navier–Stokes (RANS) equations can provide insightful and detailed information about the evolution of the TLV and vortex cavitation. Zhang et al. [25,26] discussed the mechanisms for vortex cavitation in the tip region of an axial-flow pump using numerical simulations, revealing that cavitation patterns could be closely related to the vortex structures.
Axial-flow pumps are widely used in marine water jet propulsion, nuclear power, water diversion, irrigation, and other fields, with characteristics of large flow rate, low head, and high efficiency. Inspired by the research on the correlation between the vortex and cavitation in a hydrofoil and in turbomachinery [27,28,29,30] described above, two computations were performed in this study—one without cavitation and the other with cavitation—by changing the inlet pressure of the axial-flow pump, focusing on the influence of the cavitation on the vortex structure and evolution. In this study, numerical simulations applying the shear-stress transport (SST) k-ω and Zwart–Gerber–Belamri cavitation mode were conducted to investigate cavitating turbulent flows in an axial-flow pump. First, the numerical calculation results were compared with the experimental results to ensure the accuracy of the calculation. Second, the vortex core trajectory was analyzed. The distributions of the streamlines, velocities, vortex strength, and turbulent kinetic energy in the cavitating and non-cavitating cases were compared and analyzed. Finally, the effect of cavitation on the TLV was discussed by the vorticity transport equation.

2. Calculation Method and Numerical Calculation Mode

2.1. Governing Equation and Turbulent Model

The cavitating turbulent flows are modeled based on the homogeneous assumption, in which the multiphase flows of liquid and vapor are considered to share the same velocity and pressure. The continuity and momentum equations for the mixture flow are expressed, respectively, as follows:
ρ m t + x j ( ρ m u j ) = 0
t ρ m u i + x j ρ m u i u j = p x i + x j μ + μ t u i x j + u j x i 2 3 u k x k δ i j
where u i is the velocity component in the ith direction, p is the mixture pressure, μ is the laminar viscosity, and μ T is the turbulent viscosity. The mixture density ρ m is defined as ρ m = α v ρ v + ( 1 α v ) ρ l , where the subscripts l and v represent the liquid and vapor phases, respectively, and α v is the vapor volume fraction.
The commercial code ANSYS CFX 17.1 was used in this study since it is widely used in engineering applications. The shear stress transport (SST) k-ω model was developed by Menter, which takes into account the turbulent shear stress transport and can accurately predict the flow separation under an adverse pressure gradient [31,32,33]. This eddy viscosity model has been proved to be highly adaptable and feasible for tip clearance leakage flows in many examples [8,12,18,22,25]. Therefore, this two-equation model is used to predict the turbulent vortex flows and cavitation.

2.2. Cavitation Model

The cavitation model used in this paper was proposed by Zwart, Gerber, and Belamri [34]. It is based on the hypothesis that all the bubbles in a system have the same size. The cavitation process is governed by the mass transfer equations for the conservation of the vapor volume fraction, which can be expressed as
( α v ρ v ) t + ( α v ρ v u j ) x j = m ˙ + m ˙
The source terms for the specific mass transfer rate corresponding to the vaporization m ˙ + and condensation m ˙ are given, respectively, as follows:
m ˙ + = F vap 3 α nuc ( 1 α v ) ρ v R b 2 3 p v - p ρ l p p v
m ˙ = F cond 3 α v ρ v R b 2 3 p - p v ρ l p p v
where Fvap and Fcond are empirical coefficients for the mass transfer process with recommended values of 50 and 0.01, respectively, αnuc is the nucleation site volume fraction with a value of 5 × 10⁻⁴, Rb is the typical bubble radius with a value of 1 × 10⁻⁶ m, and p v is the saturation vapor pressure, with a value of 3169 Pa. These parameters were discussed and validated for the simulations of cavitating flows in pumps [10,11,25,26].

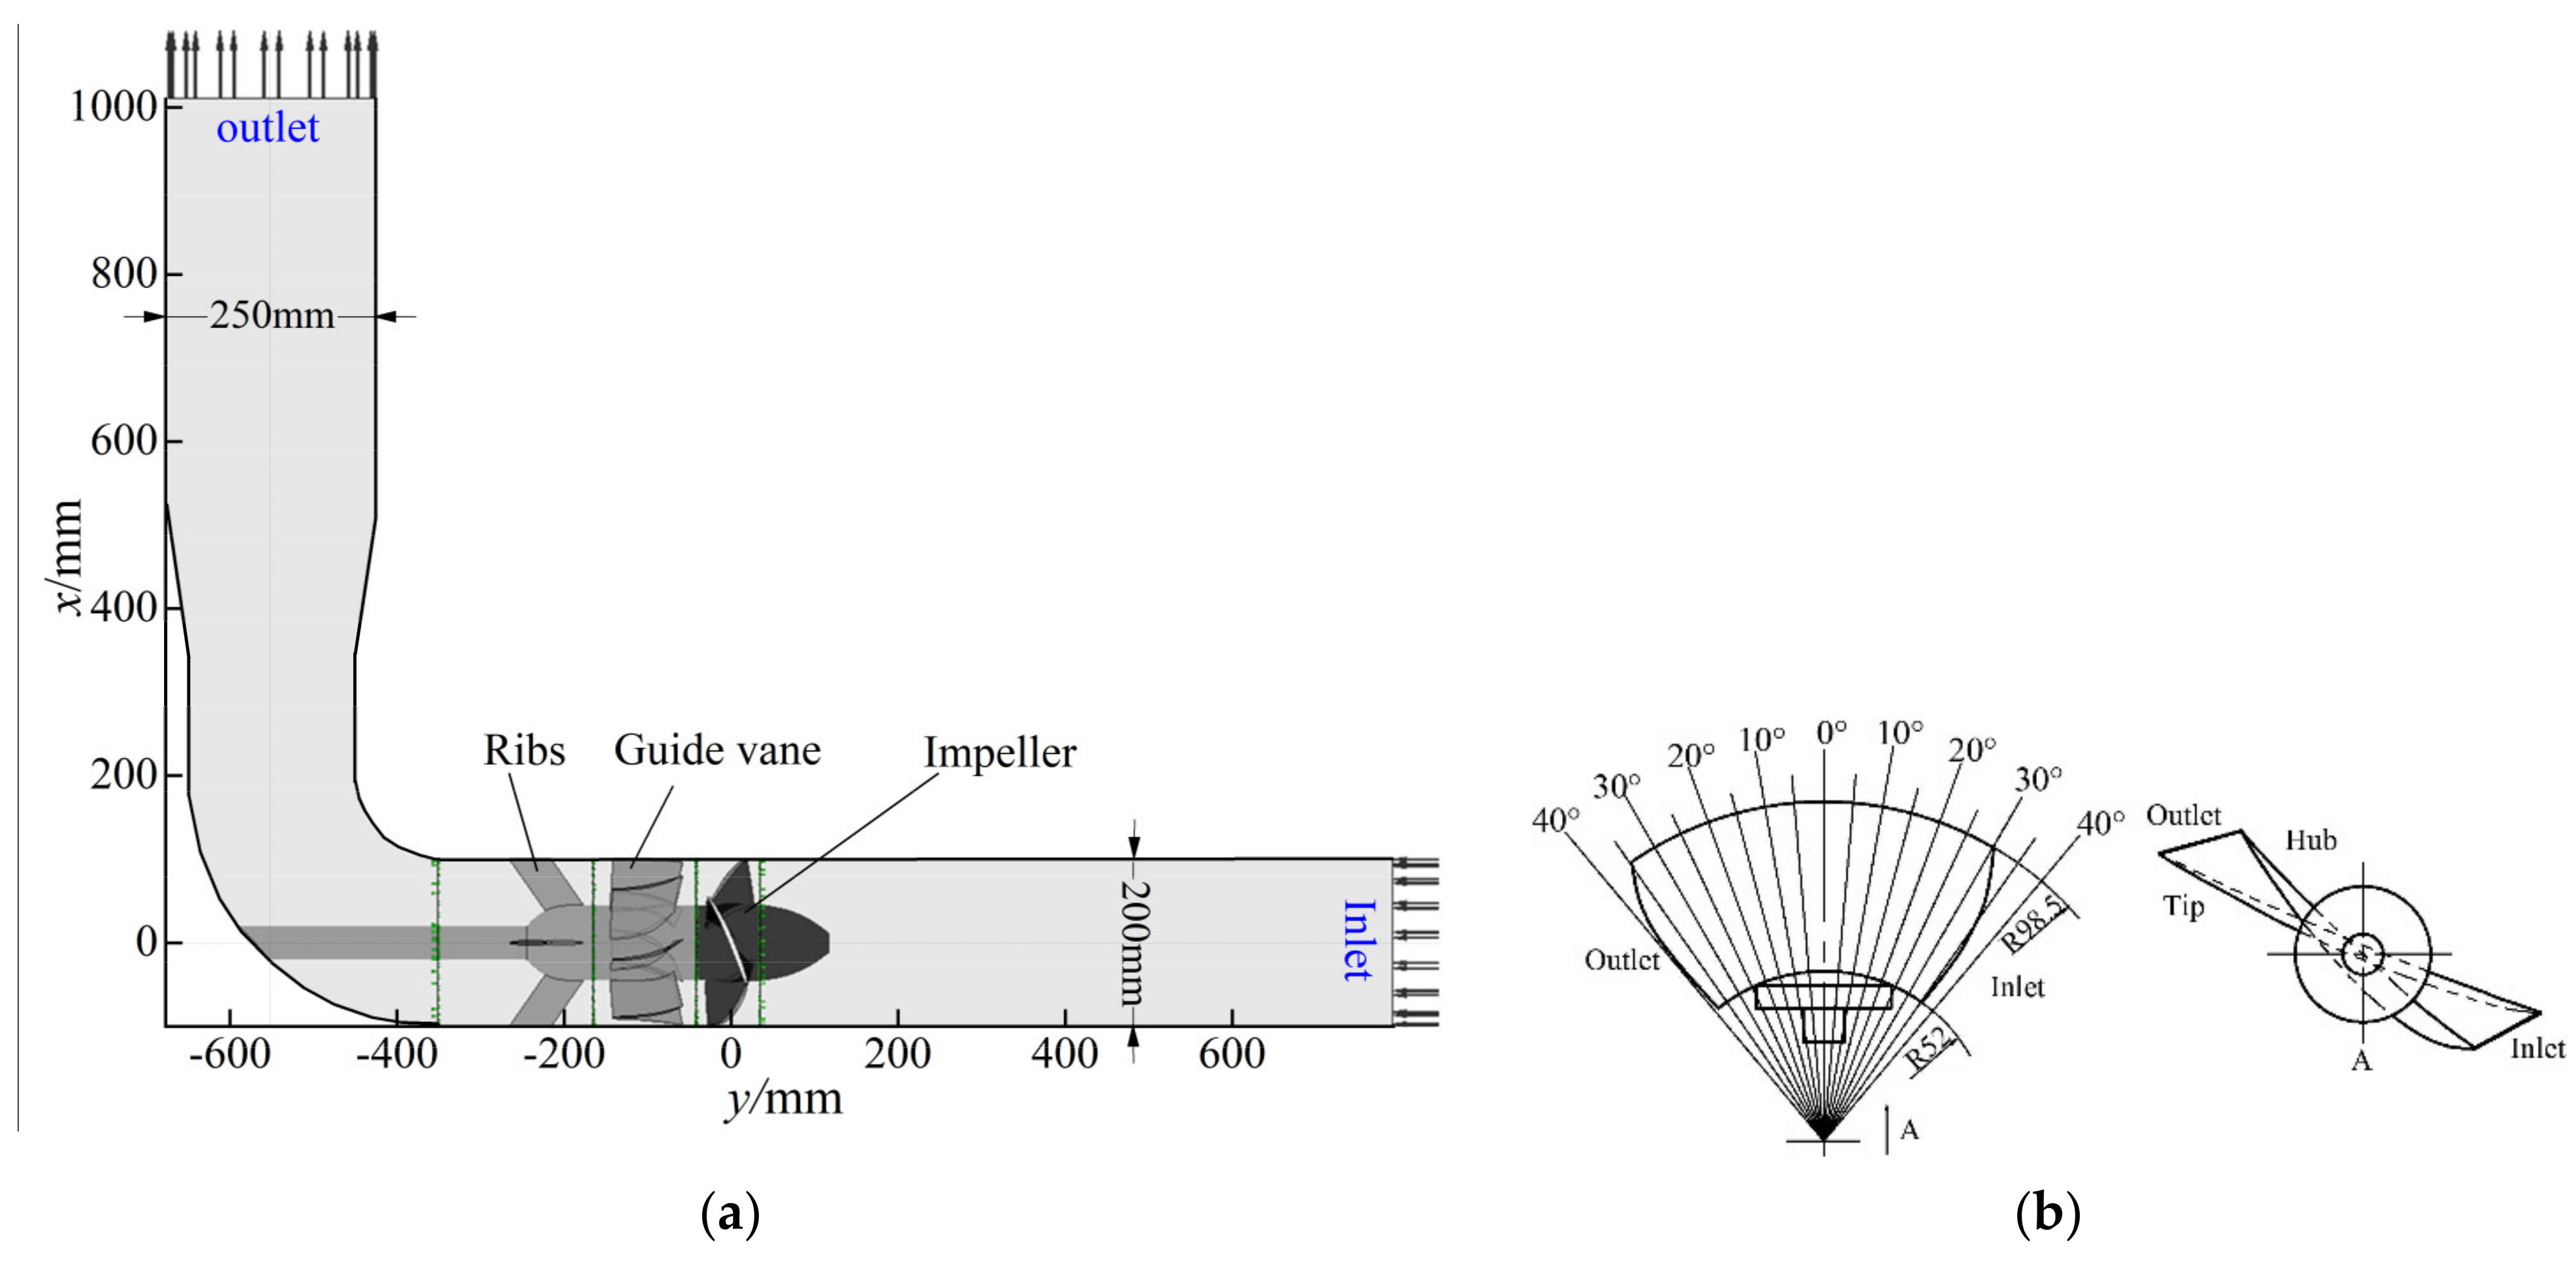
2.3. Pump Geometry, Mesh Generation, and Numerical Setup

The blade tip clearance size was 1.5 mm. The detailed geometric parameters of the pump model are shown in Table 1.
The computational configuration is shown in Figure 1, consisting of the inlet pipe, an impeller with three blades, a guide vane with seven blades, ribs supporting the stator, and a discharge elbow pipe.
The mesh generation is critical for predicting the inner flows accurately, especially for high three-dimensional turbulent tip-leakage flows in the narrow clearance. Thus, the arrangement of mesh nodes in the tip region should be appropriate to solve for the large-scale tip leakage vortex and other vortices. The grid independent results are presented in Table 2. Considering the small-scale vortex in the tip region of the blade, the mesh “Refined C” is selected, and the total number of mesh nodes is 9,947,173. The main components are impeller, guide vane, and ribs, and the corresponding numbers of mesh nodes are 5,951,796; 1,415,904; and 652,870 respectively.
The distribution of the hexahedral structured mesh for the whole computational domain is shown in Figure 2a. Figure 2b presents the meshes of the main components, such as the impeller, guide vane, and ribs. The grid at the tip clearance of the impeller was refined due to the complexity of the flow pattern. The distribution of Y+ on the blade surfaces is presented in Figure 2c, which indicated that the mesh nodes were suitable for the turbulence model.
Furthermore, the setting of the boundary conditions was basically consistent with the experiments. The inlet boundary condition was set as a total pressure condition based on the measured data in the experiment. The outlet was set as the mass flow rate, and the corresponding flow rate was QBEP. All the physical surfaces of the pump were set as no-slip walls. The automatic wall function was used as the wall treatment method. The transient rotor-stator was used for the frame change of the impeller. The impeller rotational speed was set to 1450 r/min. The time required for the impeller to complete one revolution was denoted as T. The calculation time step was set to 1/360 T (about 1.1494 × 10⁻⁴ s), and the total calculation time was 6 T. The convergence accuracy was set 1 × 10⁻⁵.
The cavitation number is defined as follows:
σ = 2 p in p v / ρ l U tip 2
where p in is the inlet pressure. The cavitation numbers were set as 1.48 and 0.53, which corresponded to the non-cavitating case and cavitating case, respectively.

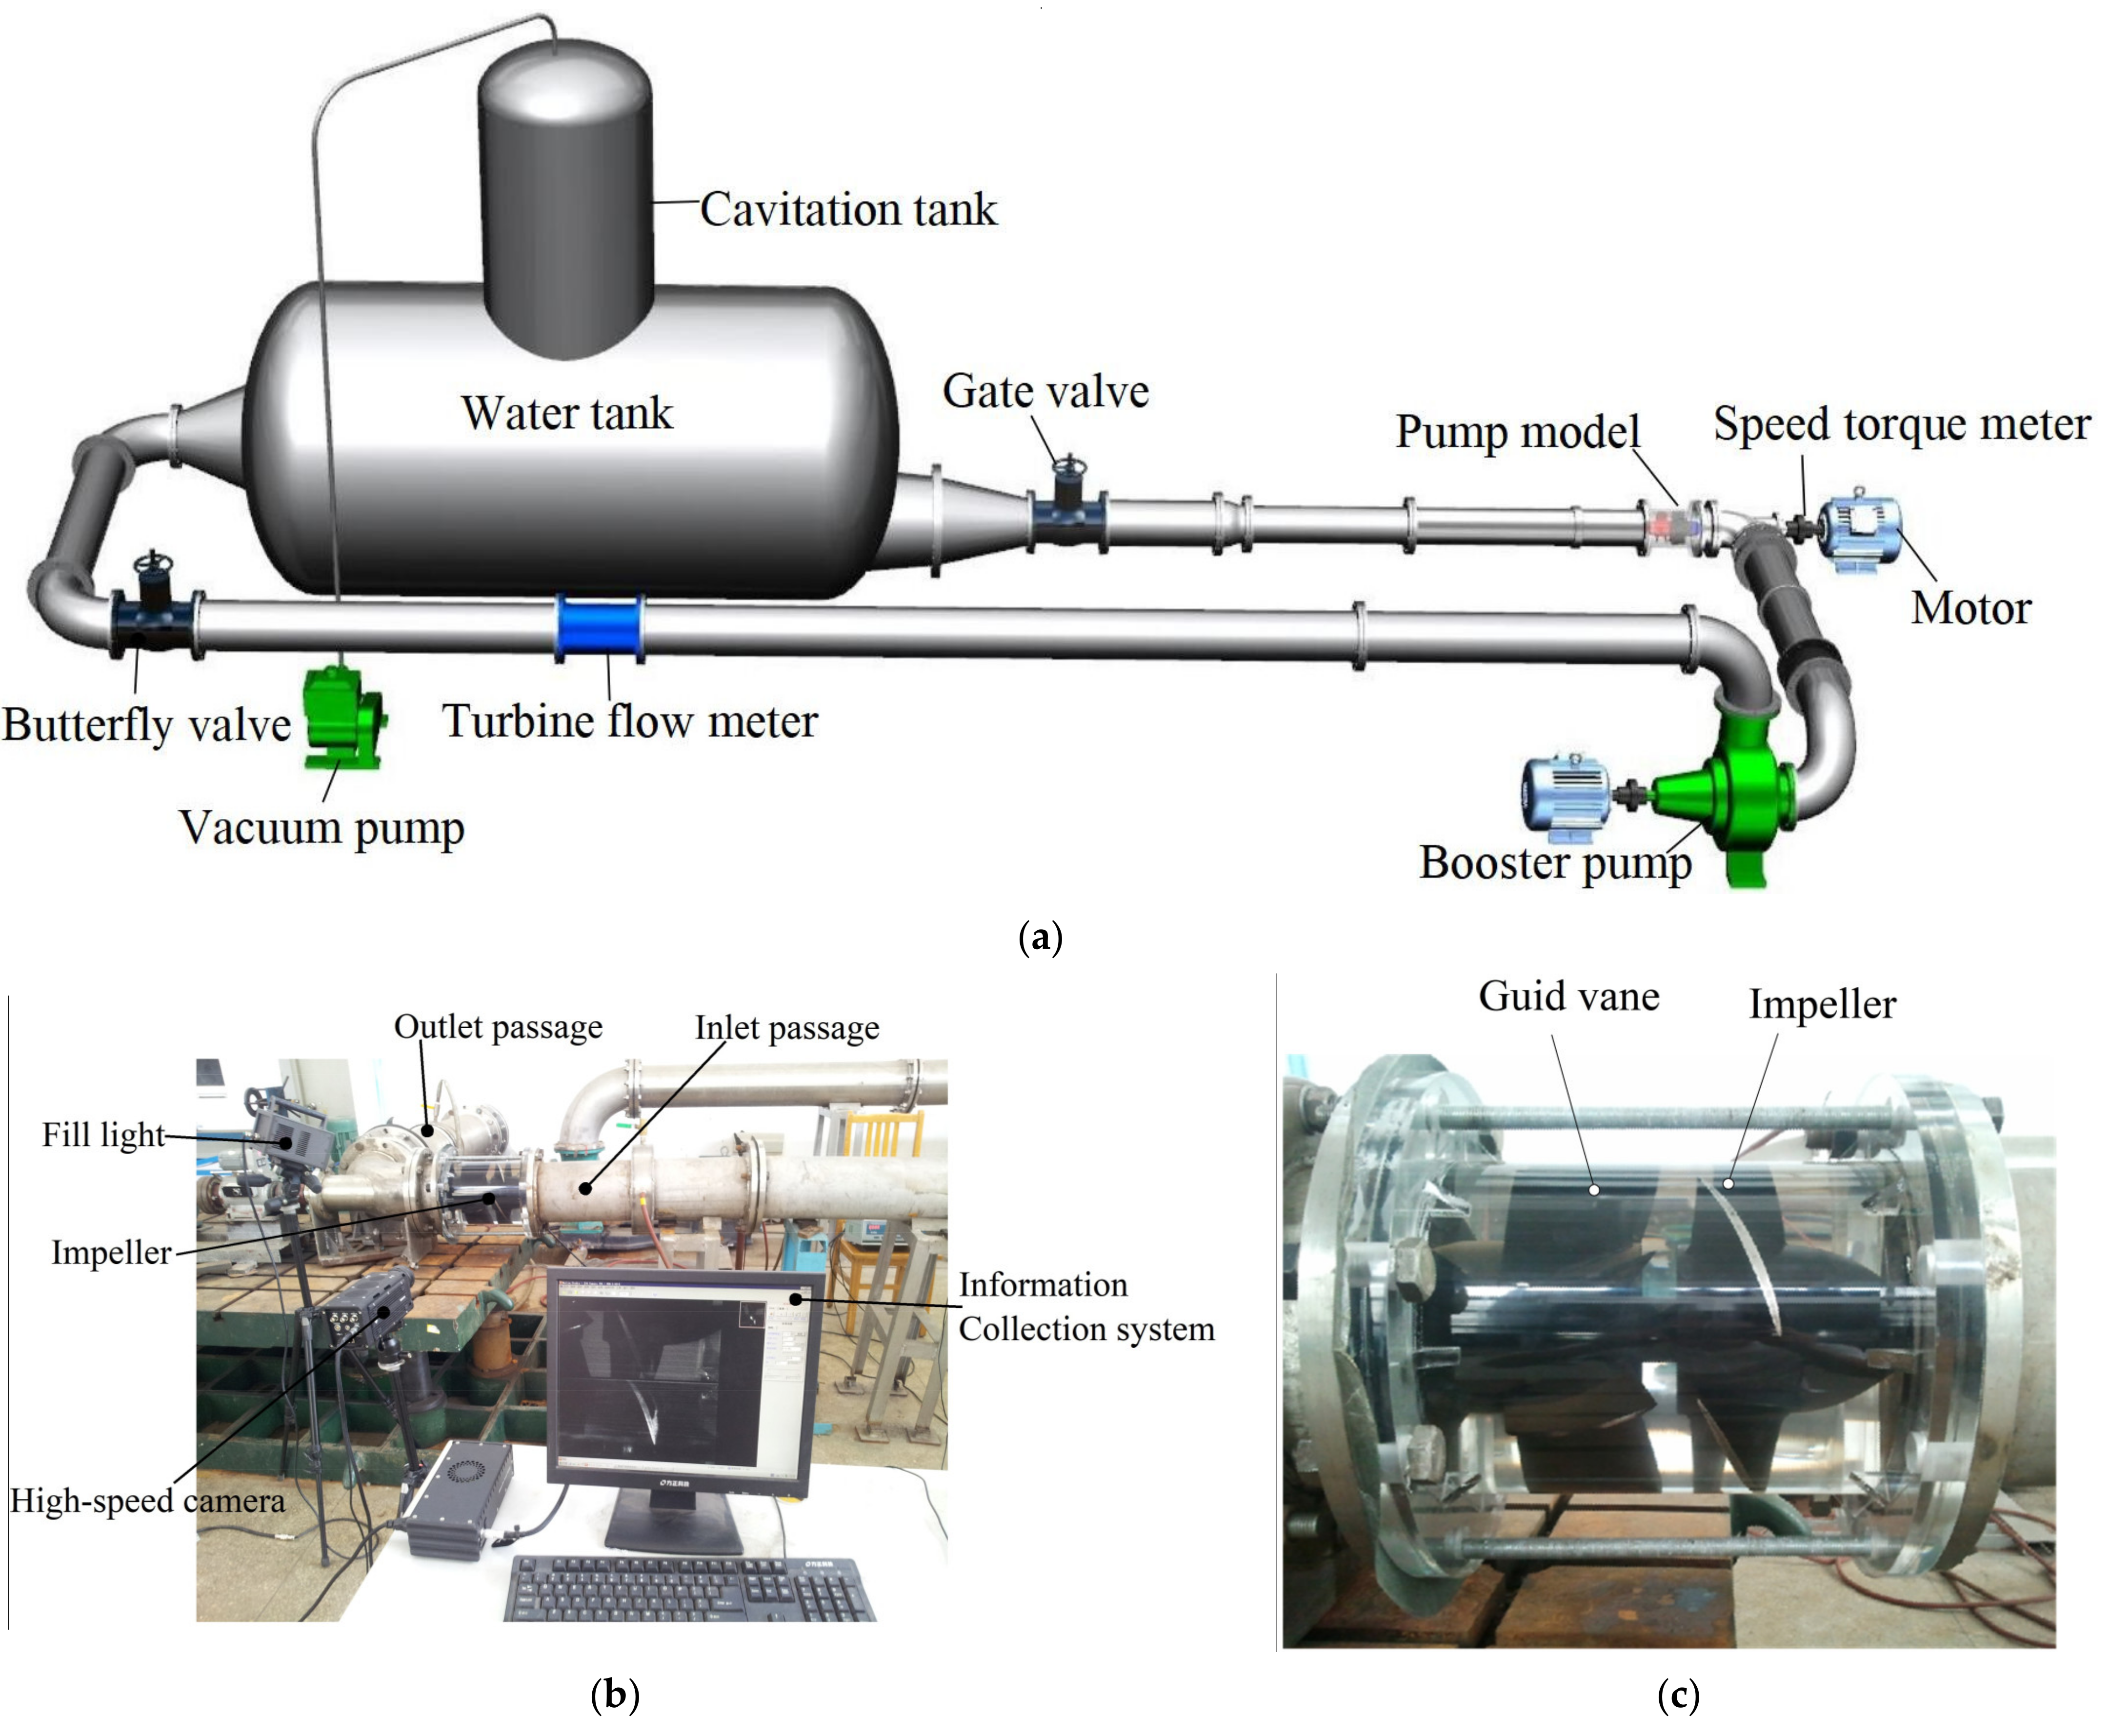
2.4. Experimental Device and Numerical Calculation Result Verification

Figure 3 shows the equipment for the tests of the axial-flow pump’s external characteristics and the cavitation experiment. The test loop consisted of a gate valve, an axial-flow pump model, a butterfly valve, a boosting pump, a turbine flow meter, and a water tank, as shown in Figure 3a. A cavitation tank located above the loop was connected to a vacuum pump, which was used to adjust the pressure at the pump inlet to achieve different cavitation number conditions. The water tank with a large water storage capacity kept the flow and water temperature relatively stable. A honeycomb wall was installed in the center of the water tank to improve flow uniformity and reduce the scales of inflow turbulence. Pressure transducers were installed in the inlet and outlet pipe of the pump to calculate the pump head. The flow rate was measured by a turbine flow meter. The speed torque meter was installed to measure the shaft speed and power.
The high-speed imaging system consisted of a high-speed camera, a macro lens, fill lights, and an information collection system, as shown in Figure 3b. The impeller and guide vane of the experimental section were covered with transparent glass, as shown in Figure 3c. The cavitation bubble image of the tip area was recorded by the high-speed camera.
(1) The steady-state calculations were carried out to obtain the pump head H. The applicability of the mesh and turbulence model was verified by the comparison of the external characteristics experiment and the numerical simulations. Compared with the experimental results, the calculation error was less than 5%, as shown in Figure 4.
(2) Under the QBEP standard operating conditions, transient calculations were carried out. The obtained images of the cavitation volume fraction isosurface ( α v = 0.1 ) were compared with the experimental flow images under the same working conditions ( σ = 0.53 ). As shown in Figure 5, the numerical simulation result was close to the experimental result.

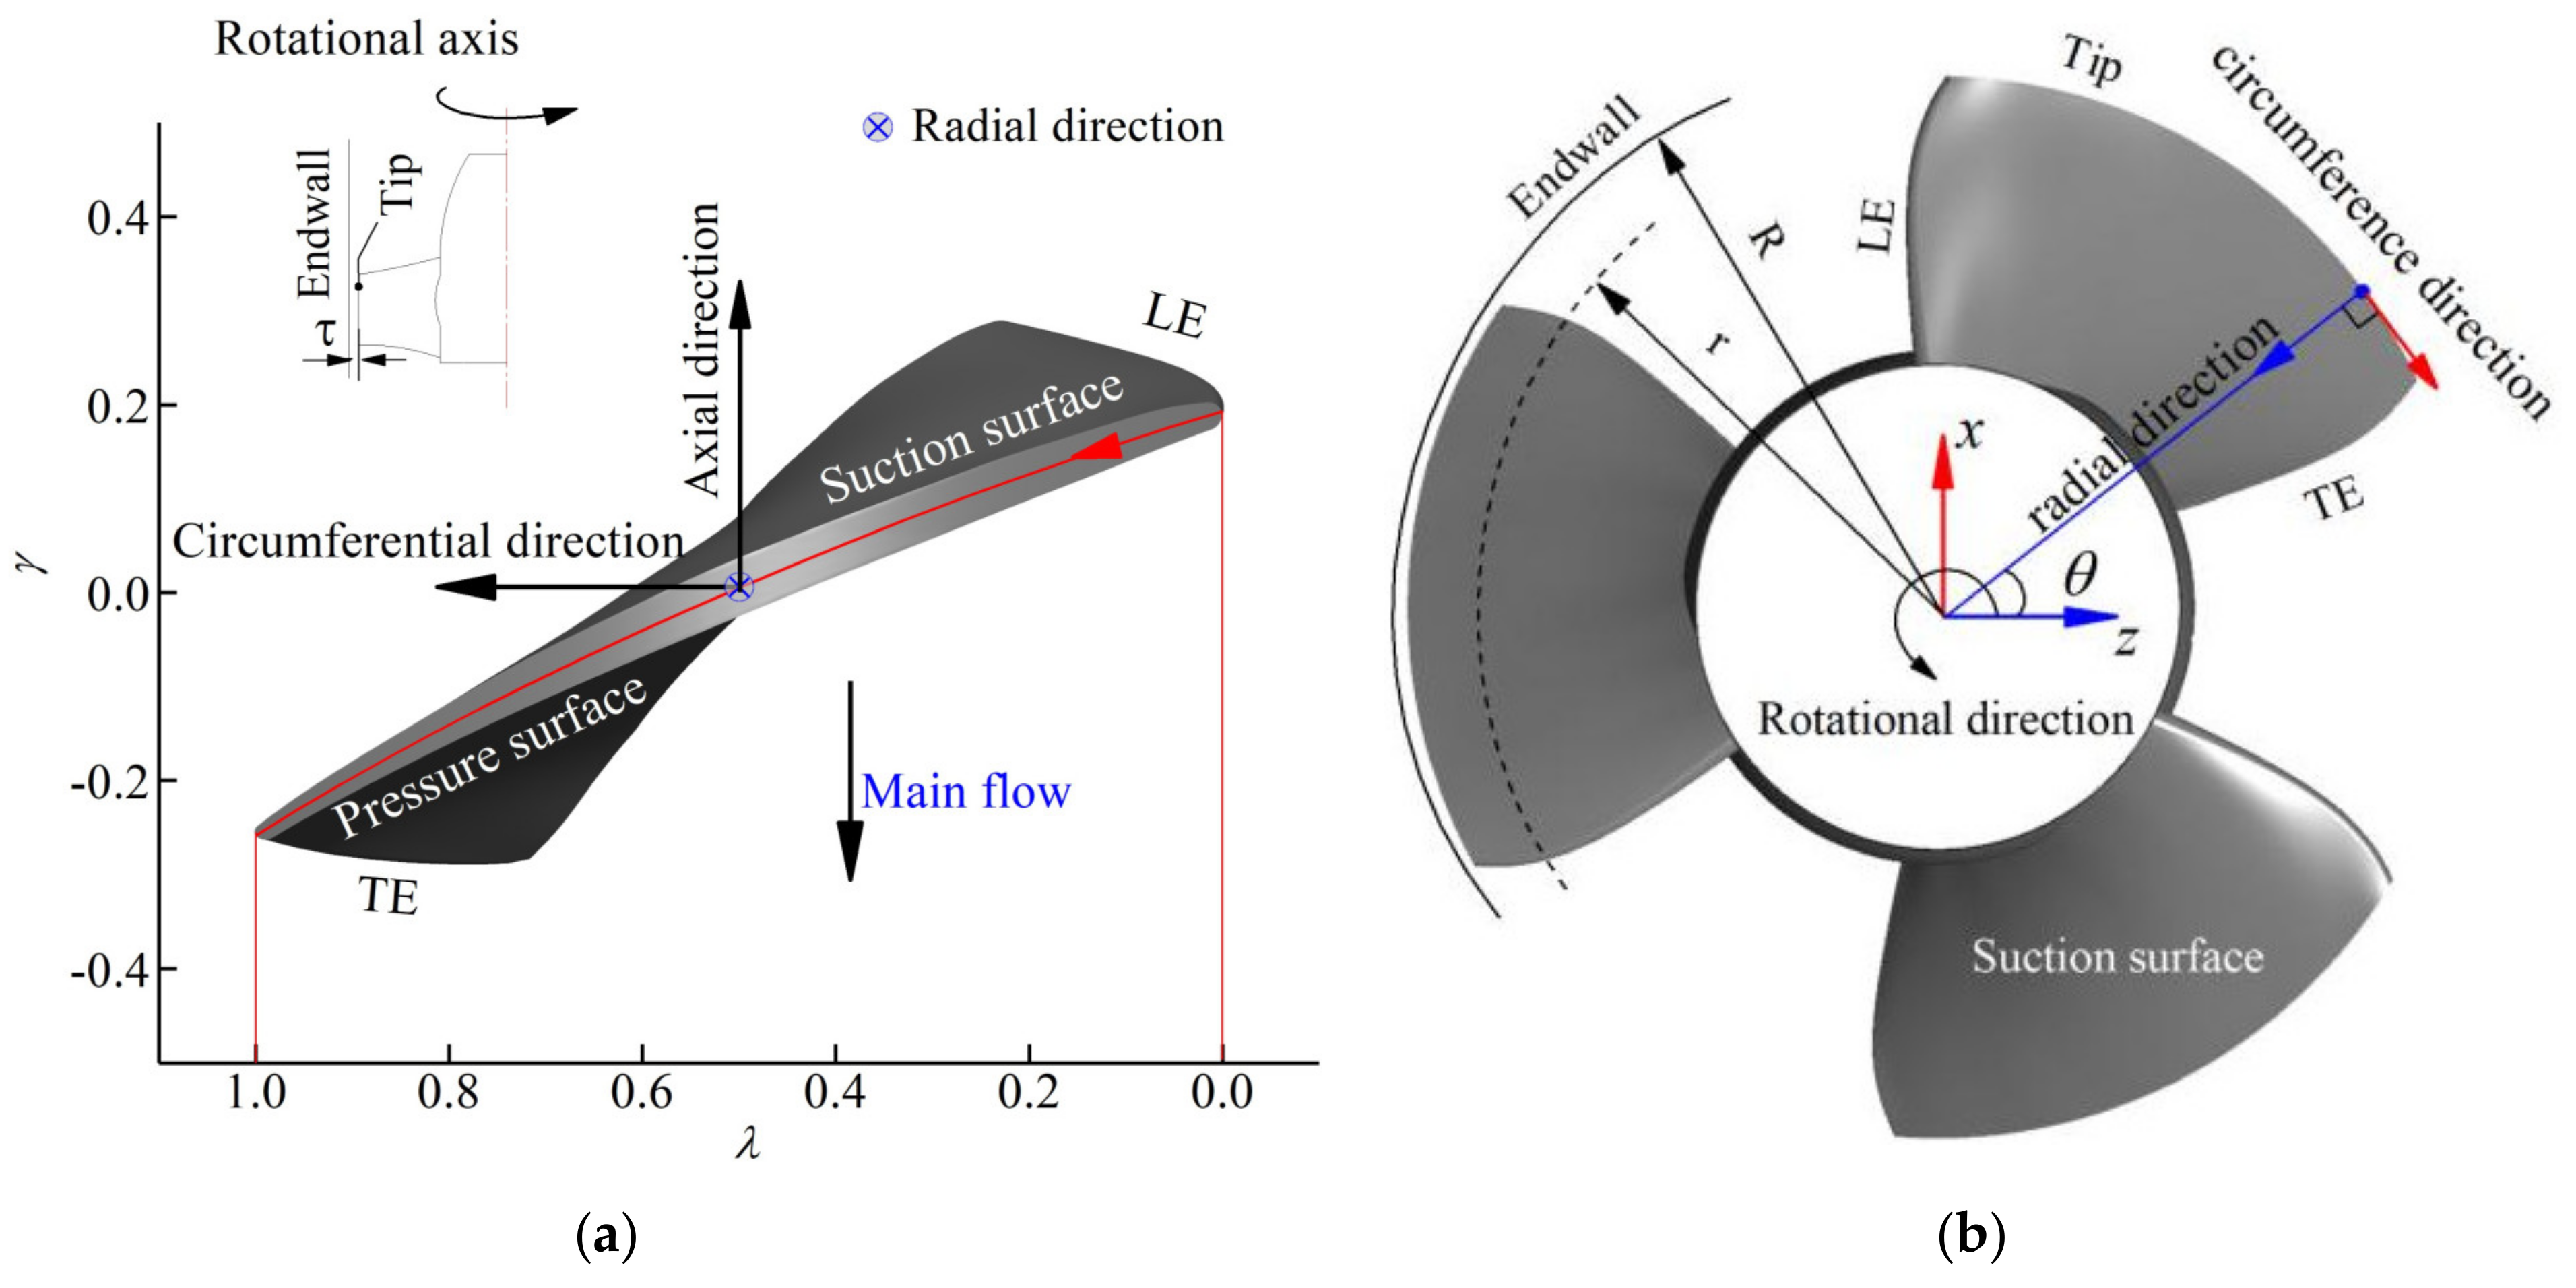
2.5. Geometric Definition of Impeller

Figure 6 defines the blade chord coefficient λ, axial coefficient γ, and radial coefficient r*. The circumferential direction is the tangential direction corresponding to the circle of revolution and is perpendicular to the radial direction. The axial direction is aligned with the y-axis, as shown in Figure 2b. The chord coefficient is λ. The leading edge (LE) of the blade λ is 0, and the trailing edge (TE) λ is 1. The chordwise direction was from LE to TE. The main flow direction was from the pump inlet to the outlet. The radial coefficient r* = r/R, and the axial coefficient γ = y/R were defined, where r is the radius of any point of the blade, and R is the radius of the impeller chamber, with a size of 100 mm.

3. Results and Discussion

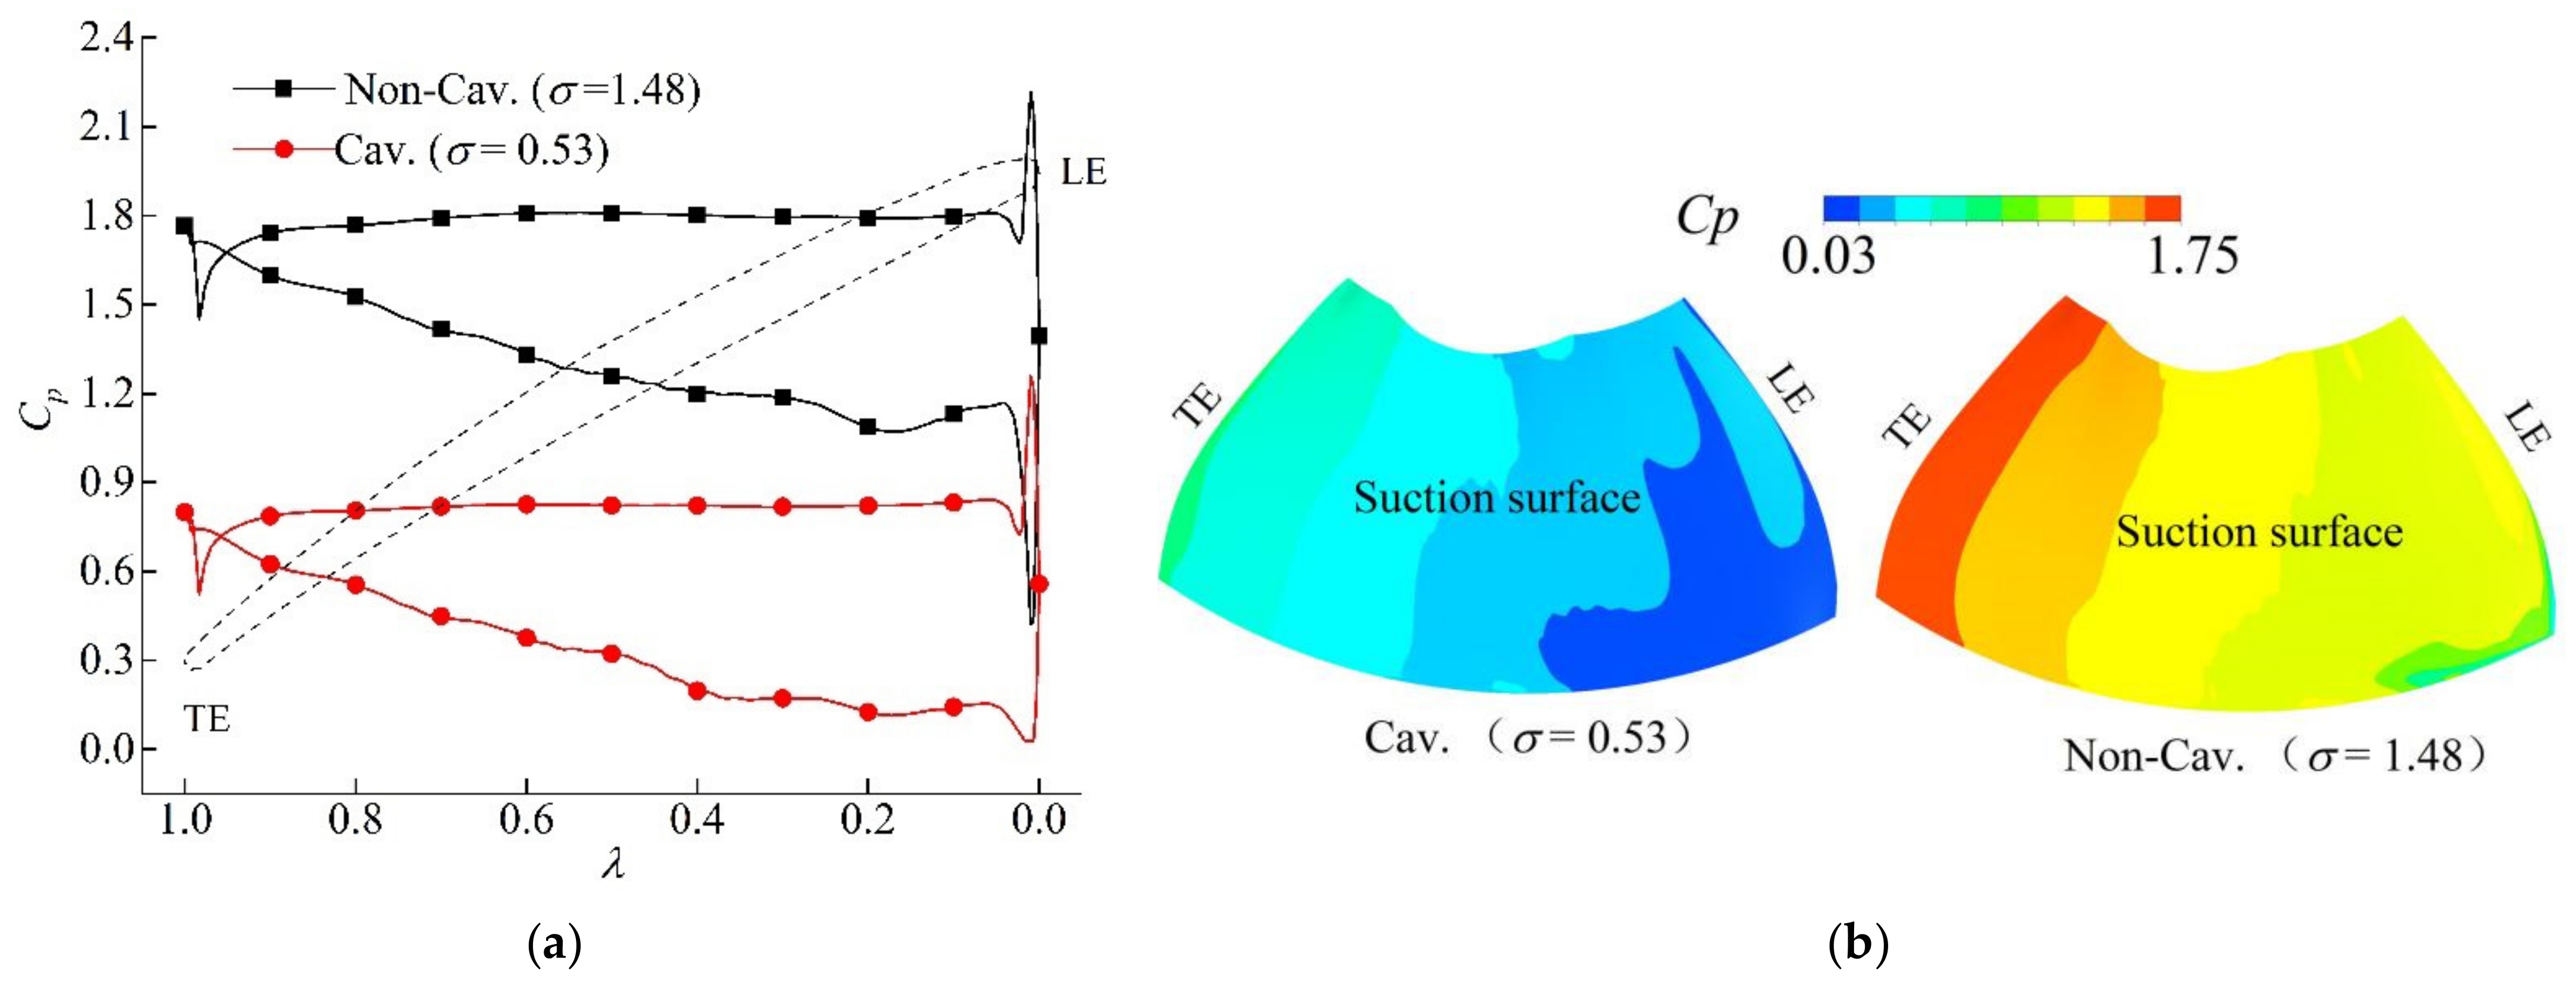
3.1. Pressure Coefficient Distribution

The pressure difference between the pressure surface and the suction surface of the blade was the cause of the clearance leakage flow and the TLV. The pressure coefficient Cp is defined as follows:
C p = p / 0.5 ρ U tip 2
where p is the static pressure. Figure 7a shows the pressure coefficient distribution curve, which was obtained by taking several groups of points along the radial direction of the blade pressure surface and suction surface to obtain the average pressure values. The pressure difference at the leading edge of the blade was large and gradually decreased along the chordwise direction. The pressure in the cavitating case was lower than that in the non-cavitating case. However, the distribution of the pressure difference in the two cases was relatively consistent. Figure 7b shows that the pressure on the suction surface of the leading edge was low and gradually increased along the chord. In the case of σ = 0.53, the pressure on the suction surface near the leading edge clearance reached the saturated vapor pressure required for cavitation.

3.2. Tip Clearance Flow Structure and Vortex Core Trajectory

3.2.1. Topology of Gap Flow Vortex Structure

Figure 8 shows the clearance leakage flow pattern and its vortex distribution, which shows the velocity streamlines, the Q-criterion isosurface (value of 3 × 10⁶ s−2), and the circumferential vorticity. The clearance flow started from the leading edge and flowed from the pressure surface through the gap to the suction surface. Above the suction surface, a clear TLV structure formed. The leakage flow also moved circumferentially from the leading edge to the trailing edge. The leakage velocity at the leading edge was large, and the velocity gradually decreased along the chord. From the perspective of the Q-criteria vortex structure, the isosurface was basically coincident with the streamlines of the spiral structure. An elongated vortex structure appeared above the top wall side of the proximal blade. The vortex structure was an induced vortex (IV), and the vortex revolution direction was clockwise, as shown in Figure 8. In addition, there were tip separation vortices (TSVs) on the blade tip, covering most of the tip area.
In the cavitating case, vortex collapse and fragmentation structures existed locally, which were due to the interactions between the vortex and cavity, resulting in an unstable TLV structure. At the same time, a secondary tip leakage vortex (S-TLV) separated from the TLV in the middle and downstream of the blade. Due to the influence of the cavitation on the vortex, the main vortex could not merge with the S-TLV. In the non-cavitating case, the S-TLV was entrained to the TLV peripheral region, so the main vortex was not easily dissipated and extended further. Therefore, the Q-criteria isosurface was smooth and rounded.
The vorticity distribution of ω c on the transverse sections is also shown in Figure 8. High vorticity was concentrated at the exit of the gap. This was because the leakage flow had a high flow rate at the exit of the gap, where it could easily form a shear layer between the main flow and the leakage flow. Induced vortices with negative vorticity were evident near the endwall.

3.2.2. Tip Leakage Vortex Core Trajectory

In combination with the Q-criterion isosurface and streamline structure, the points with zero axial and radial velocities were selected on each section in Figure 8. These points were the vortex center. The axial and radial trajectories of the TLV were obtained, as shown in Figure 9.
Figure 9a shows the axial height distribution of the vortex core, which gradually decreased along the chordwise direction. In the cavitating case, the vortex center was slightly higher. This was because the vortex interacted with the cavitation, which changed the structure and position of the vortex. The experimental images in Figure 5 show that bubbles were unstable downstream of the blade and prone to collapse, resulting in axial expansion and rising of the vortex center.
Figure 9b shows the radial distribution of the vortex core trajectory. Vapor bubbles formed near the gap upstream of the blades, blocking the radial path of the vortex. As the effect of cavitation on the TLV decreased, the vortex core trajectory gradually developed in the radial direction.

3.3. Effect of Cavitation on Distribution of Physical Quantities

Three transverse planes along the chordwise direction were selected, which were located at the λ = 0.3, 0.5, and 0.7 sections to understand the distribution of the physical quantities at the front, middle, and tail of the blade, respectively. Figure 10 shows the leakage flow structure and vorticity distribution, where the velocity was added to the three-dimensional streamlines and the vorticity was attached to the three planes. The red dotted box highlights the leakage shearing zone, and the black dotted circle shows the TLV center zone. There were cavities above the suction surface upstream of the blade in the cavitating case, and the streamlines were more scattered and messier. In contrast, the streamlines were more concentrated and smoother in the non-cavitating case.

3.3.1. Effect of Cavitation on Vorticity Distribution and Vortex Strength

Figure 11 shows the distribution of vorticity ωc on the three planes (λ = 0.3, 0.5, and 0.7 sections). The vorticity was mainly concentrated in the leakage shear zone and the TLV center zone. The vorticity in the leakage shear zone was derived from the shearing formed by the convection of the leakage flow and the main flow. The leakage flow transported the vorticity to the TLV center zone, supplementing the vorticity there. Affected by cavitation, the vorticity was smaller than that of the non-cavitating case in the TLV center zone of the λ = 0.3 plane. The induced vortex formed in the endwall was entrapped in the periphery of the TLV center zone. The TLV vorticity of the non-cavitating case was relatively concentrated, so the induced vortices were slightly larger.
To further understand the characteristics of the vorticity distribution, the vortex strength was calculated. Taking ωc = 2500 s−1 as the critical value, a black contour line was drawn on the suction surface, and the face surrounded by the contour line was set as FTLV. FTLV basically contained the TLV vorticity and excluded the interference of the other vortices. The vortex strength Γ [22] is defined as follows:
Γ = A ω c d A
where A is the area of the FTLV. The distribution curves of the vortex strength on the different transverse sections were obtained, as shown in Figure 12a. The vortex strength increased first and then decreased in the chordwise direction. It reached its maximum value at λ = 0.8.
Figure 12b shows the distribution curves of A and the average vortex strength Γa. The vortex strength per unit area, which is called the average vortex strength Γa, was obtained by dividing Γ by the value of A. Cavitation resulted in an increase in the TLV distribution area. At the same time, cavitation accelerated the dissipation of the vortex, so the curve of A dropped rapidly at the trailing edge of the blade. Correspondingly, Гa for the cavitating case was significantly smaller than that for the non-cavitating case upstream of the blade.

3.3.2. Effect of Cavitation on Pressure Pulsation

Monitoring points were set at the position shown in Figure 10 above the suction surface, whose radial size was the same as that at the edge wall of the blade tip. The monitoring points were set to rotate with the impeller, and their relative positions with the impeller remained unchanged. The pressure pulsation curves of the monitoring points were obtained, as shown in Figure 13. According to the figure, the pressure pulsation changed smoothly in the non-cavitating case, while it changed sharply in the cavitating case. In the cavitating case, the pressure pulsation amplitude at the leading edge was small, and then it gradually increased and reached the maximum at the trailing edge. Under the influence of the S-TLV, the pressure of the λ = 0.7 section at point T1 was significantly reduced, but the pressure pulsation amplitude was greater. It was still affected by the entrainment of the main vortices and the falling off of the cavitation vortices. In the two cases, the pressures near the vortices were relatively low, the amplitude of the pressure pulsation was closely related to the distribution of the cavitation, and the pressure pulsation at the edge of the vortex cavitation bubble was large. The comparison showed that the vortex had little effect on the formation of the pressure pulsation. Instead, the development, evolution, and even rupture of the cavitation cavity were the causes of the pressure pulsation.

3.3.3. Effect of Cavitation on the Vortex Structure

Figure 14 shows that the pressure of the σ = 0.53 case was lower than that of the σ = 1.48 case, and the pressure at the center of the vortex was the lowest. The white line in the figure represents the isovalue of the vapor volume fraction (αv = 0.1). In the case of σ = 0.53, a large-scale cavity appeared near the leading edge, which was consistent with the experiment results. After the cavity was formed, the vortex expanded and contracted in the radial and axial directions. The vortex structure changed from a circular shape to a spindle shape. The S-TLV vortex core center appeared at the λ = 0.7 section in the σ = 0.53 case, while it did not appear at the same position in the σ = 1.48 case. This was because the main vortex was far from the suction surface in the rear part of the blade, and the entrainment capacity was weak in the cavitating case. Therefore, the S-TLV had difficulty converging with the main vortex. Since there was no cavitation near the vortex center in the σ = 1.48 case, the entrainment capacity of the TLV was strong. Compared with the σ = 0.53 case, the TLV center was closer to the suction surface, so the secondary vortex was integrated with the main vortex.

3.3.4. Effect of Cavitation on Vortex Propagation Velocity

Figure 15 shows the circumferential velocity distribution of the TLV, which reflects the transmission capacity of the vortex. When the speed was low, the vortex tended to accumulate in one place, causing the vortex to develop in a radial direction. In the case of σ = 0.53, cavitation occurred in the TLV center zone, where the mixed vapor and liquid interacted with each other. The leakage flow could not easily form a uniform velocity, and Vc decreased due to the mutual shear between the fluids. In addition, the secondary vortex was separated from the main vortex, which also reduced the value of Vc.
In the case of σ = 1.48, the vortex center was not affected by cavitation. Under the superimposed action of the impeller rotation and leakage flow, the value of Vc in the vortex center was relatively large, forming an independent leakage vortex flow, as shown in Figure 10.

3.3.5. Effect of Cavitation on Turbulent Kinetic Energy

The TLV was generated by the mutual shear between the leakage flow and the main flow. This process was accompanied by the generation and development of turbulent kinetic energy k. As shown in Figure 16, when cavitation occurred, the cavity clusters occupied the position of the original leakage flow and the main flow convection, thereby inhibiting the formation of turbulent kinetic energy.

3.4. Analysis of Influence of Cavitation on Vortex Evolution

The vorticity transport equation is derived from the momentum equation of the Navier–Stokes equations [31], which is expressed as follows:
V t + ( V ) V = 1 ρ m p + g + ν 2 V + ν 3 ( V )
where V is the velocity, ν is the kinematic viscosity, and ω is the vorticity. Taking the curl of both sides of Equation (9) yields the vorticity transport equation:
D ω D t = ( ω ) V ω ( V ) + ρ m × p ρ m 2 + ν 2 ω
where D ω D t is the rate of change of the vorticity with time, ( ω ) V is the vortex stretching and bending term caused by velocity gradients, ω ( V ) is the vortex dilation term that results from the vortex volume expansion and contraction caused by velocity divergence, ρ m × p ρ m 2 is the vortex baroclinic torque term caused by the non-parallelism of the isodensity surface and the isopressure surface, and ν 2 ω is the viscous generation and diffusion term caused by the viscosity of the fluid. Since the vortex direction of the leakage flow is mainly circumferential, only the circumferential vorticity ω c was analyzed in this study.

3.4.1. Vortex Stretching and Bending Term

Figure 17 shows that when the leakage flow had a velocity gradient in the circumferential direction, the vortex stretched or contracted. When the leakage flow had a velocity gradient in the radial or axial direction, the vortex was bent. The vortex stretching and bending term can be decomposed into the sum of three subitems, as follows:
( ω c ) V = [ ( ω c ) V ] c + [ ( ω c ) V ] a + [ ( ω c ) V ] r
The first term on the right side of Equation (11) is the vortex stretching and shrinking term, the second term is the axial bending term, and the third term is the radial bending term.
In the non-cavitating case, Figure 10 shows that the velocity gradually decreased along the chordwise direction, and the vortex stretching term was negative. Figure 18 shows the distribution of the dimensionless stretching term, where the vortex in the TLV center zone was shrinking. In the cavitating case (σ = 0.53), the term was positive, and the vortex was in a state of extension on the plane λ = 0.5, in contrast to the non-cavitating case. Cavitation could change the distribution of the velocity gradient. The vortex contraction was delayed and appeared on the λ = 0.7 plane, while the value of the non-cavitating case was close to zero. Since the position in the leakage shearing zone was basically not affected by cavitation, the distributions of the stretching and bending term in the two cases were similar, and the vortices were stretched by the leakage flow.
After the leaking jet flowed out from the tip clearance, the jet had velocity gradient components in the axial and radial directions, causing the TLV vortex tube to bend in the axial and radial directions. Figure 19 and Figure 20 show the distribution of the dimensionless bending term. In the case of σ = 1.48, the bending term had a larger value at the λ = 0.3 section and then gradually decreased at the λ = 0.5 and 0.7 sections. However, in the case of σ = 0.53, due to the influence of the cavitation at the leading edge, the bending term was delayed. The bending term was almost zero at the λ = 0.3 section and then gradually increased at the λ = 0.5 section, which was consistent with the vortex core trajectory.

3.4.2. Vortex Dilation Term

The change of the fluid volume will lead to an increase or decrease in the moment of inertia, which is accompanied by a change of the vorticity. When the volume increased, the vortex radius increased and the vorticity decreased, and vice versa. The dimensionless dilation term of the vortex center was basically negative, as shown in Figure 21, indicating that the volume expanded and the vorticity decreased. When affected by cavitation, the volume expansion was more significant. At the λ = 0.7 section, the cavity at the interface between water and vapor was extremely unstable, as shown in the dotted area. The cavity collapse caused the volume shrinkage and vorticity to increase.

3.4.3. Vortex Baroclinic Torque Term

Cavitation changed the density distribution, leading to a change of the vortex baroclinic torque term. Figure 22 shows the distribution of the dimensionless baroclinic torque term. This term was largest in the TLV center zone, where vorticity generation and dissipation occurred simultaneously in the case of σ = 0.53. Since cavitation did not occur in the σ = 1.48 case, the value of this term was small.

3.4.4. Viscous Generation and Dissipation Term

Due to the viscosity of the fluids, flow shear will be formed between fluids with velocity gradients, and vortices will be generated, diffused, and dissipated during this process. Figure 23 shows the distribution of the viscous generation and dissipation term. The generation and dissipation terms in the gap and leakage shearing zone had large values. The distributions in the two calculation cases were relatively consistent, indicating that cavitation had little impact on this term. The term in the TLV center zone was relatively small, indicating that the velocity gradient in this region was relatively small. On the λ = 0.5 and 0.7 planes, the vortex viscous dissipation term (negative value) was larger than the vortex viscous generation term (positive value). This was the reason that the vorticity gradually decreased in the chordwise direction.

4. Conclusions

(1)
In this work, cavitation was found to have little effect on the distribution of the pressure difference in the chordwise direction, but cavitation could change the TLV vortex structure and leakage flow characteristics. Cavitation changed the TLV vortex core trajectory and kept the vortex center away from the suction surface in the axial direction. The TLV was blocked by the vapor bubbles in the radial direction upstream of the blades.
(2)
Cavitation affected the distribution of the TLV average vortex strength Γa, increasing the distribution area of the vortices on the transverse sections. This made the vortex distribution more dispersed, thereby reducing the value of Γa, especially upstream of the blade.
(3)
Vortices were not the main cause of the pressure pulsation. The pressure pulsation was caused by cavitation evolution or even fracture.
(4)
Cavitation had an influence on the circumference velocity of the TLV center, and the vortex propagation velocity decreased. At the same time, cavitation inhibited the shear between the main and leakage flows, thus reducing the turbulent kinetic energy.
(5)
Cavitation could change the vortex stretching term and delay the vortex bending term. In addition, the vortex dilation term drastically changed at the vapor–liquid interface downstream of the blade, which was due to the rapid change of the vorticity caused by the instability of the cavity.

Author Contributions

Conceptualization, H.Z. and W.S.; Investigation and writing, H.Z. and J.W.; Validation, H.Z. and D.Z.; Visualization, H.Z., W.S., and J.W.; Methodology, H.Z., W.S. and J.Z.; Software, H.Z. and J.Z.; Formal analysis, H.Z., W.S. and J.W.; Resources, D.Z. and H.Z.; Funding acquisition, D.Z. and J.W.; Supervision, W.S. All authors have read and agreed to the published version of the manuscript.

Funding

This research was funded by the National Natural Science Foundation of China (51776087) and the Equipment Pre-Research Fund Project(8151440002).

Institutional Review Board Statement

Not applicable.

Informed Consent Statement

Not applicable.

Data Availability Statement

The numerical and experimental data used to support the findings of this study are included within the article.

Conflicts of Interest

The authors declare no conflict of interest.

Nomenclature

Q BEP Design flow rate
H Pump head
d 2 Outlet diameter
d 1 Inlet diameter
d t Hub diameter
τ Tip clearance size
r Radius
R Radius of the impeller chamber
r * Radial coefficient
γ Axial coefficient
λ Chord length coefficient
U tip Tip velocity
V Velocity
V c Circumferential velocity
k Turbulence kinetic energy
p Static pressure
μ Laminar viscosity
μ t Turbulent eddy viscosity
Ω Rotor angular velocity
l chord Chord length (m)
ω c Circumferential vorticity
C p Pressure coefficient
σ Cavitation number
Γ Vortex strength
Γ a Average vortex strength
A Area of FTLV
υ Kinematic viscosity
α v Vapor volume fraction

References

  1. Rains, D.A. Tip Clearance Flows in Axial Compressors and Pumps. Ph.D. Thesis, California Institute of Technology, Pasadena, CA, USA, 1954. [Google Scholar]
  2. Miorini, R.L.; Wu, H.; Katz, J. The internal structure of the tip leakage vortex within the rotor of an axial Water jet pump. J. Turbomach. 2012, 134, 031018. [Google Scholar] [CrossRef]
  3. Wu, H.; Miorini, R.L.; Katz, J. Measurements of the tip leakage vortex structures and turbulence in the Meridional plane of an axial water-jet pump. Exp. Fluids 2011, 50, 989–1003. [Google Scholar] [CrossRef]
  4. Wu, H.; Miorini, R.L.; Tan, D.; Katz, J. Turbulence within the tip-leakage vortex of an axial waterjet pump. AIAA J. 2012, 50, 2574–2587. [Google Scholar] [CrossRef]
  5. You, D.; Wang, M.; Moin, P.; Mittal, R. Large-eddy simulation analysis of mechanisms for viscous losses in a turbomachinery tip-clearance flow. J. Fluid Mech. 2007, 586, 177–204. [Google Scholar] [CrossRef] [Green Version]
  6. Doligalski, T.L.; Smith, C.R.; Walker, J.D.A. Vortex Interactions with Walls. Annu. Rev. Fluid Mech. 1994, 26, 573–616. [Google Scholar] [CrossRef]
  7. Tan, D.; Li, Y.; Wilkes, I.; Vagnoni, E.; Miorini, R.L.; Katz, J. Experimental Investigation of the Role of Large Scale Cavitating Vortical Structures in Performance Breakdown of an Axial Waterjet Pump. J. Fluids Eng. 2015, 137, 111301. [Google Scholar] [CrossRef]
  8. Tran, B.N.; Jeong, H.; Kim, J.H.; Park, J.-S.; Yang, C. Effects of Tip Clearance Size on Energy Performance and Pressure Fluctuation of a Tidal Propeller Turbine. Energies 2020, 13, 4055. [Google Scholar] [CrossRef]
  9. Hsiao, C.T.; Chahine, G.L. Scaling of tip vortex cavitation inception noise with a bubble dynamics model accounting for nuclei size distribution. J. Fluids Eng. 2005, 127, 55–65. [Google Scholar] [CrossRef]
  10. Zhang, D.; Shi, L.; Shi, W.; Esch, V.; PM, B.; Zhao, R. Numerical analysis of unsteady tip leakage vortex cavitation cloud and unstable suction-side-perpendicular cavitating vortices in an axial flow pump. Int. J. Multiph. Flow 2015, 77, 244–259. [Google Scholar] [CrossRef]
  11. Shi, L.; Zhang, D.; Jin, Y.; Shi, W.; van Esch, B.P.M. A study on tip leakage vortex dynamics and cavitation in axial-flow pump. Fluid Dyn. Res. 2017, 49, 035504. [Google Scholar] [CrossRef]
  12. Guo, Q.; Zhou, L.; Wang, Z. Numerical evaluation of the clearance geometries effect on the flow field and performance of a hydrofoil. Renew. Energy 2016, 99, 390–397. [Google Scholar] [CrossRef]
  13. Qiu, C.; Huang, Q.; Pan, G.; Shi, Y.; Dong, X. Numerical simulation of hydrodynamic and cavitation Performance of pump jet propulsor with different tip clearances in oblique flow. Ocean Eng. 2020, 209, 107285. [Google Scholar] [CrossRef]
  14. You, D.; Wang, M.; Moin, P.; Mittal, R. Effects of tip-gap size on the tip-leakage flow in a turbo machinery cascade. J. Phys. Fluids 2006, 18, 105102. [Google Scholar] [CrossRef] [Green Version]
  15. You, D.; Wang, M.; Moin, P.; Mittal, R. Vortex Dynamics and Low-Pressure Fluctuations in the Tip-Clearance Flow. J. Fluids Eng. 2007, 129, 1002–1014. [Google Scholar] [CrossRef]
  16. Dreyer, M. Mind the Gap: Tip Leakage Vortex Dynamics and Cavitation in the Axial Turbines. Ph.D. Thesis, Swiss Federal Institute of Technology in Lausanne (EPFL), Lausanne, Switzerland, 2015. [Google Scholar]
  17. Zhang, M.A.; Huang, B.A.; Qian, Z.B.; Liu, T.A.; Wu, Q.A.; Zhang, H.A.; Wang, G.A. Cavitation flow structures and corresponding hydrodynamics of a transient pitching hydrofoil in different cavitation regimes. Int. J. Multiph. Flow 2020, 132, 103408. [Google Scholar]
  18. Decaix, J.; Dreyer, M.; Balarac, G.; Farhat, M.; Münch, C. RANS computations of a confined cavitating tip-leakage vortex. Eur. J. Mech. B Fluid. 2018, 67, 198–210. [Google Scholar] [CrossRef] [Green Version]
  19. Ji, B.; Luo, X.; Arndt, R.E.; Wu, Y.L. Numerical simulation of three dimensional cavitation shedding dynamics with special emphasis on cavitation-vortex interaction. Ocean Eng. 2014, 87, 64–77. [Google Scholar] [CrossRef]
  20. Ji, B.; Luo, X.; Wu, Y.L.; Liu, S.H.; Xu, H.Y.; Oshima, A. Numerical investigation of unsteady cavitating turbulent flow around a full scale marine propeller. J. Hydrodyn. 2010, 22, 705–710. [Google Scholar] [CrossRef]
  21. Cheng, H.Y.; Bai, X.R.; Long, X.P.; Ji, B.; Farhat, M. Large eddy simulation of the tip-leakage cavitating flow with an insight on how cavitation influences vorticity and turbulence. Appl. Math. Model. 2019, 77, 788–809. [Google Scholar] [CrossRef]
  22. Zhao, Y.; Wang, G.; Jiang, Y.; Huang, B. Numerical analysis of developed tip leakage cavitating flows using a new transport-based model. Int. Commun. Heat Mass. 2016, 78, 39–47. [Google Scholar] [CrossRef]
  23. Guo, Q.; Huang, X.; Qiu, B. Numerical investigation of the blade tip leakage vortex cavitation in a waterjet pump. Ocean Eng. 2019, 187, 106170. [Google Scholar] [CrossRef]
  24. Dreyer, M.; Decaix, J.; Münch-Alligné, C.; Farhat, M. Mind the gap: A new insight into the tip leakage vortex using stereo-PIV. Exp. Fluids 2014, 55, 1–13. [Google Scholar] [CrossRef]
  25. Zhang, D.; Shi, W.; van Esch, B.; Shi, L.; Dubuisson, M. Numerical and experimental investigation of tip leakage vortex trajectory and dynamics in an axial flow pump. Comput. Fluids 2015, 112, 61–71. [Google Scholar] [CrossRef]
  26. Zhang, D.; Shi, W.; Pan, D.; Dubuisson, M. Numerical and Experimental Investigation of Tip Leakage Vortex Cavitation Patterns and Mechanisms in an Axial Flow Pump. J. Fluids Eng. Trans. Asme 2015, 137, 121103. [Google Scholar] [CrossRef]
  27. Huang, R.; Ji, B.; Luo, X.; Zhai, Z.; Zhou, J. Numerical investigation of cavitation-vortex interaction in a mixed-flow waterjet pump. J. Mech. Sci. Technol. 2015, 29, 3707–3716. [Google Scholar] [CrossRef]
  28. Chen, J.; Huang, B.; Wang, Y.; Wang, G. Numerical investigation of cavitation-vortex interaction with special emphasis on the multistage shedding process. Appl. Math. Model. 2021, 96, 111–130. [Google Scholar] [CrossRef]
  29. Yuan, J.; Chen, Y.; Wang, L.; Fu, Y.; Zhou, Y.; Xu, J.; Lu, R. Dynamic Analysis of Cavitation Tip Vortex of Pump-Jet Propeller Based on DES. Appl. Sci. 2020, 10, 5998. [Google Scholar] [CrossRef]
  30. Zhao, X.; Liu, T.; Huang, B.; Wang, G. Combined experimental and numerical analysis of cavitating flow characteristics in an axial flow waterjet pump. Ocean Eng. 2020, 209, 107450. [Google Scholar] [CrossRef]
  31. ANSYS, Inc. ANSYS CFX-Solver Theory Guide, Release 17.1; SAS IP, Inc.: Canonsburg, PA, USA, 2016; pp. 77–90. [Google Scholar]
  32. Heydari, M.; Sadat-Hosseini, H. Analysis of propeller wake field and vortical structures using k-Omega SST Method. Ocean Eng. 2020, 204, 107247. [Google Scholar] [CrossRef]
  33. Smirnov, P.E.; Menter, F.R. Sensitization of the SST Turbulence Model to Rotation and Curvature by Applying the Spalart-Shur Correction Term. J. Turbomach. 2009, 131, 1–8. [Google Scholar] [CrossRef]
  34. Zwart, P.; Gerber, A.G.; Belamri, T. A two-phase model for predicting cavitation dynamics. In Proceedings of the ICMF 2014 International Conference on Multiphase Flow, Yokohama, Japan, 30 May–3 June 2004; p. 152. [Google Scholar]
Figure 1. Axial−flow pump geometry. (a) Computational domain; (b) Impeller blade geometry.
Jmse 09 00775 g001
Figure 2. Mesh of the axial-flow pump and Y+ distribution. (a) Mesh of computational domain; (b) Mesh of main components; (c) Y+ distributions on the blade surfaces.
Jmse 09 00775 g002
Figure 3. Experimental equipment of the axial-flow pump to examine the external characteristics and cavitation. (a) The axial-flow pump loop; (b) High-speed imaging system; (c) Test section.
Jmse 09 00775 g003
Figure 4. Comparison of the axial-flow pump’s σ–H curves from the numerical simulation and experiments.
Jmse 09 00775 g004
Figure 5. Comparison of the cavitation experiment and numerical calculation results of the axial-flow pump (σ = 0.53).
Jmse 09 00775 g005
Figure 6. Geometric definition of the impeller. (a) Chord length coefficient λ and axial coefficient γ; (b) Radial coefficient r*.
Jmse 09 00775 g006
Figure 7. Pressure coefficient distribution of blade surface. (a) Curves of the pressure coefficient; (b) Pressure coefficient distribution on the suction surface.
Jmse 09 00775 g007
Figure 8. Three—dimensional leakage streamlines with velocity and Q—criterion isosurface (value of 3 × 10⁶ s−2) for the axial—flow pump.
Jmse 09 00775 g008
Figure 9. Trajectory of TLV core. (a) Axial distribution; (b) Radial distribution.
Jmse 09 00775 g009
Figure 10. Comparison of cavitation on the vortex structure and vorticity (ωc) distribution (the white solid point is the pressure pulsation monitoring point, the velocity is added to the three—dimensional streamlines, and the vorticity is attached to the three planes).
Jmse 09 00775 g010
Figure 11. Comparison of the vorticity (ωc) distribution on the three planes for the cavitating case (upper) and non-cavitating case (lower) (the solid point is the vortex center, and the black line represents the isovalue of the vorticity (ωc = 2500 s−1)).
Jmse 09 00775 g011
Figure 12. Comparison of the vortex strength and vortex area distribution for the cavitating case (σ = 0.53) and non-cavitating case (σ = 1.48). (a) Vortex strength Γ distribution curve; (b) Distribution curves of average vortex strength Γa and vortex area A.
Jmse 09 00775 g012
Figure 13. Comparison of pressure fluctuation curves at different monitoring points for the cavitating case (upper) and non-cavitating case (lower).
Jmse 09 00775 g013
Figure 14. Comparison of the pressure distributions on the three planes for the cavitating case (upper) and non-cavitating case (lower) (the solid point is the vortex center, and the white line represents the isovalue of the vapor volume fraction (αv = 0.1)).
Jmse 09 00775 g014
Figure 15. Comparison of circumferential velocity Vc distribution on the three planes for the cavitating case (upper) and non-cavitating case (lower) (the solid point is the vortex center, and white line represents the isovalue of the vapor volume fraction (αv = 0.1)).
Jmse 09 00775 g015
Figure 16. Comparison of the turbulent kinetic energy k distribution on the three planes for the cavitating case (upper) and non-cavitating case (lower) (the solid point is the vortex center, and the white line represents the isovalue of the vapor volume fraction (αv = 0.1)).
Jmse 09 00775 g016
Figure 17. Deformation of the vortex caused by velocity gradients. (a) Vortex stretching term; (b) Vortex bending term.
Jmse 09 00775 g017
Figure 18. Comparison of the stretching term distribution on the three planes for the cavitating case (upper) and non-cavitating case (lower).
Jmse 09 00775 g018
Figure 19. Comparison of the axial bending term distribution on the three planes for the cavitating case (upper) and non-cavitating case (lower).
Jmse 09 00775 g019
Figure 20. Comparison of the radial bending term distribution on the three planes for the cavitating case (upper) and non-cavitating case (lower).
Jmse 09 00775 g020
Figure 21. Comparison of the vortex dilation term distributions on the three planes for the cavitating case (upper) and non-cavitating case (lower).
Jmse 09 00775 g021
Figure 22. Comparison of the vortex baroclinic torque term distributions on the three planes for the cavitating case (upper) and non-cavitating case (lower).
Jmse 09 00775 g022
Figure 23. Comparison of viscous generation and dissipation term distributions on the three planes for the cavitating case (upper) and non-cavitating case (lower).
Jmse 09 00775 g023
Table 1. Pump geometry and reference data.
ParametersValue
Number of rotor blades [Zi]3
Number of stator blades [Zd]7
Optimum flow rate [QBEP]0.101 m3 s−1
Rotor diameter [d3]197 mm
Hub diameter [dt]90 mm
Inlet diameter [d1]200 mm
Outlet diameter [d2]250 mm
Tip clearance [τ]1.5 mm
Tip velocity [Utip]15.18 m s−1
Rotor angular velocity [Ω]151.84 rad s−1
Table 2. Grid independent results.
Test CaseMesh NodesMesh TopologyConvergence PrecisionHead
(m)
Efficiency
(%)
Coarse A3,875,547Structured10−52.8972.47
Refined B6,861,485Structured10−52.9673.35
Refined C9,947,173Structured10−52.9673.35
Publisher’s Note: MDPI stays neutral with regard to jurisdictional claims in published maps and institutional affiliations.

