Abstract
Artificial reefs (ARs) have been widely used to restore the seabed habitat and protect biodiversity. They can effectively increase the dissolved oxygen content in the bottom water layer by their disturbing effect of upwelling and downwelling. The bottom water is prone to hypoxia in summer due to the extreme weather of the global climate and excessive biomass in some marine ranching in northern China. Therefore, how to effectively use the upwelling effect of artificial reefs to alleviate this problem is a necessary subject of research. Generally, ARs are arranged by different intervals in a unit form on the seafloor, and the flow field effect is different from that of the individual reefs. However, few studies have been focused on the effect of layout mode on the flow field of a unit reef (UR). In this paper, we selected the interval between reefs (IR) and the angle of inflow (AI) as the influencing factors to study the flow field effect of UR. The upwelling and wake regions of 64 URs were presented by the efficiency and disturbance indices related to the flow characteristics and proposed an optimal layout mode having the best performance of the upwelling effect. The results showed that the interactions among the AI, the transverse, and longitudinal IRs were significant, and the AI has a significant influence on the flow field. These indices were effective and contribute to the layout optimization of UR. The AI close to 45° has a significant influence on the flow field effect of UR.
1. Introduction
Artificial reefs (ARs), as man-made permeable structures, are widely used in biodiversity conservation and coastal habitat restoration in marine ranching engineering [1,2,3,4]. After the settlement of ARs, a complex hydrodynamic condition is formed in a certain range around the ARs. For example, due to the block of an AR, a slow flow region full of complex eddies will form behind the AR, also known as the wake region. This turbulent region full of eddies can cause the physical aggregation of plankton, crustaceans, and fish [5,6,7,8,9,10]. Simultaneously, there is an upwelling region above the AR, which can enhance the exchange and transport of nutrients between the upper and lower water layers and is conducive to the improvement of primary productivity. This is one of the basic principles for AR to perform its function on the flow field.
Moreover, the upwelling has higher chlorophyll concentration (Chl a) and lower sea surface temperature (SST), which can also promote the improvement of surface primary productivity [11]. For a small-scale area such as marine ranching, nutrient exchange in regional water also needs a continuous driving force. ARs can change the original seabed topography, and the upwelling formed by them plays a necessary role in regulating the flow in a small sea area [12,13,14,15].
At present, many research results have been obtained based on the analysis of flow field effect of individual AR, mainly focusing on opening ratio, inlet velocity, angle of inflow (AI), and characterization of drag coefficient [9,16,17,18,19,20,21]. However, AR is generally arranged and released in the form of a combination of several ARs, which is often called AR module, AR set or AR group [22]. In order to facilitate the statistics and expression of the number of ARs, it also called unit reef (UR). Different combinations of UR will produce different flow field effects. Therefore, a reasonable layout mode can effectively promote water exchange, improve water quality, and enhance biodiversity in the areas surrounding ARs [23,24,25,26,27].
The common layout modes of UR were usually in the form of piles, such as rock reefs, which were used to multiply sea cucumber in northern China. Li et al. [28] studied the flow field effect of three kinds of tube artificial reef piles under different inlet velocities. However, this form of layout mode is prone to collapse due to the impact of the ocean current. For large ARs, such as those made of concrete, they were usually arranged in an array combination. Woo et al. [8] presented effective layout modes of labyrinth artificial concrete reef (LTACRs) based on the wake volume. Kim et al. [29] selected four marine forest artificial reefs (MFARs) frequently used in South Korea to simulate the flow field in order to analyze the spreading pattern and range of seaweed spores. The interval between reefs (IR) was determined by the wake length of the single-type AR, and the optimal flat layout mode was selected based on the wake volume and flow characteristics. It was concluded that the major wake length has important significance to guide further research on the IRs. At present, the studies on upwelling only focus on the height and the upwelling flow rate of the individual reefs [9,21], and rarely consider the influence of AR layout mode.
In recent years, during high temperatures and rainy summers, the bottom water of AR areas dominated by rock reefs in northern China has formed hypoxic areas. This causes the death of sea cucumbers and other benthic organisms that proliferate in AR areas, which induces ecological and environmental disasters [30,31,32]. Our previous research [9,13,21] showed that structural optimization can significantly improve the upwelling effect of AR. However, if we want to solve the regional hypoxia phenomenon in marine ranching, it needs to be solved by the upwelling effect of UR, and it is also necessary to optimize the layout mode of UR. A reasonable combination of ARs, such as IRs and AIs, can improve the overall flow field effect of UR and enhance the disturbance efficiency between the bottom and the upper water layer in the artificial reef area.
In this article, we adopted the CFD method to analyze the influence of IR and AI on the formation of the flow field of UR, focusing on the effect of the upwelling and wake region with the efficiency index and the disturbance index. This study can provide a scientific reference for the layout optimization of UR.
2. Materials and Methods
2.1. Reef Module
In this article, the upwelling reef designed in our previous research [9] was used as the research object, which is composed of four isosceles triangles and right triangles as shown in Figure 1. The flow field effect produced by the upwelling reef has a wider range, higher upwelling height, and more complex flow patterns.
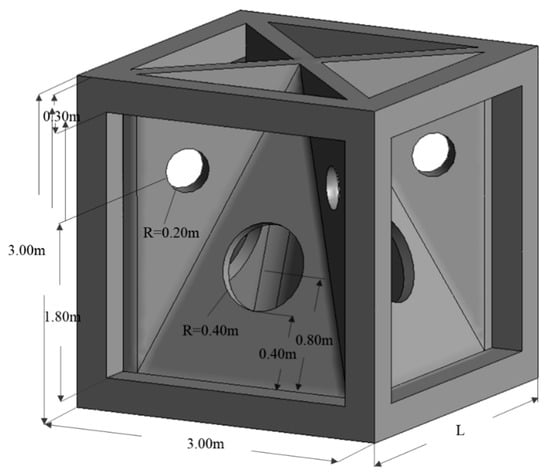
Figure 1.
The upwelling reef.
2.2. Numerical Simulation
2.2.1. Layout Mode
In this study, nine upwelling reefs were combined into a UR, which is shown in Figure 2. The IR is measured by the length of the upwelling reef (L). Both the longitudinal IR (h1) and the transverse IR (h2) were set to 1 L, 4/3 L 5/3 L, and 2 L, respectively. The AI was set to 0°, 15°, 30°, and 45° respectively (Figure 3). These three influence factors and their levels produced a total of 64 combinations of ARs. The flow field effects of these combinations were used to analyze the interaction among the influencing factors. The optimal h1, h2, and AI were identified according to large upwelling and downwelling regions.
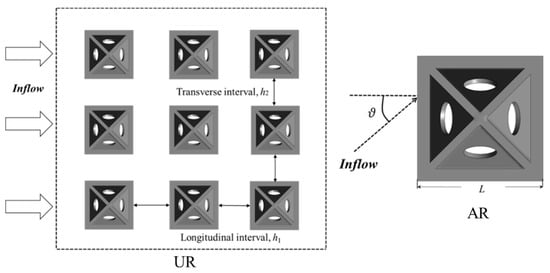
Figure 2.
The UR and AI. Note: θ: angle of inflow.
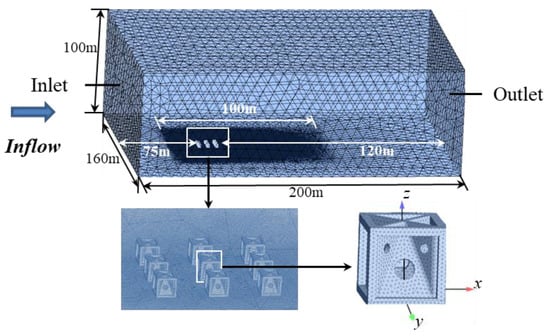
Figure 3.
Computational domain and the grid division.
2.2.2. Governing Equation and Turbulence Model
ANSYS Fluent [33] was used to simulate the flow field of URs in this article. The flow was assumed to be Newtonian, which is incompressible and viscous around ARs. The finite volume method was utilized to discretize the Navier-Stocks equations. The method of calculating the turbulent motion was solved by the RNG k-ε model, which could effectively simulate the flow with a minor turbulence structure and more uniform distribution [34], and it has been well applied in many researches of AR with complex structures [9,15,21,25,28,35]. The analysis of the pressure and velocity coupling chose the SIMPLEC algorithm, and the second-order upwind method was used for spatial discretization. Convergence was assumed as the residuals fell below 10−5.
2.2.3. Computational Domain and Boundary Condition
The location of ARs and the grid division of the computational domain are shown in Figure 3, and the bottom center of the AR located in the center of the UR was set as the coordinate origin. Although there are 64 combinations of ARs in this study, h1 and h2 have little effect on the ranges of these combinations. Gambit software was used to establish models and construct a cuboid computational domain with 200 m × 160 m × 100 m. In order to determine the appropriate numerical simulation method, three simulation schemes were set. Three small domains with respective dimensions of 70 m × 60 m × 40 m, 100 m × 80 m × 60 m and 120 m × 100 m × 40 m were separately added inside the cuboid computing domain to achieve the purpose of grid refinement around UR. By contrast, the refined meshing method by a domain with 100 m × 80 m × 60 m generated more than 1.5 million unstructured grids for each case, which is more than the other two methods and improved the accuracy and credibility of the simulation results [13,21]. The initial boundary conditions were set as follows:
- (1)
- The inlet boundary condition was set as 0.5 m/s, which is a general practice in Shandong Province, and the turbulent parameters were obtained by the parameters of the computational domain.
- (2)
- The outlet of the computational domain was set as a pressure-free outlet with a pressure gradient of 0.
- (3)
- The top surface of the computational domain was set as a moving wall without shear force and the same velocity as the inflow.
- (4)
- The bottom of the computational domain was set as a stationary no-slip wall boundary condition.
- (5)
- The other sides were set as symmetrical boundaries.
2.3. Upwelling Region
As shown in Figure 4, the height and area of upwelling are often used as the indices to describe the upwelling region and characterize the size and velocity profile of a certain plane [9,21]. However, these indices of the same reference plane are not enough to represent the overall characteristics of the upwelling region of URs. Therefore, the volume of upwelling was adopted to evaluate the upwelling effect of URs (Figure 5). The upwelling region in this article mainly refers to a flow region concentrated on the top of AR, and the velocity in the y-direction in this region is generally greater than 5% of the inflow velocity [11,23]. A larger upwelling volume can generate a stronger water exchange, which is beneficial to improve the exchange efficiency of nutrients between different water layers [9,21,25].
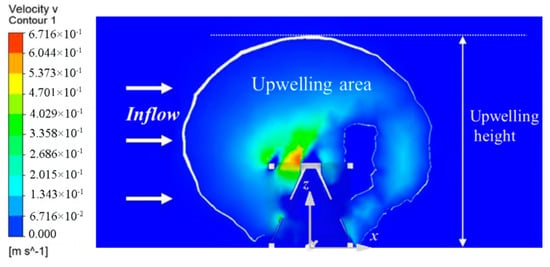
Figure 4.
Velocity profile of the x-z plane (y = 0).
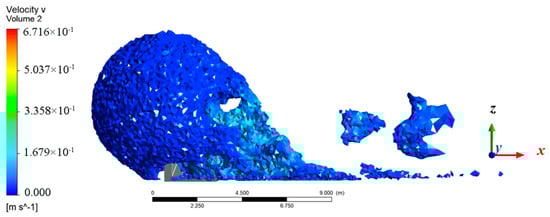
Figure 5.
Upwelling volume.
2.4. Wake Region
The wake region is a reflux area behind the AR where the flow velocity is relatively slow and the flow pattern is complicated (Figure 6). It is supposed to be the region that provides habitat, foraging, enemy avoidance, and spawning for marine organisms [29]. Similar to the upwelling region, it is difficult to describe all the characteristics of the wake region only by the size of the influence range or the flow velocity of a certain plane. Kim et al. [5] proposed the wake volume concept based on the element-based finite-volume method. Therefore, the characteristics of the wake region can be further quantitatively analyzed by calculating its volume, to estimate the habitat space of marine organisms. The water region where the velocity in the -x-direction is greater than 5% of the inflow was defined as the wake region in this article, as shown in Figure 7. This is consistent with the definition of upwelling volume in this article, which can provide a strong disturbance effect, promote the exchange efficiency of the bottom water, and help to break the stratification of the water body.
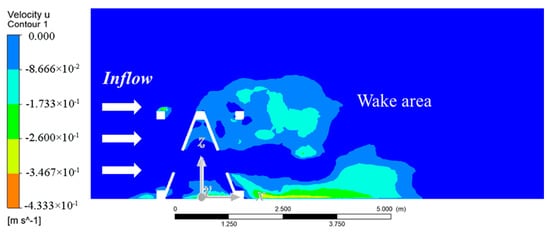
Figure 6.
Wake region of the x-z plane (y = 0).
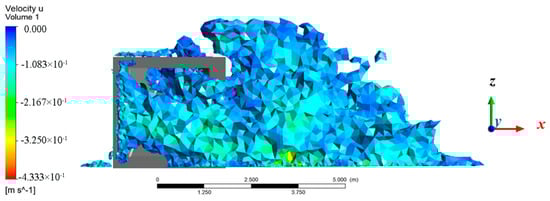
Figure 7.
Wake volume.
2.5. Evaluation Index
Three-dimensional index parameters can better evaluate the effects of upwelling [9,21] and wake region [24,29], which is better than the two-dimensional index. The dimensionless indices of the ratio of upwelling volume to reef volume and the ratio of wake volume to reef volume can quantitatively analyze the flow field effect of UR.
In this article, we presented four indices, φ1, φ2, φ3, and φ4, to evaluate the flow field effect of UR, which are the upwelling efficiency index, the wake efficiency index, the efficiency index of the downwelling, and the disturbance intensity index of the upper and lower water layers near the ARs. These indicators are as follows:
where vup refers to the volume of the upwelling region; vm represents the volume of URs.
where vw refers to the volume of the wake region.
where vdown refers to the volume of the downwelling region (the flow velocity in the -y-direction is greater than 5% of the inflow velocity).
The numerical simulation results of 64 URs with different layout modes were imported into CFD-POST to calculate the above four indices, to compare and analyze the interaction among the influencing factors and verify the effectiveness of these indices.
2.6. Statistics
The data were analyzed by SPSS 20.0. The results were analyzed relatively with a single variable and multi-factor analysis of variance. The differences were considered to be significant if p < 0.05.
3. Results
3.1. Effects of IR on Flow Field Effect of UR
Figure 8 shows the flow field effects of URs with 16 combinations of h1 and h2 at four inflow velocities evaluated by the φ1 and φ2. Table 1 shows the optimal combination of maximum φ1 and φ2 at each AI. The evaluation results of the indices of φ1 and φ2 show that the URs formed by the combinations of longitudinal and transverse IRs with the best benefit of the upwelling region also have the better benefit of wake region.
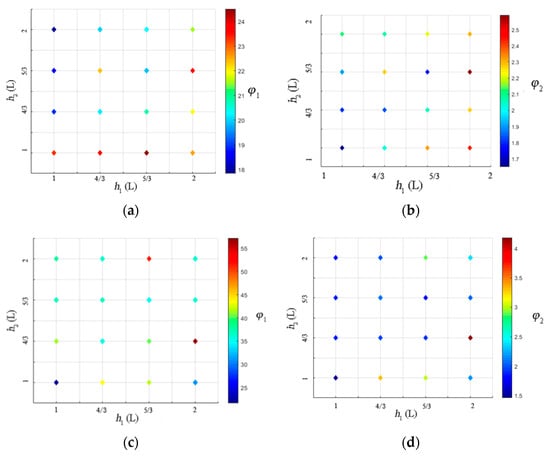
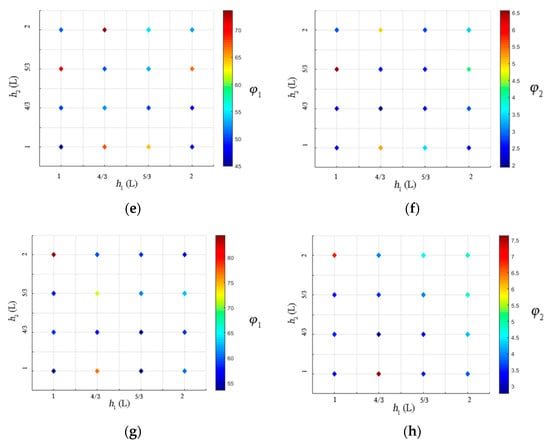
Figure 8.
Efficiency indices of four combined URs with different AIs and IRs. Note: (a): Upwelling efficiency index at 0°; (b): Wake efficiency index at 0°; (c): Upwelling efficiency index at 15°; (d): Wake efficiency index at 15°; (e): Upwelling efficiency index at 30°; (f): Wake efficiency index at 30°; (g): Upwelling efficiency index at 45°; (h): Wake efficiency index at 45°.

Table 1.
The optimal combination of efficiency indices.
Taking the upwelling volume range of the upwelling as an example, the upwelling can affect the distance of 1 L on both sides of the reef (Figure 9). When the h2 is set to 1 L, the superposition of upwelling volume formed between two reefs will not only accelerate the velocity of upwelling, but the height of upwelling will also increase to 5 times that of the reef.
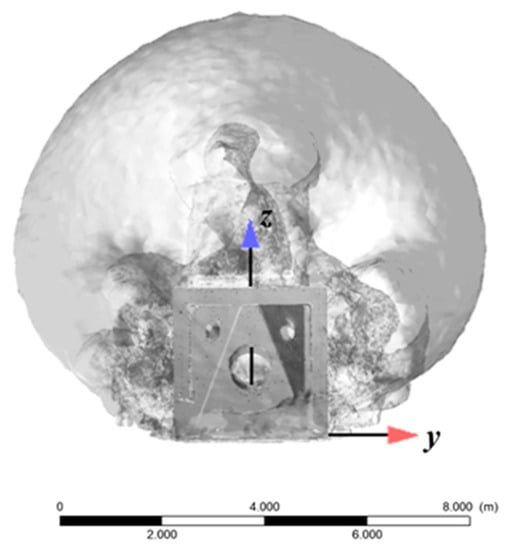
Figure 9.
Transverse influence range of upwelling of the upwelling reef (y-z plane).
Figure 10 shows that the length of the wake region is about 2 L. The velocity contour diagrams of the section in x-direction show that the coverage area of the backflow or slow flow at the position of 1 L and 4/3 L behind the reef is much larger than the areas at the position of 5/3 L and 2 L. The section between 1 L and 4/3 L behind the reef is in the core area of the wake region and full of vortices, where the current velocity decreases sharply. If the h1 of the combined reefs is set in this section, the inflow velocity of the post AR will be much lower than the initial velocity of inflow, which will affect the efficiency index of UR. The results show that the section between 5/3 L and 2 L behind the reef is a good choice for the h1 of UR. This indicates that the selection of the h1 of UR should consider the extent of the wake region generated by AR. If the h1 is 2 L, the wake region volume of AR is the largest, and the φ2 of UR is also the largest, about 2.59.
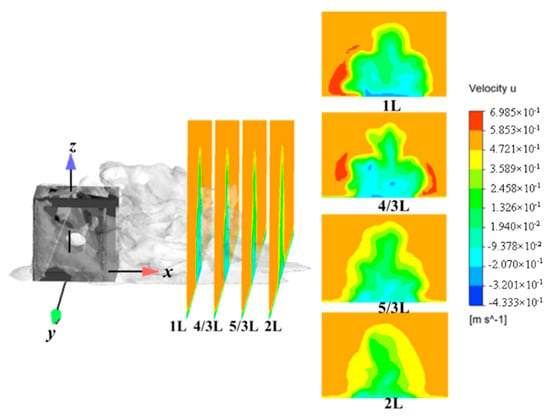
Figure 10.
The volume of the wake region of the upwelling reef with the AI of 0°.
Similarly, under conditions of other AIs, the optimal transverse and longitudinal IR depends on the extent of the upwelling and wake region of an upwelling reef.
3.2. Effects of AI on the Flow Field of URs
Figure 11 and Figure 12 show the changes of the upwelling and wake volumes produced by each combined UR at different AIs. The results show that the volumes of upwelling and wake regions generally demonstrate a rising trend with the increase of AI, and the maximum value basically occurs when the AI is 45°, and a few of them occur when the AI is 30°. The statistical analysis results (Table 2) showed that the interactions among the h1, h2, and AI were significant, and the AI had the most significant influence on the flow field (p = 0.000 < 0.05).
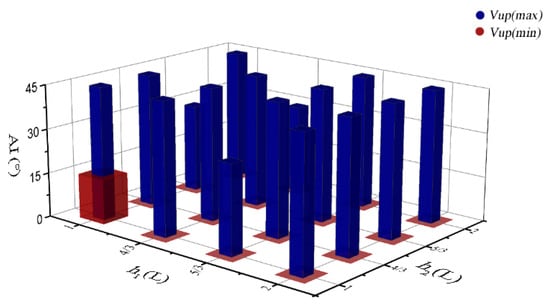
Figure 11.
The maximum and minimum upwelling volumes of URs with different h1, h2, and AI.
Figure 12.
The maximum and minimum wake volumes of URs with different h1, h2, and AI.
Table 2.
The interaction among factors.
It is supposed that the rectangle type formed in the front side of AR with the AI of 45° has less resistance than the plane, and this structure interacts with the other ARs on both sides to form a higher velocity upwelling region, accelerates the flow velocity around the middle ARs, and produces a stronger upwelling. The confluence of these fluids greatly uplifts the upwelling and forms a larger range of upwelling volume. Therefore, the IR can be further extended when the AI is 45° and there is enough space to form the wake region. In addition, the distance between ARs also increases the extent of the wake region, which is formed on the right side behind the ARs and converges into the largest wake region. Therefore, the AI of the URs can be set between 30° and 45°, and the best effect on the flow field is the AI at 45°. While the AI is set between 0° and 15° the effect on the flow field is relatively poor, especially at 0° direction, due to the obvious blocking action among the reefs.
3.3. Effect of URs on Water Exchange
In general, the production of upwelling will inevitably form part of downwelling to achieve water exchange. Strong water exchange can not only promote the exchange of nutrients and improve water quality but also indirectly provide abundant food for fish.
Figure 13 describes the water disturbance efficiency of each UR with different h1, h2, and AI. The φ4 represents the volume ratio of upwelling and downwelling. The closer its value is, the better the water exchange effect will be. To reflect the exchange range of upwelling and downwelling more visually, the lowest 5% of the flow velocity in upwelling and downwelling volume is eliminated to reduce the influence of turbulence. Generally, the upwelling is concentrated in the front and upper part of the front reefs, and the downwelling is generally formed at the rear of the reefs. When the h1, h2, and AI are different, the effective upwelling and downwelling extents of each UR are also different which indicates that they have different disturbance abilities upon water exchange. When the AI is 0°, the φ4 of all URs are relatively high, basically above 3, and the maximum value is 7.52 in the layout mode with h1 of 1 L and h2 of 4/3 L. It is speculated that the lateral currents on both sides of the reef converge, and create a wider and higher upwelling region above the reef. The smaller the h1 is, the stronger the convergence capacity is. Therefore, the effect of upwelling generated is the best when the h1 of 1 L. When the h1 is 4/3 L, the rear reef is located in the wake region of the front reef. The initial inflow velocity of the rear reef is smaller than that of the front reef when h1 is 1 L (Figure 11). In the process of the flowing descent, a large number of fluids with a velocity of less than 5% of the inflow velocity were eliminated due to the weak disturbance ability, resulting in the volume of downwelling generated by the rear reef being much smaller than that of the front reef. Therefore, the volume of upwelling formed by this combined UR is large, the volume of downwelling is small, and the disturbance ability upon water is low. When the AI is 15°, the φ4 of each combined UR is above 2, and the maximum value can be obtained when the h1 is 4/3 L and h2 is 2 L, about 3.92. This may be due to the deflection of the AI, leading to a distance difference with the front reef. When the h1 is 4/3 L and the h2 is 2 L, the distance between the front reefs perpendicular to the direction of the inflow is small. This is conducive to the formation of flow with a high range and high ascent velocity, and, at the same time, merges with the upwelling generated by the blocking of reefs in the middle of UR. The further increase of h1 allows the initial inflow velocity of the rear reefs on the left side to develop, resulting in a larger range of upwelling. However, the downwelling is mainly concentrated on the right side of the rear reefs, and there is no strong disturbance between different water layers due to the slow and weak downwelling. When the AI is 30° or 45°, the φ4 is about 1. This indicates that the volumes of upwelling and downwelling produced by each UR are almost equal, and the values of φ4 are greater than those of 0° and 15°. When the AI is 45°, all the URs have the largest φ4 and the best disturbance effect. It can be inferred that when the AI is close to 45°, the triangular tip structure formed in the front of the AR will help to generate an upwelling region with a higher velocity. The velocity of upwelling will further increase with the change of IR and AI, resulting in a larger volume of downwelling. This makes the disturbance between the water layers more intense, and the amplitude of rising and falling is more obvious.
Figure 13.
The φ4 of URs.
3.4. Flow Field Characteristics of the Optimal URs
According to the results of Section 3.1, these URs with the optimal IRs at each AI were selected as the object of further analysis, and their flow field effects were evaluated by the defined efficiency indices. As shown in Figure 15, the φ1 and φ2 gradually increase with the increase of AI. The maximum φ1 and φ2 are generated by the URs with the AI of 45°, which means that the AI has a more obvious influence on the flow field effect than the IR.
As shown in Figure 14 and Figure 15, the upwelling is mainly concentrated over the front reefs. The upwellings generated by URs with different layout modes are almost symmetrical in their inflow directions. Except for the strong upwelling around the front reefs, the volumes of upwelling generated by other reefs in UR are relatively small and dispersed due to the flow blocking effect of the front reefs. The height of the upwelling is about five times that of individual ARs. The horizontal span of each AR module in this layout is about two times the length of the upwelling reef. The upwelling volume of UR with AI of 15° (Figure 15b) is significantly larger than that with AI of 0° (Figure 15a). It seems that the second row of ARs in the UR further enhances the upwelling. With the increase of the AI, the upwelling of UR tends to spread to the right, and the ARs in the leftmost row produce the longest horizontal span of upwelling, approximately 23 times the length of the upwelling reef. Its height of upwelling is about 6 times the length of the reef. In Figure 16c, the height of upwelling volume with AI of 30° is about 6 times the length of the reef, and the horizontal span is about 28 times. These show that the upwelling deflects, increases, and spreads to the right further with the increase of the AI. The upwelling height of UR with AI of 45° (Figure 15d) is about 8 times the length of the reef, and the horizontal span is about 23 times. The spans of upwelling formed on both sides are the same, and the enclosed space formed above the UR is the largest among the four layout modes.
Figure 14.
Upwelling and wake efficiency indices of the optimal URs with AI of 0°, 15°, 30°, and 45°.
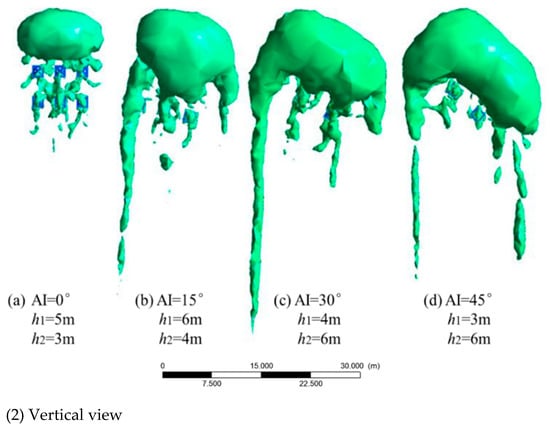
Figure 15.
Upwelling volume of the optimal layout with the AI of 0°, 15°, 30°, and 45° (m3).
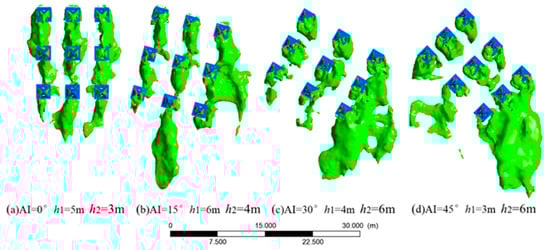
Figure 16.
Wake volume of the optimal layout with the AI of 0°, 15°, 30°, and 45° (m3).
The extent of the wake region generated by each UR is basically the same when the AI is 0°. With the deflection of the AI, the wake flow is gradually concentrated in the right rear of the right reefs and connected as a whole wake region (Figure 16). Combined with the analysis of upwelling volume, these results show that the flow field effect of UR is the most efficient when the AI is 45°.
3.5. Influence of Inflow Velocity on the Flow Field
As stated above, the UR with h1 of 1 L, h2 of 2 L, and the AI of 45° has the best flow field effect. The efficiency indices were used to evaluate the influence of inflow velocity on the flow field effect of the optimized UR. As shown in Figure 17, these indices of the optimized UR fluctuate slightly under the condition of inflow velocity variation, which indicates that the flow field of UR is little affected by the variation of inflow velocity. This is similar to the result of individual AR [25,36,37].
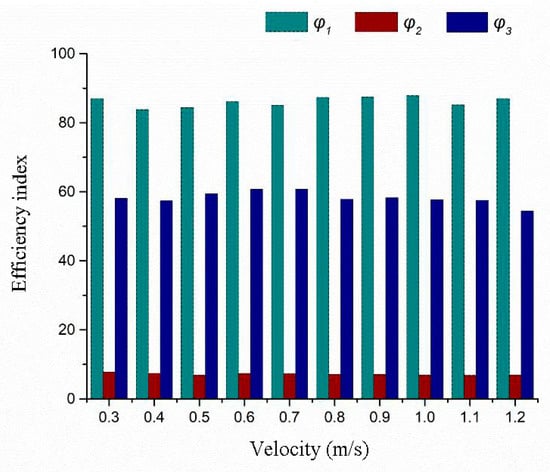
Figure 17.
The efficiency indices of the optimal UR.
4. Conclusions
Artificial reefs laid on the seafloor can not only retard the flow to form a slow flow area for fish to choose their habitats, but also generate upwelling and downwelling to promote the exchange and mixing of water between water layers. However, in the construction of ARs, multiple individual reefs are often used to form UR to expand the influence range of the flow field in the AR area, to obtain relatively strong inter-layer disturbance.
However, the flow field effect of UR is not simply a linear superposition of several ARs. How to obtain a relatively large and complex flow field environment as far as possible is the first problem to be solved. In this article, we considered the longitudinal interval (h1), transverse interval (h2), and the angle of inflow (AI) as the influencing factors of UR layout. Considering the impact force of the water around ARs, the layout mode of flat laying was usually chosen. Nine upwelling reefs were finally selected and combined into a UR, forming 64 different combinations for numerical simulation analysis. The upwelling efficiency index (φ1), wake efficiency index (φ2), downwelling efficiency index (φ3), and disturbance intensity index between water layers (φ4) were defined as the comprehensive evaluation standard for the flow field effect of UR, and the layout mode of UR is further optimized. The conclusions are summarized as follows:
- (1)
- The h1, h2, and AI have a significant influence on the flow field effect of UR. Among the three influencing factors, AI has the most significant influence on the flow field. With the increase of the AI, the efficiency indices of upwelling, wake, and downwelling increase gradually. When the AI is 45°, the disturbance efficiency of UR is the highest.
- (2)
- Therefore, in the layout process of URs, the direction of current in the local sea area should be the first consideration, and the best AI of AR should be at 45° to the direction of current as far as possible. If the current is multiple direction, the proportion of the main current or its prevailing time should be considered, so as to better play the disturbance effect of the UR.
- (3)
- The combination of ARs with h1 of 1 L and h2 of 2 L has the highest upwelling volume (4641.6 m3) and downwelling volume (3266.91 m3) and has the optimal layout among the 64 URs. Its disturbance index (φ4) is 1.4, which indicates a good disturbance effect.
- (4)
- The inflow velocity has little influence on the flow field effect of UR, which is consistent with the results of the individual reefs.
Author Contributions
Conceptualization, Z.J. and Z.L.; methodology, J.Z.; software, J.Z.; validation, J.Z., Z.N. and J.W.; formal analysis, J.Z.; investigation, L.Z., Z.N.; resources, Z.J.; data curation, J.W., W.X.; writing—original draft preparation, J.Z.; writing—review and editing, Z.J.; visualization, J.Z.; supervision, L.S.; project administration, Z.L.; funding acquisition, Z.J. All authors have read and agreed to the published version of the manuscript.
Funding
This research was funded by the National Natural Science Foundation of China, grant number 41771544, and the Fundamental Research Funds for the Central Universities, grant number 2019ZRJC006.
Institutional Review Board Statement
Not applicable.
Informed Consent Statement
Not applicable.
Data Availability Statement
Not applicable.
Acknowledgments
The numerical calculations in this article were performed on the supercomputing system in the Supercomputing Center, Shandong University, Weihai.
Conflicts of Interest
The authors declare no conflict of interest.
References
- Baine, M. Artificial reefs: A review of their design, application, management and performance. Ocean Coast. Manag. 2001, 44, 241–259. [Google Scholar] [CrossRef]
- Chen, Q.; Yuan, H.R.; Chen, P.M. Integrated response in taxonomic diversity and eco-exergy of macrobenthic faunal community to artificial reef construction in Daya Bay, China. Ecol. Indic. 2019, 101, 512–521. [Google Scholar] [CrossRef]
- Chen, Q.; Chen, P.M. Short-term effects of artificial reef construction on surface sediment and seawater properties in Daya Bay, China. J. Coast. Res. 2020, 36, 319–326. [Google Scholar] [CrossRef]
- Lee, M.O.; Otake, S.; Kim, J.K. Transition of artificial reefs (ARs) research and its prospects. Ocean Coast. Manag. 2018, 154, 55–65. [Google Scholar] [CrossRef]
- Kim, D.; Woo, J.; Yoon, H.S.; Na, W.B. Wake lengths and structural responses of Korean general artificial reefs. Ocean Eng. 2014, 92, 83–91. [Google Scholar] [CrossRef]
- Kim, D.; Woo, J.; Yoon, H.S.; Na, W.B. Efficiency, tranquillity and stability indices to evaluate performance in the artificial reef wake region. Ocean Eng. 2016, 122, 253–261. [Google Scholar] [CrossRef]
- Lee, I.C.; Kim, D.; Jung, S.; Na, W.B. Prediction of primary physical measures for cost-effective management of artificial seaweed reefs. Mar. Technol. Soc. J. 2020, 54, 25–43. [Google Scholar] [CrossRef]
- Woo, J.; Kim, D.; Yoon, H.S.; Na, W.B. Efficient placement models of labyrinth-type artificial concrete reefs according to wake volume estimation to support natural submerged aquatic vegetation. Bull. Mar. Sci. 2018, 94, 1259–1272. [Google Scholar] [CrossRef]
- Jiang, Z.Y.; Liang, Z.L.; Tang, Y.L. Numerical analysis of the effect of an inner structure of a cubic frame reef on flow field. Mar. Technol. Soc. J. 2019, 53, 83–92. [Google Scholar] [CrossRef]
- Kim, D.; Jung, S.; Na, W.B. Evaluation of turbulence models for estimating the wake region of artificial reefs using particle image velocimetry and computational fluid dynamics. Ocean Eng. 2021, 223, 108673. [Google Scholar] [CrossRef]
- Hu, J.Y.; Wang, X.H. Progress on upwelling studies in the China seas. Rev. Geophys. 2016, 54, 653–673. [Google Scholar] [CrossRef]
- Jeong, Y.; Lee, H.; Park, C.; Kim, D.; Kim, M. Variation of phytoplankton and zooplankton communities in a sea area, with the building of an artificial upwelling structure. Anim. Cells Syst. 2013, 17, 63–72. [Google Scholar] [CrossRef]
- Jiang, Z.Y.; Liang, Z.L.; Zhu, L.X.; Liu, Y. Numerical analysis of the effect of an inner structure of a cubic frame reef on flow field. Ocean Eng. 2016, 116, 236–241. [Google Scholar] [CrossRef]
- Huang, L.Y.; Cheng, H.; Tang, Y.L.; Yang, Q.; Wang, X.X. Comparison of three ways to assess the influence range of different artificial reefs. Int. J. Eng. Technol. 2017, 9, 105–110. [Google Scholar] [CrossRef][Green Version]
- Guo, Y.; Zhang, S.Y.; Lin, J. Flow field efficiency of Mi-zi artificial reefs in different construction modes based on numerical experiments. J. Fish. China 2019, 43, 2025–2038, (In Chinese with English abstract). [Google Scholar]
- Woo, J.; Kim, D.; Yoon, H.S.; Na, W.B. Characterizing Korean general artificial reefs by drag coefficients. Ocean Eng. 2014, 82, 105–114. [Google Scholar] [CrossRef]
- Yaakob, O.B.; Ahmed, Y.M.; Jalal, M.R.; Faizul, A.A.; Koh, K.K.; Zaid, T.J. Hydrodynamic design of new type of artificial reefs. Appl. Mech. Mater. 2016, 819, 406–419. [Google Scholar] [CrossRef]
- Wang, G.; Wan, R.; Wang, X.X.; Zhao, F.F.; Lan, X.Z.; Cheng, H.; Tang, W.Y.; Guan, Q.L. Study on the influence of cut-opening ratio, cut-opening shape, and cut-opening number on the flow field of a cubic artificial reef. Ocean Eng. 2018, 162, 341–352. [Google Scholar] [CrossRef]
- Tang, Y.L.; Yang, W.Z.; Sun, L.Y.; Zhao, F.F.; Long, X.Y.; Wang, G. Studies on factors influencing hydrodynamic characteristics of plates used in artificial reefs. J. Ocean Univ. China 2019, 18, 193–202, (In Chinese with English abstract). [Google Scholar] [CrossRef]
- Yu, D.Y.; Zhao, W.; Wang, F.Y.; Wang, S.L. Trapezoid artificial reefs in different deployment spacing: Physical and numerical simulations. Oceanol. Limnol. Sin. 2020, 51, 283–292, (In Chinese with English abstract). [Google Scholar]
- Jiang, Z.Y.; Liang, Z.L.; Zhu, L.X.; Guo, Z.S.; Tang, Y.L. Effect of hole diameter of rotary-shaped artificial reef on flow field. Ocean Eng. 2020, 197, 106917. [Google Scholar] [CrossRef]
- Yoon, H.S.; Kim, D.; Na, W.B. Estimation of effective usable and burial volumes of artificial reefs and the prediction of cost-effective management. Ocean Coast. Manag. 2016, 120, 135–147. [Google Scholar] [CrossRef]
- Kim, D.S.; Shimasaki, Y.H. Change in marine environment after artificial reef deployment in the south sea of Korea. J. Fac. Agric. Kyushu Univ. 2013, 58, 403–415. [Google Scholar] [CrossRef]
- Kim, D.; Woo, J.; Na, W.B. Intensively stacked placement models of artificial reef sets characterized by wake and upwelling regions. Mar. Technol. Soc. J. 2017, 51, 60–70. [Google Scholar] [CrossRef]
- Tang, Y.L.; Long, X.Y.; Wang, X.X.; Jiang, Z.Y.; Cheng, H.; Zhang, T.Z. Comparative analysis on flow field effect of general artificial reefs in China. Trans. Chin. Soc. Agric. Eng. 2017, 33, 97–103, (In Chinese with English abstract). [Google Scholar] [CrossRef]
- Zheng, Y.X.; Liang, Z.L.; Guan, C.T.; Song, X.F.; Li, J.; Cui, Y.; Li, Q.; Zhou, Y. Numerical simulation and experimental study of the effects of disposal space on the flow field around the combined three-tube reefs. China Ocean Eng. 2015, 29, 445–458. [Google Scholar] [CrossRef]
- Zhu, W.T.; Qin, C.X.; Ma, H.M.; Xi, S.G.; Zuo, T.; Pan, W.N.; Li, C.H. Response of protist community dynamics and co-occurrence patterns to the construction of artificial reefs: A case study in Daya Bay, China. Sci. Total Environ. 2020, 742, 40575. [Google Scholar] [CrossRef] [PubMed]
- Li, J.; Zheng, Y.X.; Gong, P.H.; Guan, C.T. Numerical simulation and PIV experimental study of the effect of flow fields around tube artificial reefs. Ocean Eng. 2017, 134, 96–104. [Google Scholar] [CrossRef]
- Kim, D.; Jung, S.; Kim, J.; Na, W.B. Efficiency and unit propagation indices to characterize wake volumes of marine forest artificial reefs established by flatly distributed placement models. Ocean Eng. 2019, 175, 138–148. [Google Scholar] [CrossRef]
- Liu, G.S.; Cai, X.Y.; Tong, F.; Wang, L.; Zhang, X.M. Investigation of massive death of sea cucumber in artificial reef zone of Shuangdao Bay, Weihai. Fish. Inf. Strategy 2014, 29, 122–129, (In Chinese with English abstract). [Google Scholar] [CrossRef]
- Liu, G.S.; Li, W.T.; Zhang, X.M. Assessment of the benthic macrofauna in an artificial shell reef zone in Shuangdao Bay, Yellow Sea. Mar. Pollut. Bull. 2017, 114, 778–785. [Google Scholar] [CrossRef]
- Sun, X.H.; Sun, X.Y.; Zhu, L.X.; Li, X.; Sun, S. Seasonal and spatial variation in abundance of the copepod Calanus sinicus: Effects of decreasing dissolved oxygen and small jellyfish bloom in northern Yellow Sea, China, nearshore waters. Mar. Pollut. Bull. 2020, 161 Pt B, 111653. [Google Scholar] [CrossRef]
- ANSYS Inc. ANSYS Fluent,17.2.; ANSYS Inc.: Canonsburg, PA, USA, 2016. [Google Scholar]
- Pope, S.B. Turbulent Flows; Cambridge University Press: Cambridge, UK, 2012. [Google Scholar] [CrossRef]
- Liu, Y.; Zhao, Y.P.; Dong, G.H.; Guan, C.T.; Cui, Y.; Xu, T.J. A study of the flow field characteristics around star-shaped artificial reefs. J. Fluids Struct. 2013, 39, 27–40. [Google Scholar] [CrossRef]
- Liu, T.L.; Su, D.T. Numerical analysis of the influence of reef arrangements on artificial reef flow fields. Ocean Eng. 2013, 74, 81–89. [Google Scholar] [CrossRef]
- Le, Q.T.N.; Jung, S.; Na, W.B. Wake region estimates of artificial reefs in vietnam: Effects of tropical seawater temperatures and seasonal water flow variation. Sustainability 2020, 12, 6191. [Google Scholar] [CrossRef]
Publisher’s Note: MDPI stays neutral with regard to jurisdictional claims in published maps and institutional affiliations. |
© 2021 by the authors. Licensee MDPI, Basel, Switzerland. This article is an open access article distributed under the terms and conditions of the Creative Commons Attribution (CC BY) license (https://creativecommons.org/licenses/by/4.0/).