
Conception and Evolution of the Probabilistic Methods for Ship Damage Stability and Flooding Risk Assessment


Abstract
:1. Introduction
2. S-Factor Definition
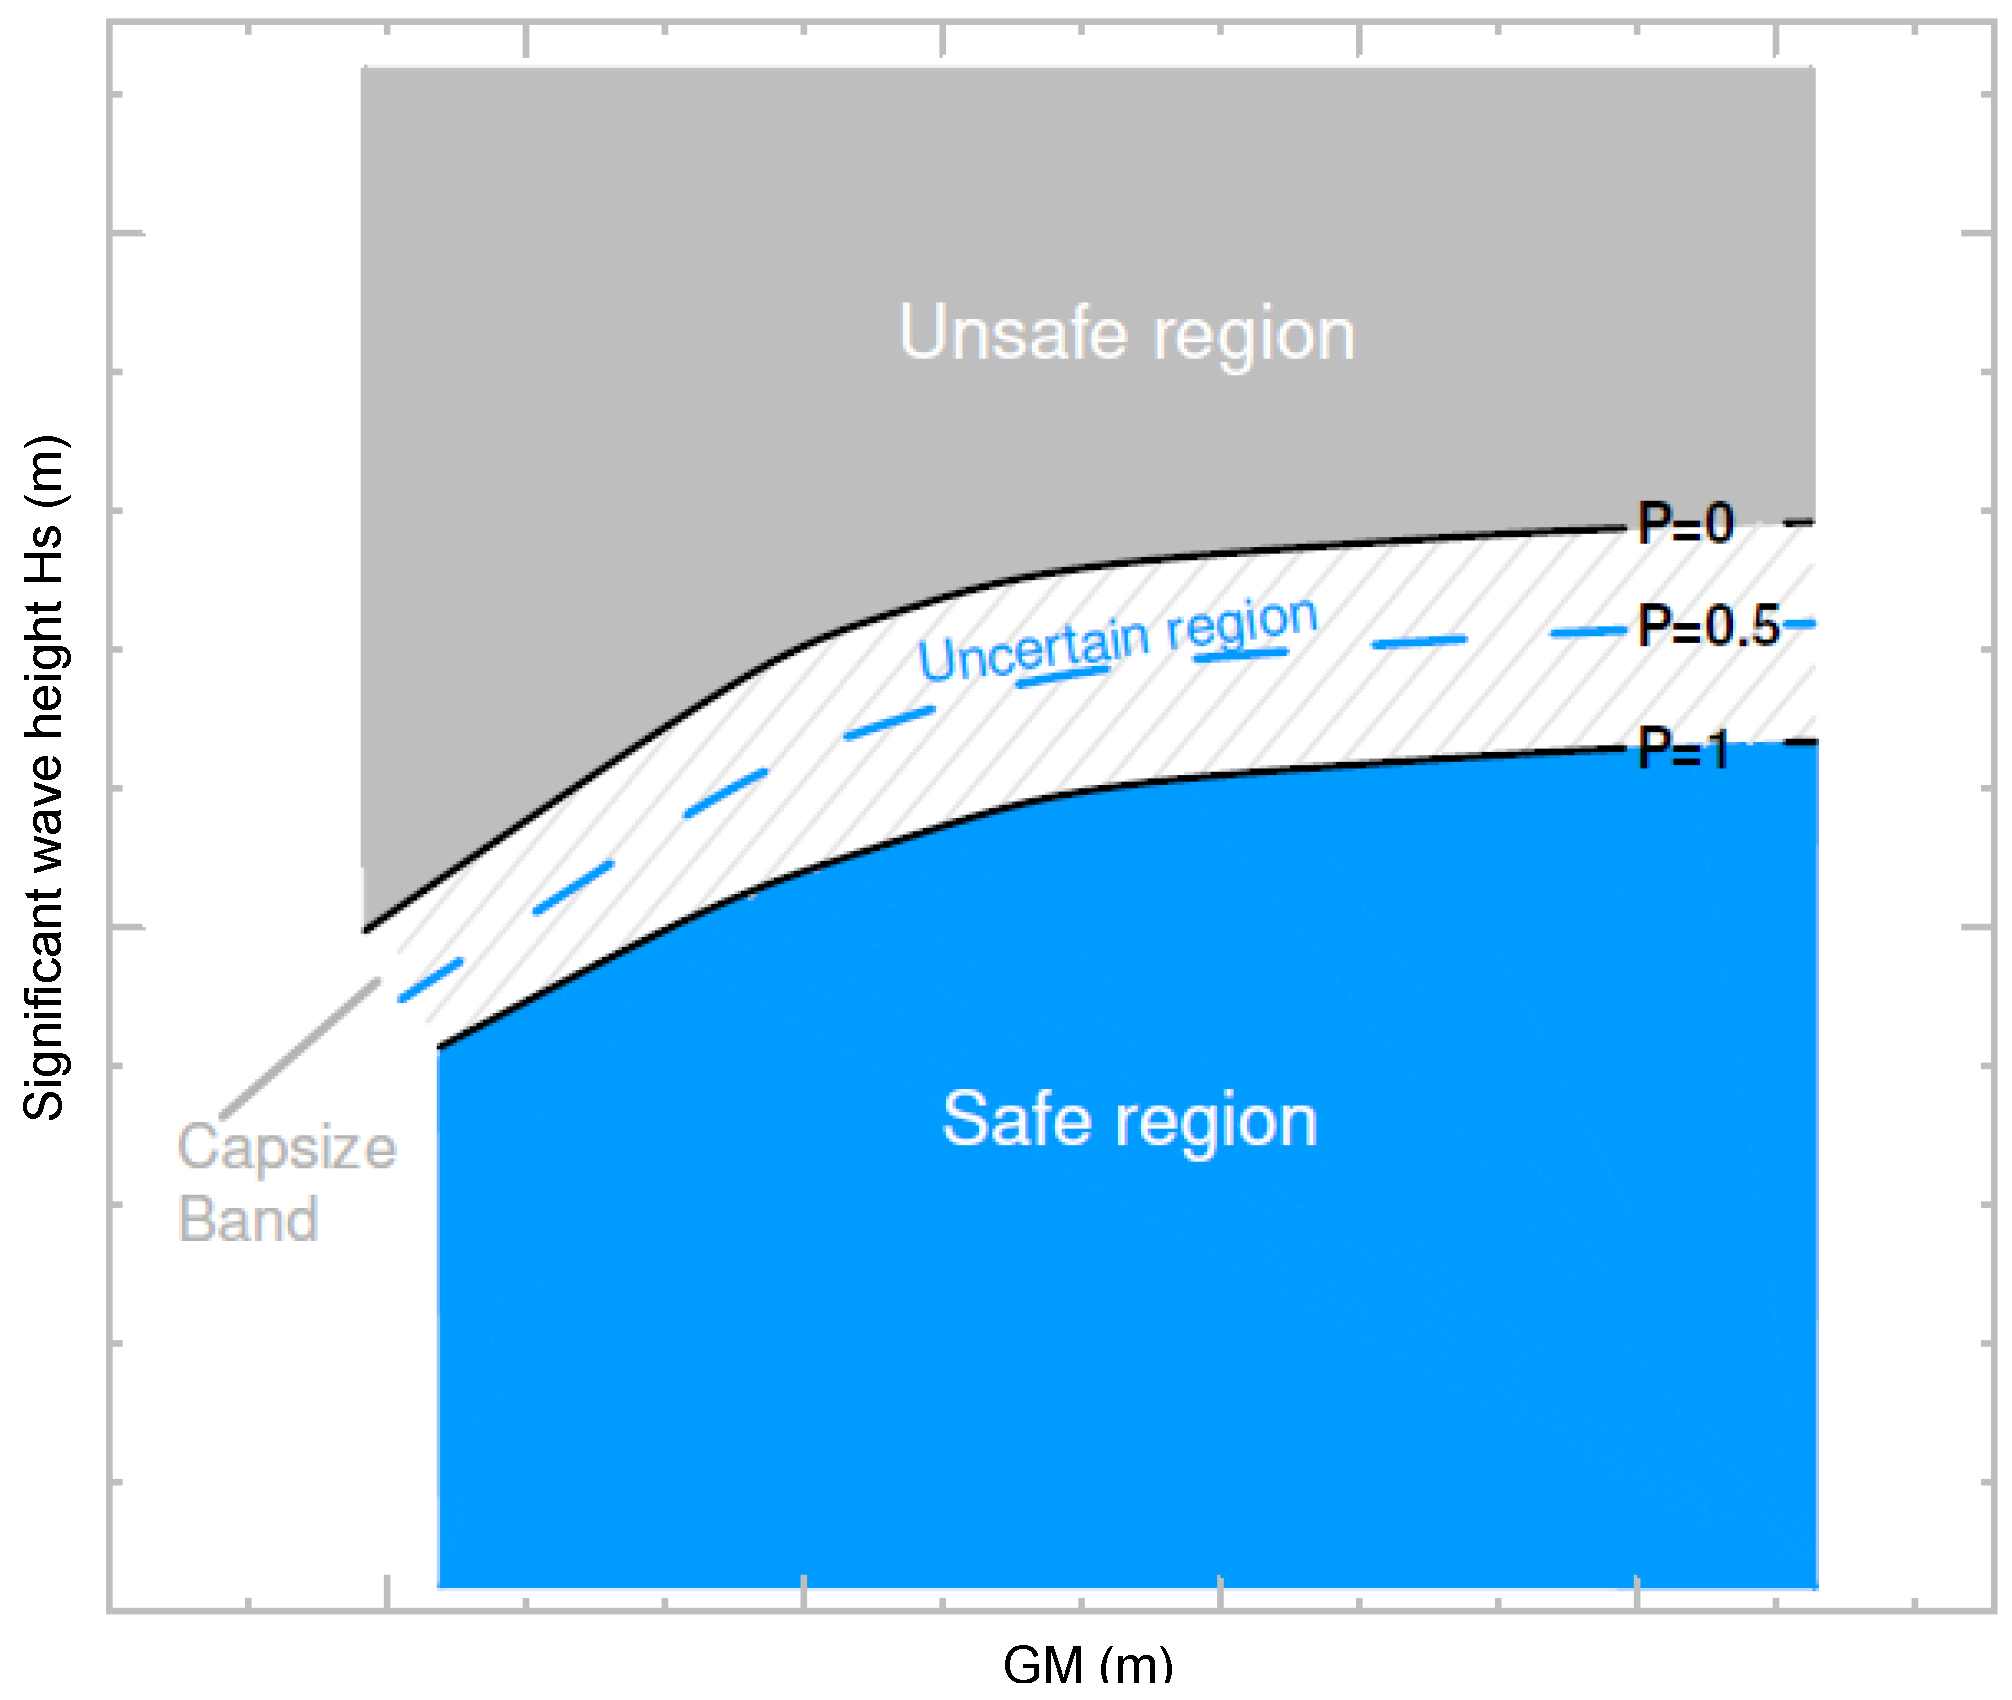
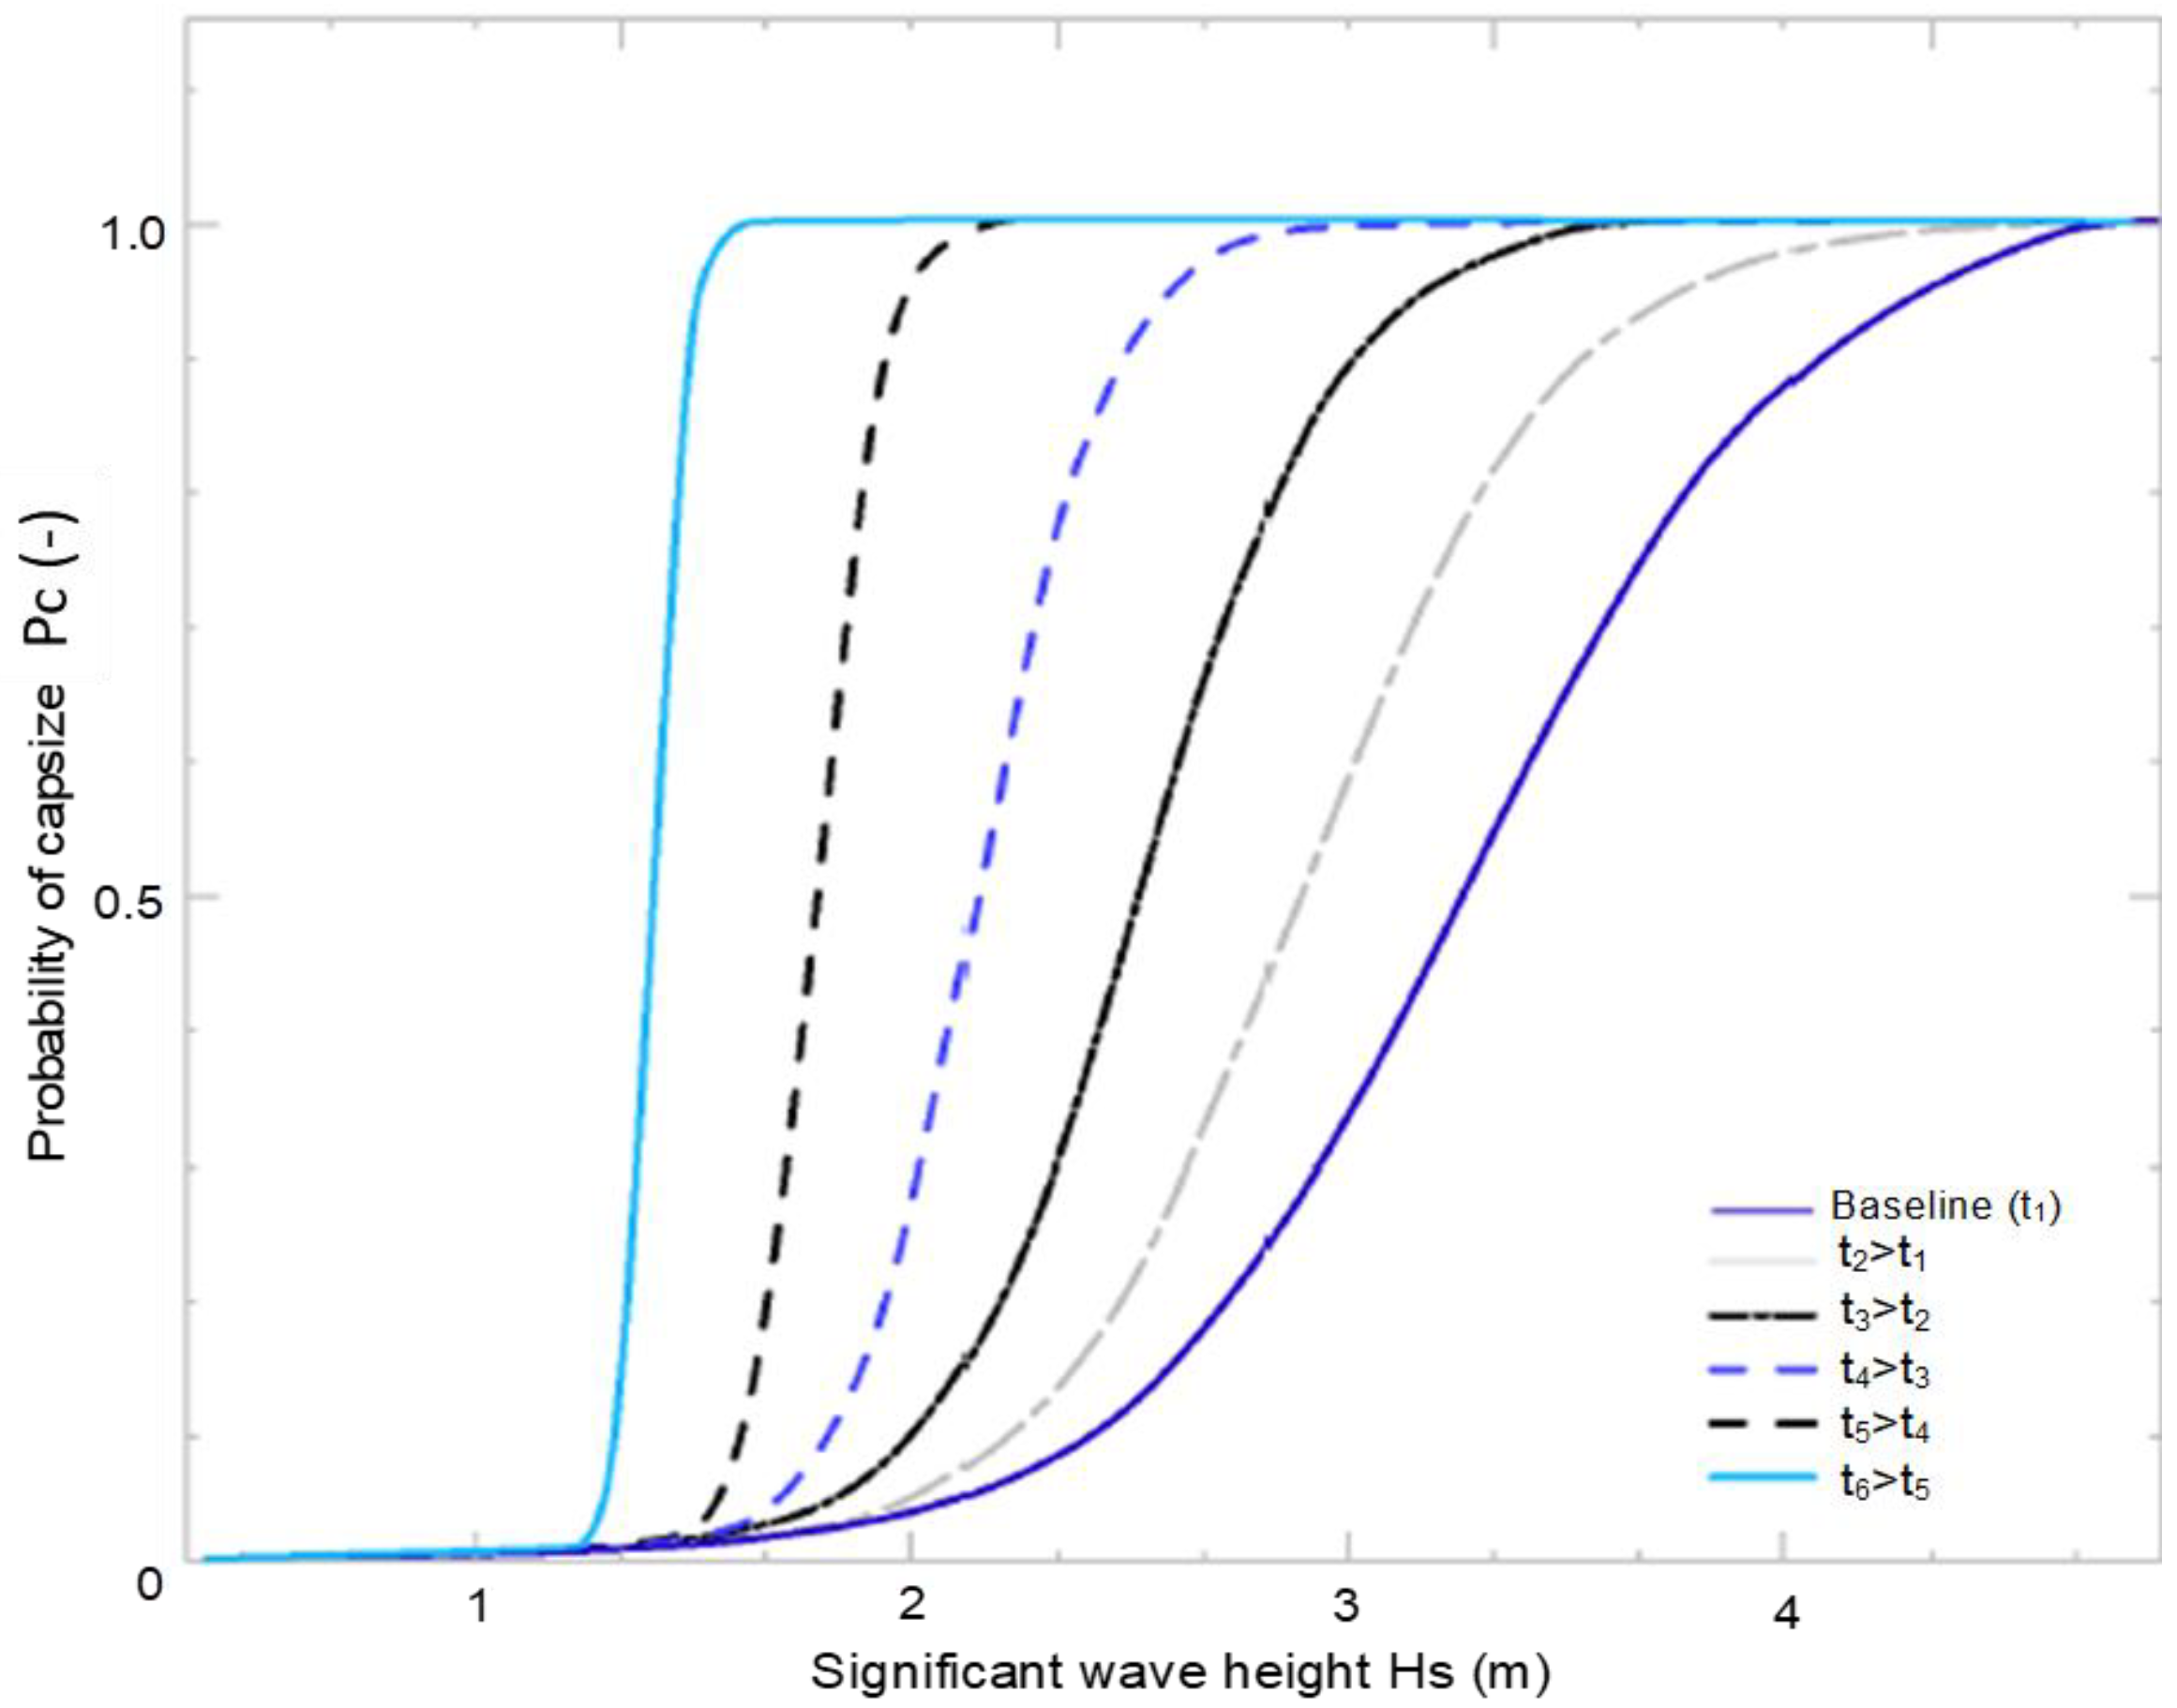
2.1. Capsize Band
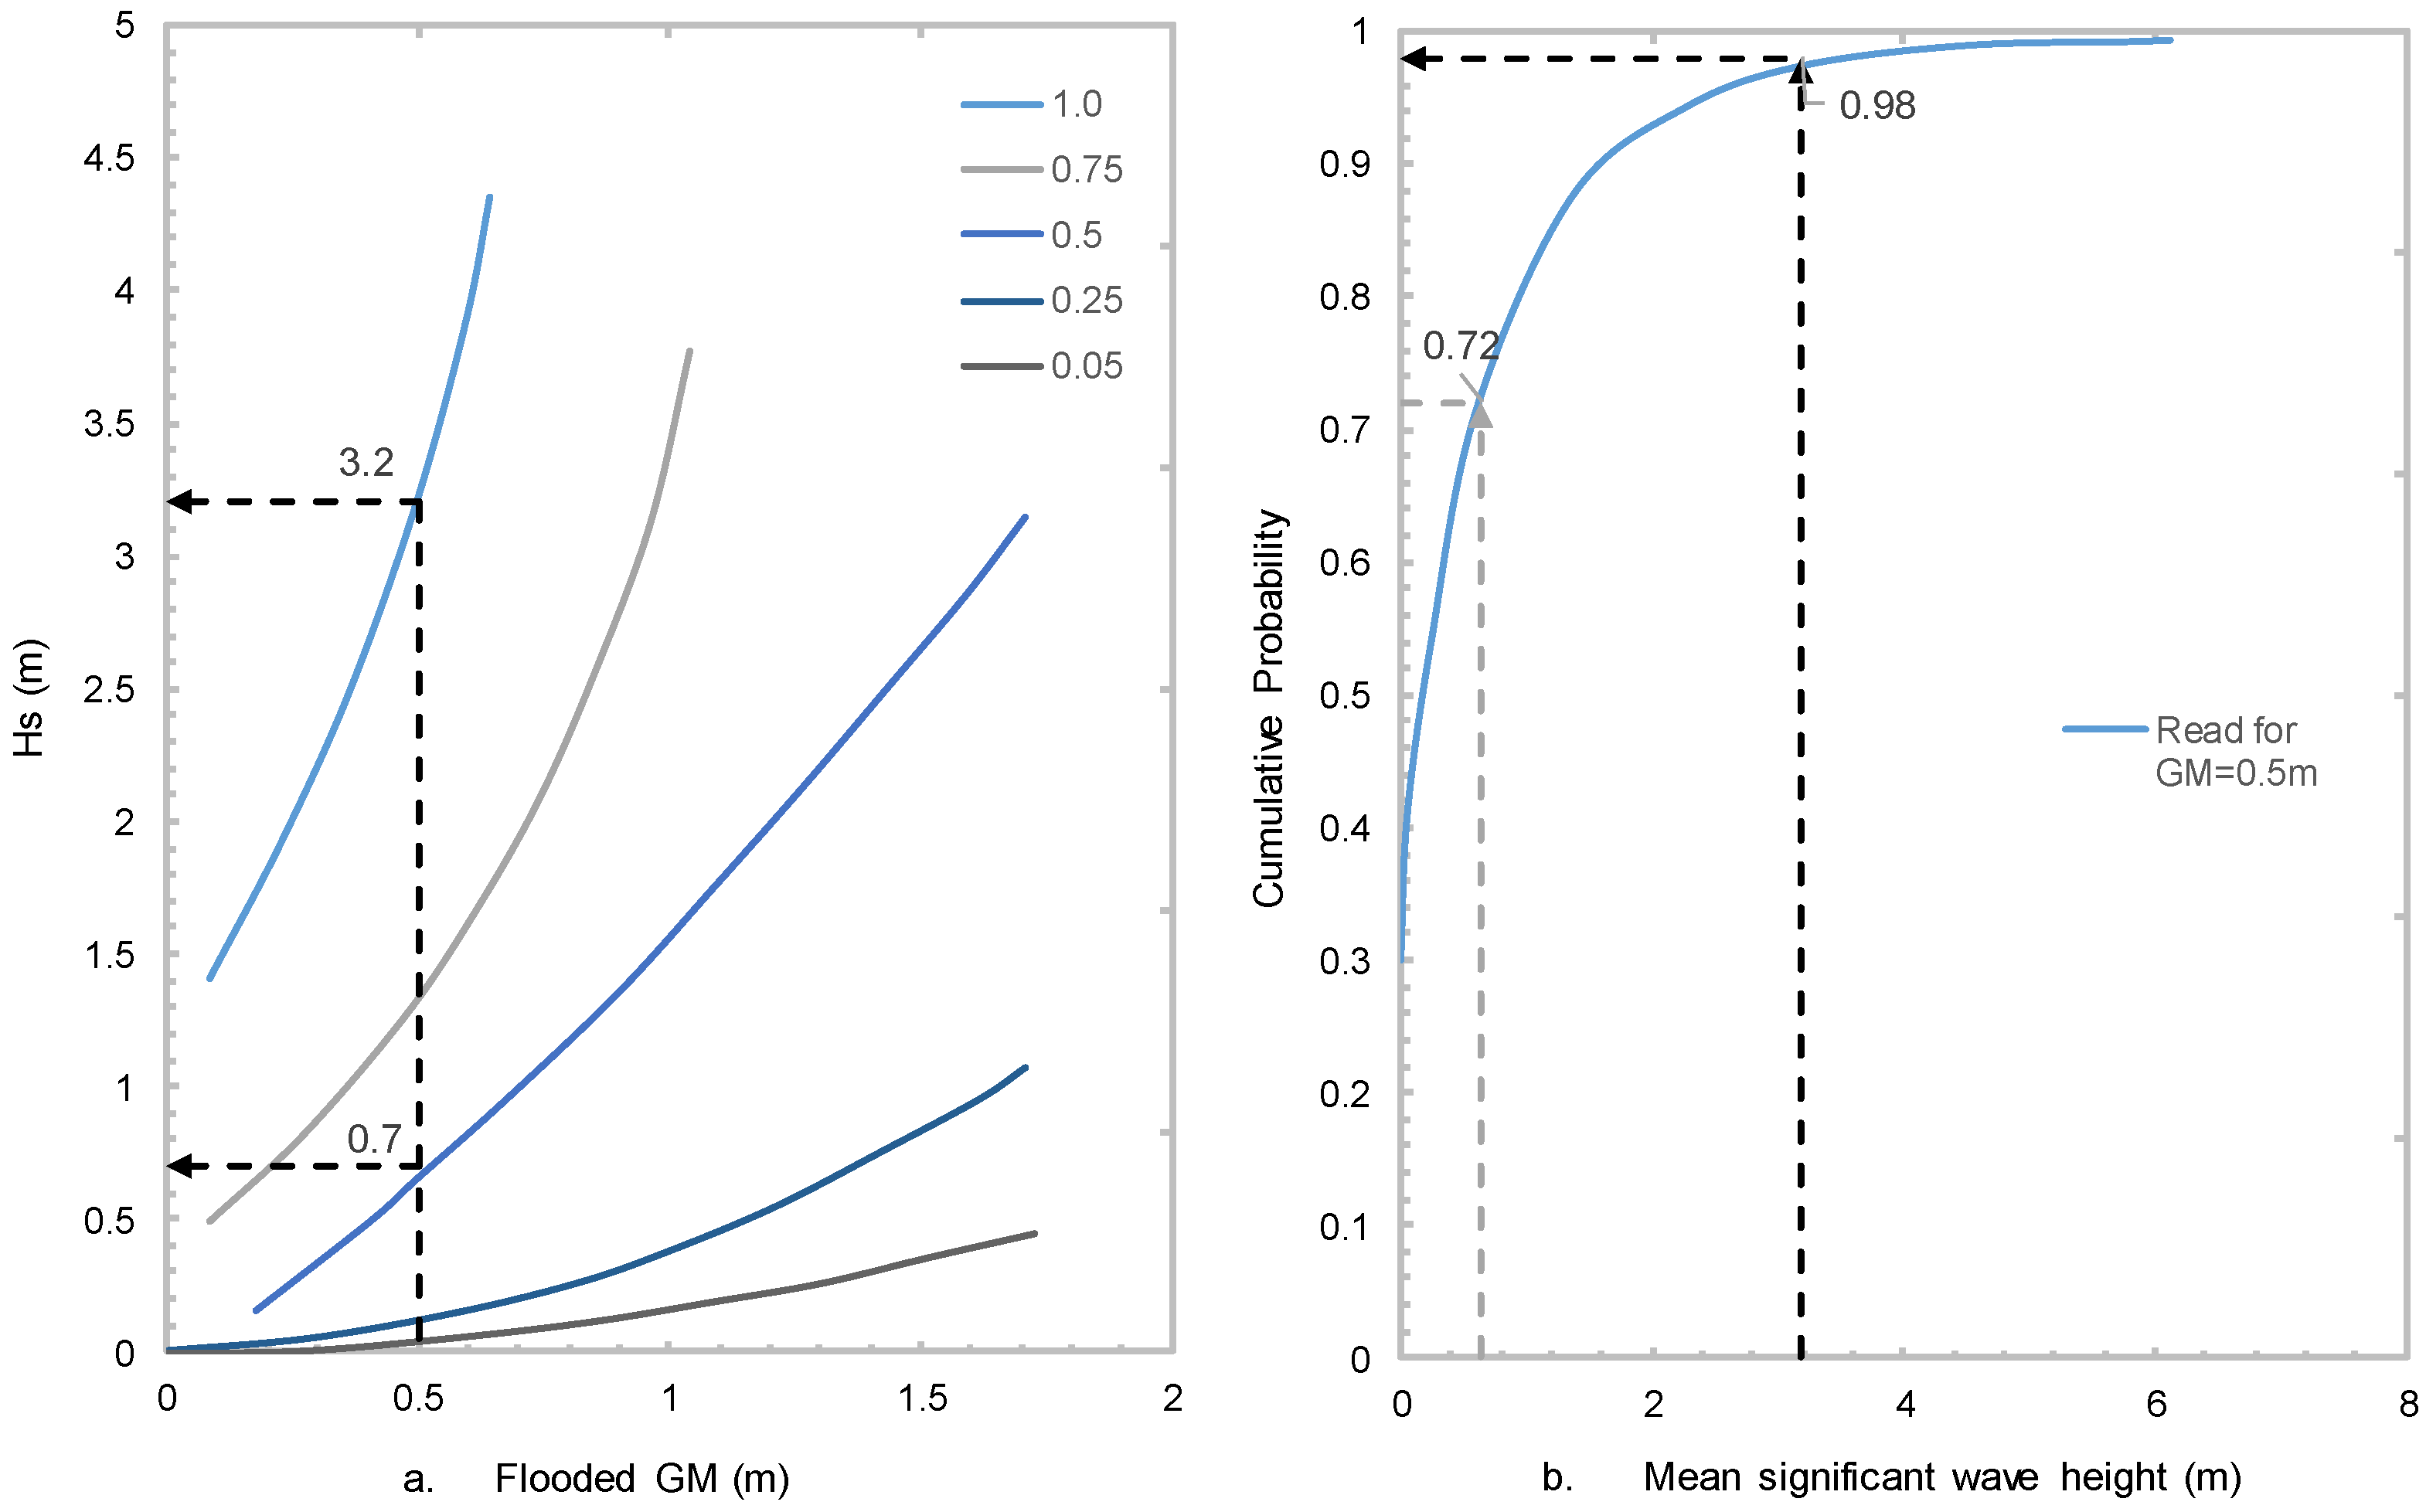
2.2. Critical Significant Wave Height
3. S-Factor Evolution
3.1. IMO (International Maritime Organization) Resolution A.265
3.2. Static Equivalent Method (SEM)
3.3. SOLAS 2009
3.4. EMSA (European Maritime Safety Agency) 2009
3.5. GOALDS Project
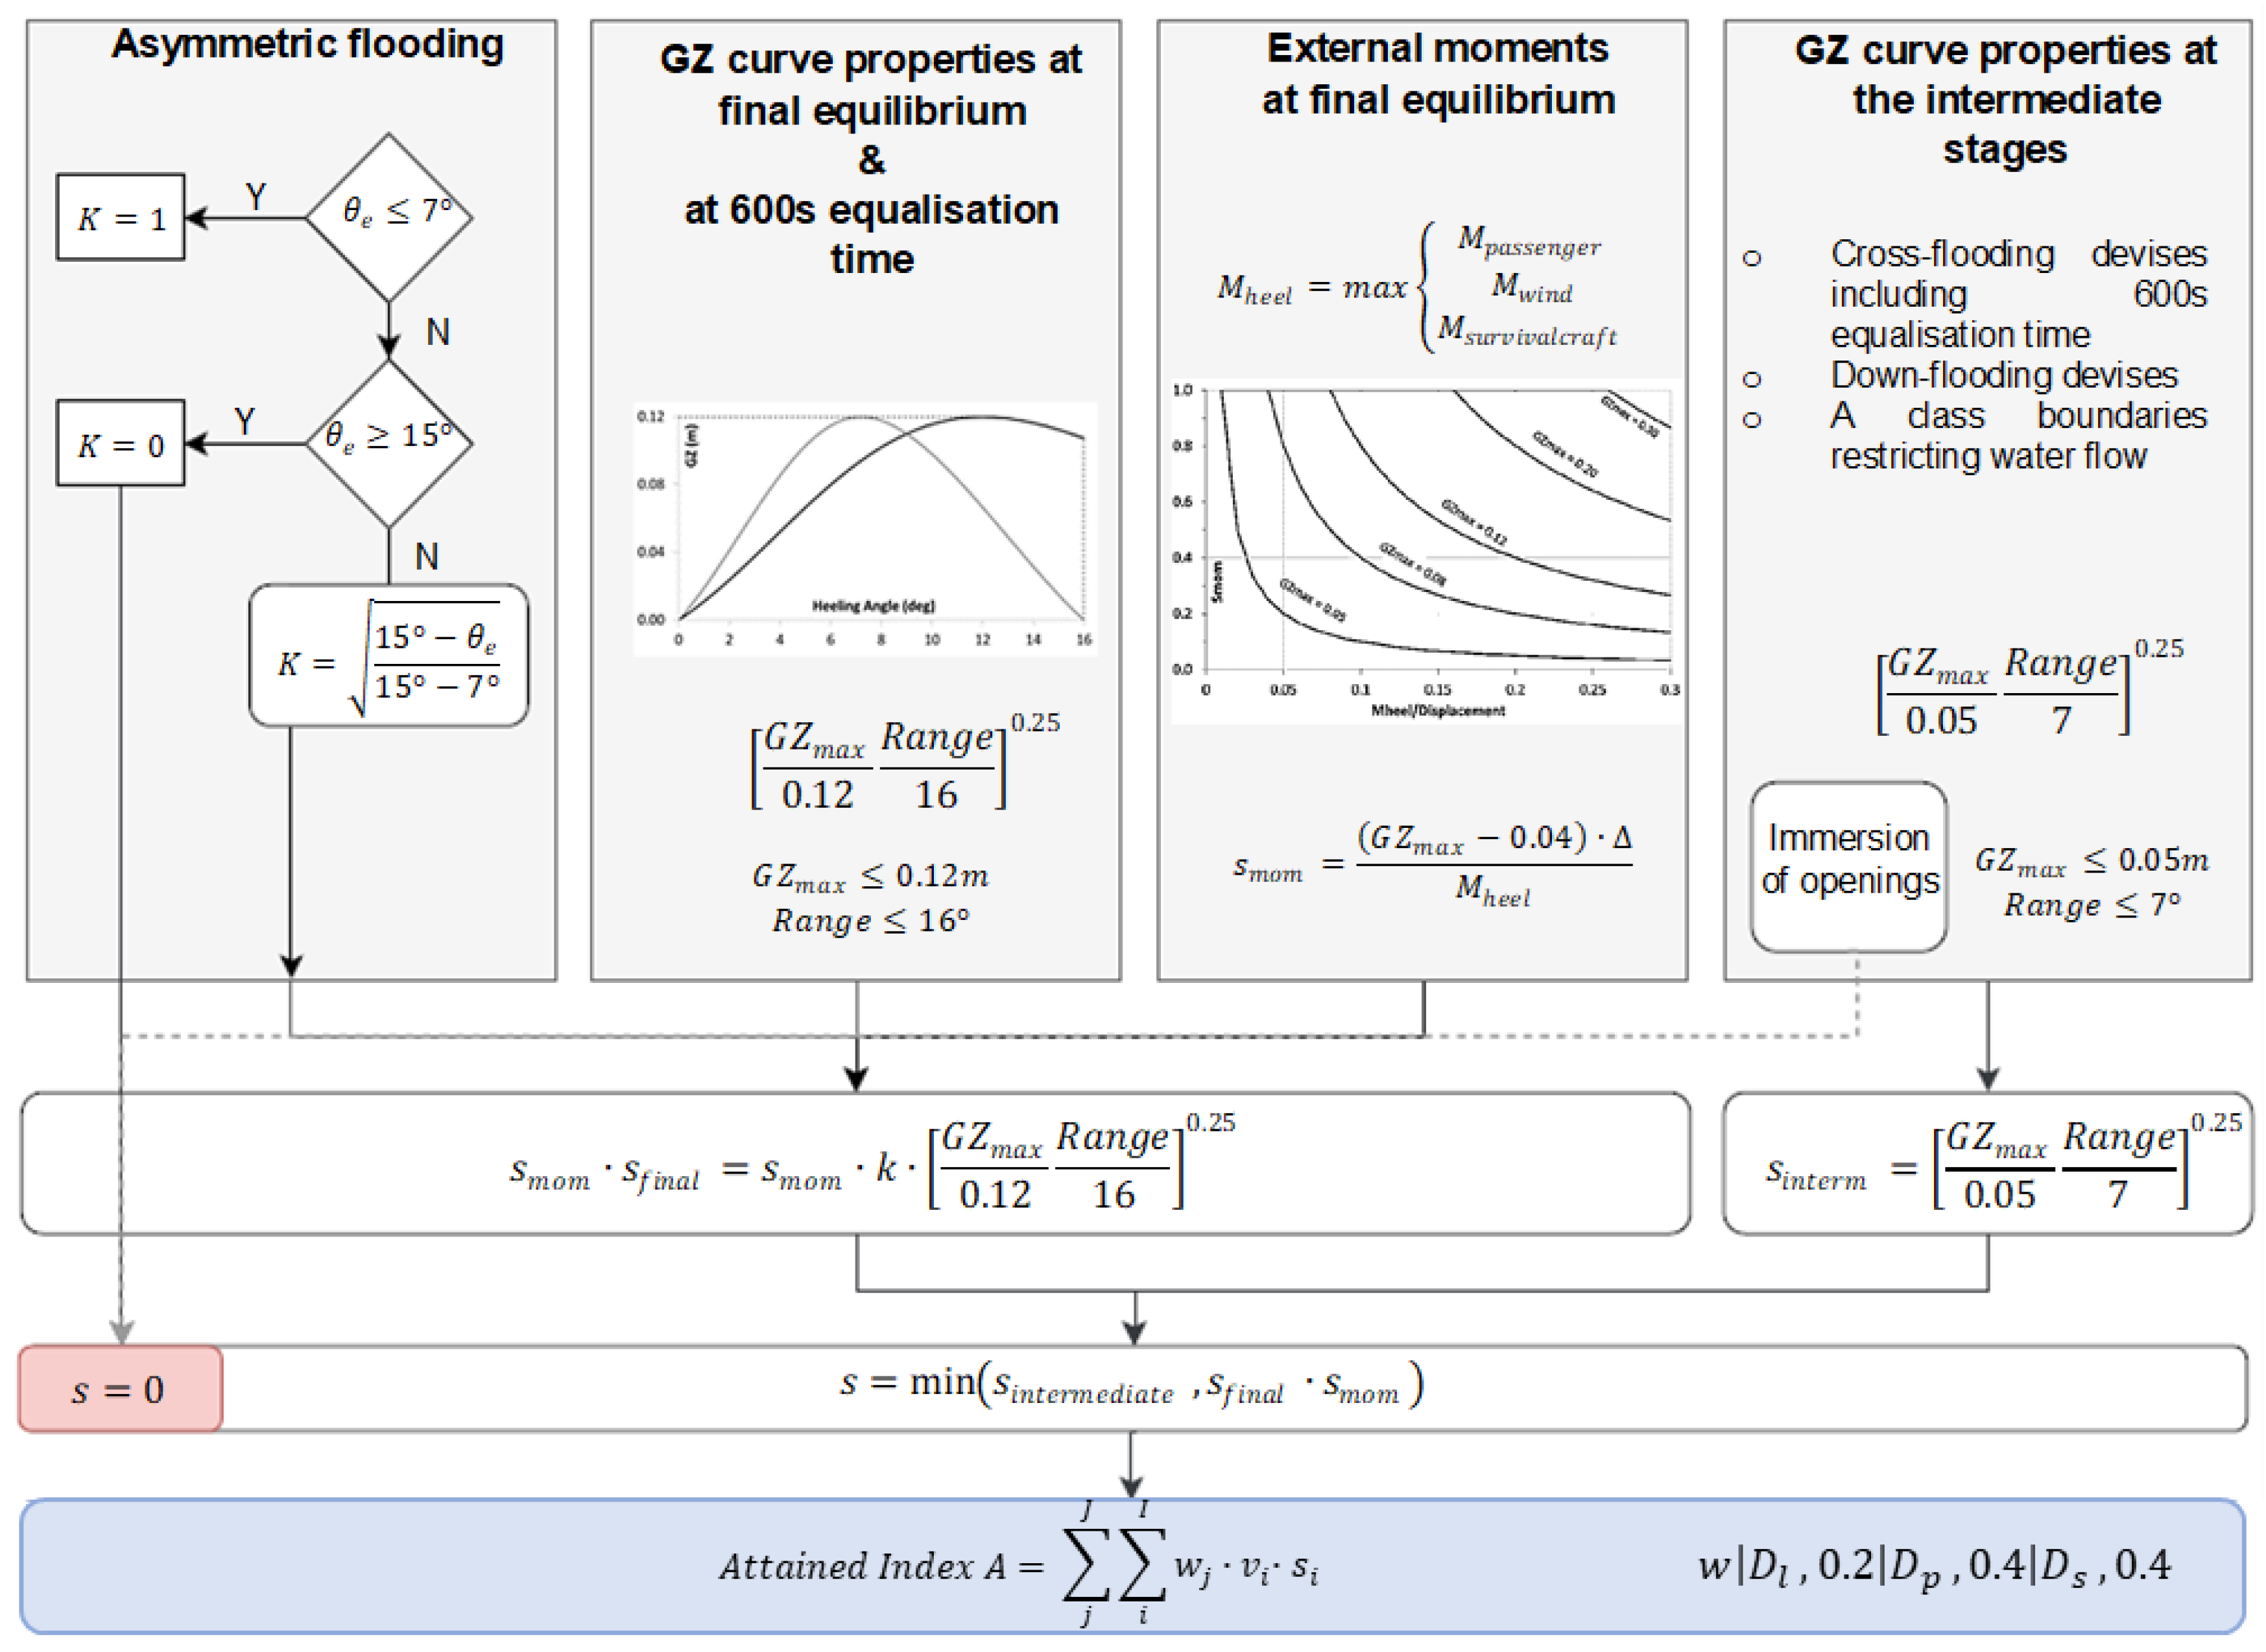
3.6. Project eSAFE
4. Flooding Risk Quantification
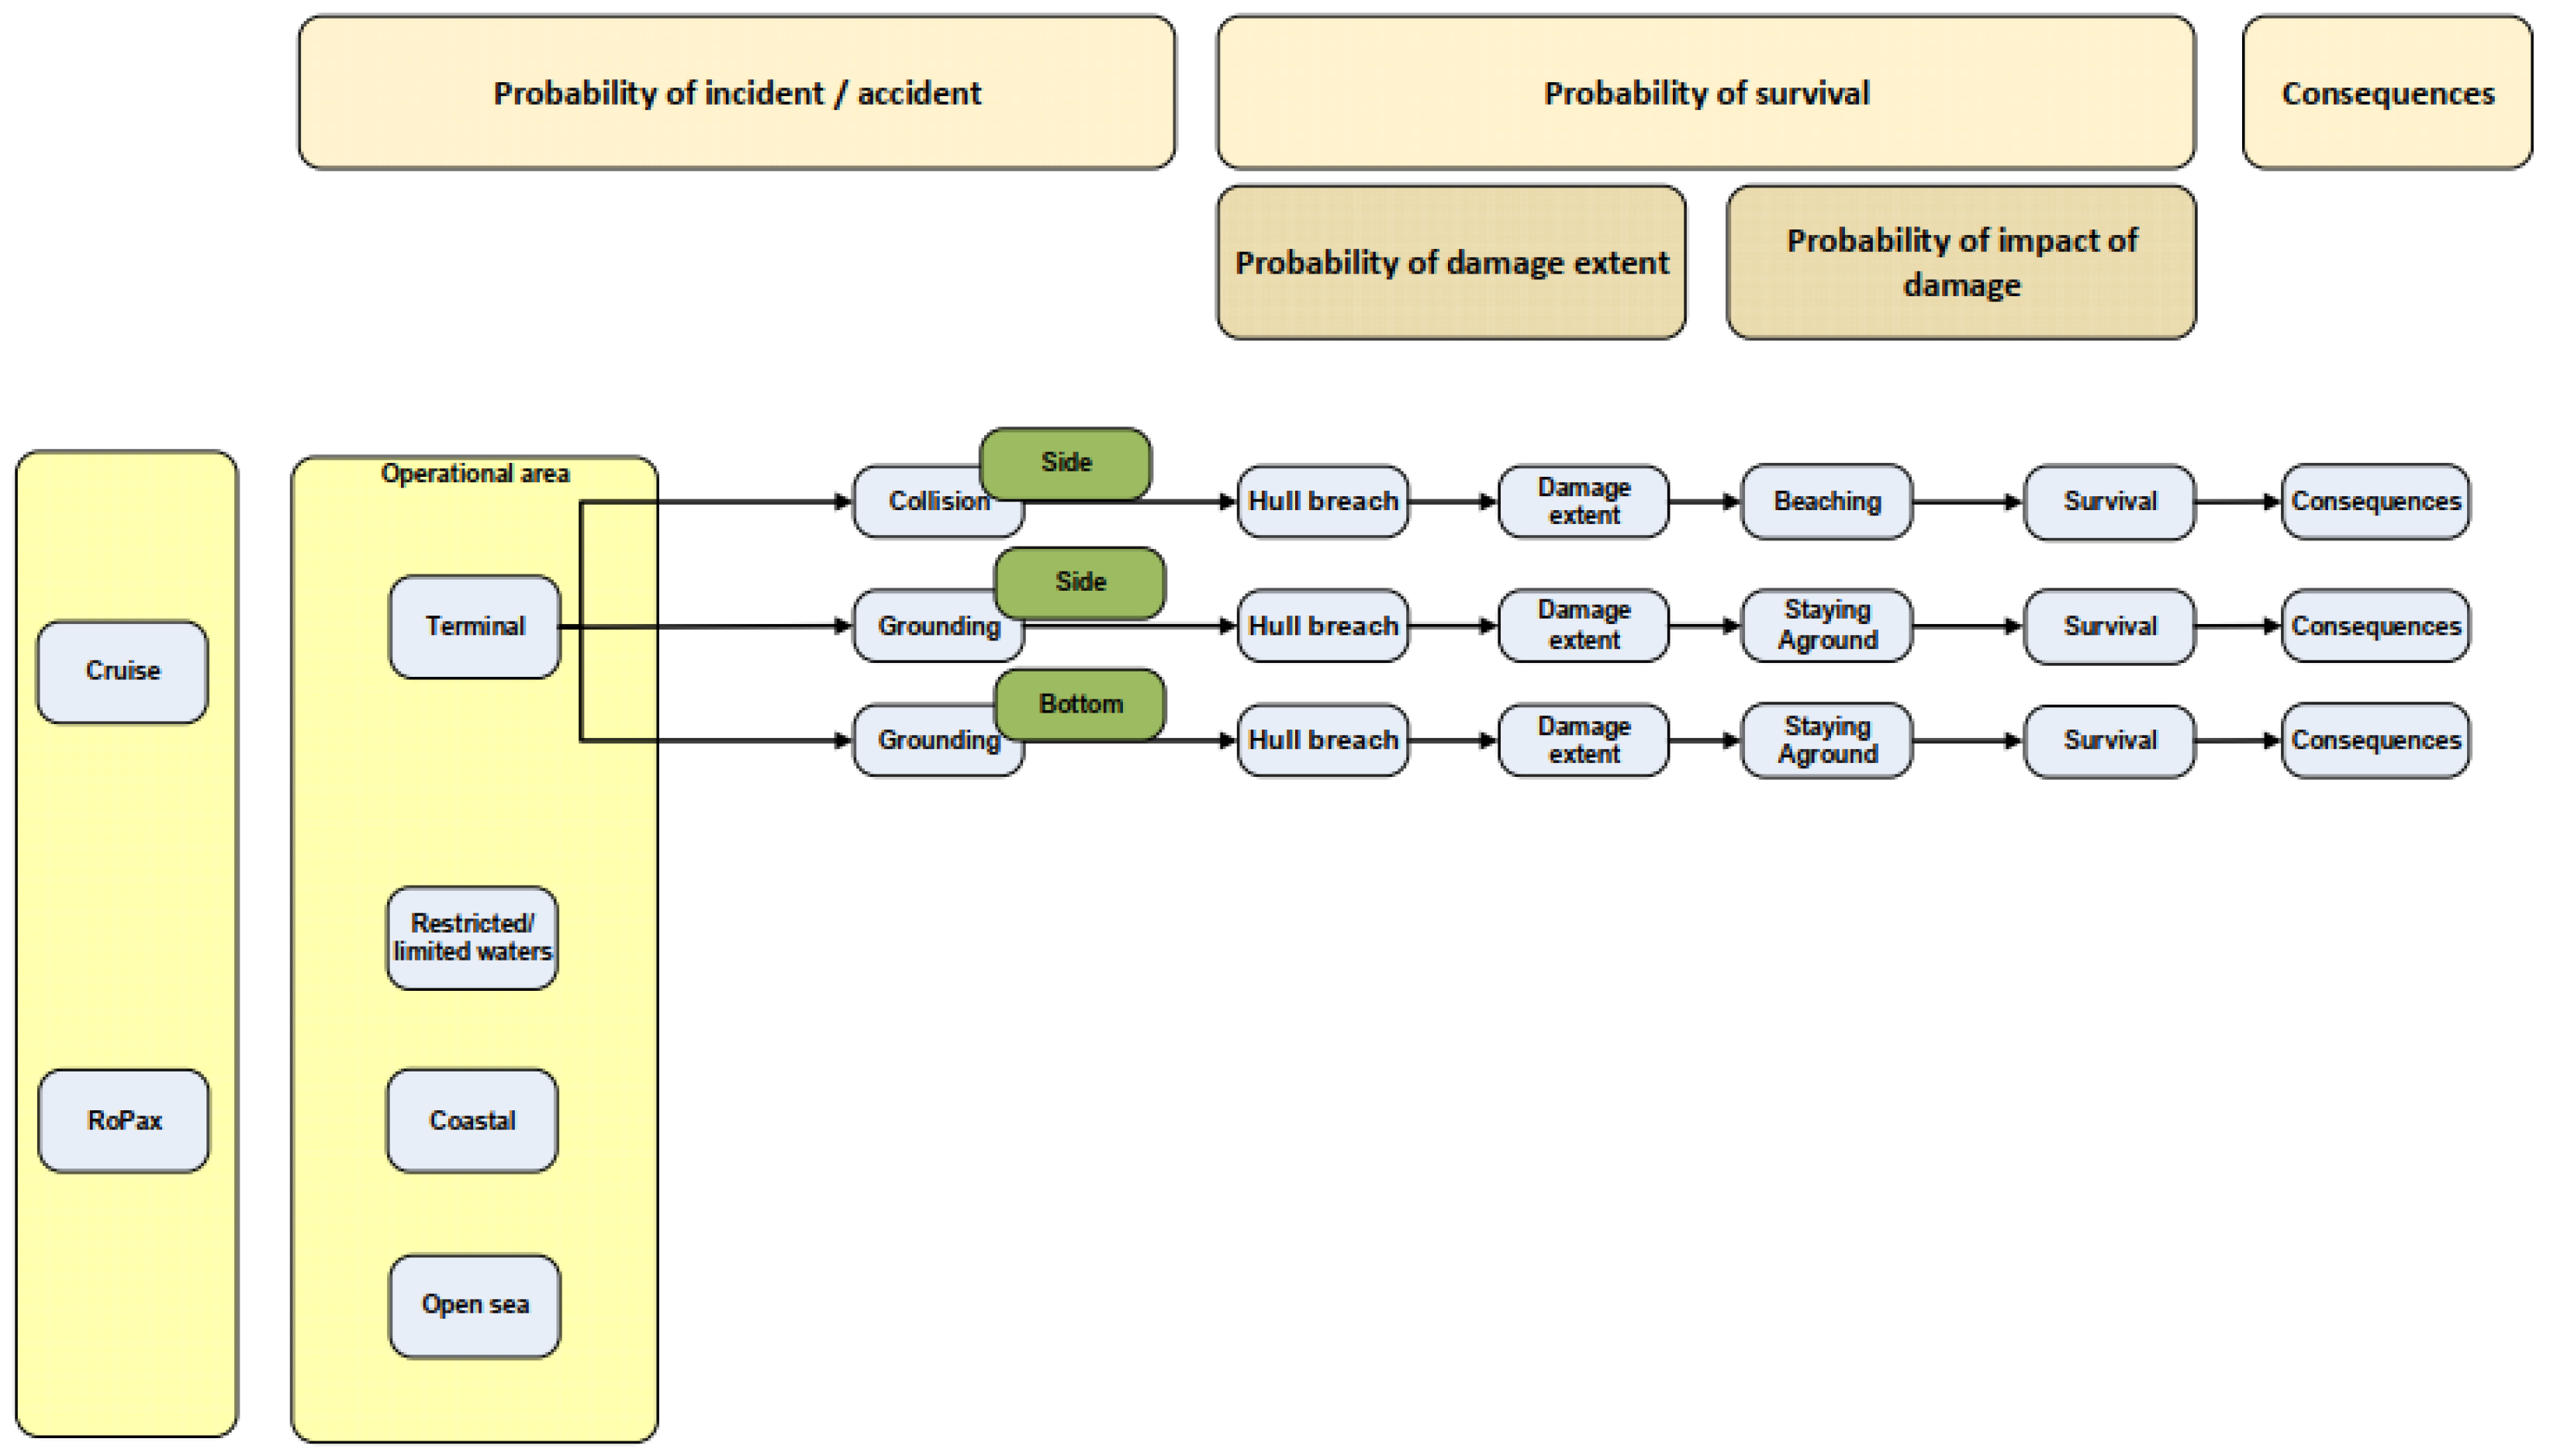
4.1. High-Level Risk Models
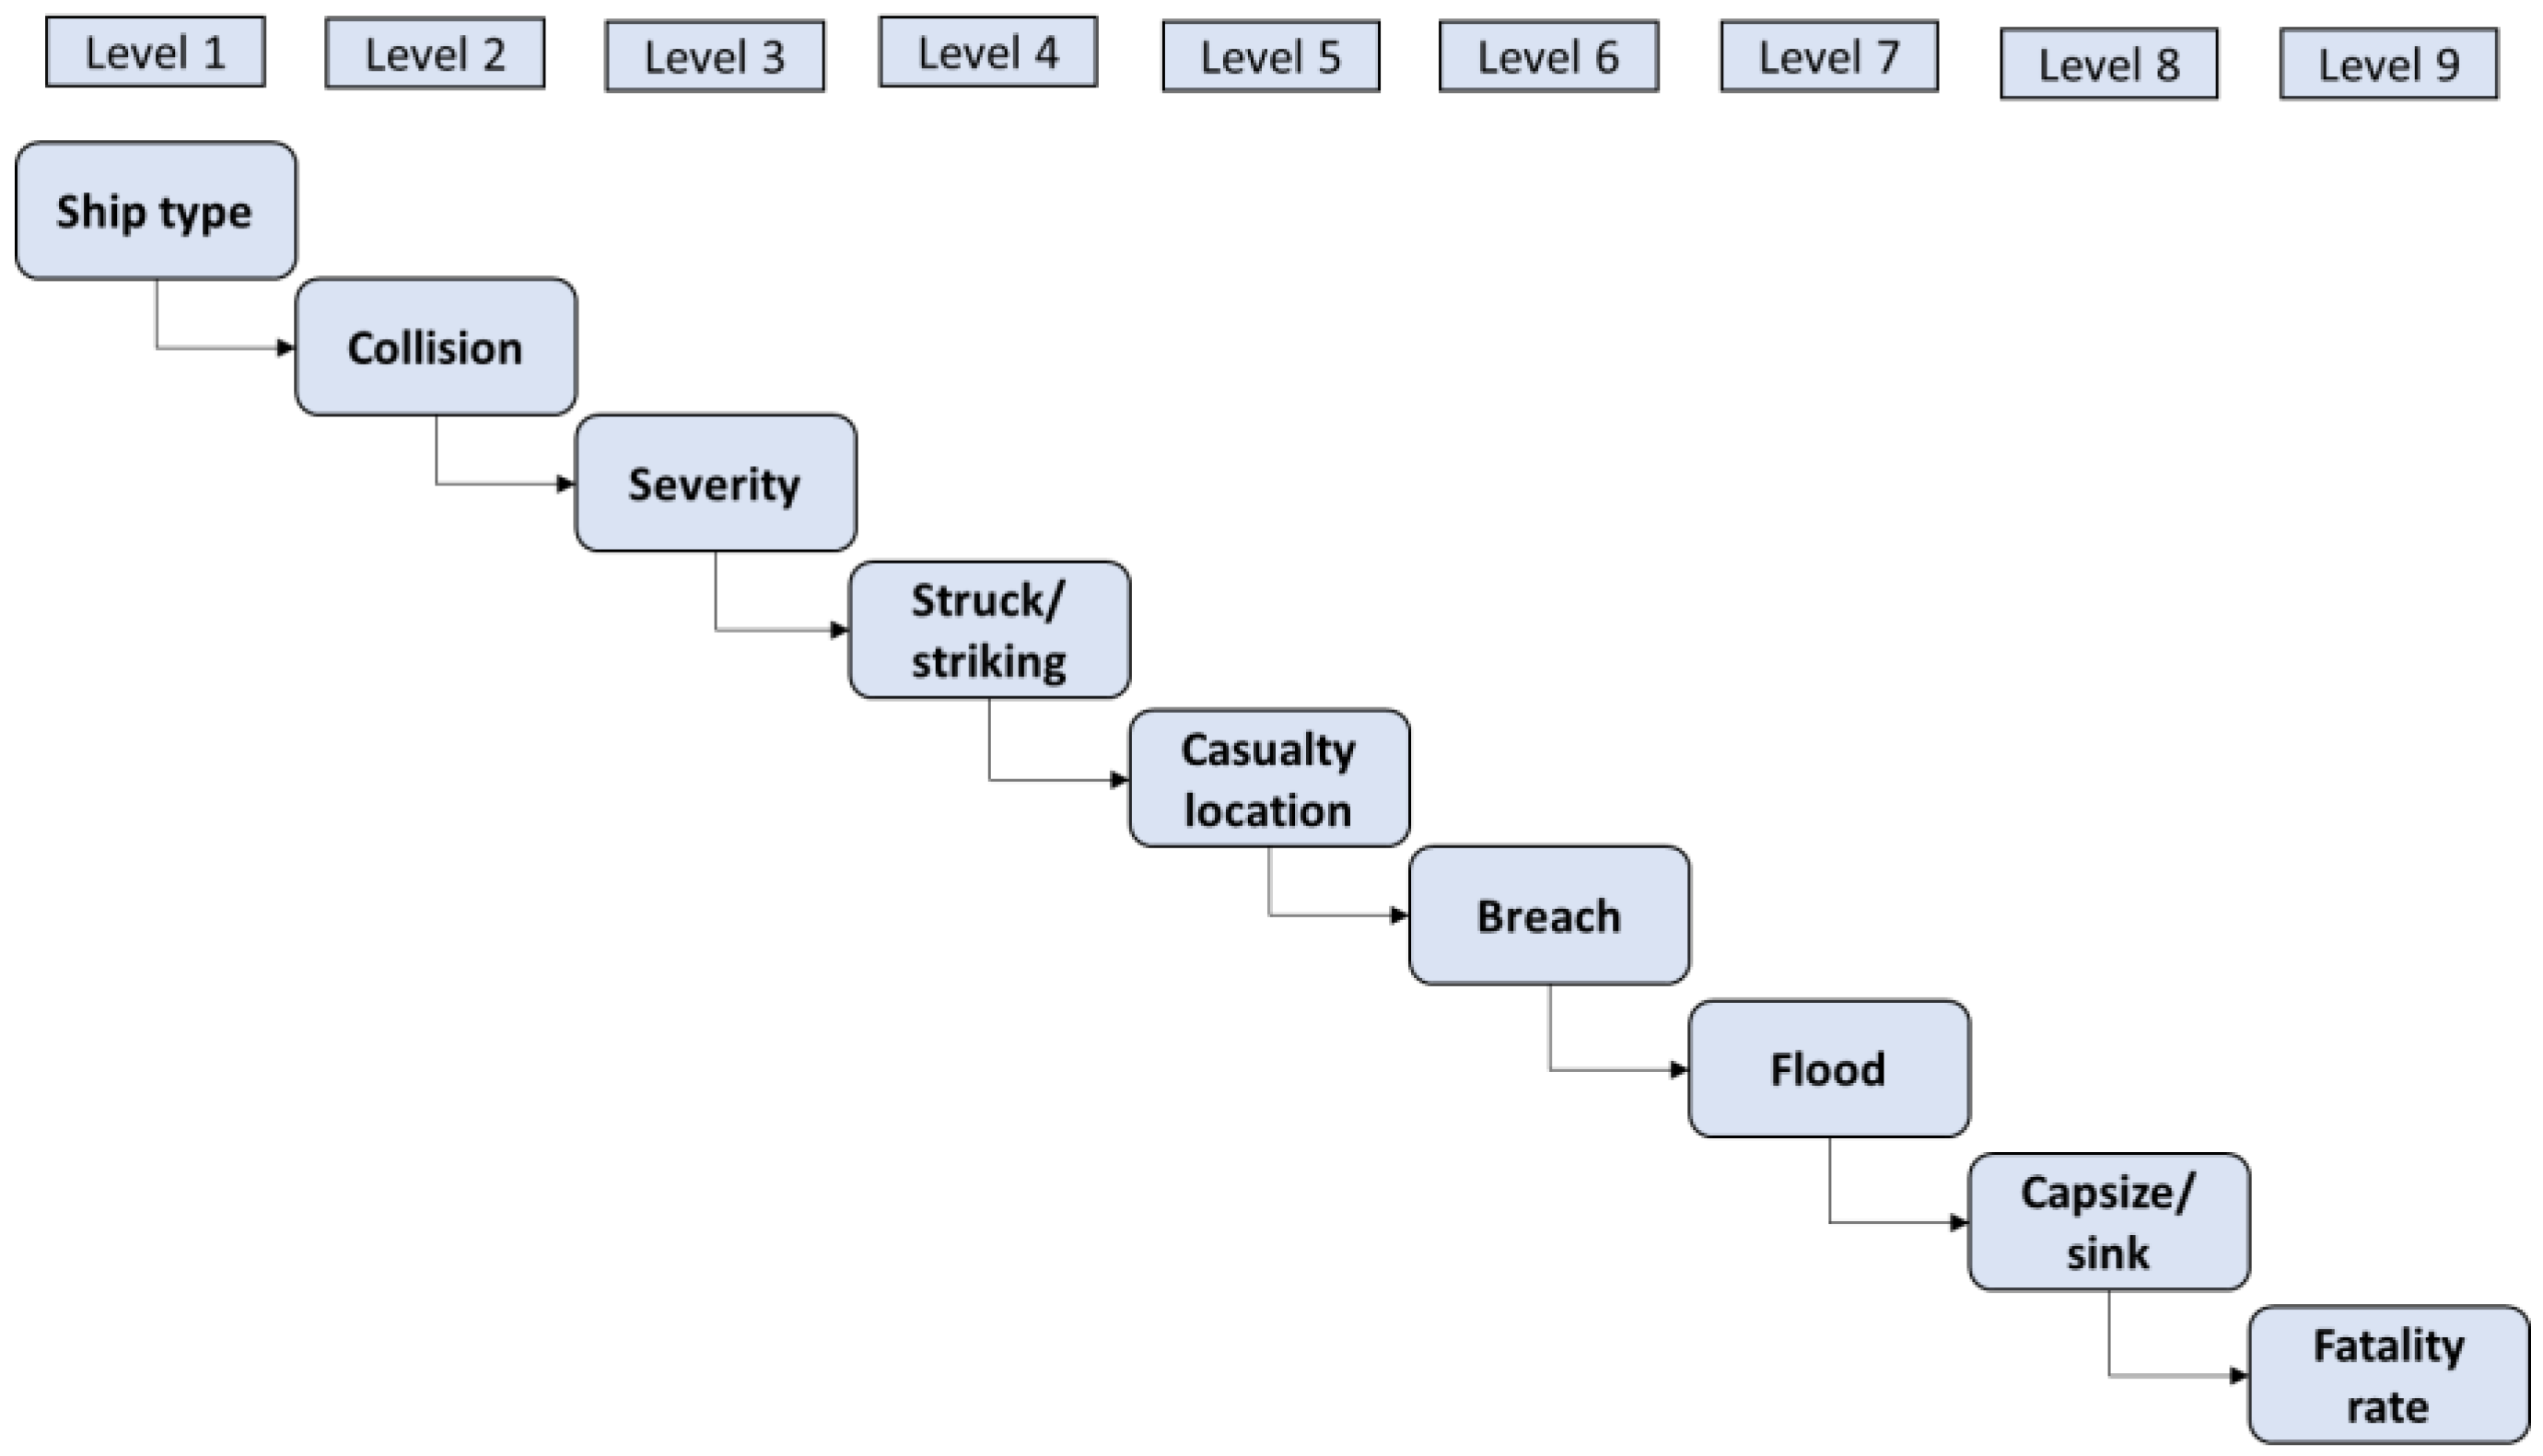
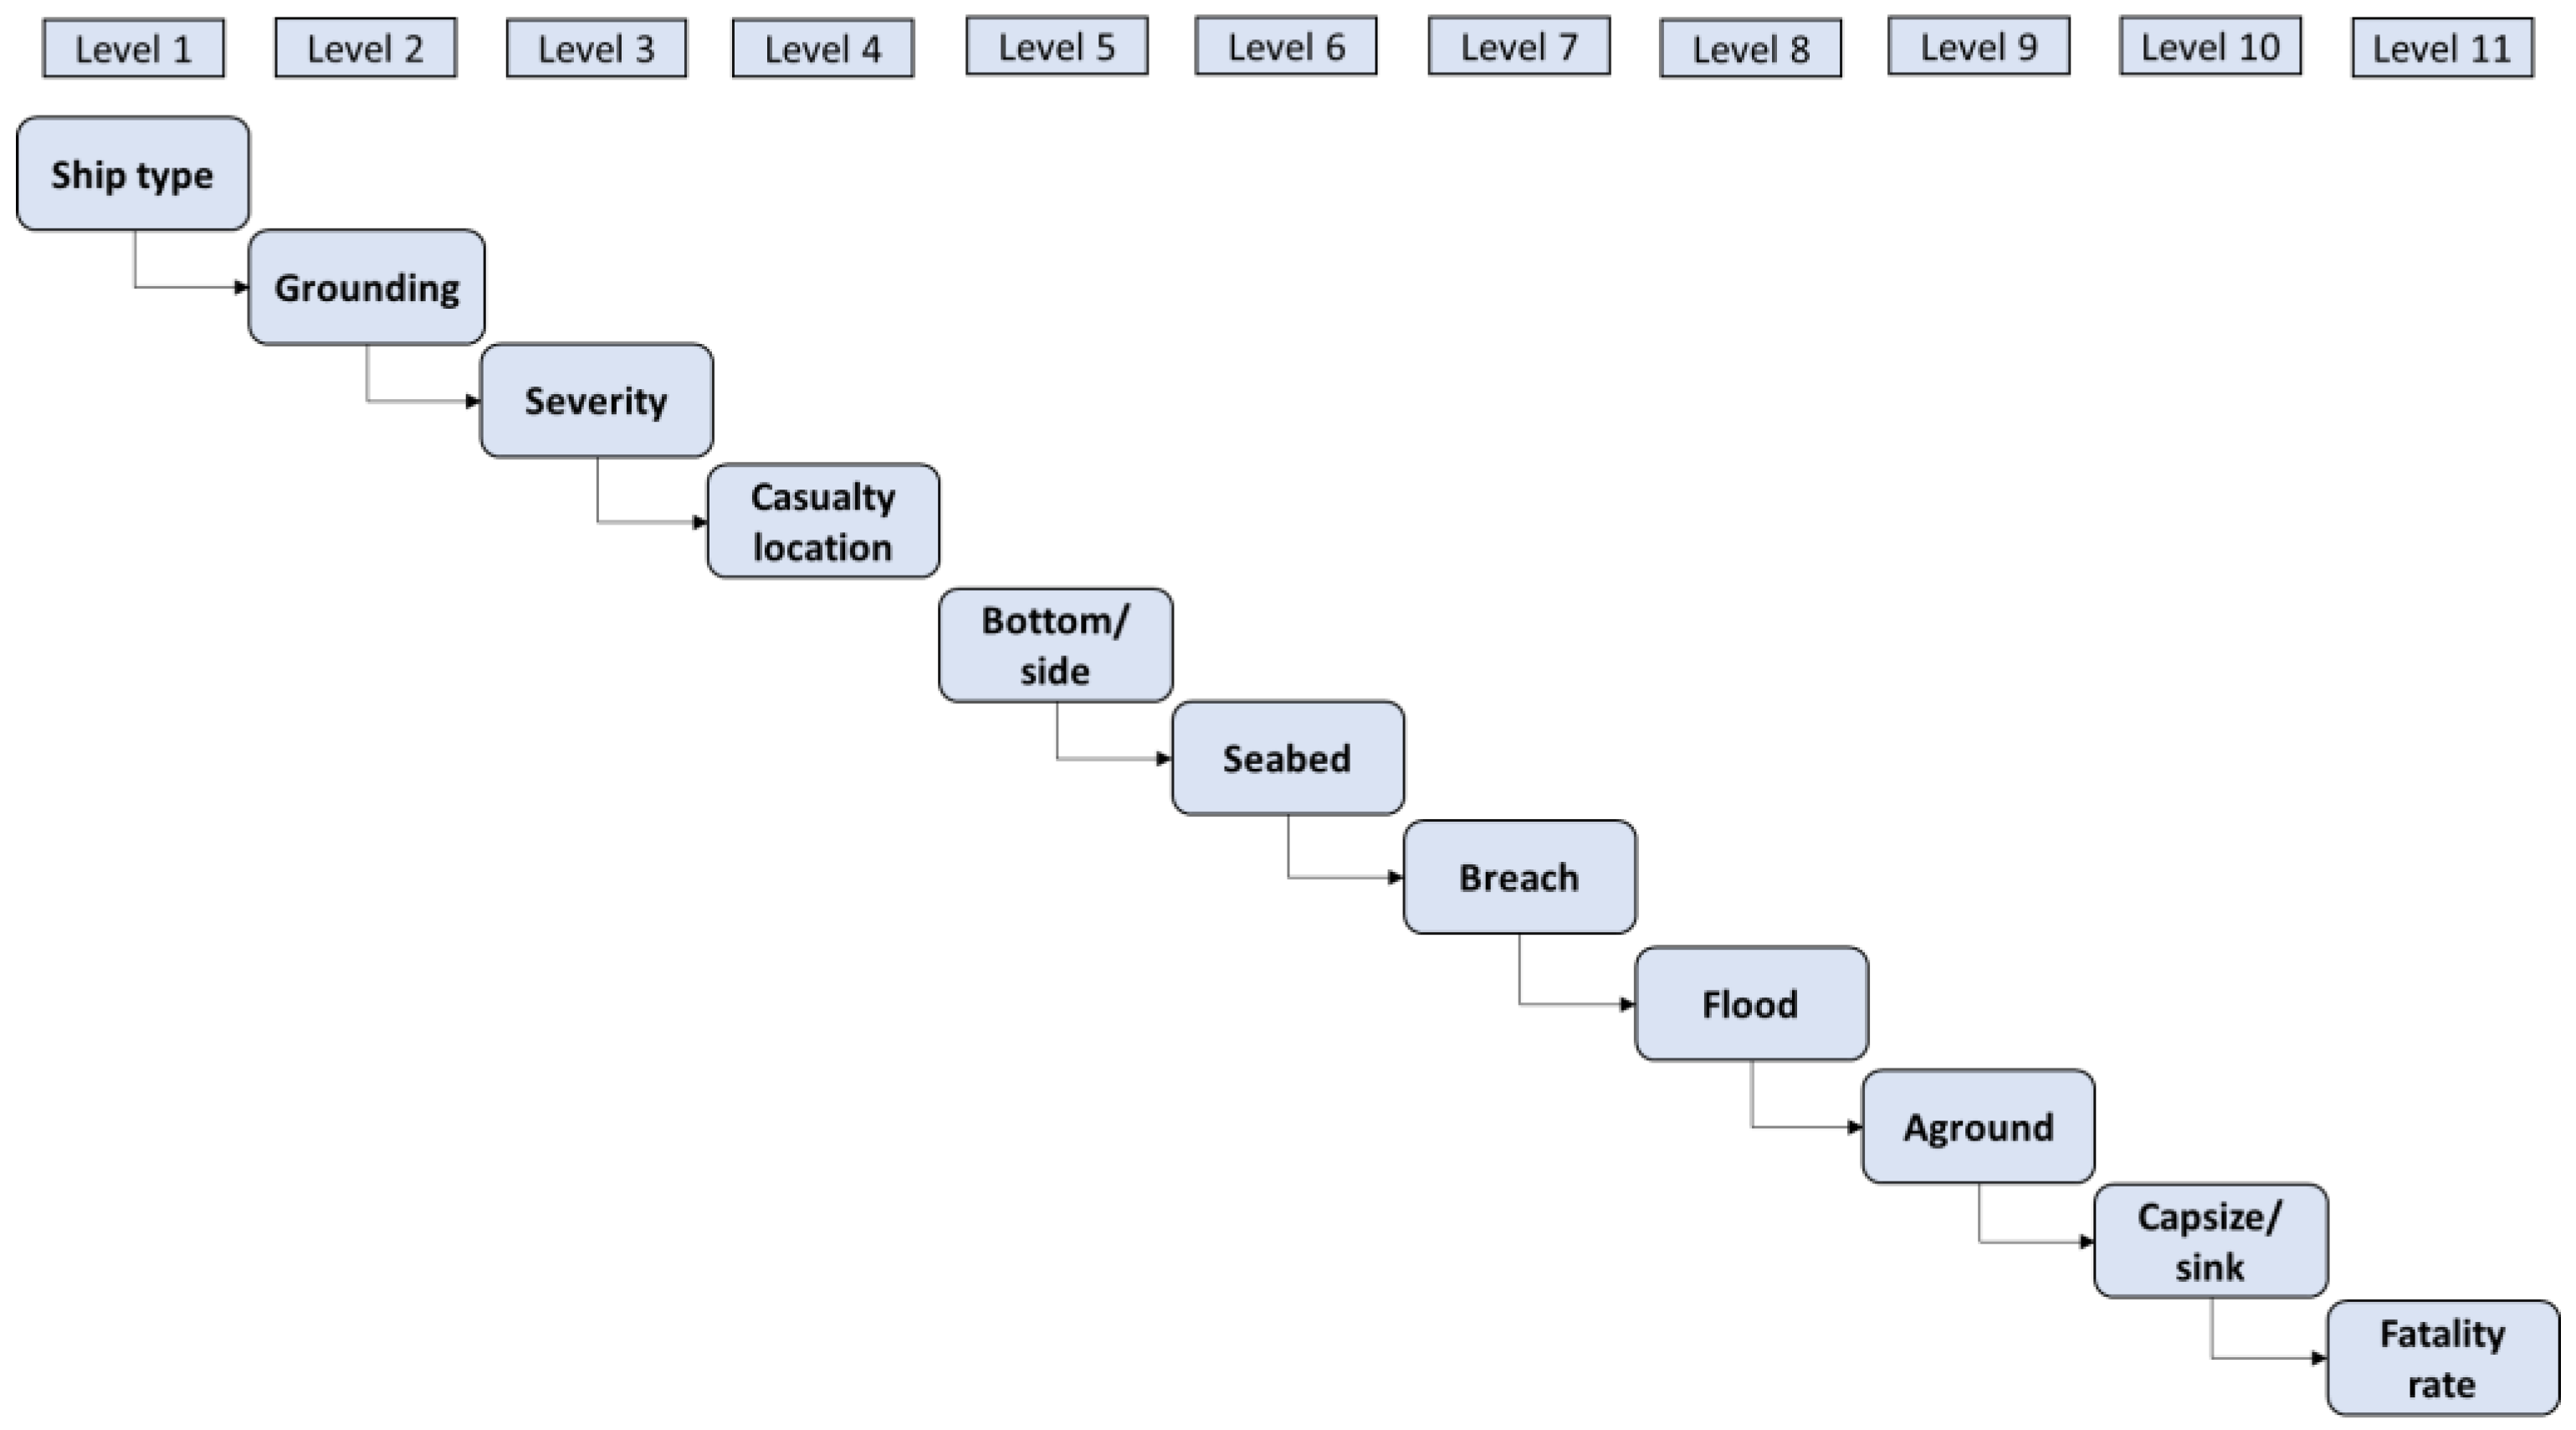
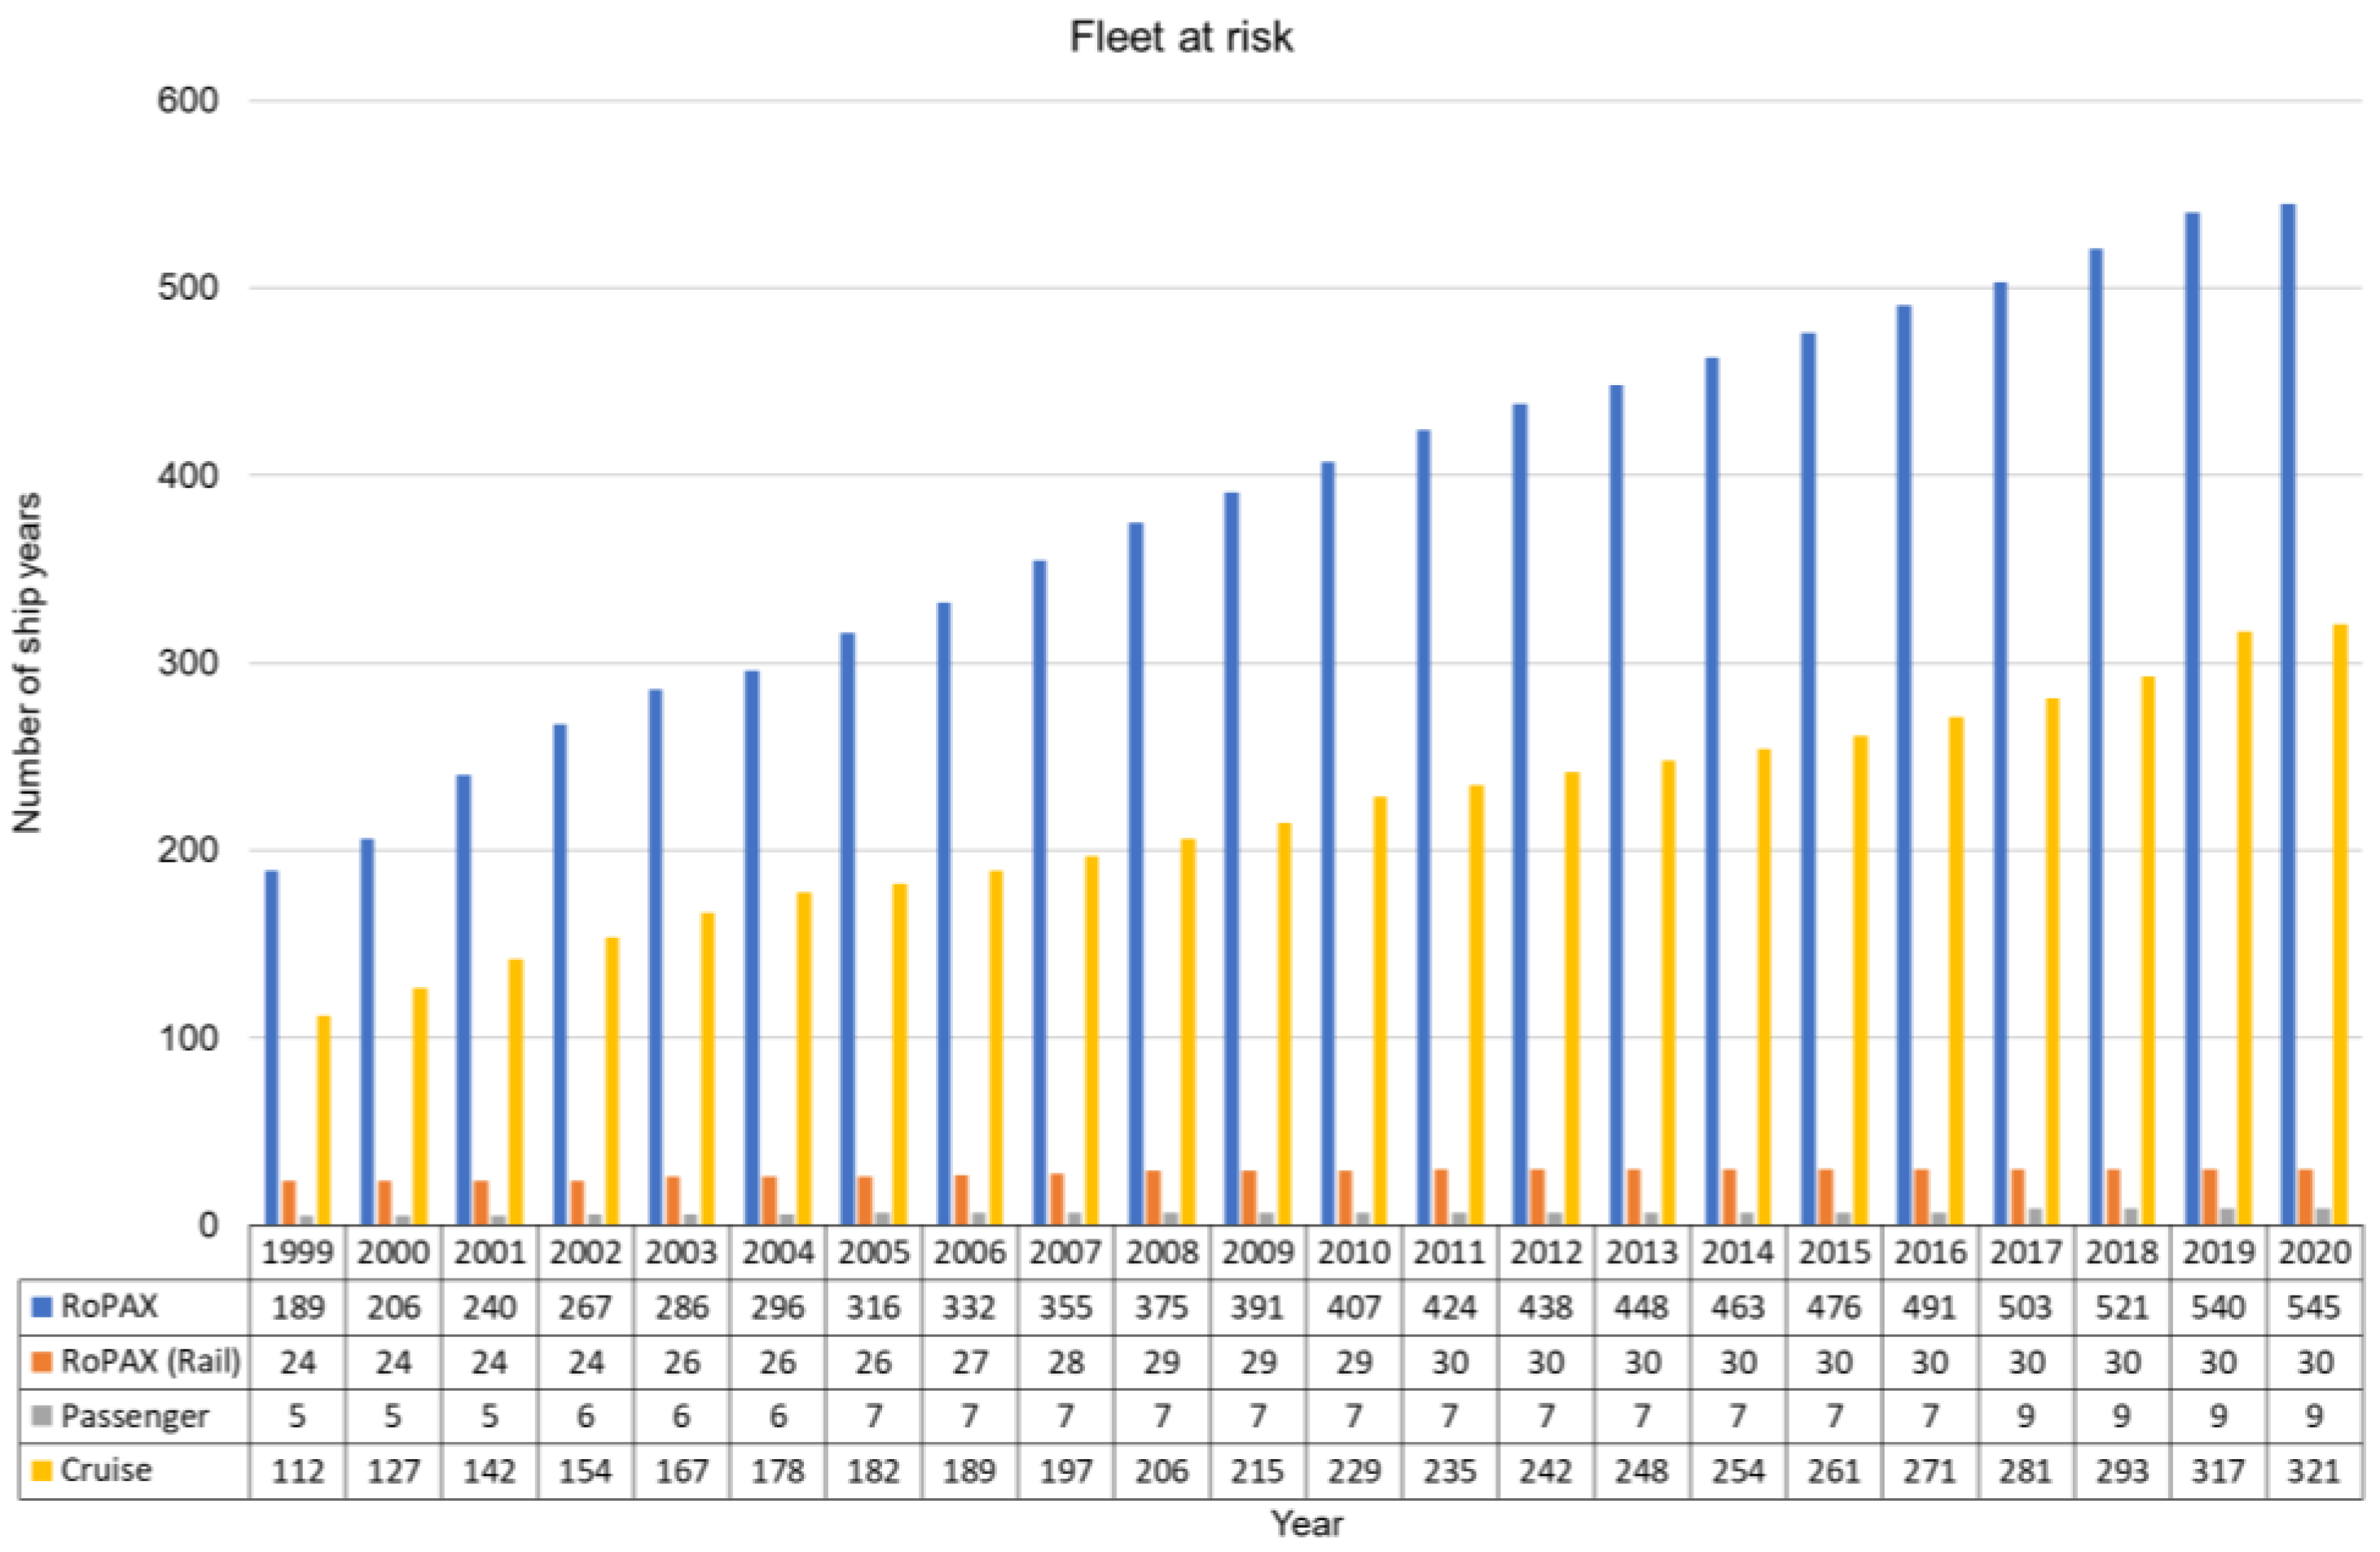
4.1.1. Level 1: Ship Type
4.1.2. Level 2: Accident Type
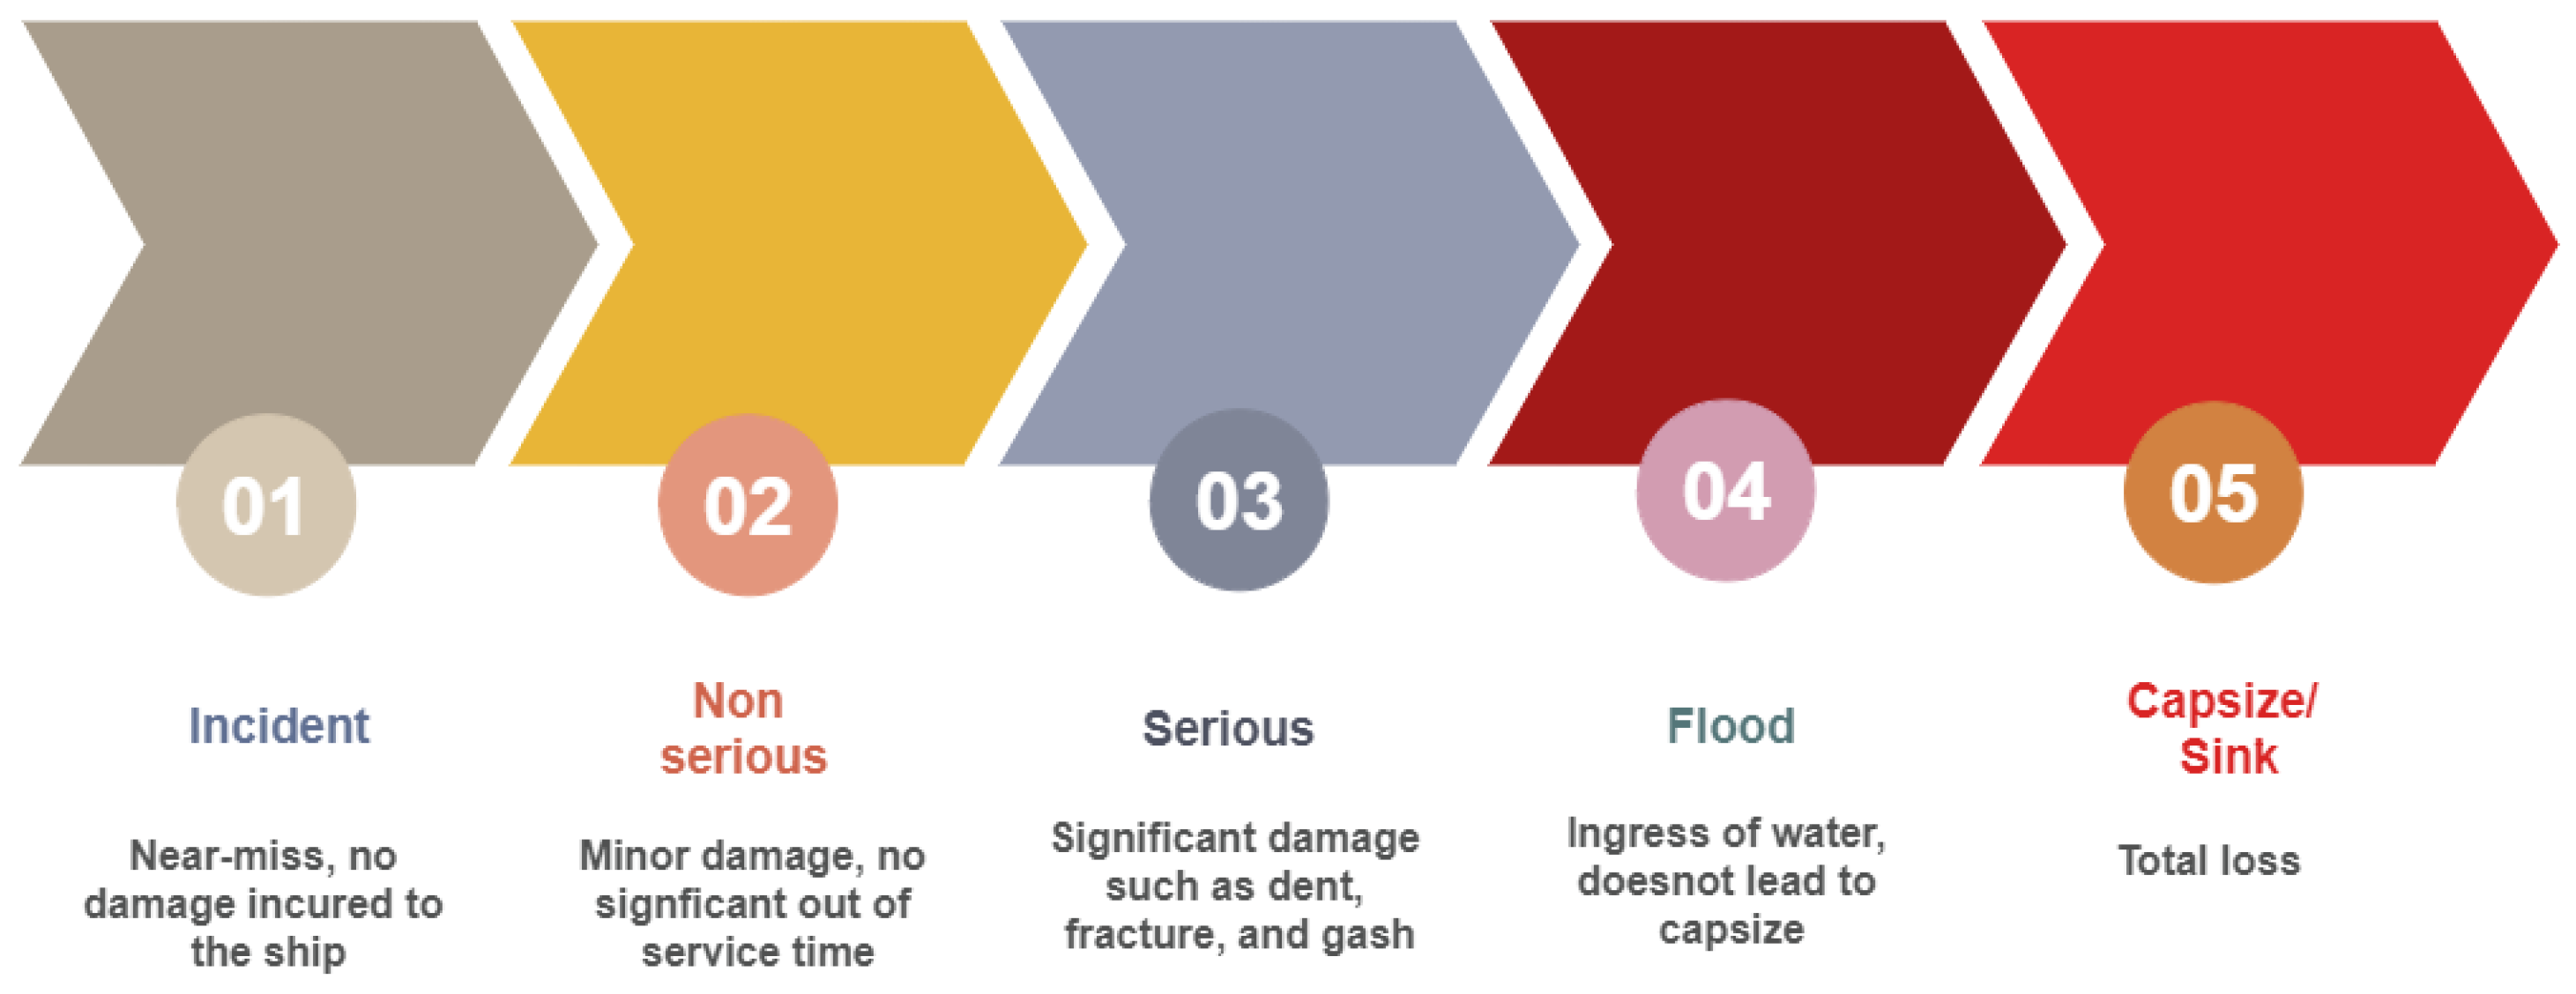
4.1.3. Level 3: Severity
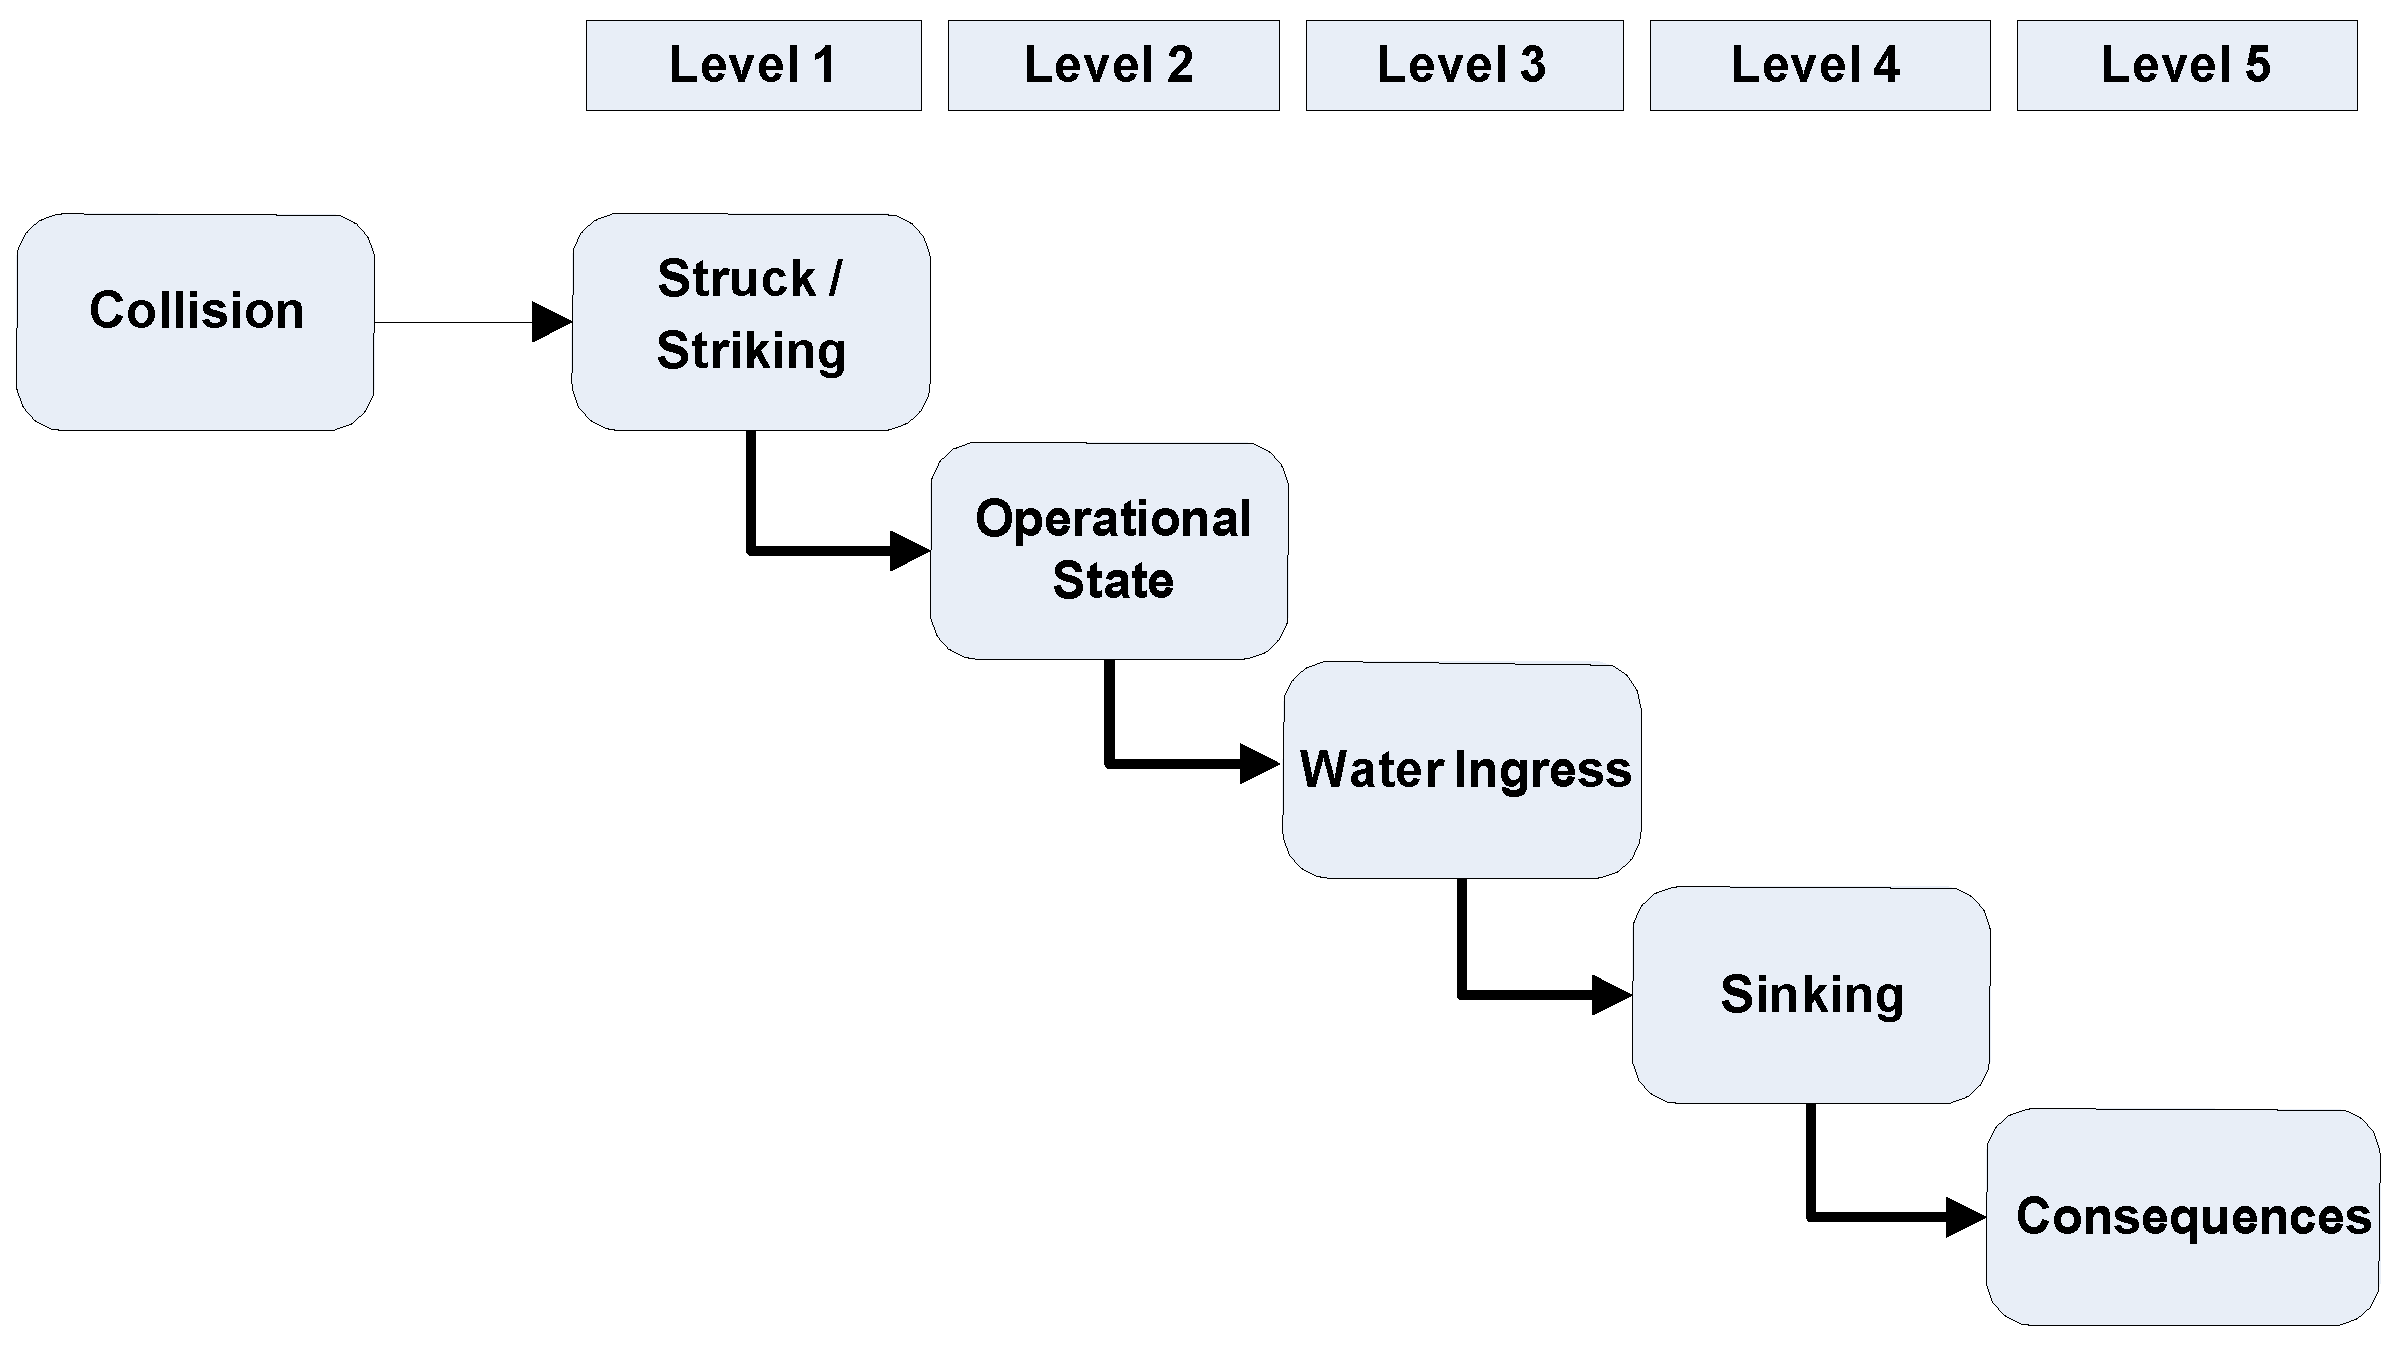
4.1.4. Level 4: Struck/Striking Ship (Collision)
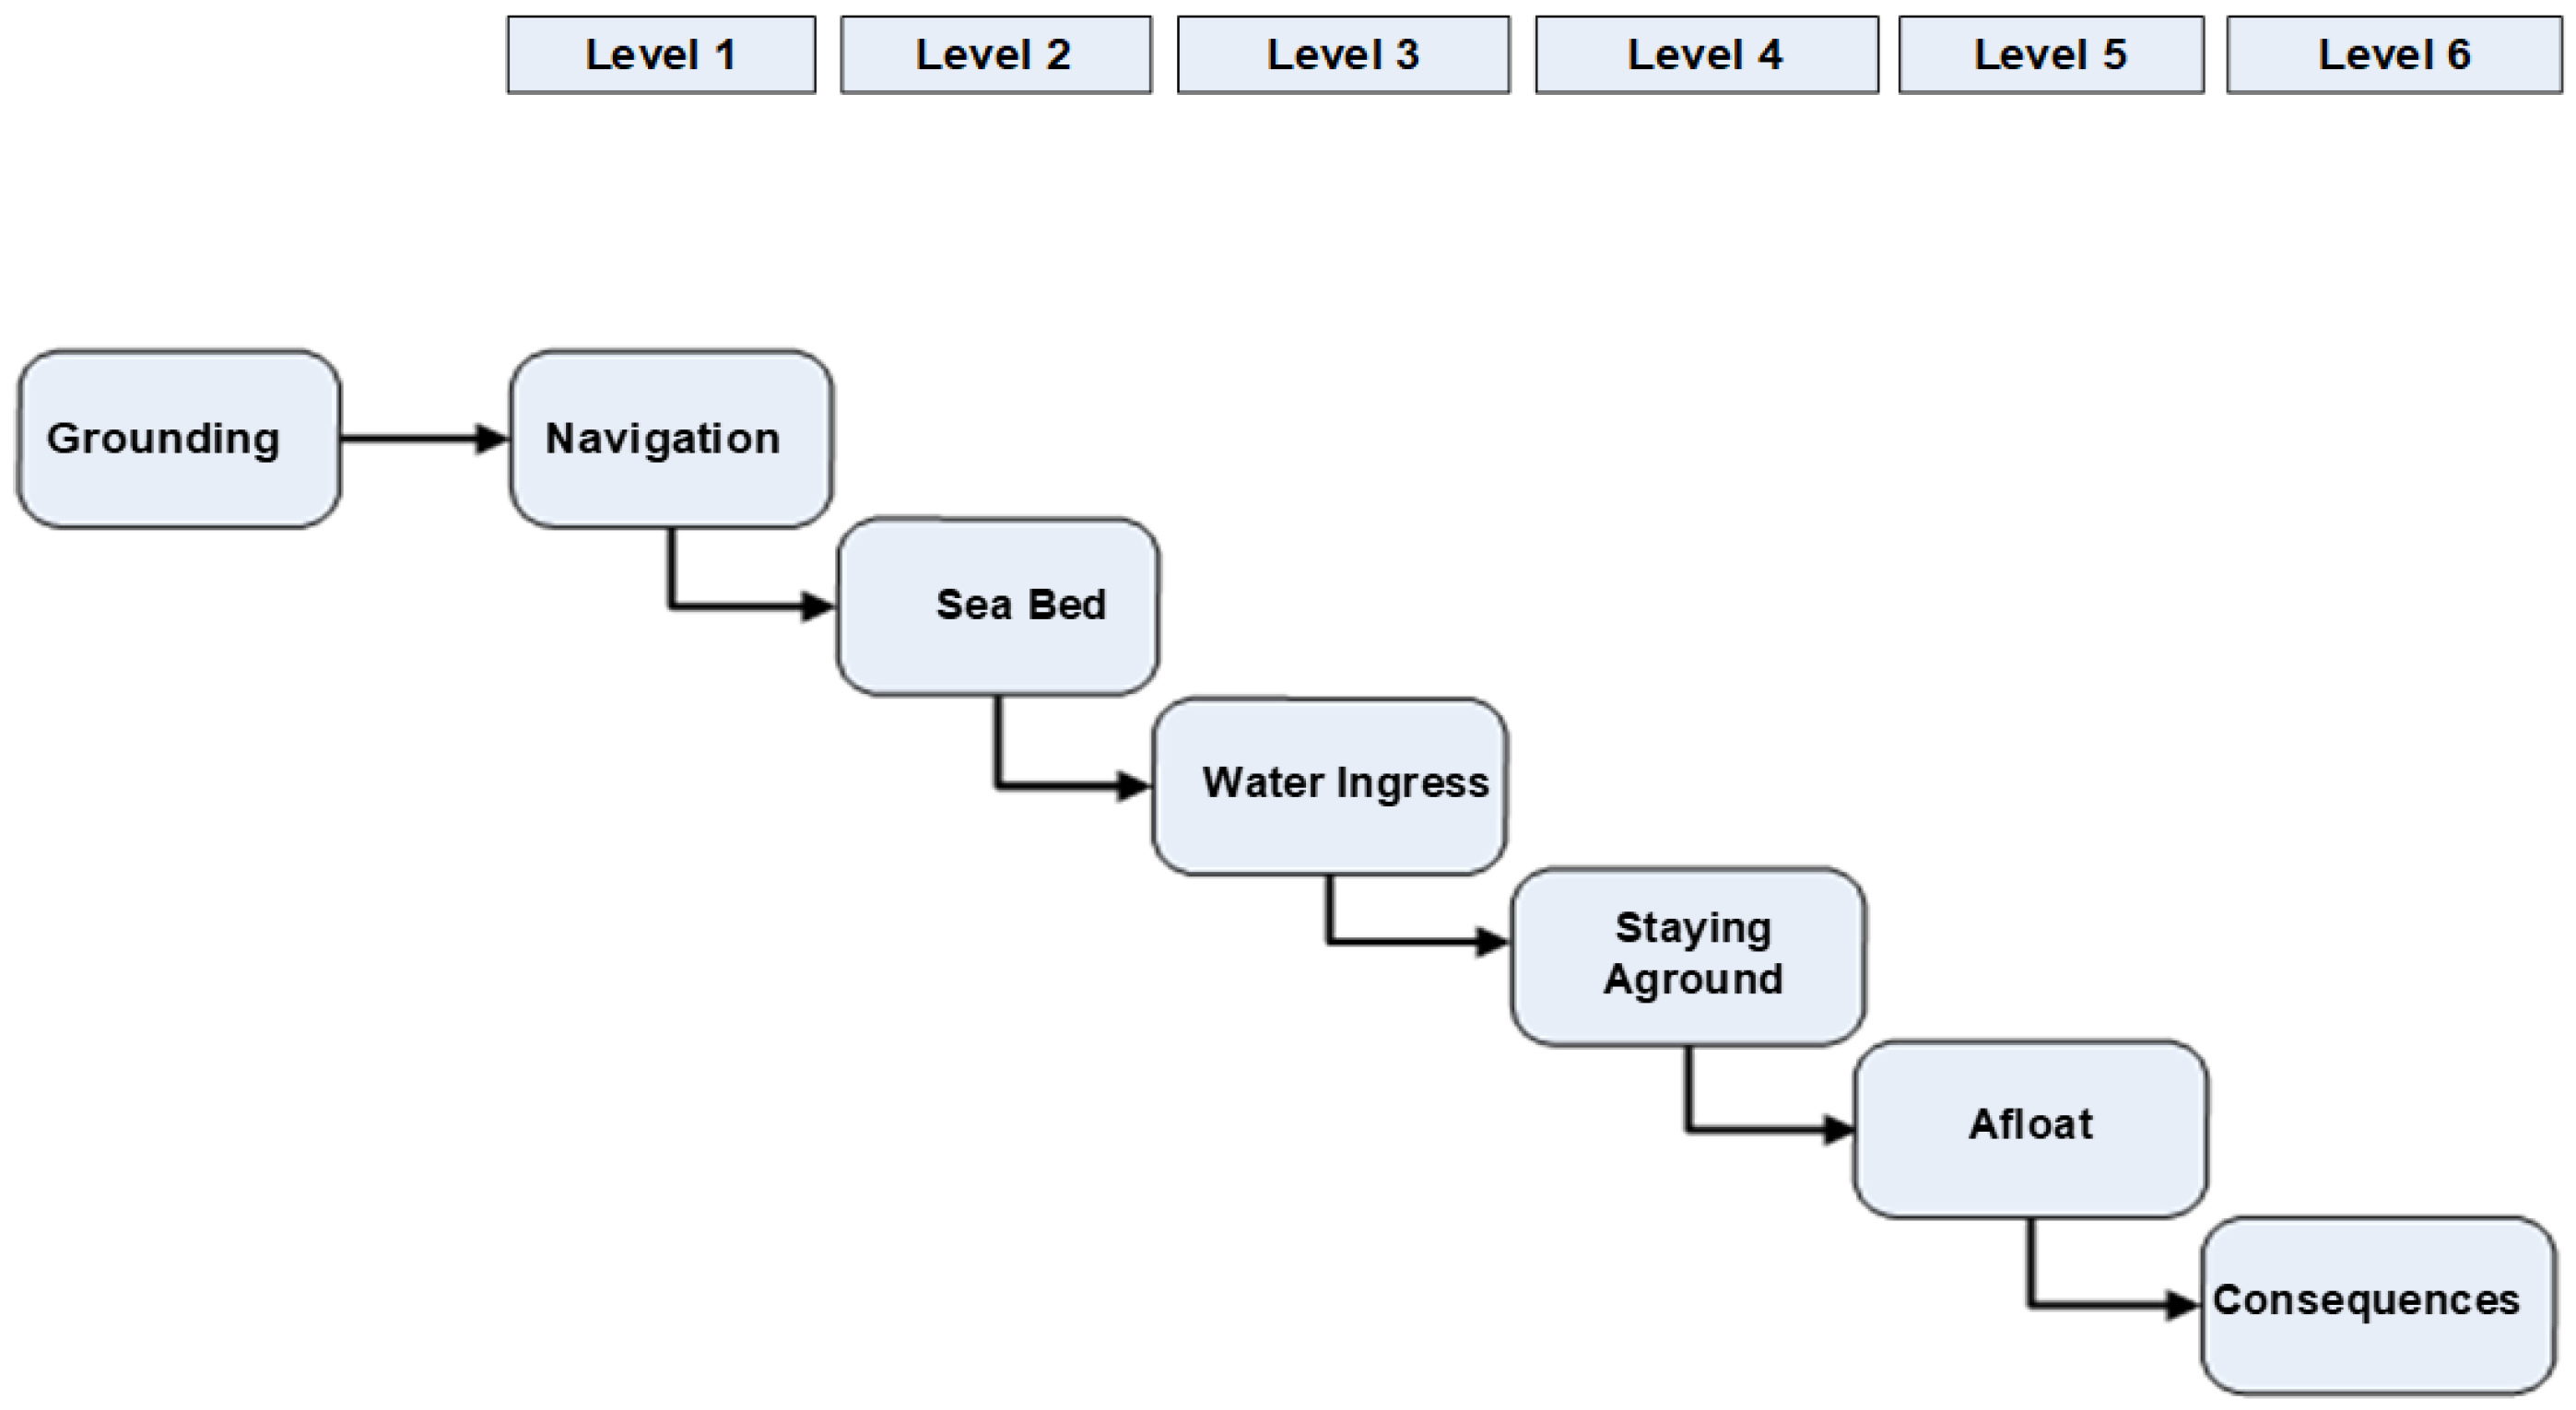
4.1.5. Operational Area (Collision and Grounding)
4.1.6. Hull Breach and Water Ingress
4.1.7. Capsize/Sink
4.1.8. Fatality Rate
- Accident period: 1999-01-01 to 2020-10-31 (last 20 years).
- Accident type: Collision and grounding (side and bottom groundings).
- Ship size: gross tonnage (GT) ≥ 3500.
- Ship length (overall): ≥ 80 m.
- Ship type: Cruise, RoPax, Pure passenger and RoPax (Rail).
- Location: Worldwide.
- Class type: IACS and non-IACS (the latter, for the fleet at risk).
4.2. Risk-Based Safety Metric—SM (eSAFE)
5. Concluding Remarks
- Lack in contemporary knowledge, methods and tools for a direct assessment of damage stability and ensuing risk on a ship- and accident-specific basis.
- The need to ensure inbuilt resilience in ship design to limit catastrophic consequences fuelled an approach based on accidents statistics with damage limitation in mind.
- The need to rationalise such an approach for application to all ship types and with focus only on new buildings, made such an approach progressively less relevant and, ultimately, too abstract. This, in turn, necessitated ship-specific developments and, ultimately a better understanding of the limitations, fuelling focus on direct assessment methods with tangible benefits, yet to be fully realised.
- Generally speaking, there is a consistent methodology underlying such development over the past half a century.
- The focus is now clear and the effort more targeted rendering the subject sound from a research perspective whilst providing a platform for exciting new ship designs and safer operation.
Author Contributions
Funding
Institutional Review Board Statement
Informed Consent Statement
Acknowledgments
Conflicts of Interest
References
- Vassalos, D.; Guarin, L. Designing for damage stability and survivability—Contemporary developments and implementation. Ship Sci. Technol. 2009, 1, 59–71. [Google Scholar]
- IMO. SOLAS-International Convention for the Safety of Life at Sea; IMO: London, UK, 2009. [Google Scholar]
- Wendel, K. Die Wahrscheinlichkeit des Uberstehens von Verletzungen. Schiffstechnik 1960, 7, 47–61. [Google Scholar]
- Wendel, K. Subdivision of ships. In Proceedings of the 1968 Diamond Jubilee International Meeting—75th Anniversary; Paper No. 12. SNAME: New York, NY, USA, 1968; p. 27. [Google Scholar]
- Zhang, M.; Conti, F.; Vassalos, D.; Kujala, P.; Lindroth, D.; Hirdaris, S. Direct assessment of ship collision damage and flooding risk. Ocean Eng. 2020, accepted. [Google Scholar]
- Vassalos, D.; Paterson, D. Towards unsinkable ships. Ocean Eng. 2021, 232, 109096. [Google Scholar] [CrossRef]
- Vassalos, D.; Jasionowski, A.; Dodworth, K.; Allan, T.; Matthewson, B. Time-based Survival Criteria for Ro-Ro Vessels; RINA Spring Meetings: London, UK, 1998. [Google Scholar]
- Vassalos, D.; Turan, O.; Pawlowski, M. Dynamic stability assessment of damaged ships and proposal of rational survival criteria. J. Mar. Technol. 1997, 34, 241–269. [Google Scholar]
- Tsakalakis, N.; Cichowicz, J.; Vassalos, D. The concept of the capsize band revisited. In Proceedings of the 11th International Ship Stability Workshop, Wageningen, The Netherlands, 21–23 June 2010. [Google Scholar]
- Jasionowski, A. Study of the Specific Damage Stability Parameters of Ro-Ro Passenger Vessels According to SOLAS 2009 Including Water on Deck Calculation; European Maritime Safety Agency: Lisbon, Portugal, 2009. [Google Scholar]
- Jasionowski, A. Study of the Specific Damage Stability Parameters of Ro-Ro Passenger Vessels According to SOLAS 2009 Including Water on Deck Calculation. 2nd EMSA Study on Damage Stability of RoPax Vessels, Project No EMSA/OP/08/2009; Ship Stability Research Centre, University of Strathclyde: Strathclyde, UK, 2009. [Google Scholar]
- GOALDS. Goal-Based Damage Stability. In Project funded by the European 13th Commission, FP7- DG Research, Grant Agreement 233876; IMO Publishing: London, UK, 2009–2012. [Google Scholar]
- HARDER. Harmonisation of Rules and Design Rationale; EC Contact No. GDRB-CT-1998-00028, Final Technical Report; IMO Publishing: London, UK, 1999–2003. [Google Scholar]
- Cichowicz, J.; Tsakalakis, N.; Vassalos, D.; Jasionowski, A. Damage survivability of passenger ships—Re-engineering the safety factor. Safety 2016, 2, 4. [Google Scholar] [CrossRef]
- IMCO. Resolution A.265 VIII, Regulations on Subdivision and Stability of Passenger Ships as Equivalent to Part B of Chapter II of the International Convention for the Safety of Life at Sea, 1960; IMCO: London, UK, Adopted November 1973. [Google Scholar]
- Bird, H.; Browne, R. Damage Stability Model Experiments; 0035-8967; RINA: Genoa, Italy, 1973; Volume 116, pp. 69–91. [Google Scholar]
- Middleton, E.; Numata, E. Tests of a Damaged Stability Model in Waves; SNAME Transactions: Washington, DC, USA, 1970. [Google Scholar]
- Vassalos, D.; Papanikolaou, A. Stockholm Agreement—Past, Present and Future (Part 2). Mar. Technol. 2002, 39, 137–158,199–210. [Google Scholar]
- Vassalos, D.; Pawlowski, M.; Turan, O. Criteria for survival in damaged condition. In Ship Hydromechanics and Structures; Delft Technical University: Wageningen, The Netherlands, 1995. [Google Scholar]
- Tagg, R.; Tuzcu, C. A Performance-based Assessment of the Survival of Damaged Ships—Final Outcome of the EU Research Project HARDER. In Proceedings of the 6th International Ship Stability Workshop (ISSW), New York, NY, USA, 13–16 October 2002. [Google Scholar]
- IMO. Resolution 14 Agreement Concerning Specific Stability Requirements for Ro-Ro Passenger Ships Undertaking Regular Scheduled International Voyages Between or To or From Designated Ports in North West Europe and the Baltic Sea; IMO: London, UK, 1996. [Google Scholar]
- Tuzcu, C. Development of factors: The damage survival probability. In Proceedings of the 8th International Conference on the Stability of Ships and Ocean Vehicles (STAB2003), Madrid, Spain, 15–19 September 2003. [Google Scholar]
- Jasionowski, A. Survival Criteria for Large Passenger Ships; SAFENVSHIP Project, Final Report; Safety at Sea Ltd.: Glasgow, UK, 2005. [Google Scholar]
- Vassalos, D.; York, A.; Jasionowski, A.; Kanerva, M.; Scott, A. Design implications of the new harmonised probabilistic damage stability regulations. Int. Shipbuild. Prog. 2007, 339–361. [Google Scholar]
- Vassalos, D.; Jasionowski, A. SOLAS 2009—Raising the Alarm. In Contemporary Ideas on Ship Stability and Capsizing in Waves; Neves, M., Ed.; Springer: Berlin/Heidelberg, Germany, 2011. [Google Scholar]
- Spanos, D.; Papanikolaou, A. Considerations on the survivability assessment of damaged ships. In Proceedings of the 12th International Ship Stability Workshop (ISSW2011), Washington, DC, USA, 12–15 June 2011. [Google Scholar]
- Pawlowski, M. Developing the s-factor. In Proceedings of the 10th International Conference on Stability of Ships and Ocean Vehicles (STAB2009), St. Petersburg, Russia, 22–26 June 2009. [Google Scholar]
- Heimvik, N. Wave Height Distribution According to Damage Statistics; HARDER (Harmonisation of Rules and Design Rationale) project No: GRD1-1999-10721, Report No: 3-33-W-2001-01-0; DNV: Hovik, Norway, 2001. [Google Scholar]
- Tagg, R. Comparison of survivability between SOLAS 90/95 and SOLAS 2009 ships—A retrospective view of 10 years on from project HARDER. In Proceedings of the 14th International Ship Stability Workshop (ISSW2014), Kuala Lumpur, Malaysia, 29 September–1 October 2014. [Google Scholar]
- Luhmann, H.; Bulian, G.; Vassalos, D.; Olufsen, O.; Seglem, I.; Pottgen, J. eSAFE-D4.3.2–Executive Summary, Joint Industry Project eSAFE-Enhanced Stability After a Flooding Event—A Joint Industry Project on Damage Stability for Cruise Ships. Cruise Ship Safety Forum (CSSF), 2018. Available online: https://cssf.cruising.org/references?rq=esafe (accessed on 20 May 2021).
- FLARE. EU H2020—MG2.2 Flooding Accident Response. 2019–2022. Available online: https://flare-project.eu/ (accessed on 14 June 2021).
- European Maritime Safety Agency. EMSA III/OP/10/2013: Risk Level and Acceptance Criteria for Passenger Ships; DNV GL: Hovik, Norway, 2014. [Google Scholar]
- Bulian, G.; Cardinale, M.; Francescutto, A.; Zaraphonitis, G. Complementing SOLAS damage ship stability framework with a probabilistic description for the extent of collision damage below the waterline. Ocean Eng. 2019, 186, 106073. [Google Scholar] [CrossRef]
- Bulian, G.; Cardinale, M.; Dafermos, G.; Eliopoulou, E.; Francescutto, A.; Hamann, R.; Lindroth, D.; Luhmann, H.; Ruponen, P.; Zaraphonitis, G. Considering collision, bottom grounding and side grounding/contact in a common non-zonal framework. In Proceedings of the 17th International Ship Stability Workshop (ISSW 2019), Helsinki, Finland, 10–12 June 2019. [Google Scholar]
- Bulian, G.; Lindroth, D.; Ruponen, P.; Zaraphonitis, G. Probabilistic assessment of damaged ship survivability in case of grounding: Development and testing of a direct non-zonal approach. Ocean Eng. 2016, 120, 331–338. [Google Scholar] [CrossRef]
- Bulian, G.; Cardinale, M.; Dafermos, G.; Lindroth, D.; Ruponen, P.; Zaraphonitis, G. Probabilistic assessment of damaged survivability of passenger ships in case of grounding or contact. Ocean Eng. 2020, 218, 107396. [Google Scholar] [CrossRef]
- Mujeeb-Ahmed, M.P.; Vassalos, D.; Boulougouris, E. Development of collision and grounding accident database for large passenger ships. In Proceedings of the First International Conference on the Stability and Safety of Ships and Ocean Vehicles (STAB&S 2021), Glasgow, UK, 7–11 June 2021. [Google Scholar]
- Mujeeb-Ahmed, M.P.; Vassalos, D.; Boulougouris, E. Probabilistic damage distribution and risk modelling of collision and grounding accidents for large passenger ships. In Proceedings of the First International Conference on the Stability and Safety of Ships and Ocean Vehicles (STAB&S 2021), Glasgow, UK, 7–11 June 2021. [Google Scholar]


| Accident Type | No. of Casualties | Fleet at Risk | Initial Frequency | ||||
|---|---|---|---|---|---|---|---|
| RoPax | Cruise | RoPax | Cruise | RoPax | Cruise | Passenger Ships (RoPax and Cruise) | |
| Collision | 59 | 9 | 9125 | 4974 | 6.47 × 10⁻³ | 1.81 × 10⁻³ | 8.28 × 10⁻³ |
| Grounding | 120 | 44 | 1.32 × 10⁻² | 8.85 × 10⁻³ | 2.2 × 10⁻² | ||
| Ship Type | Collision (CL) | Side Grounding (GR-S) | Bottom Grounding (GR-B) | |||
|---|---|---|---|---|---|---|
| RoPax | 59 | 50 | 70 | 0.330 | 0.279 | 0.391 |
| Cruise | 9 | 15 | 29 | 0.170 | 0.283 | 0.547 |
| Total | 68 | 65 | 99 | 0.293 | 0.280 | 0.427 |
| Ship Type | Collision (CL) | Side Grounding (GR-S) | Bottom Grounding (GR-B) | |||
|---|---|---|---|---|---|---|
| RoPax | 15 | 25 | 21 | 0.246 | 0.410 | 0.344 |
| Cruise | 1 | 12 | 8 | 0.048 | 0.571 | 0.381 |
| Total | 16 | 37 | 29 | 0.208 | 0.481 | 0.377 |
(-) | (-) | (-) | (1/Ship-Year) | |
|---|---|---|---|---|
| Cruise | 0.05 | 0.38 | 0.57 | 1.07 × 10⁻² |
| RoPax | 0.25 | 0.34 | 0.41 | 1.96 × 10⁻² |
Publisher’s Note: MDPI stays neutral with regard to jurisdictional claims in published maps and institutional affiliations. |
© 2021 by the authors. Licensee MDPI, Basel, Switzerland. This article is an open access article distributed under the terms and conditions of the Creative Commons Attribution (CC BY) license (https://creativecommons.org/licenses/by/4.0/).
Share and Cite
Vassalos, D.; Mujeeb-Ahmed, M.P. Conception and Evolution of the Probabilistic Methods for Ship Damage Stability and Flooding Risk Assessment. J. Mar. Sci. Eng. 2021, 9, 667. https://doi.org/10.3390/jmse9060667
Vassalos D, Mujeeb-Ahmed MP. Conception and Evolution of the Probabilistic Methods for Ship Damage Stability and Flooding Risk Assessment. Journal of Marine Science and Engineering. 2021; 9(6):667. https://doi.org/10.3390/jmse9060667
Chicago/Turabian StyleVassalos, Dracos, and M. P. Mujeeb-Ahmed. 2021. "Conception and Evolution of the Probabilistic Methods for Ship Damage Stability and Flooding Risk Assessment" Journal of Marine Science and Engineering 9, no. 6: 667. https://doi.org/10.3390/jmse9060667
APA StyleVassalos, D., & Mujeeb-Ahmed, M. P. (2021). Conception and Evolution of the Probabilistic Methods for Ship Damage Stability and Flooding Risk Assessment. Journal of Marine Science and Engineering, 9(6), 667. https://doi.org/10.3390/jmse9060667