Article

Source Levels of 20 Hz Fin Whale Notes Measured as Sound Pressure and Particle Velocity from Ocean-Bottom Seismometers in the North Atlantic

1
FCUL—Campo Grande Edifício C1, Instituto Dom Luiz (IDL), University of Lisbon, Piso 1, 1749-016 Lisboa, Portugal
2
OKEANOS—R&D Centre, Institute of Marine Research (IMAR), University of the Azores, 9900-138 Horta, Portugal
*
Author to whom correspondence should be addressed.
J. Mar. Sci. Eng. 2021, 9(6), 646; https://doi.org/10.3390/jmse9060646
Submission received: 7 May 2021 / Revised: 4 June 2021 / Accepted: 8 June 2021 / Published: 10 June 2021
(This article belongs to the Special Issue Ocean Noise: From Science to Management)

Abstract

:
Source level is one factor that determines the effectiveness of animal signal transmissions and their acoustic communication active space. Ocean-bottom seismometers (OBS) are platforms of opportunity to monitor marine species because they record data as pressure fluctuations in the water using a hydrophone and/or as particle velocity of the seabed using a seismometer. This study estimates source levels of 20 Hz fin whale notes recorded simultaneously in these two OBS channels and in two areas of the North Atlantic (Azores and southwest Portugal). It also discusses factors contributing to the variability of the estimates, namely geographical (deployment areas), instrumental (recording channels and sample size), and temporal factors (month of detected notes, inter-note interval, and diving duration). The average source level was 196.9 dB re 1 µPa m for the seismometer (derived from particle velocity measurements) and 186.7 dB re 1 µPa m for the hydrophone. Variability was associated with sample size, instrumental characteristics, acoustic propagation, and month of recordings. Source level estimates were very consistent throughout sequences, and there was no indication of geographical differences. Understanding what causes variation in animal sound source levels provides insights into the function of sounds and helps to assess the potential effects of increasing anthropogenic noise.

1. Introduction

Baleen whales produce low-frequency and high-intensity sounds that can be classified as calls or songs [1,2,3]. Calls are normally produced irregularly and have been associated with foraging activities [4], group cohesion [5], and mother–calf bonding [6]. Songs, on the other side, are regularly repeated sequences, with a widely accepted reproductive function, either to attract females, compete with other males, or both [7,8], and are especially suited for long-range communication [9]. However, the precise significance of most baleen whale sounds is still unknown because it is difficult to correlate a sound with a behavioral response and to determine its information content [2]. The distance over which an animal sound can be detected by individuals and by recording instruments is influenced by its source level [10,11], among other factors like source depth and sound propagation speed. Source level is one major factor to determine the transmission effectiveness of a sound and the acoustic communication active space among animals, which is defined as the area over which animals can exchange information [12]. Over the past few decades, ambient noise levels in the ocean, especially below 500 Hz, have increased in some regions, which seems to be linked with global economic growth [13,14]. These sounds can potentially have a more extensive impact on animals because they can travel farther distances due to their lower attenuation [15]. Their impact can be even more extensive in low-frequency biological sounds that can also travel great distances, and therefore, they can affect the propagation of these signals. Even though long-term measurements of ambient noise levels are not available for the Atlantic Ocean, several studies suggest sound levels below 100 Hz are increasing [16,17]. Since baleen whales seem to rely so strongly on sounds for their daily activities, changes in their acoustic environment may cause masking of their sounds and affect their behavior and ultimately their survival [18,19]. A noisy environment may cause animals to produce more complex sounds and increase source levels to compensate for the potential decrease in communication active space [18]. Under high noise conditions, baleen whales have been shown to produce calls with a higher average fundamental frequency [20,21], amplitude [22], and duration [21], and with higher source levels [23,24]. Disruptions in baleen whale call production have also been reported, but the relationship with noise is not clear due to opposing observed tendencies [20,21,24,25,26].
Fin whales produce long sequences of sounds with patterned intervals, classified as songs, lasting for numerous hours [3,27]. The most common sound included in these songs is the 20 Hz note, a 1 s pulse that downsweeps in frequency from 30 to 15 Hz [28,29]. Since signaling in long sequences, which is characteristic of this species, is considered a singing behavior, the sounds included in songs are termed “notes”. Source level estimates of the 20 Hz fin whale note have been reported throughout the world’s oceans and range from 159 to 220 dB re:1 l µPa at 1 m [10,30,31,32,33]. The combined high source levels and small propagation loss of the 20 Hz note result in communication active spaces of hundreds of km for fin whales under favorable conditions [9,32,34]. Although there is evidence of regional differences in fin whale songs that may be linked to population structure [34,35,36], there is no indication of differences in source levels of the 20 Hz note between populations, nor have there been any significant changes in the estimates over the past 50 years [31]. However, the variability in source level estimates in published studies can be high, up to approximately 40 dB [31]. In addition, within a fin whale song, 20 Hz notes can also show highly variable source levels [28,31,37].
To make any inferences about the variability caused by biotic factors, it is necessary to undertake an assessment of the instrumental and methodological factors that can cause source levels to vary. Miksis-Odls et al. (2019) [31] described several factors that can contribute to the variability in estimates of source levels of fin whale notes: hardware configuration, signal detection methods, sample size, location, recorded time, and acoustic propagation modeling. Four Component Ocean-Bottom Seismometers (4C-OBS) can provide two types of received sound levels, pressure fluctuations in the water recorded by their hydrophones and seabed particle velocity recorded by the directional components of the seismometer. Although recent OBS usually record acoustic data as sound pressure levels and seabed particle velocity, older seismic instruments only included a seismometer component to record seismic data. Many seismic recordings were obtained throughout the years from several areas of the world’s oceans that have not yet been analysed in terms of their baleen whale acoustic data, and they could provide legacy data that could have crucial information to assess long-term temporal changes in source levels of fin whale notes. Estimated source levels of fin whale notes recorded on OBS have been calculated only with the seismometer component in the Pacific Ocean [33] and only with the hydrophone in the North Atlantic Ocean [31].
This study presents estimates of source levels of 20 Hz fin whale notes recorded concurrently in the two types of recording channels of the OBS, and discusses several types of factors contributing to the variability of the estimates, namely, geographical (deployment areas), instrumental (recording channels and sample size), and temporal factors (time of the detected notes, inter-note interval and dive duration). In addition, this study shows that the directional components of the seismometer of OBS can also provide reliable source level estimates of fin whale notes.

2. Materials and Methods

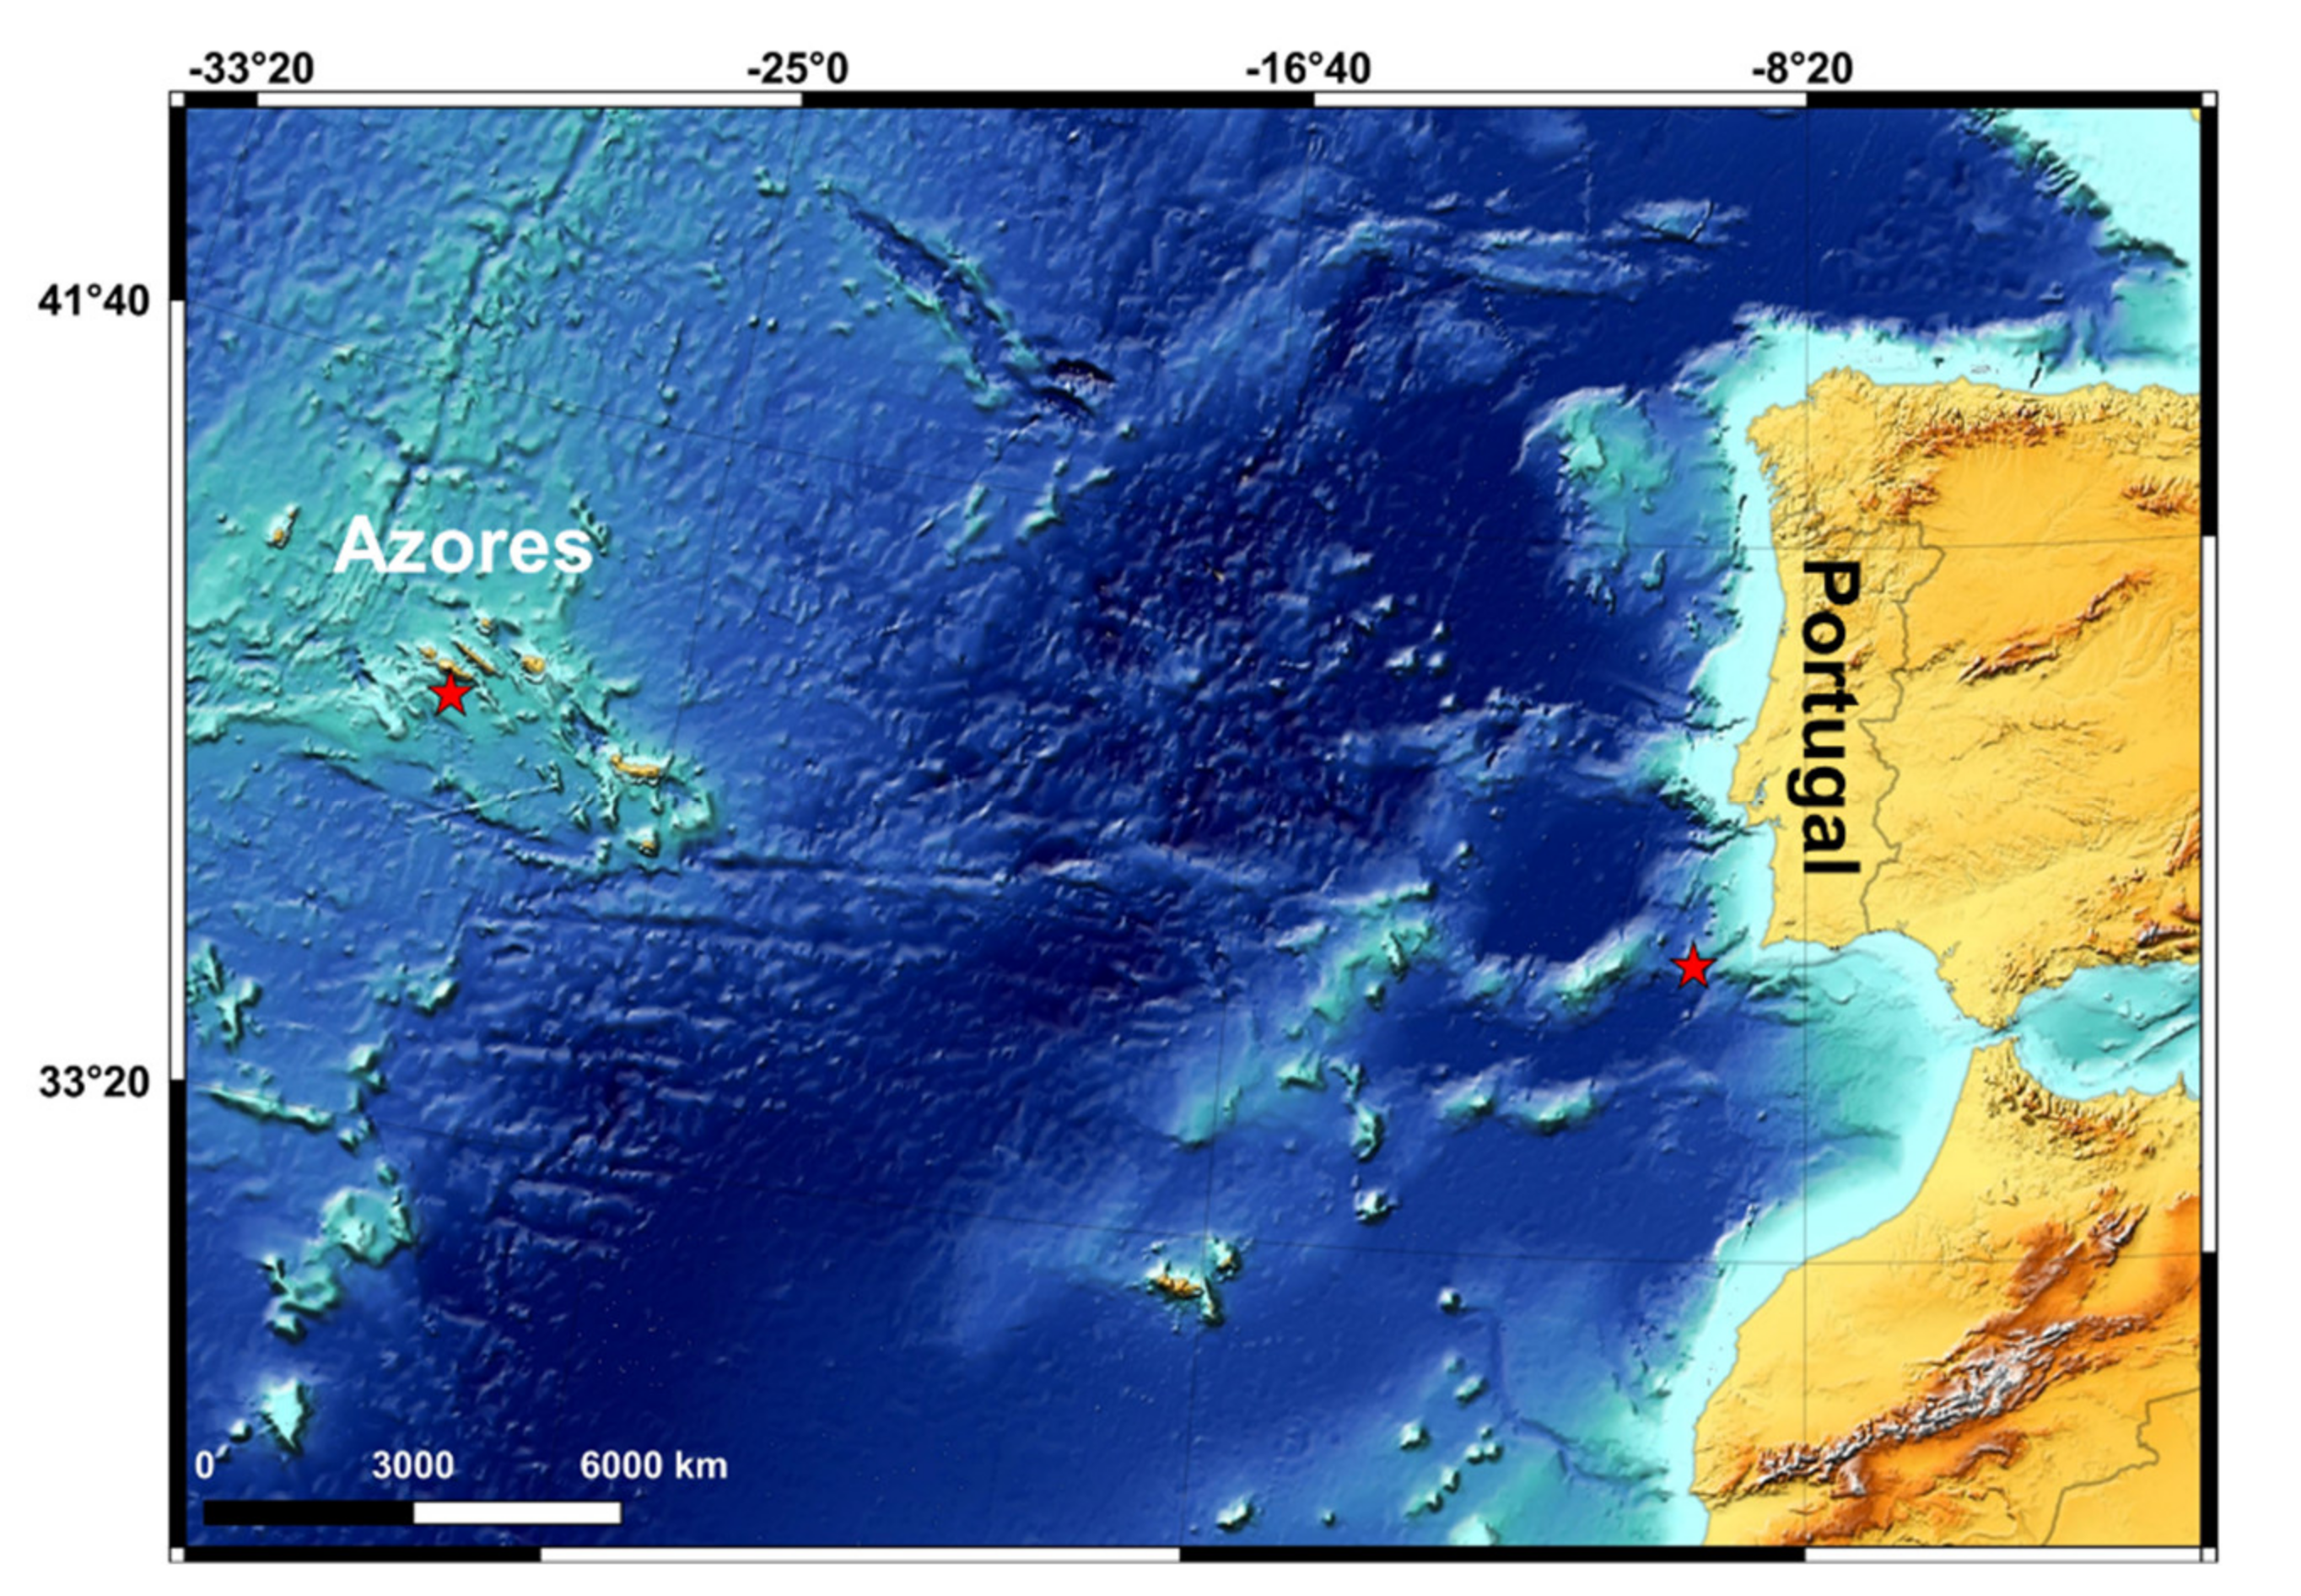
2.1. Study Area and Data Collection

The recordings used in this study were derived from a set of four 4C-OBS deployed off the channel Pico–Faial Islands and from one 4C-OBS of an array deployed in the seas to the southwest of Portugal (Figure 1).
The waters around the Azores archipelago are part of a fin whale migratory corridor towards northern latitudes [38]. This species is present year-round in the Azores, but sightings are rare between autumn and winter [39]. Between spring and early summer, fin whales suspend their journeys northwards and stay around the Azores to feed [38], which is correlated with the spring bloom primary productivity [40] and the consequent increase in prey availability [41]. The deployment area in the Azores waters was chosen according to the sighting records of fin whales and the proximity to the coast to facilitate simultaneous visual observations. In the seas to the southwest of Portugal, whaling records of the 20th century suggest the presence of a local nonmigratory subpopulation of fin whales that was heavily exploited [42]. There is no current evidence of the suggested resident subpopulation, and relative abundance of fin whales has not yet recovered to past numbers [42]. Recent visual and acoustics data show two fin whale groups in the seas to the southwest of Portugal, at least between autumn and spring: fin whales from the northeast North Atlantic Ocean and fin whales from the Mediterranean waters [34,35,43].
The array deployed in the seas to the southwest of Portugal was part of the seismic monitoring project NEAREST (Integrated Observation from Near Shore Sources of Tsunamis: Towards an Early Warning System) [44,45]. A full description of the project and the OBS can be found in [46] and in [47]. For this study, only OBS04 was used because it was the most superficial instrument, and its deployment depth was closest to the Azores OBS.
Each 4C-OBS was composed of three directional channels in the seismometer, allowing the recording of the 3-component seabed particle velocity (two channels for the horizontal components, X and Y, and one channel for the vertical component, Z) and the sound pressure in the water (H-channel). The OBS had a 200 Hz sampling rate in the Azores area and 100 Hz in the southwest Portugal area (Table 1). The Azores OBS included a short period three-component seismometer SM6-4.5Hz and a hydrophone HTI-01-PCA/ULF. All OBS were laid on the seabed, and the seismometers were in direct contact with the seabed. The hydrophones were placed in the water above the seabed, tied to the OBS frame. Additional technical specifications used for this study can be found in Table 1.
The OBS were deployed at different depths, ranging from 760 m (PO3) to 1993 m (OBS04) (Table 1), and recorded during different periods. The instruments in the Azores waters recorded between March and September 2019, while the OBS deployed off southwest Portugal recorded between September 2007 and June 2008. The hydrophone (H-channel) of two OBS of the Azores area, PO2 and PO4, was not working correctly and received levels of these two instruments were only recorded for the vertical Z-channel of their seismometer.

2.2. Signal Detection and Localization

Acoustic data were processed to identify 20 Hz fin whale notes with high signal-to-noise ratio (SNR) and high amplitude to estimate source levels. Recordings of the southwest Portugal OBS04 Z-channel were manually inspected by an analyst that listed the start time of all 20 Hz fin whale notes. The Azores OBS recordings in the H-channel were also inspected manually, prior to the use of an automatic detection algorithm, to identify the days with the highest number of SNR 20 Hz notes. Those days were then fed to an automatic detector based on a matched filter which is included in the software program Ishmael version 3.0. A sample of automatic detections (10%) for each day and each Azores OBS was manually checked to obtain daily false positive rates. During the manual checking of the recordings and the false positives of the Azores dataset, it was possible to identify the highest-quality 20 Hz notes that could potentially be used in the estimates of source level.
Fin whale notes used in the following analysis were recorded in April 2019 (n = 1459) in the Azores, and between November 2007 and April 2008 (n = 14,733) in the southwest Portugal. Regarding the Azores dataset, within the same sequence of 20 Hz notes, sometimes notes could not be detected in the spectrograms because of the presence of varying levels of noise. Therefore, the number of recorded notes was not equal across recording channels and instruments in the Azores OBS. The two channels in the OBS of southwest Portugal recorded the same number of fin whale notes.
The range (i.e., the horizontal distance) between the source of each 20 Hz note and the OBS was estimated according to two methods. For the southwest Portugal dataset, range was estimated using the direct signal to a single OBS [47,48]. This method has been used to locate fin whale notes, but it only works well in an area that is defined by a critical range, which is a distance at which parameters used to estimate ranges are reliable [47,48]. A coherency threshold between the horizontal and vertical seismometer channels was set to 0.1 to identify the 20 Hz notes inside this critical range. A more detailed description of the coherency factor can be found in [48]. After the coherency filtering, there were 46 days with 20 Hz notes detected inside the critical range of OBS04 (n = 4866). The ranges of the 20 Hz fin whale notes of the Azores dataset were obtained by triangulation, which meant that notes had to be detected in at least three instruments. After the signal detection process, there were only 3 days with 20 Hz fin whale notes detected in at least three OBS.

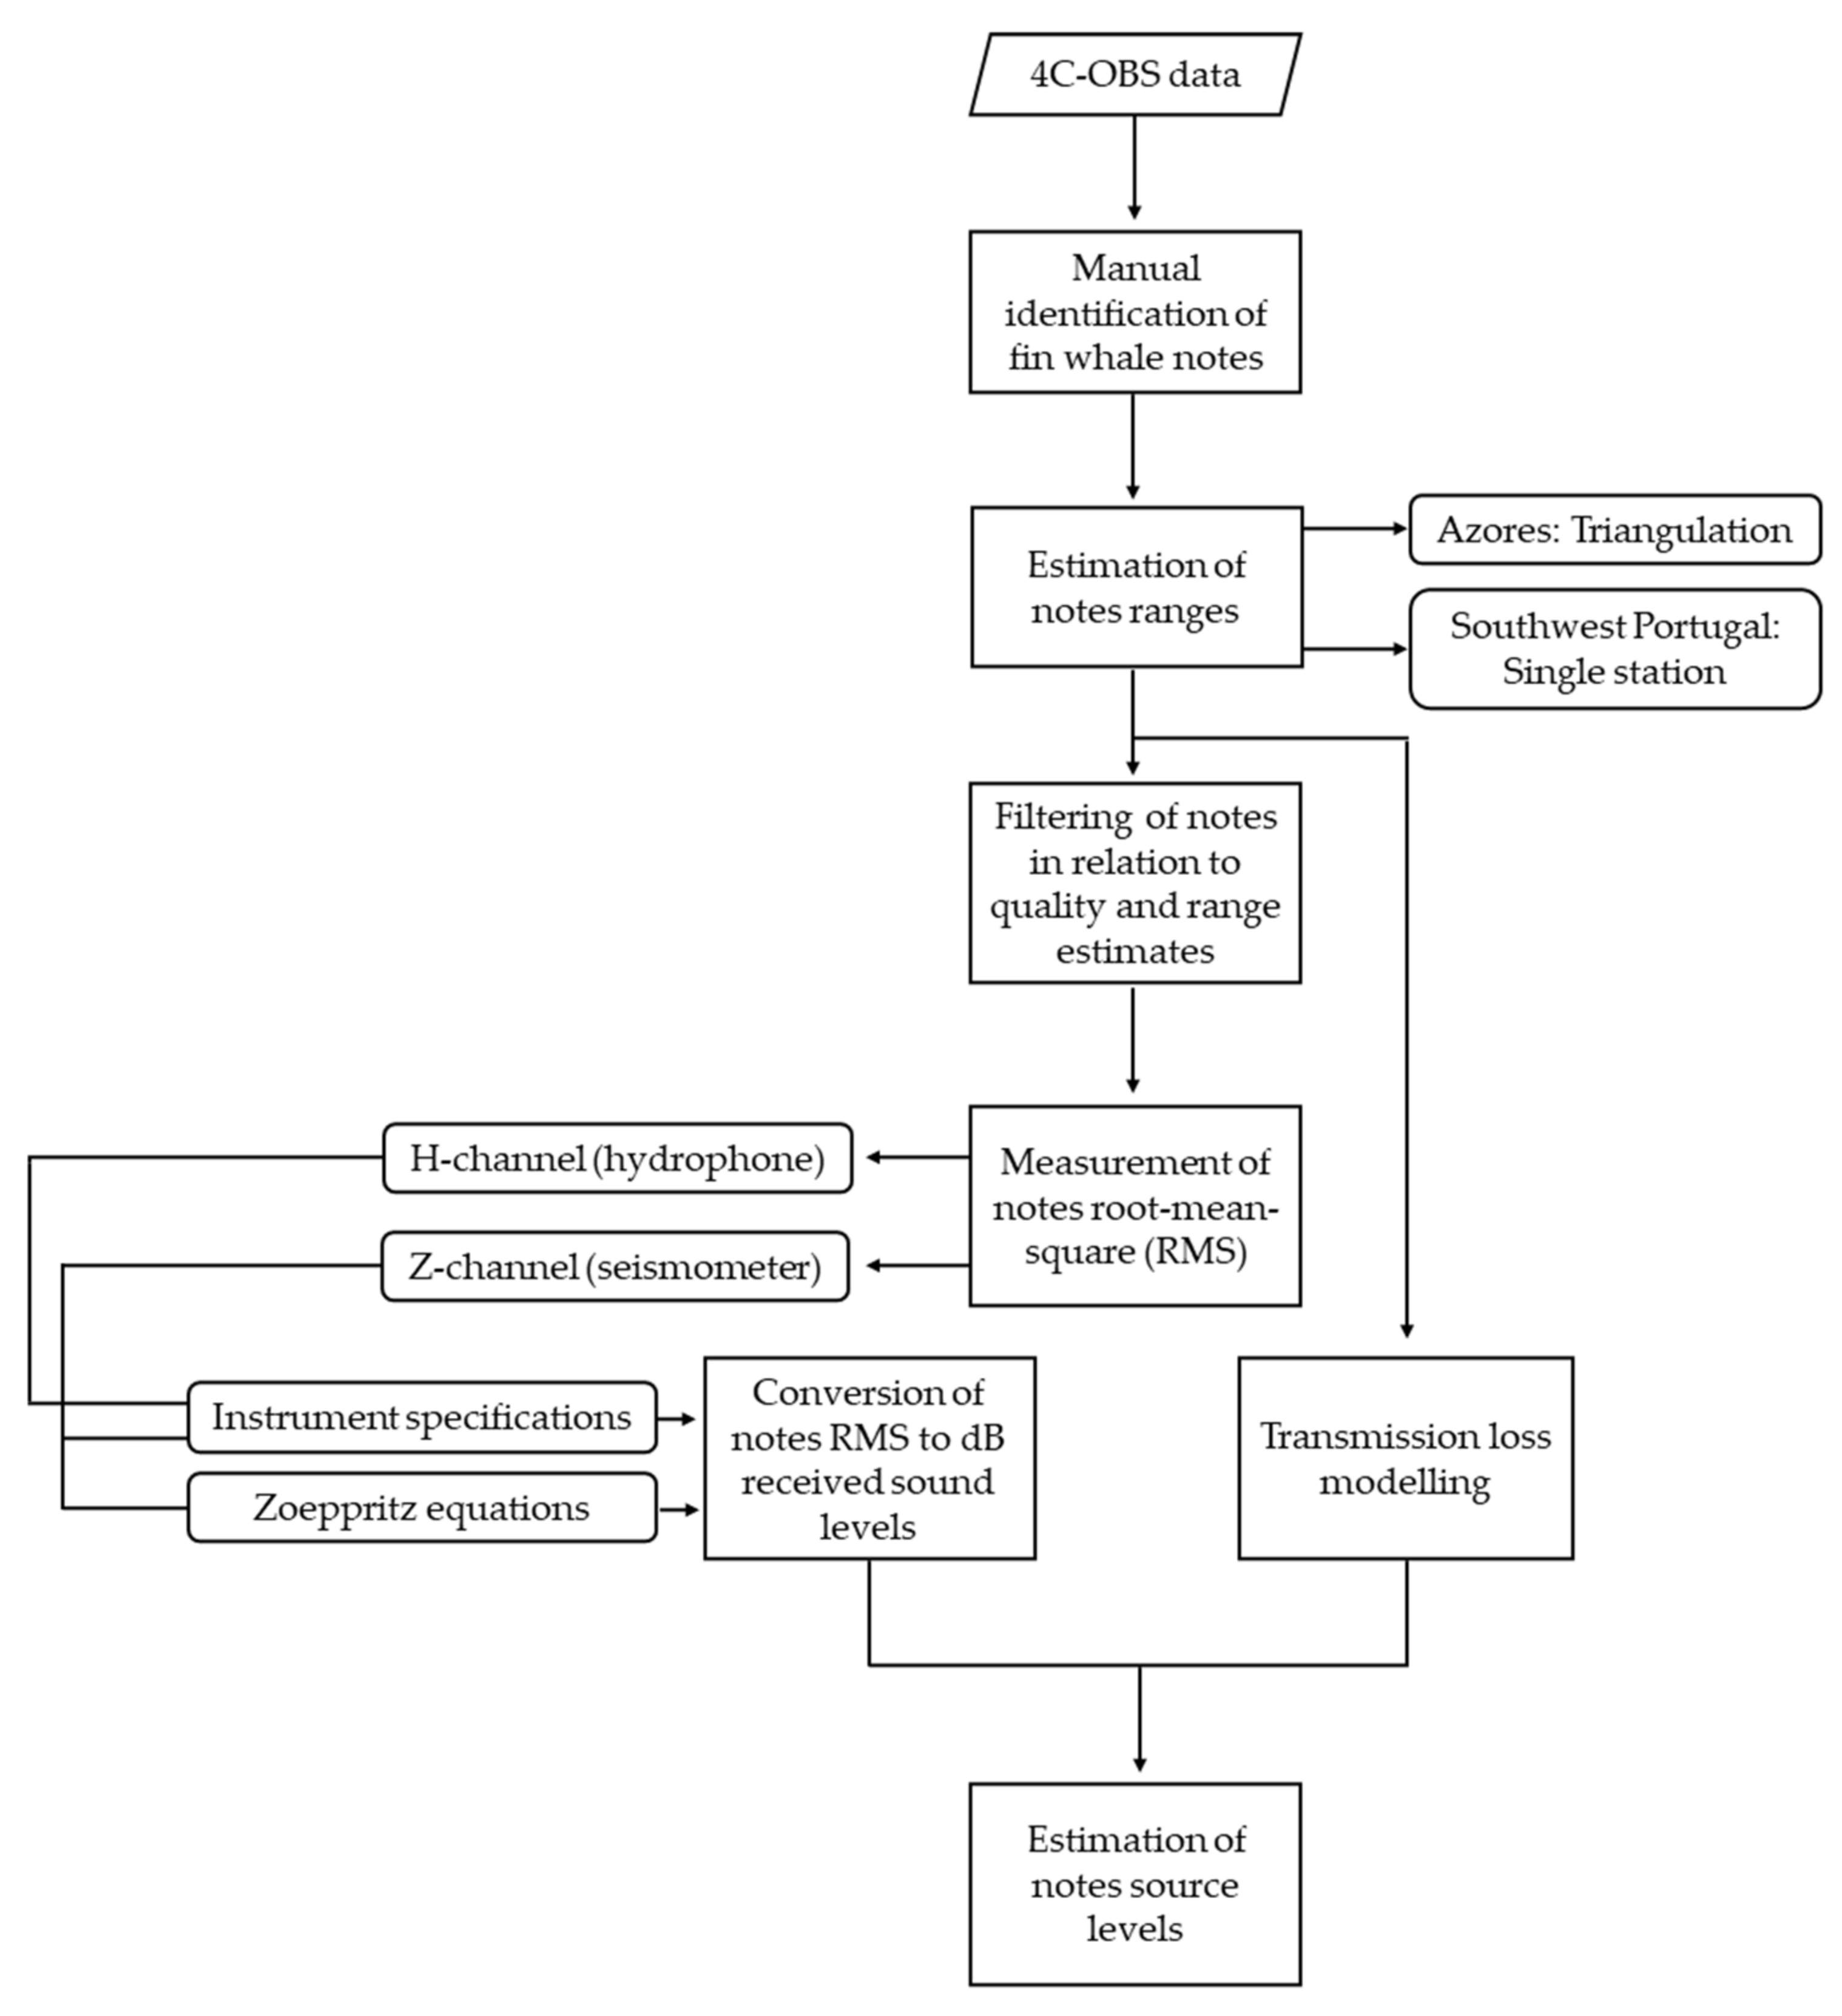
2.3. Sound Source Levels Measurements

Underwater sound source level (SL) is defined as the sound pressure level at a reference distance of 1 m from a given source (expressed in dB re: 1 μPa at 1 m). Source levels of 20 Hz fin whale notes were estimated using the passive form of the Sonar Equation (1):
RL = SL − TL,
where RL is the received level of the sound and TL is the transmission loss. Received levels of the 20 Hz note were measured as pressure fluctuations in the water in the hydrophone and as particle velocity of the seabed in the seismometer.
Received levels of the 20 Hz notes recorded by the OBS H-channel and Z-channel were automatically measured as the amplitude root-mean-square (RMS) of each note waveform based on a matched filter code that used the library routines of the seismological software package SEISAN [49]. The preferred measurement of received levels was RMS because it is the most used in the literature. Usually, the matched filter is used in the automatic detection process of acoustic signals, but in this study, it was used to obtain several parameters that characterize the 20 Hz notes, including RMS. During the matched filter run, the OBS recordings were cross-correlated with a signal template. Measurements of each 20 Hz note were calculated whenever the matched filter function was maximized 0.5 s around the provided manual start time of each note. This buffer was used to accommodate potential errors made by the researcher in the start time of each note. The end of the measurement window was defined by the duration of a template of high-amplitude and high-SNR 20 Hz note. For each 20 Hz note processed automatically, the in-house code calculated the amplitudes of the H-channel and the Z-channel, as well as the correlation value between the recordings and the template, SNR, relative azimuth, and incidence angles, following the methods described in [47] and [48]. Relative azimuth and incidence angles calculated in SEISAN were only reliable for the southwest Portugal dataset because fin whale notes were inside the critical range. In the case of the Azores dataset, most estimated ranges of fin whale notes were outside the critical range of each OBS, and several angles had to be calculated according to the methodology described below.
Measured RMS amplitudes of each 20 Hz note recorded in the OBS Z-channel were transformed in substrate particle velocity (m/s) and then in dB received levels using the procedure described in [33]. In addition to the angles of the incoming and transmitted signals, the procedure needs information about the water column and seabed properties, namely the density and the velocities of the signals in the two mediums (Table 2).
The amplitudes of the transmitted P- (TPP) and S- (TPS) waves at a fluid–solid interface relative to an incident pressure wave of unit amplitude are determined by the Zoeppriiz equations [50]:
T P P = V P 1 V P 2 2 B ρ 1 V P 2 cos θ i A 1 ρ 2 V P 2 cos θ i + A 2 cos θ i cos θ t + ρ 1 V P 1 cos θ t
T P S = V P 1 V P 2 2 C cos θ i cos θ t A 1 ρ 2 V P 2 cos θ i + A 2 cos θ i cos θ t + ρ 1 V P 1 cos θ t
where,
A 1 = B 2 = c o s 2 2 ϕ t
A 2 = 4 ρ 2 V S 2 s i n 2 ϕ t cos ϕ t
C = 2 ρ 1 V S 2 sin ϕ t
and V P 1 is the incident P-wave velocity, V P 2 is the transmitted P-wave velocity, V S 2 is the transmitted S-wave velocity, θ i is the incidence angle of the acoustic wave and the normal to the interface, θ t is the transmitted P wave angle, ϕ t is the transmitted S wave angle, and ρ 1 and ρ 2 are the densities in the fluid and solid layers, respectively [40]. In the southwest Portugal dataset, the incidence angle θ i was obtained with the range estimates of the 20 Hz notes and the adjustments in [48]. In the Azores dataset, θ i was calculated assuming a homogenous medium:
θ i = tan 1 r a n g e OBS   d e p t h
The angles of the transmitted P- ( θ t ) and S- ( ϕ t ) waves were calculated using Snell’s law.
The amplitude RMS of each fin whale note was transformed in measured vertical particle velocity uv based on the seismometer sensitivity, system gain, and information about the digital conversion (Table 1). Following [33], uv was then scaled by the vertical projection of the Zoeppritz equations to obtain particle velocity in the direction of the incoming wave u:
u = u v 1 T P P cos θ t + T P S sin ϕ t
The received sound pressure level pm, expressed in decibels relative to 1 µPa, of each fin whale note recorded in the Z-channel of the OBS was calculated as:
p m = 20 × log 10 u ρ 1 V P 1 10 6
Properties of the seabed in the southwest Portugal area were selected according to work shown in [48]. This set of values, combined with the application of some adjustments, resulted in the most accurate ranging estimates for a dataset of airgun shots, for which the location was known. Properties of the Azores area seabed were based on a top strata composed of poorly consolidated water-saturated sediments [51]. Weirathmueller et al. (2013) [33] recognized that the Zoeppritz correction to convert vertical ground velocity to the velocity of the incoming acoustic wave was too sensitive at incidence angles close to and larger than the critical angle ( i c = sin 1 V P 1 / V P 2 which could result in bias of the source level estimates. They limited source level estimates to incidence angles that resulted in a steady increase of the Zoeppritz correction and discarded the data with a rapid increase of the Zoeppritz correction. In this study, the southwest Portugal dataset was already limited by the critical angle ( i c = 61.9 ° ), and therefore no additional filtering was needed. Most of the fin whale notes in the Azores dataset showed incidence angles greater than the critical angle ( i c = 56.4 ° ). In this case, and for source level estimates recorded in the Z-channel, the Azores dataset was filtered to retain only notes with incidence angles showing a steady increase of the Zoeppritz correction (<47.0°). For the H-channel of the Azores dataset, all fin whale notes were used to estimate source levels. Measured RMS amplitudes of the OBS hydrophone were converted into dB received levels using a conversion factor obtained from the hydrophone sensitivity, system gain, and information about the digital conversion (Table 1).
Transmission loss was calculated using the ray-trace package BELLHOP [52]. The signal source depth was assumed to be 15 m, based on fin whale tag data from [53]. The signal frequency was assumed to be 22 Hz, based on median frequency measurements of a sample of 20 Hz notes from the OBS dataset (n = 2952) and according to the values used in [32]. The sound speed profile used to model the transmission loss for the Azores dataset was calculated using the salinity and temperature profiles from the World Ocean Atlas climatological data for a point at 38° N 29° W in April [54]. The sound speed profile for the southwest Portugal dataset was calculated from conductivity, temperature, and depth (CTD) data collected in situ on 24 August 2007. The models were developed with the multiple OBS receiver depths (Table 1) and maximum estimated ranges for each OBS: 20 km for PO2, 9 km for PO3, 13 km for PO4, 8 km PO5, and 4 km for OBS04.

2.4. Statistical Analysis

The variability of source level estimates for the 20 Hz note was assessed based on the deployment area, type of recording channel, sample size, month, dive duration, and inter-note interval. Variability in source level estimates for each recording channel and deployment area was assessed using the coefficient of variation (CV), which is a measure of spread of the data and allows comparison between datasets with different distributions [55]. The effect of sample size on source estimates was assessed by filtering the southwest Portugal dataset based on note quality (cross-correlation value ≥0.7 and SNR ≥ 3.1), following [31]. Differences in source level estimates calculated for each month of the southwest Portugal dataset were evaluated using the non-parametric Kruskal–Wallis test followed by a Dunn’s multiple comparison test with a Bonferroni adjustment method. The null hypothesis of this test assumes that the samples (groups) are from identical populations. The significance level used to decide the acceptance of the null hypothesis was p = 0.05. Preliminary data exploration showed that the relationship between source level estimates of fin whale notes and elapsed time within a sequence was not linear. Therefore, the relationship between source level estimates and elapsed time within a sequence was evaluated using Generalized Additive Models (GAMs) with a Gaussian distribution and an identity link function [56]. A sequence was defined as several 20 Hz notes with inter-note intervals shorter than 45 s [28,36]. Intervals longer than 45 s were associated with potential surfacing episodes, and associated sequences were evaluated separately. Statistical analysis were undertaken with the nlme package in R software version 5.474 [57].
A summary of the data acquisition and processing stages can be found in Figure 2.

3. Results

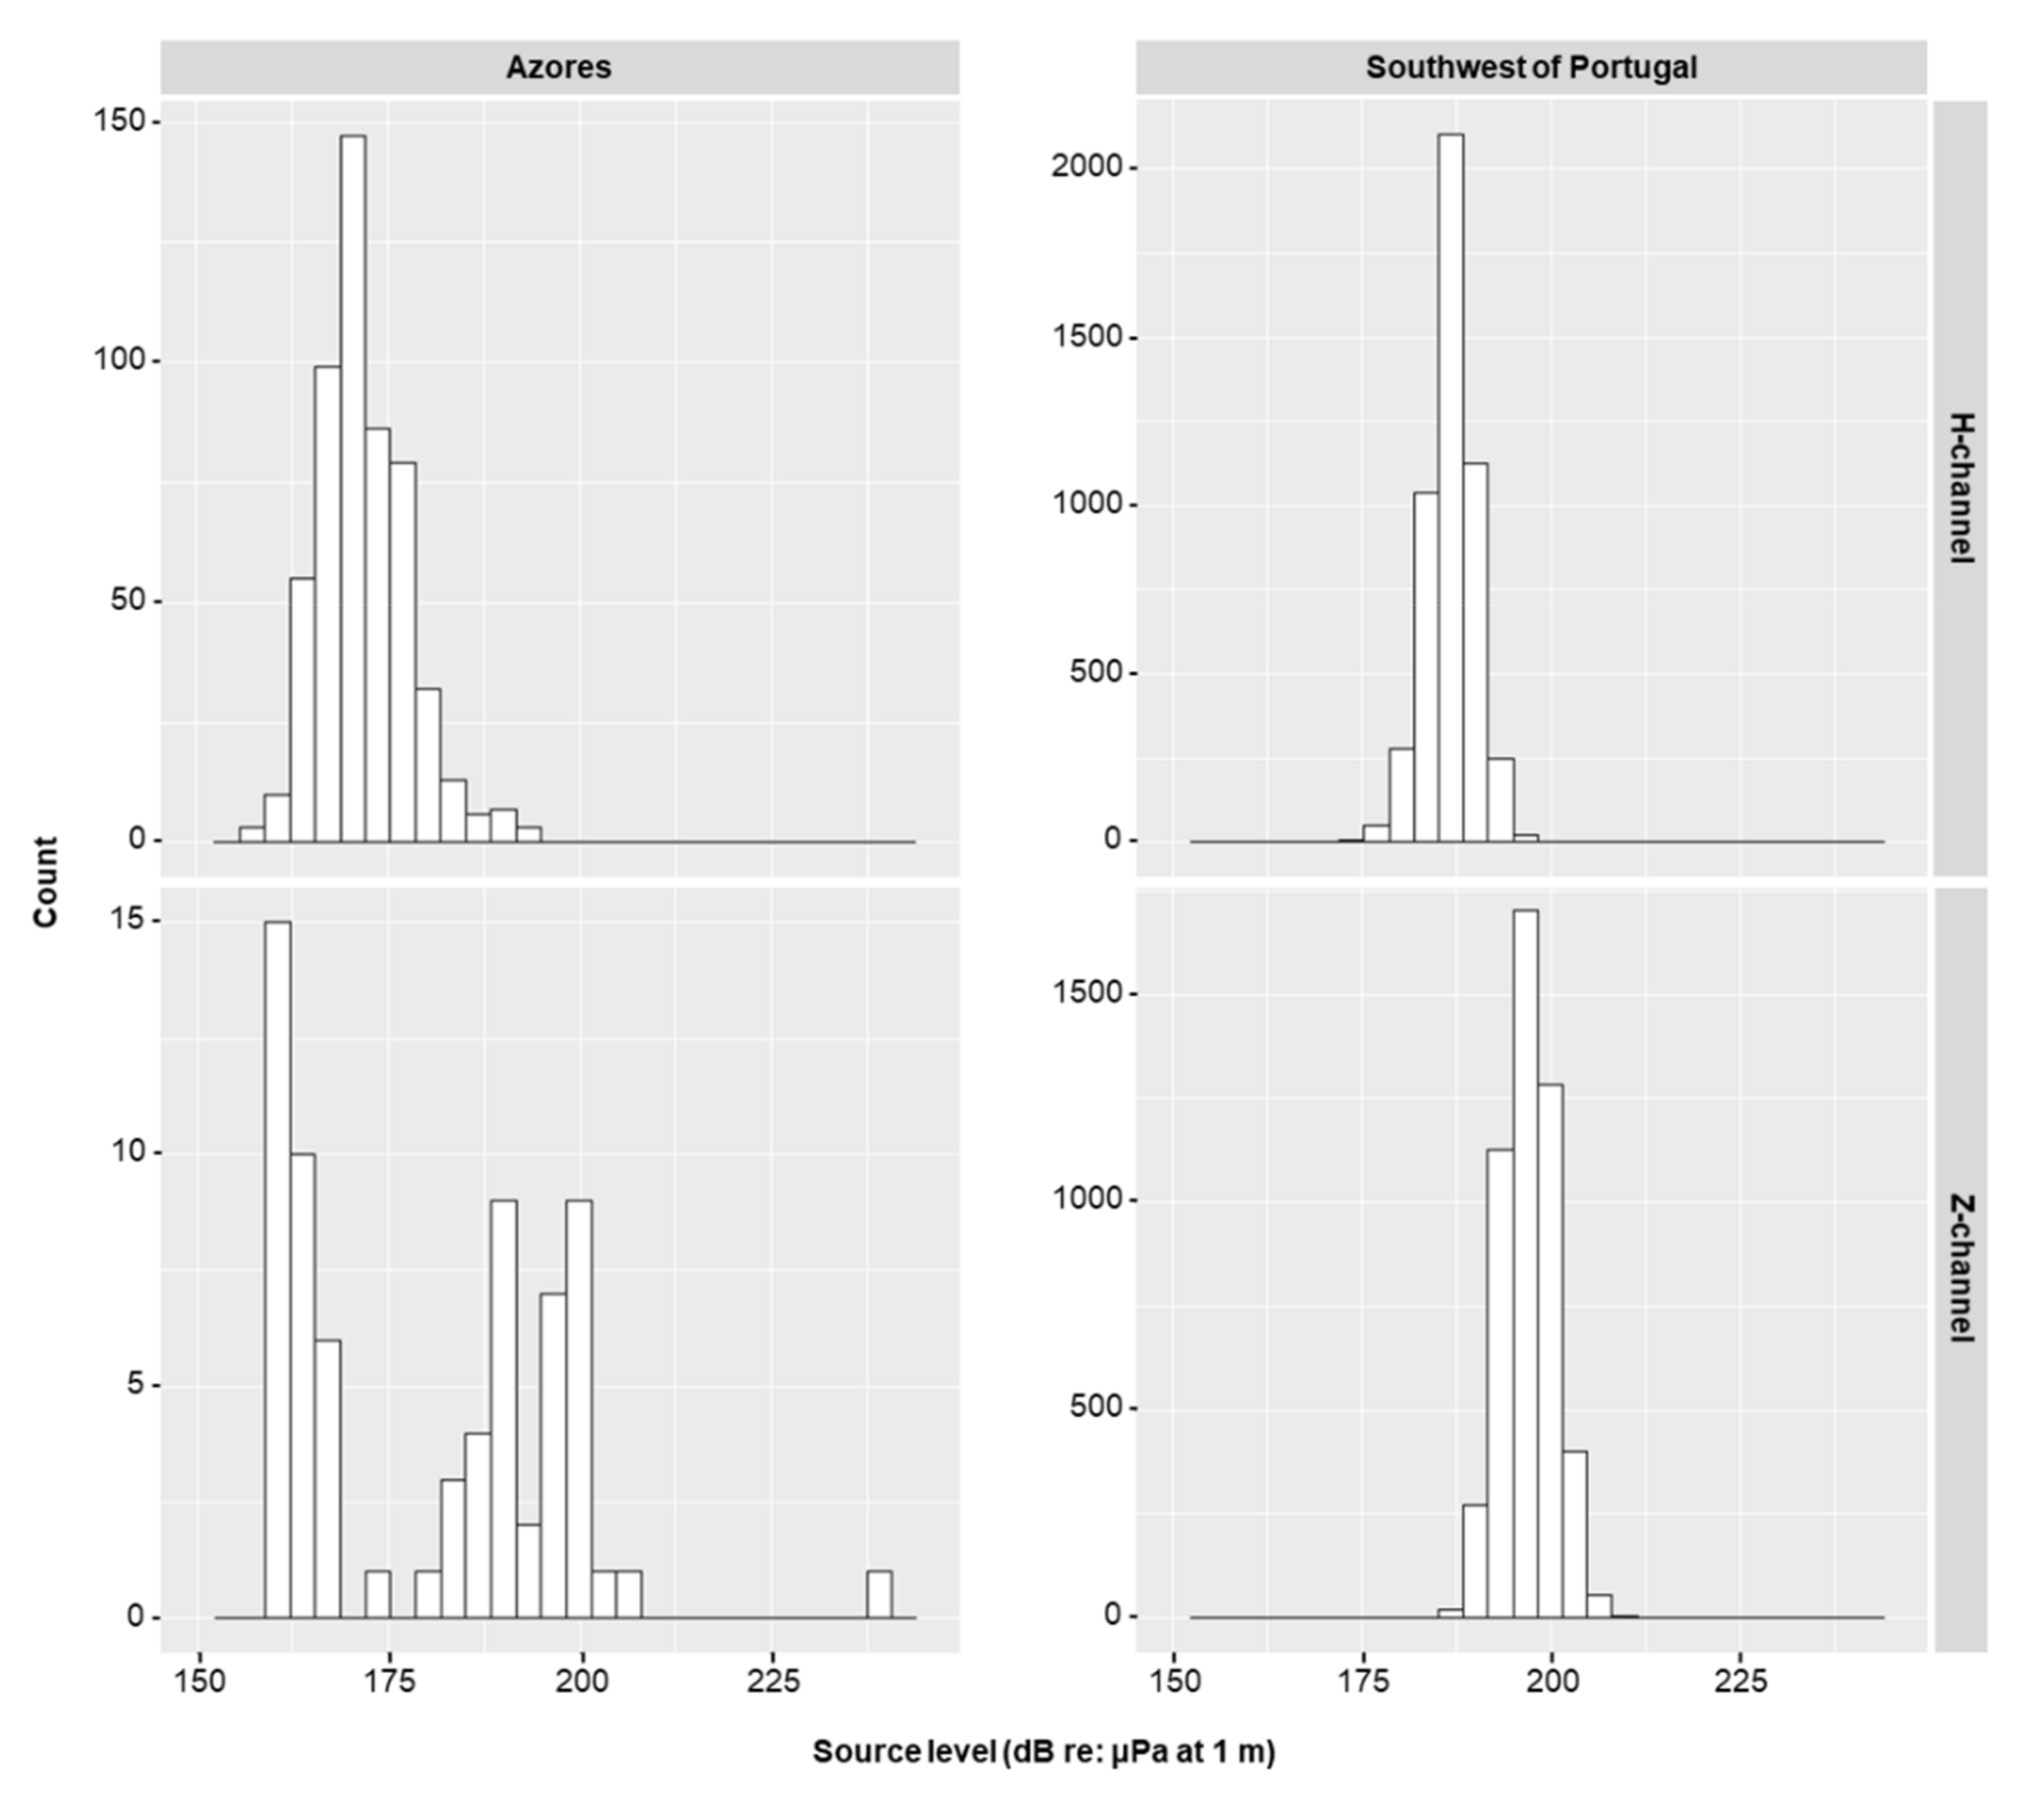
3.1. Geographical and Instrumental Differences in Source Level Estimates

The most significant difference in average source level estimates of fin whale notes between deployment areas (34 dB) was observed for the Z-channel, mainly associated with one instrument of the Azores deployment, PO5 (Table 3). The remaining two OBS from the Azores showed relatively similar source level estimates compared with the southwest Portugal OBS. However, the two distributions of estimated source levels for the Z-channel were considerably different (Figure 3), which was related to the small sample size of the Azores dataset (n = 70, except PO4) and the higher coefficient of variation. The observed difference of estimated source levels for the H-channel between deployment areas (~15 dB) was not as clear as the one observed for the Z-channel.
Within each OBS, differences between recording channels were small: 8 dB in the Azores and 10 dB in southwest Portugal. The reduction of the sample size of the southwest Portugal dataset to retain only high-quality fin whale notes did not result in a significant change of estimated source levels. The differences were 0.4 dB for the Z-channel and 0.5 dB for the H-channel (Table 3). The source level estimates did not change, as observed in the Azores dataset, because the sample was still large (n = 1443).

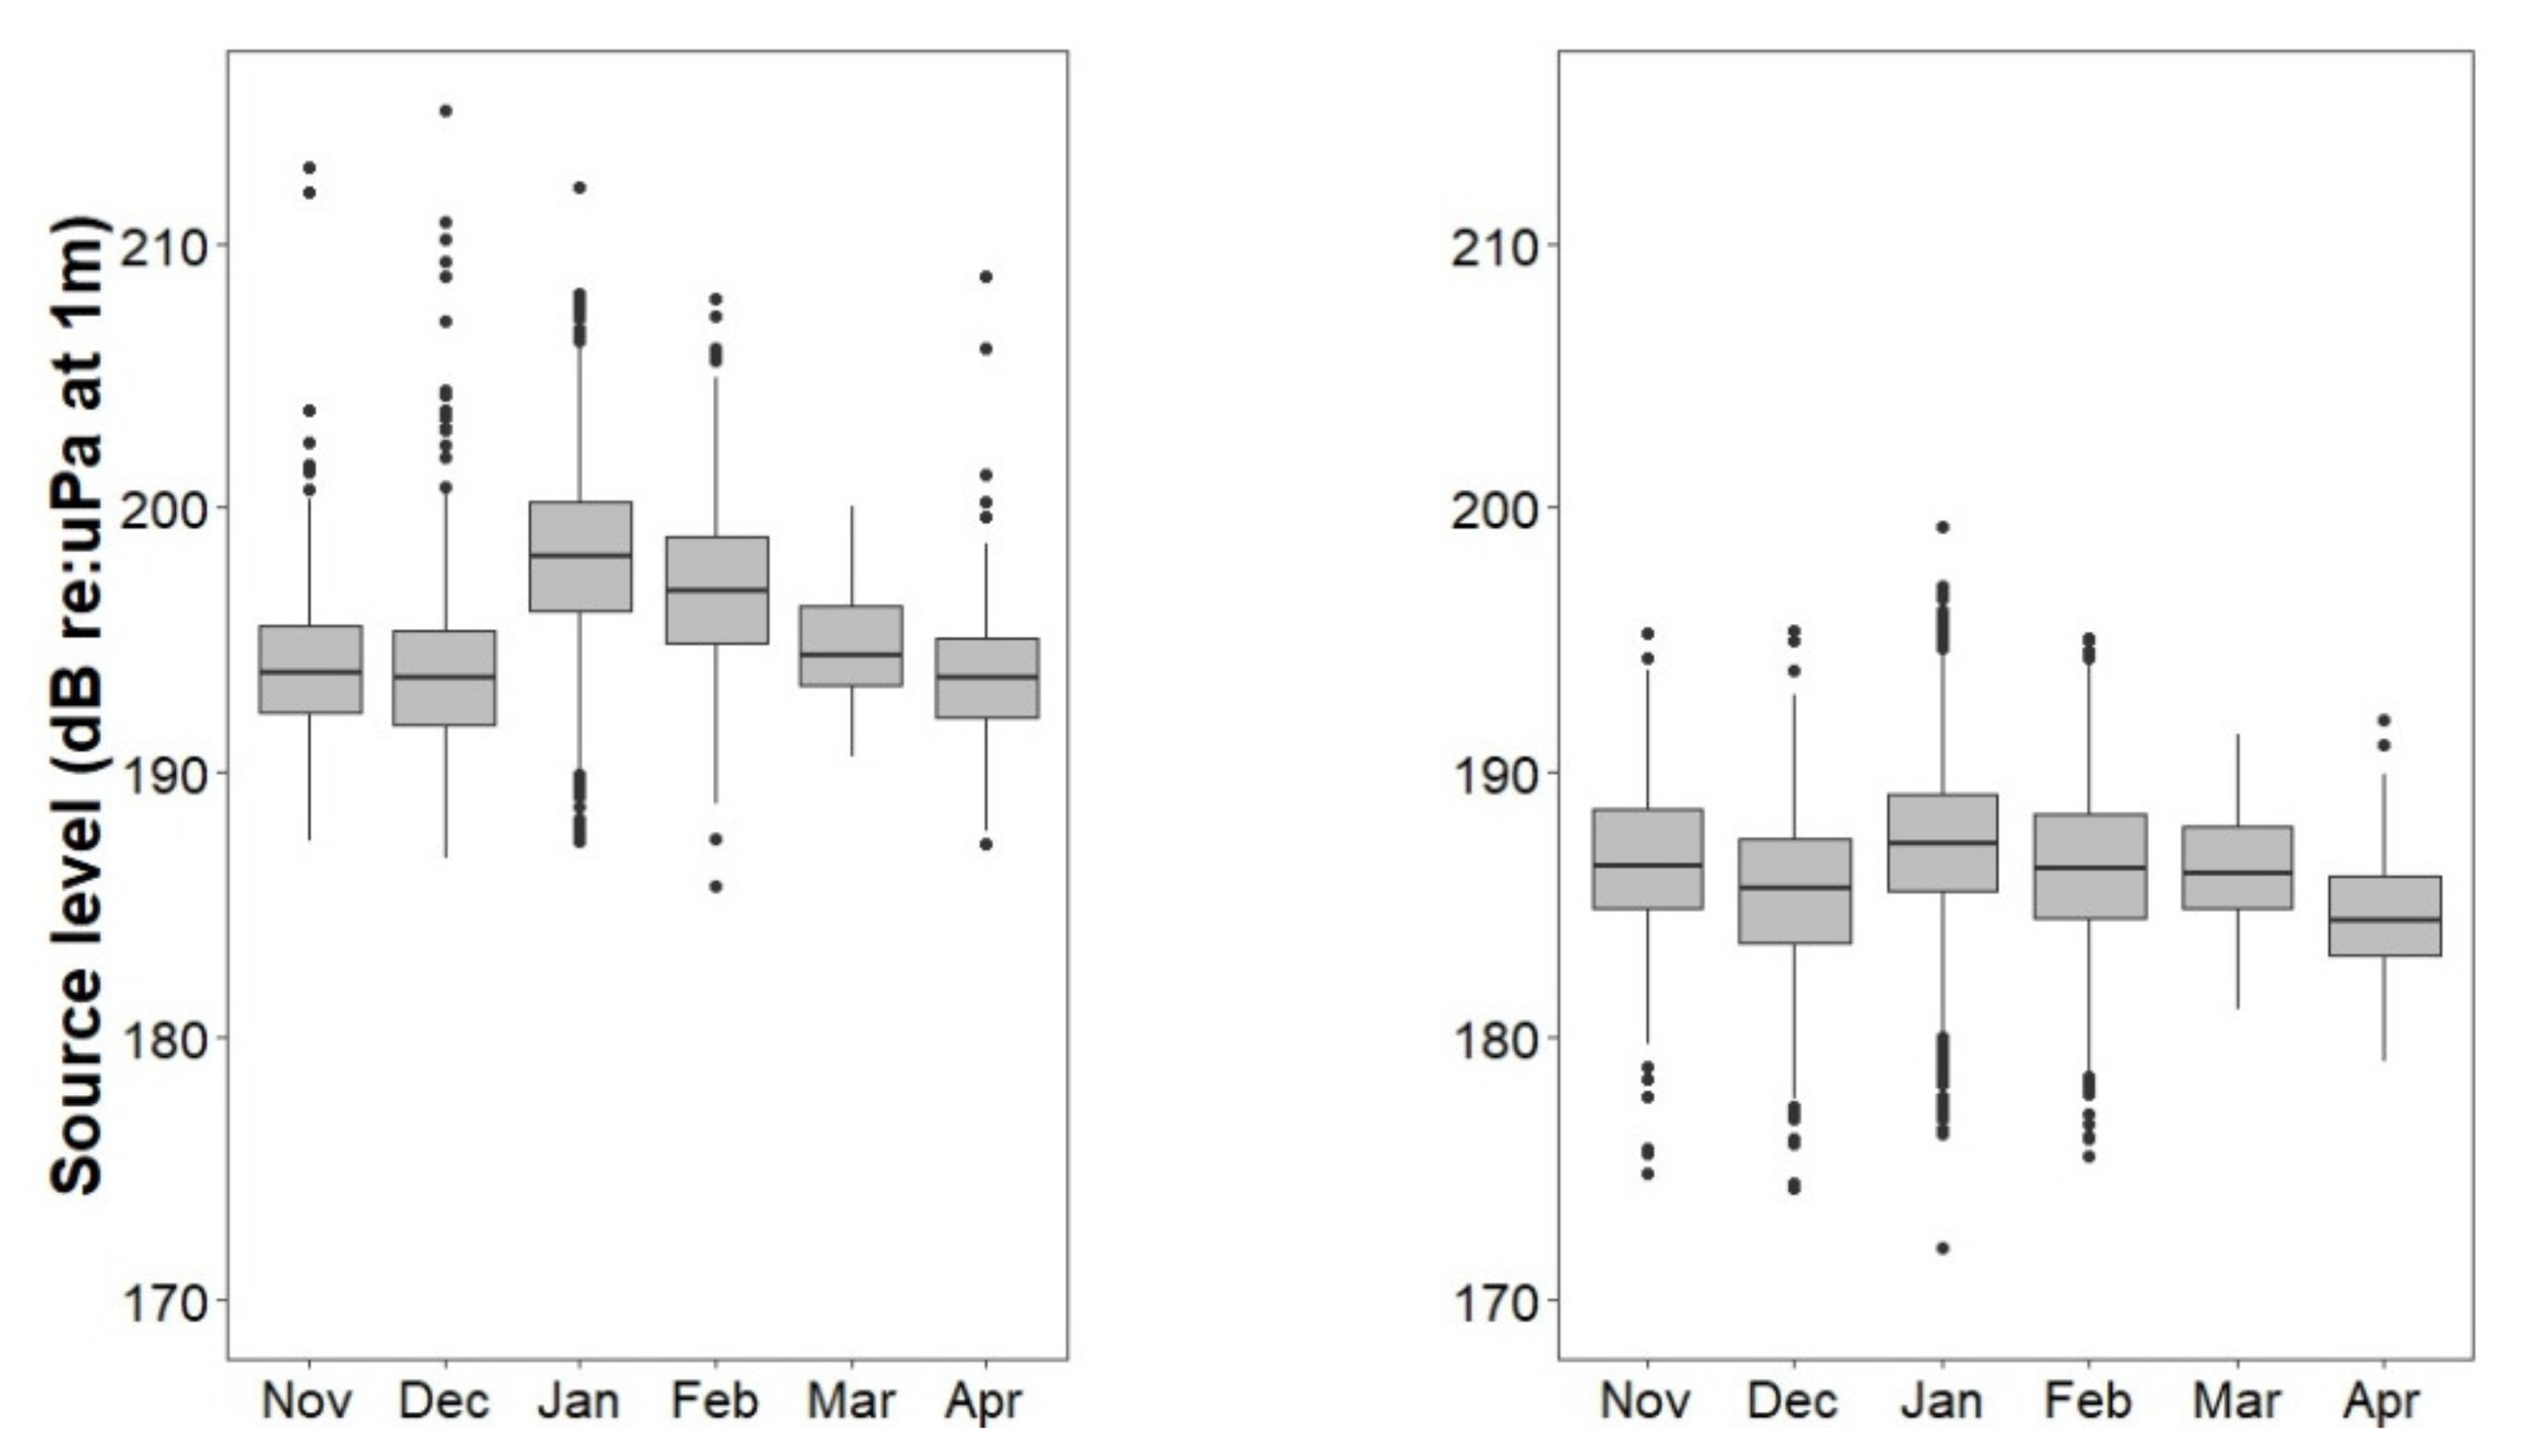
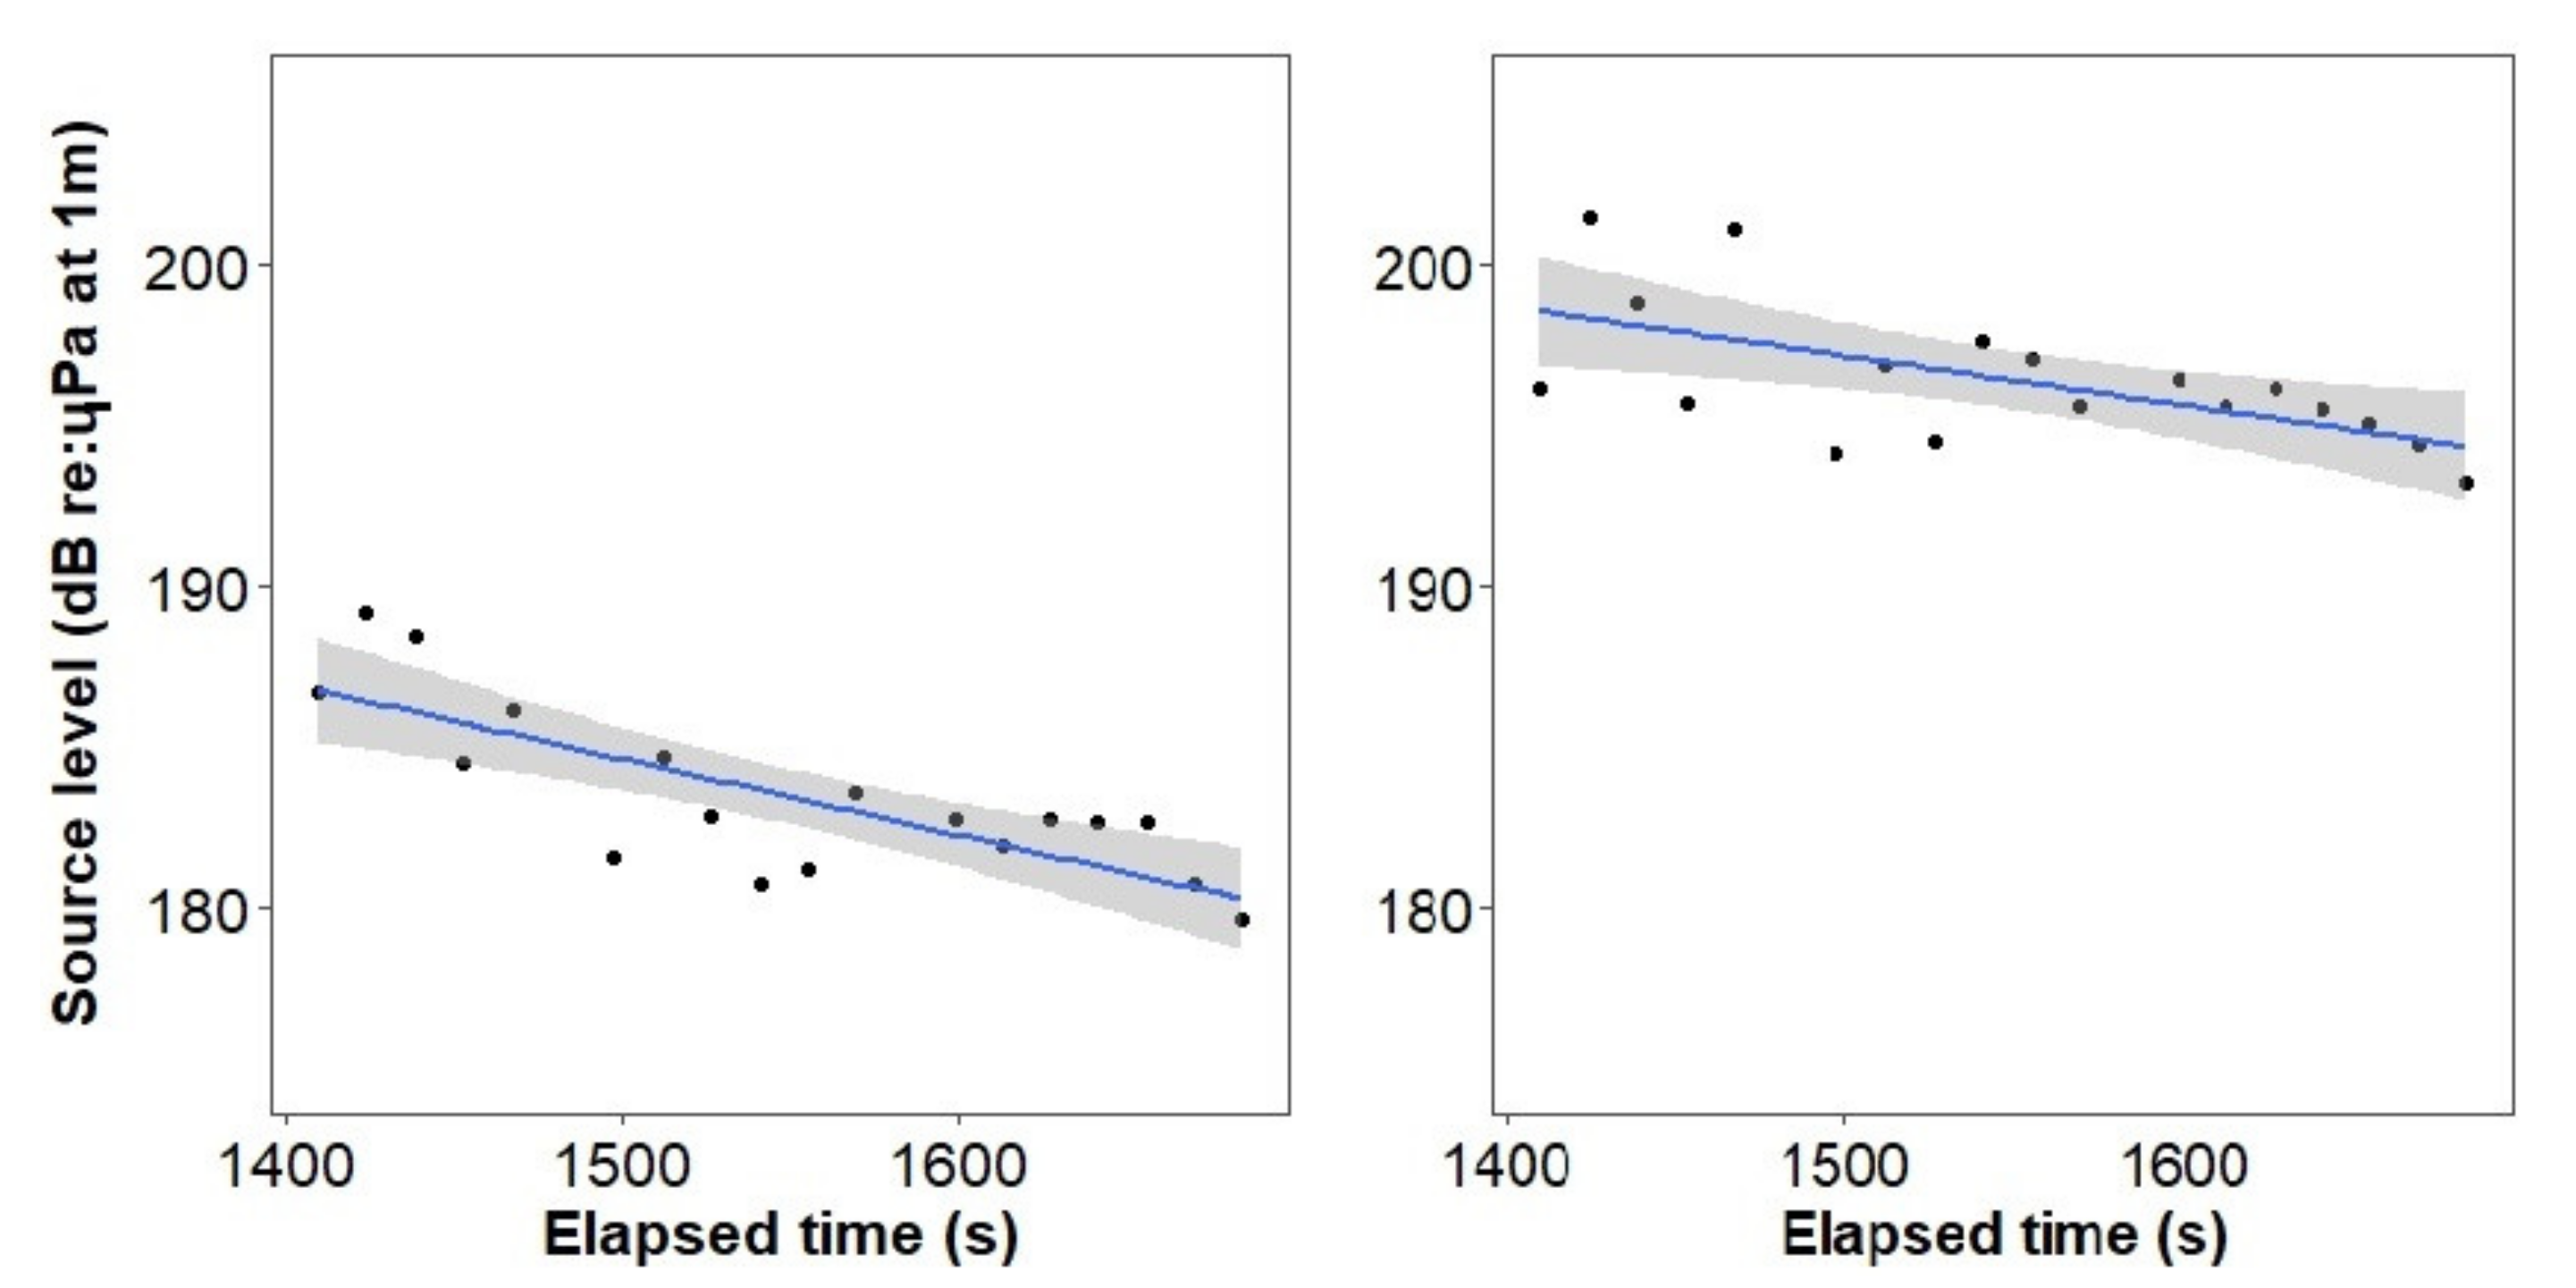
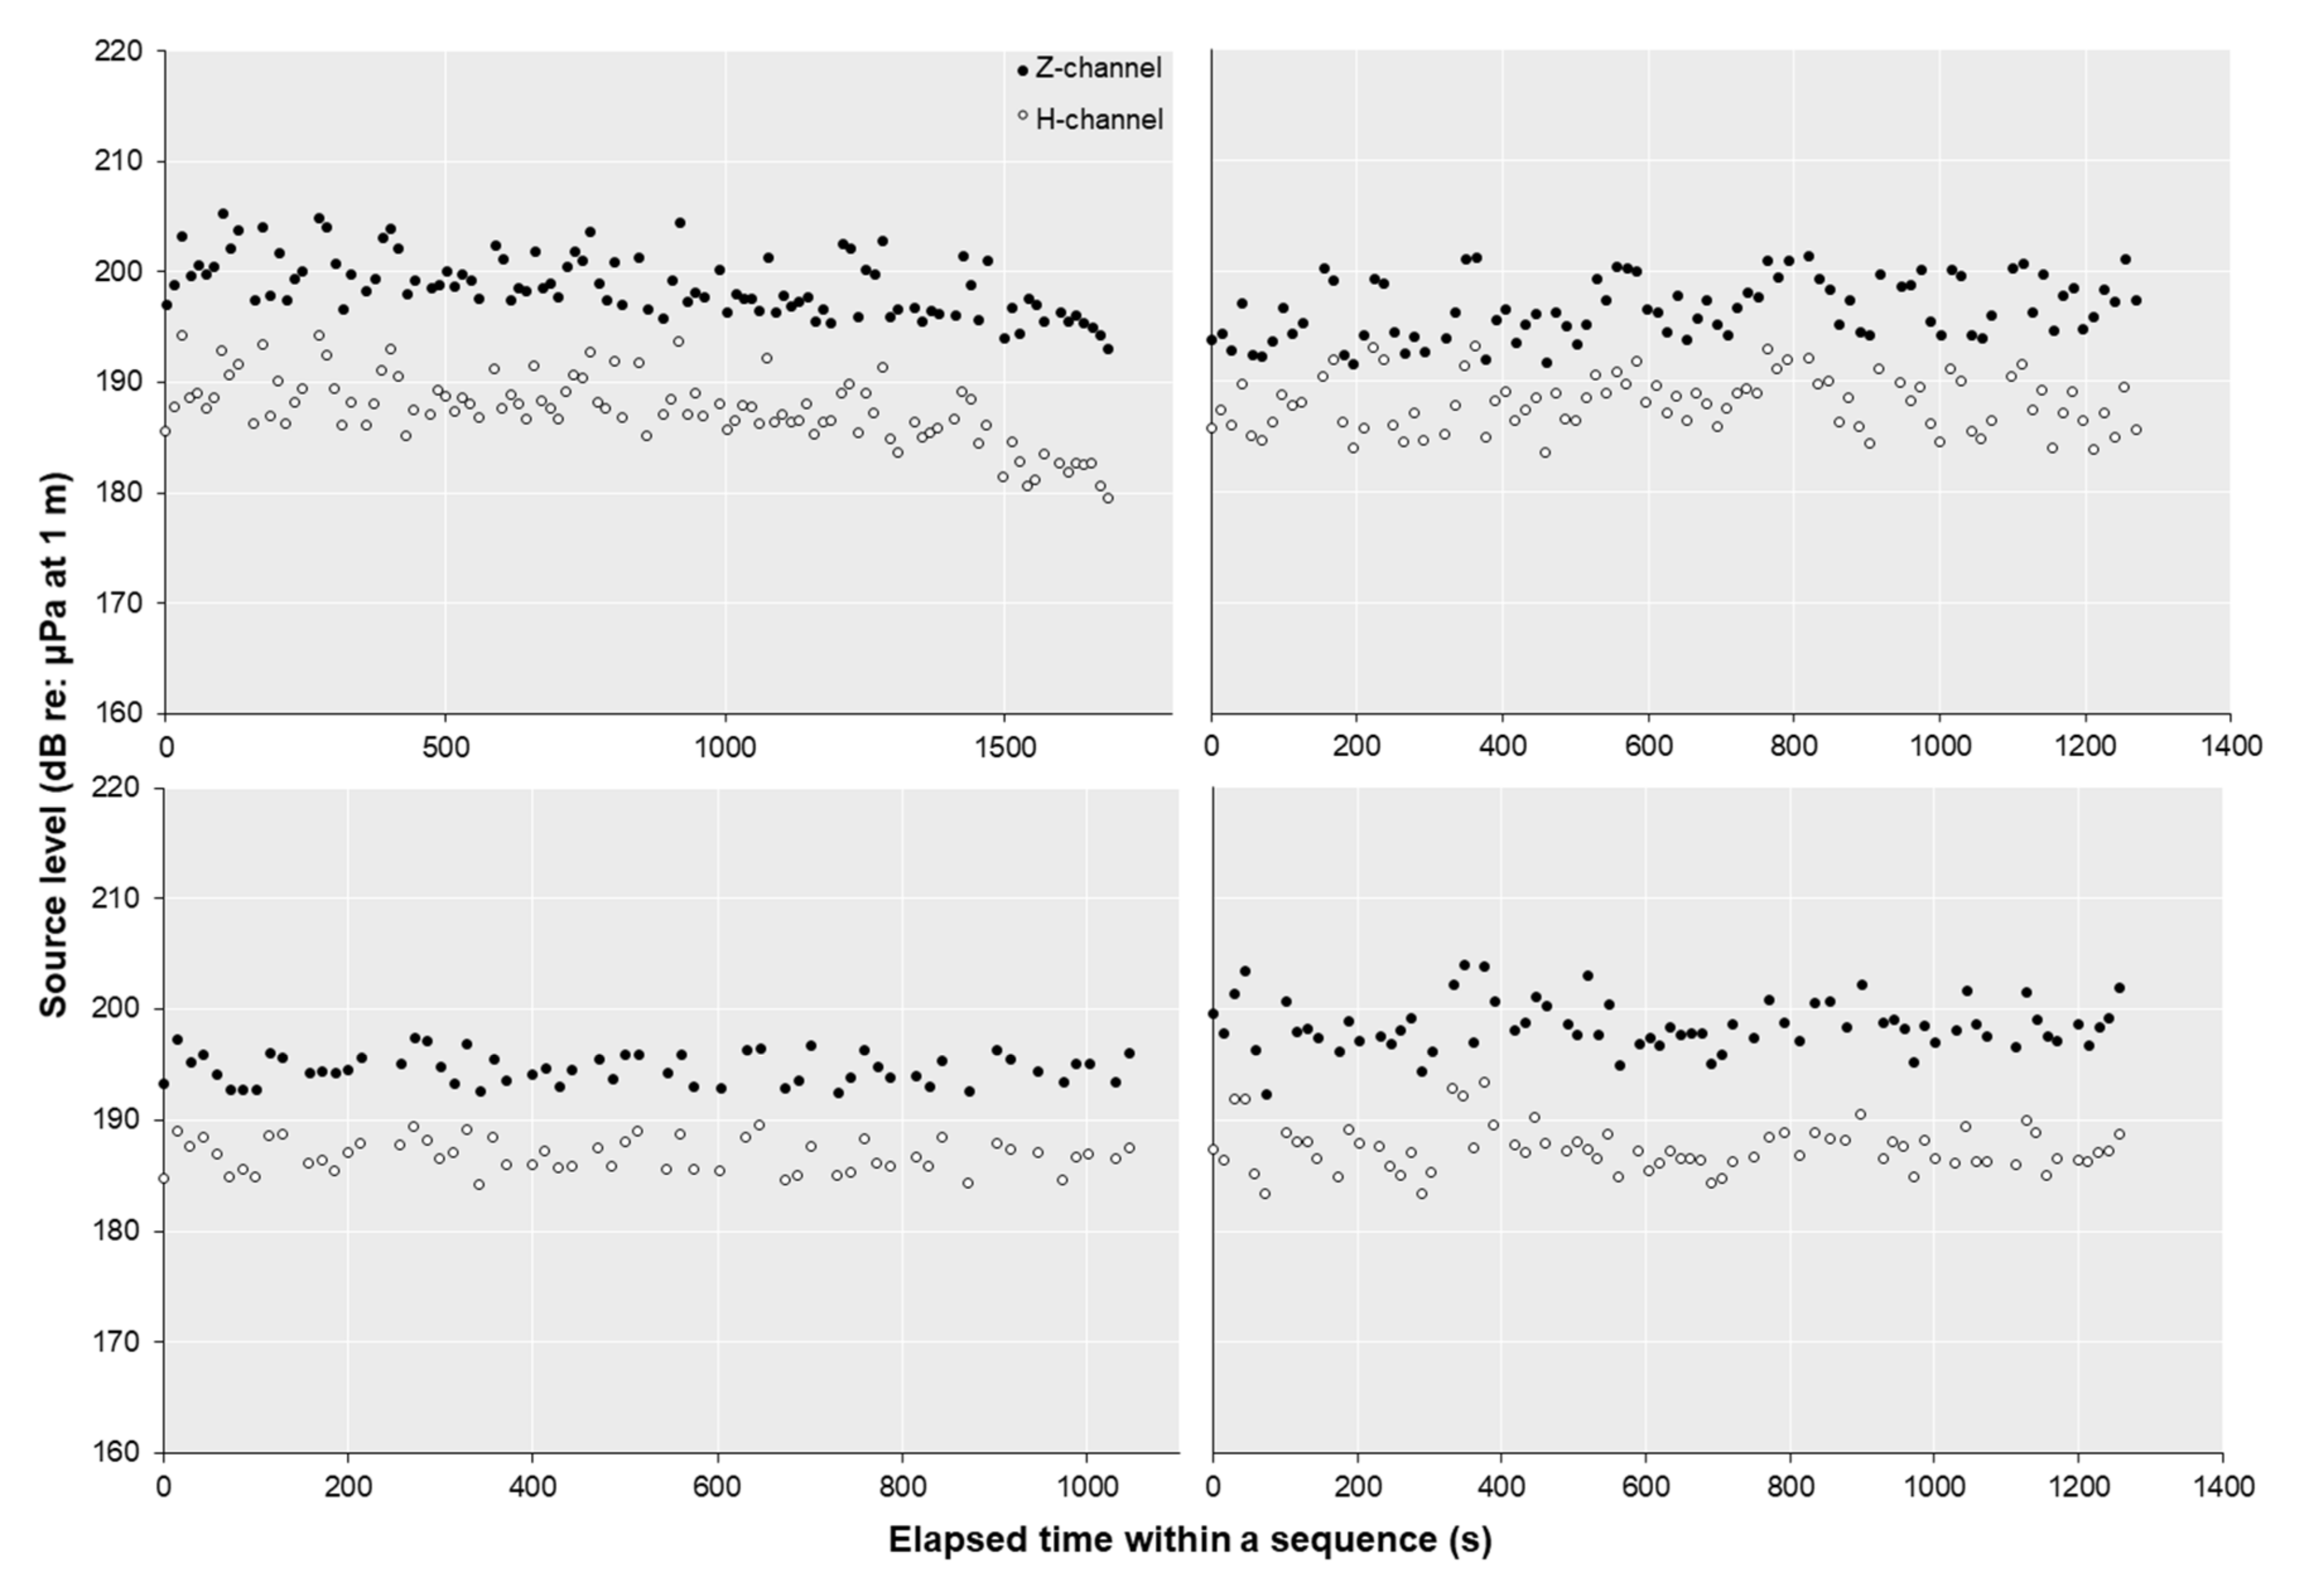
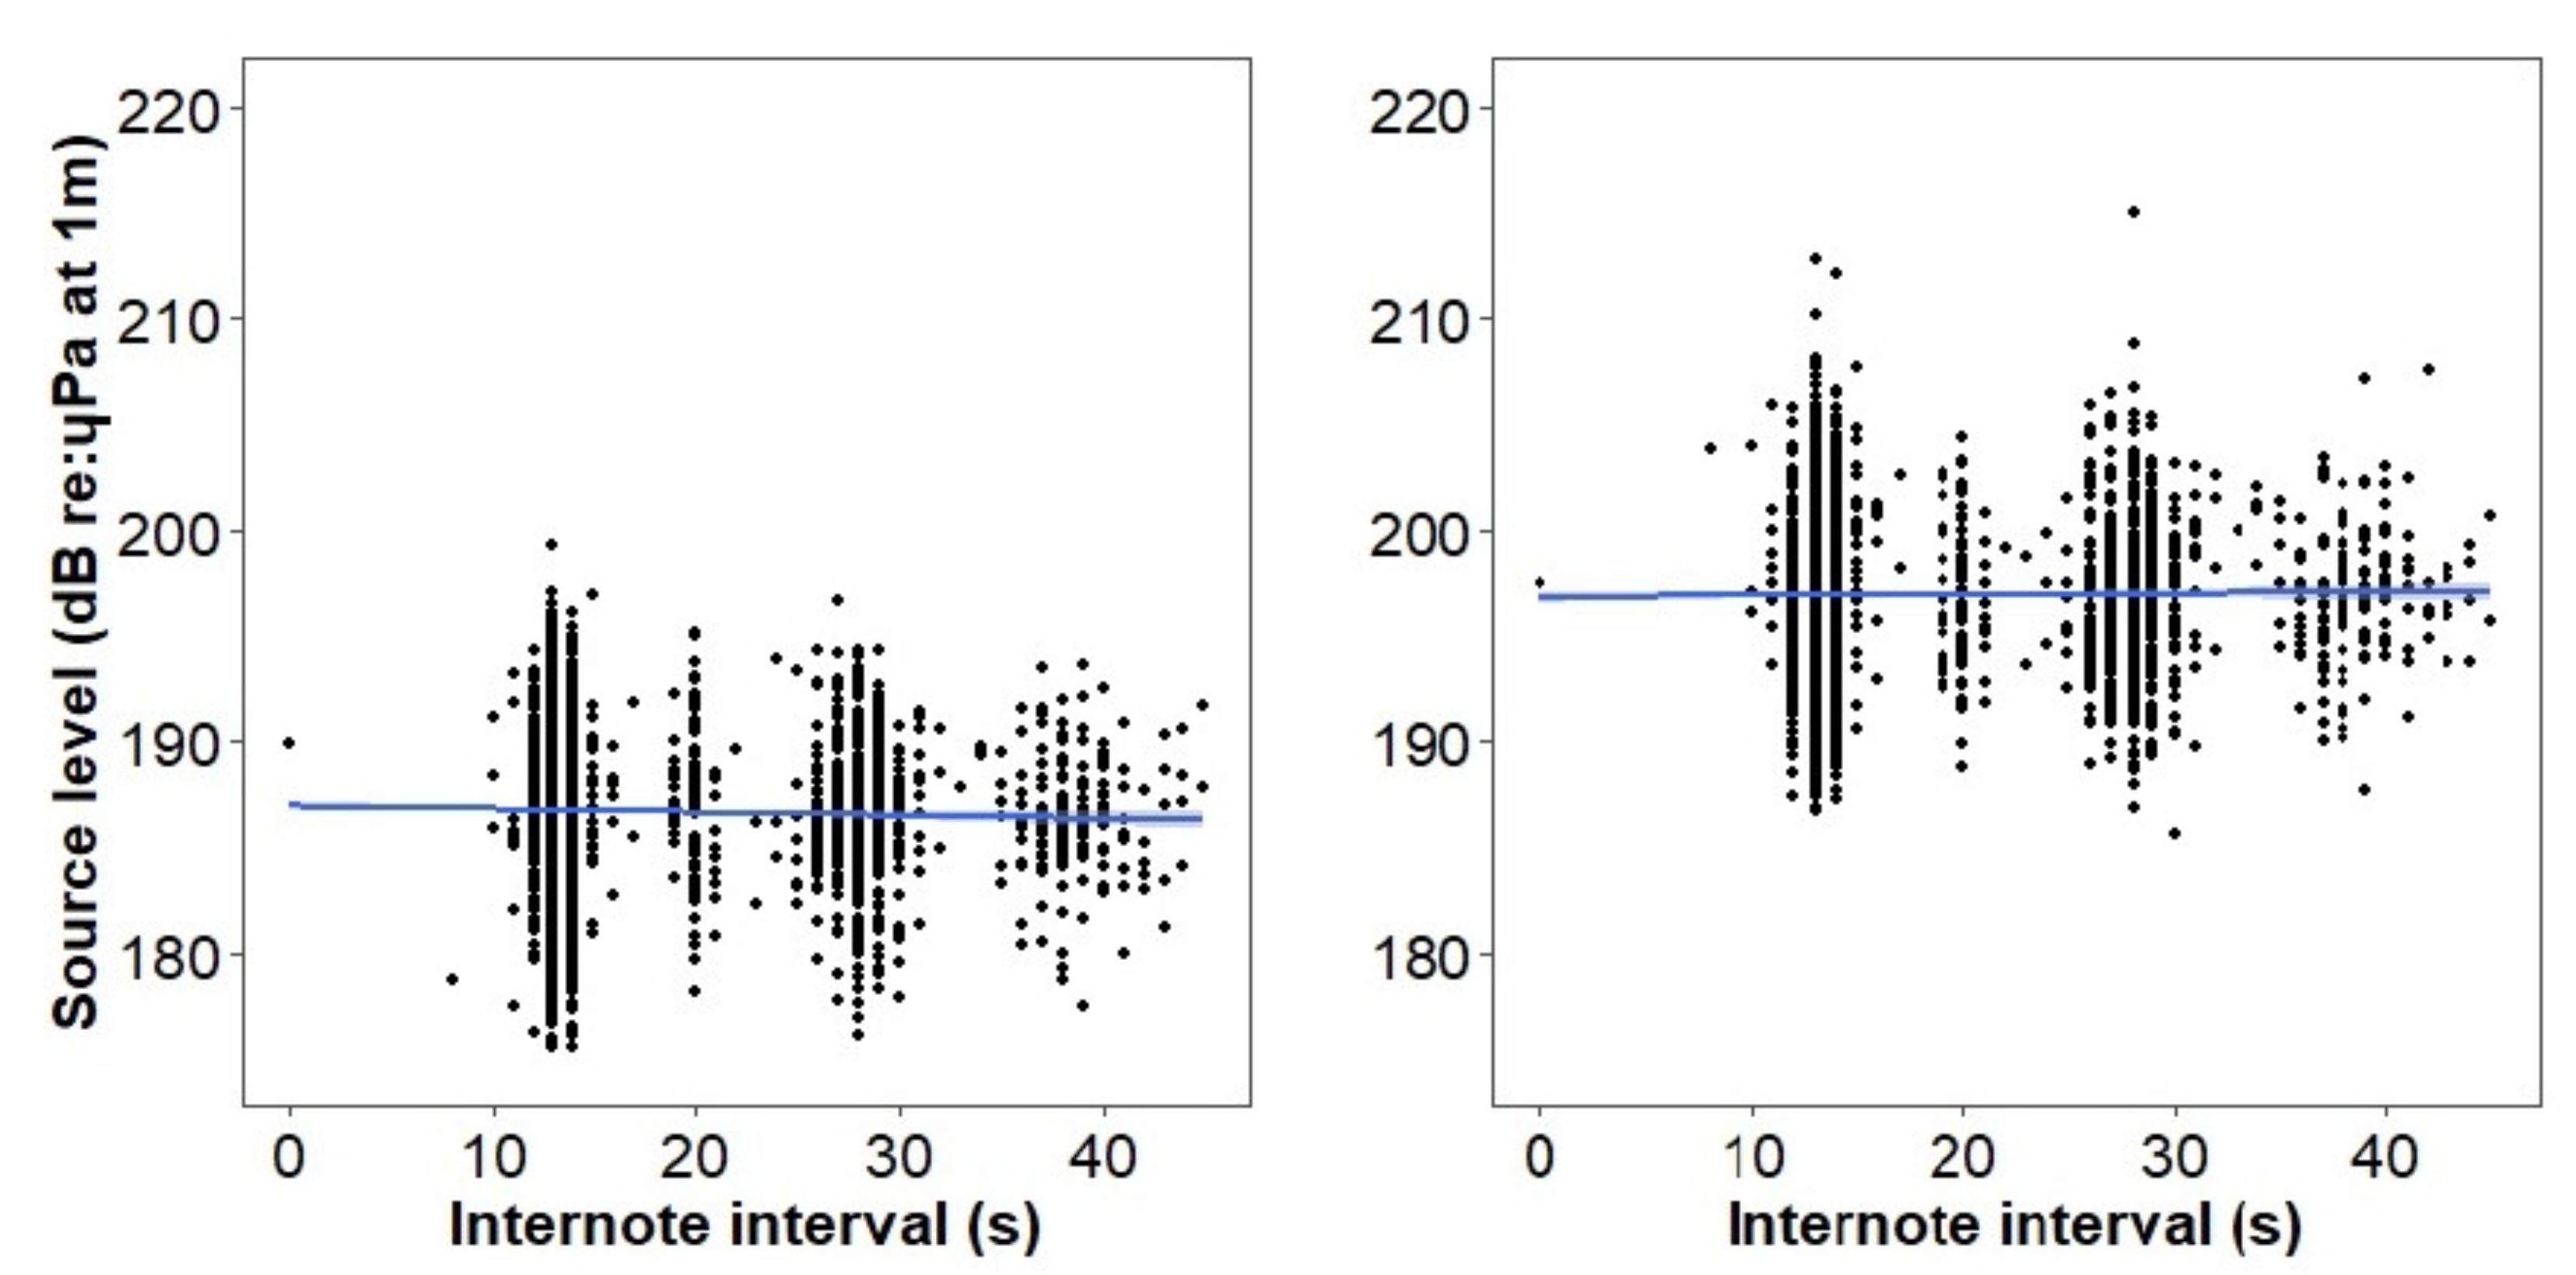
3.2. Temporal Differences in Source Levels

Estimated source levels from the southwest Portugal dataset showed significant statistical differences between months in both OBS channels (Z-channel: Chi-square = 978.54, df = 5, p < 2.2 × 10⁻¹⁶; H-channel: Chi-square = 255.32, df = 5, p < 2.2 × 10⁻¹⁶). In the Z-channel, pairwise comparisons using a post hoc Dunn’s test indicated that January and February had significantly higher estimated source levels than all other months, while March and April were not different from each other and to November and December (Table S1). The H-channel also showed significantly higher estimated source levels in January compared to other months and in February compared only to April and December. April showed lower source levels than all other months and March showed no differences to November or December (Table S1; Figure 4).
Results from GAMs showed how estimated source levels slightly decreased at greater elapsed times within a sequence in both channels (GAM smoother for elapsed time in H channel: edf = 7.67, F = 20.91, p < 0.001; and Z channel: edf = 2.7, F = 26.39, p < 0.001) (Figure 5). However, the lower deviance explained by these models (H-channel: 3.62%; Z-channel: 1.55%) indicated that other variables apart from elapsed time within a sequence affected the variability of source levels. Estimated source levels only started decreasing with elapsed times greater than 1400 s in both channels (Figure 5). A linear regression for elapsed times above 1400s showed a clear decreasing trend in both channels (H-channel: p < 0.001, Adj. R2 = 0.6; Z-channel: p < 0.01, Adj. R2 = 0.3) (Figure 6).
Since there was a decrease of estimated source levels with longer sequences, four of the longest sequences (longer than 1000 s, which is equivalent to ~16 min) were further explored individually. The estimates were very consistent throughout the four sequences, and on some occasions, they followed a wave pattern (Figure 7). The average differences between consecutive source levels were 2.2 dB in the H-channel and 2.3 dB in the Z-channel. Estimated source levels did not vary significantly with increasing inter-note intervals in neither of the channels (H-channel: p = 0.03, Adj. R2 = 0.0007; p = 0.4, R2 = −0.0001) (Figure 8).

4. Discussion

The average source level estimates of fin whale notes calculated for two types of recording channels in five ocean-bottom seismometers (OBS) were in line with the values reported for other deployment areas and recording instruments [28,30,31,32,33,58]. The highest variability was found for the Z-channel source level estimates with a 35 dB difference between instruments and deployment areas. However, this seemed to be associated with an unaccounted technical issue of one seismometer of the Azores deployment. Within all OBS of the Azores dataset, PO5 measured the lowest received levels of fin whale notes. If we discard the instruments with technical issues and small sample sizes (n < 10), the difference between deployment areas was only 2 dB, with an average source level for the Z-channel of 196 dB re: 1 µPa at 1 m. There was a 7 dB difference between the Z-channel source level estimates in this study and the values described by [33]. Considering the potential effects that could not be accounted for, like differences in the amplitudes of notes, bias in ranging methods, and the parameters included in the acoustic propagation settings, differences between both studies can be considered small. Therefore, estimated source levels obtained from the OBS Z-channel were generally consistent throughout deployment areas, signal processing techniques, and acoustic propagation modeling.
The distribution and average (187 dB re: 1 µPa at 1 m) H-channel source levels estimates for the southwest Portugal area were equivalent to those found for the same channel and area but for a different OBS (189 dB re: 1 µPa at 1 m) [31], indicating minor differences caused by the use of different acoustic propagation models and signal detection and processing. In addition, H-channel source levels for the Azores dataset were similar between OBS. This means that within the same deployment area, instrumental variability for the hydrophone was small. Since datasets were processed using the same methodology, we can speculate that the observed 15 dB difference for the H-channel between deployment areas could be mainly related to signal propagation effects.
In the Azores dataset, almost all 20 Hz notes showed changes in their waveform, which were caused by multipaths and acoustic interference. On the other hand, the effects of acoustic interference on the notes of the southwest of Portugal dataset was very small in relation to the large sample size of unaltered fin whale notes. The acoustic propagation settings of the seabed in southwest Portugal resulted in very low amplitudes of the multipaths. Furthermore, estimated ranges for the southwest Portugal dataset were shorter than the critical range (<3700 m) and were inside an area where direct path arrivals dominated the recordings [41]. The associated ranges of fin whale notes of the Azores dataset were estimated to be inside an area where multipaths dominated, resulting in changes of the received signal. Other studies have shown that acoustic interference can also affect the received levels of fin whale notes and therefore cause bias in the source level estimates [10]. Therefore, local effects of signal propagation seem to be the major factor contributing to the differences between source level estimates of the 20 Hz fin whale notes recorded in the H-channel of the two deployment areas. Propagation effects and transmission loss differences can be associated with the 9 dB difference of average source levels between the recording channels since fin whale notes were measured in different mediums. However, the differences in source level estimates found here seem small, given that variability within the same study can sometimes exceed 40 dB [31].
The large sample size in the southwest Portugal OBS resulted in robust source level estimates and allowed the exploration of temporal factors related to fin whale behavior: month, duration of the note sequence, and inter-note interval. The Z-channel source level estimates varied throughout the recording period, peaking in January and February and gradually decreasing during spring. In the northern hemisphere, fin whales show a seasonal pattern in the production of 20 Hz notes, with notes being recorded more frequently between autumn and spring, with a maximum in winter [28,35,55,59]. If fin whale song functions as a reproductive display, as suggested by several studies [7,28], then male fin whales could produce louder notes during the time of highest vocal activity. Assuming that loud signals require a higher energetic cost, the loudness could be an acoustic trait that indicates the condition or quality of the sender and therefore be a proxy of male quality [60,61,62]. Male fin whales could also produce loud notes to maximize the signal transmission distance and potentially increase the number of receivers. If the variability of source levels is associated with the seasonal pattern of note production, then both recording channels of the OBS should follow these changes. The H-channel of the OBS also showed a similar peak in source level estimates in winter months, but the variation was not as pronounced as the one observed in the Z-channel. Seasonal changes in the seabed properties were not expected to contribute significantly to the estimates, which suggests that further analyses are needed to clarify the intra-annual variability of source levels recorded in OBS.
Estimated source levels were relatively constant throughout four long sequences, which [33] also found for recorded fin whales in the Pacific Ocean. During the longest sequence, after 21 min, source levels seemed to decrease with elapsed time. If the number of produced notes and associated source levels are limited by the individual capacity in retaining and using a volume of air to vocalize during a dive, then this tendency should be observed more often. Weirathmueller et al. (2013) [33] identified both positive and negative trends in source level estimates over time in equal proportions. While the small number of long sequences recorded in this study limited this analysis, future research is needed to determine the proportion of individual variability in source level estimates.
Results from this study add valuable information on the variation of fin whale 20 Hz note source levels due to biotic and abiotic factors. Understanding what causes variation in animal call source levels provides insights into the function of calls and helps in assessing the potential effects of increasing anthropogenic noise.

Supplementary Materials

The following are available online at https://www.mdpi.com/article/10.3390/jmse9060646/s1, Table S1: Results of the post hoc pairwise comparison Dunn’s test of estimated source levels per month and for the OBS H- and Z-channel deployed off southwest Portugal.

Author Contributions

Conceptualization, A.P., M.R., M.A.S. and L.M.; methodology, A.P., M.R., C.C. and L.M.; formal analysis, A.P. and M.R.; investigation, A.P., C.C., M.R. and L.M.; writing—original draft preparation, A.P.; writing—review and editing, A.P., M.R., C.C., M.A.S. and L.M.; visualization, A.P., M.R., M.A.S. and L.M.; project administration, L.M. and M.A.S.; funding acquisition, L.M. and M.A.S. All authors have read and agreed to the published version of the manuscript.

Funding

This research was funded by FCT–Fundação para a Ciência e a Tecnologia, through project AWARENESS “PTDC/BIA-BMA/30514/201” and “UIDB/50019/2020–IDL”. The acoustic data of southwest Portugal were collected for the NEAREST project, on behalf of the EU Specific Programme “Integrating and Strengthening the European Research Area,” Sub-Priority 1.1.6.3, “Global Change and Ecosystems,” Contract No. 037110. A.P. was supported by project AWARENESS “PTDC/BIA-BMA/30514/201”. M.R. was supported by a DRCT doctoral grant “M3.1.a/F/028/2015”. M.A.S. was funded by FCT (IF/00943/2013) and by PO Açores 2020, DRCT/Açores, and PRO-SCIENTIA through the project “Investigadores Mar AZ”.

Institutional Review Board Statement

Not applicable.

Informed Consent Statement

Not applicable.

Data Availability Statement

The data presented in this study are available on request from the corresponding author. The data are not publicly available because the funding project is not finished yet. Data will be available when the project is finished, by the end of 2021.

Acknowledgments

We thank José Luís Duarte and all of the skippers and crew members that collaborated in the deployment and retrieval of the OBS and EAR in the Azores study area. We also thank Irma Cascão and Cláudia Oliveira for reviewing initial versions of the article and providing critical insights.

Conflicts of Interest

The authors declare no conflict of interest.

References

  1. Au, W.W.L.; Hastings, M.C. Principles of Marine Bioacoustics, 1st ed.; Springer: New York, NY, USA, 2008; p. 695. [Google Scholar] [CrossRef]
  2. Edds-Walton, P.L. Acoustic communication signals of mysticete whales. Bioacoustics 1997, 8, 47–60. [Google Scholar] [CrossRef]
  3. Clark, C.W. Acoustic behavior of mysticete whales. In Sensory Abilities of Cetaceans, 1st ed.; Thomas, J., Kastelein, R., Eds.; Plenum: New York, NY, USA, 1990; pp. 571–583. [Google Scholar] [CrossRef] [Green Version]
  4. Parks, S.E.; Cusano, D.A.; Stimpert, A.K.; Weinrich, M.T.; Friedlaender, A.S.; Wiley, D.N. Evidence for acoustic communication among bottom foraging humpback whales. Sci. Rep. 2014, 4, 7508. [Google Scholar] [CrossRef]
  5. Tyack, P.L. Differential response of humpback whales, Megaptera novaeangliae, to playback of song or social sounds. Behav. Ecol. Sociobiol. 1983, 13, 49–55. [Google Scholar] [CrossRef]
  6. Zoidis, A.M.; Smultea, M.A.; Frankel, A.S.; Hopkins, J.L.; Day, A.J.; McFarland, A.S.; Whitt, A.D.; Fertl, D. Vocalizations produced by humpback whale (Megaptera novaeangliae) calves recorded in Hawaii. J. Acoust. Soc. Am. 2008, 123, 1737–1746. [Google Scholar] [CrossRef] [Green Version]
  7. Croll, D.; Clark, C.W.; Acevedo, A.; Tershy, B.; Flores, S.; Gedamke, J.; Urban, J. Only male fin whales sing loud songs. Nature 2002, 417, 809. [Google Scholar] [CrossRef]
  8. Smith, J.N.; Goldizen, A.W.; Dunlop, R.A.; Noad, M.J. Songs of humpback whales, Megaptera novaeangliae, are involved in intersexual interactions. Anim. Behav. 2008, 76, 467–477. [Google Scholar] [CrossRef]
  9. Payne, R.; Webb, D. Orientation by means of long range acoustic signaling in baleen whales. Ann. N. Y. Acad. Sci. 1970, 188, 110–141. [Google Scholar] [CrossRef] [PubMed]
  10. Charif, R.A.; Mellinger, D.K.; Dunsmore, K.J.; Fristrup, K.M.; Clark, C.W. Estimated sound source levels of fin whale (Balaenoptera physalus) vocalizations: Adjustments for surface interference. Mar. Mamm. Sci. 2002, 18, 81–98. [Google Scholar] [CrossRef]
  11. Cato, D.H. Simple methods of estimating source levels and locations of marine animal sounds. J. Acoust. Soc. Am. 1998, 3, 1667–1678. [Google Scholar] [CrossRef] [PubMed]
  12. Hatch, L.T.; Clark, C.W.; Parijs, S.M.V.; Frankel, A.S.; Ponirakis, D.W. Quantifying loss of acoustic communication space for right whales in and around a U.S. National Marine Sanctuary. Conserv. Biol. 2012, 6, 983–994. [Google Scholar] [CrossRef] [PubMed]
  13. Duarte, C.M.; Chapuis, L.; Collin, S.P.; Costa, D.P.; Devassy, R.P.; Eguiluz, V.M.; Erbe, C.; Gordon, T.A.C.; Halpern, B.S.; Harding, H.R.; et al. The soundscape of the Anthropocene ocean. Science 2021, 371, eaba4658. [Google Scholar] [CrossRef]
  14. Frisk, G.V. Noiseonomics: The relationship between ambient noise levels in the sea and global economic trends. Sci. Rep. 2012, 2, 437. [Google Scholar] [CrossRef] [PubMed] [Green Version]
  15. Hildebrand, J.A. Anthropogenic and natural sources of ambient noise in the ocean. Mar. Ecol. Prog. Ser. 2009, 395, 5–20. [Google Scholar] [CrossRef] [Green Version]
  16. Ross, D. Ship sources of ambient noise. IEEE J. Ocean. Eng. 2005, 30, 257–261. [Google Scholar] [CrossRef]
  17. Širović, A.; Hildebrand, J.; McDonald, M. Ocean ambient sound south of Bermuda and Panama Canal traffic. J. Acoust. Soc. Am. 2016, 139, 2417–2423. [Google Scholar] [CrossRef] [Green Version]
  18. Erbe, C.; Reichmuth, C.; Cunningham, K.; Lucke, K.; Dooling, R. Communication masking in marine mammals: A review and research strategy. Mar. Pollut. Bull. 2015, 103, 15–38. [Google Scholar] [CrossRef] [PubMed]
  19. Kunc, H.P.; McLaughlin, K.E.; Schmidt, R. Aquatic noise pollution: Implications for individuals, populations, and ecosystems. Proc. R. Soc. B 2016, 283, 20160839. [Google Scholar] [CrossRef] [Green Version]
  20. Parks, S.E.; Clark, C.W.; Tyack, P.L. Short- and long-term changes in right whale calling behavior: The potential effects of noise on acoustic communication. J. Acoust. Soc. Am. 2007, 122, 3725–3731. [Google Scholar] [CrossRef] [PubMed]
  21. Castellote, M.; Clark, C.W.; Lammers, M.O. Acoustic and behavioural changes by fin whales (Balaenoptera physalus) in response to shipping and airgun noise. Biol. Conserv. 2012, 147, 115–122. [Google Scholar] [CrossRef]
  22. McKenna, M.F. Blue Whale Response to Underwater Noise from Commercial Ships. Ph.D. Thesis, University of California, San Diego, CA, USA, 2011. [Google Scholar]
  23. Parks, S.E.; Johnson, M.; Nowacek, D.; Tyack, P.L. Individual right whales call louder in increased environmental noise. Biol. Lett. 2010, 7, 33–35. [Google Scholar] [CrossRef]
  24. Melcón, M.L.; Cummins, A.J.; Kerosky, S.M.; Roche, L.K.; Wiggins, S.M.; Hildebrand, J.A. Blue whales respond to anthropogenic noise. PLoS ONE 2012, 7, 681. [Google Scholar] [CrossRef] [Green Version]
  25. Parks, S.E.; Urazghildiiev, I.; Clark, C.W. Variability in ambient noise levels and call parameters of North Atlantic right whales in three habitat areas. J. Acoust. Soc. Am. 2009, 125, 1230–1239. [Google Scholar] [CrossRef]
  26. Di Ioro, L.; Clark, C.W. Exposure to seismic survey alters blue acoustic communication. Biol. Lett. 2010, 5, 51–54. [Google Scholar] [CrossRef] [PubMed] [Green Version]
  27. Širović, A.; Oleson, E.M.; Buccowich, J.; Rice, A.; Bayless, A.R. Fin whale song variability in southern California and the Gulf of California. Sci. Rep. 2017, 7, 10126. [Google Scholar] [CrossRef] [PubMed] [Green Version]
  28. Watkins, W.A.; Tyack, P.; Moore, K.E. The 20-Hz signals of finback whales (Balaenoptera physalus). J. Acoust. Soc. Am. 1987, 82, 1901–1912. [Google Scholar] [CrossRef]
  29. Thompson, P.O.; Findley, L.T.; Vidal, O. 20-Hz pulses and other vocalizations of fin whales, Balaenoptera physalus, in the Gulf of California, Mexico. J. Acoust. Soc. Am. 1992, 92, 3051–3057. [Google Scholar] [CrossRef] [PubMed]
  30. Wang, D.; Huang, W.; Garcia, H.; Ratilal, P. Vocalization source level distributions and pulse compression gains of diverse baleen whale species in the Gulf of Maine. Remote Sens. 2016, 8, 881. [Google Scholar] [CrossRef] [Green Version]
  31. Miksis-Olds, J.L.; Harris, D.V.; Heaney, K.D. Comparison of estimated 20-Hz pulse fin whale source levels from the tropical Pacific and Eastern North Atlantic Oceans to other recorded populations. J. Acoust. Soc. Am. 2019, 146, 2373–2384. [Google Scholar] [CrossRef]
  32. Širović, A.; Hildebrand, J.A.; Wiggins, S.M. Blue and fin whale call source levels and propagation range in the Southern Ocean. J. Acoust. Soc. Am. 2007, 122, 1208–1215. [Google Scholar] [CrossRef] [PubMed] [Green Version]
  33. Weirathmueller, M.J.; Wilcock, W.S.; Soule, D.C. Source levels of fin whale 20 Hz pulses measured in the Northeast Pacific Ocean. J. Acoust. Soc. Am. 2013, 133, 741–749. [Google Scholar] [CrossRef]
  34. Hatch, L.T.; Clark, C.W. Acoustic differentiation between fin whales in both the North Atlantic and North Pacific Oceans, and integration with genetic estimates of divergence. Presented at IWC Scientific Committee, Sorrento, Italy, 19–22 July 2004; Paper No. SC/56/SD6. pp. 1–37. [Google Scholar]
  35. Pereira, A.; Harris, D.; Tyack, P.; Matias, L. Fin whale acoustic presence and song characteristics in seas to the southwest of Portugal. J. Acoust. Soc. Am. 2020, 147, 2235–2249. [Google Scholar] [CrossRef]
  36. Delarue, J.; Todd, S.K.; VanParijs, S.M.; DiIorio, L. Geographic variation in Northwest Atlantic fin whale (Balaenoptera physalus) song: Implications for stock structure assessment. J. Acoust. Soc. Am. 2009, 125, 1774–1782. [Google Scholar] [CrossRef] [PubMed]
  37. Watkins, W.A. Activities and underwater sounds of fin whales. Sci. Rep. Whales Res. Inst. 1981, 33, 83–117. [Google Scholar]
  38. Silva, M.A.; Prieto, R.; Jonsen, I.; Baumgartner, M.F.; Santos, R.S. North Atlantic blue and fin whales suspend their spring migration to forage in middle latitudes: Building up energy reserves for the journey? PLoS ONE 2013, 8, e76507. [Google Scholar] [CrossRef] [Green Version]
  39. Silva, M.A.; Prieto, R.; Cascão, I.; Seabra, M.I.; Machete, M.; Baumgartner, M.F.; Santos, R.S. Spatial and temporal distribution of cetaceans in the mid-Atlantic waters around the Azores. Mar. Biol. Res. 2014, 10, 123–137. [Google Scholar] [CrossRef]
  40. Prieto, R.; Tobeña, M.; Silva, M.A. Habitat preferences of baleen whales in a mid-latitude habitat. Deep Sea Res. Part II Top. Stud. Oceanogr. 2017, 141, 155–167. [Google Scholar] [CrossRef]
  41. Pérez-Jorge, S.; Tobeña, M.; Prieto, R.; Vandeperre, F.; Calmettes, B.; Lehodey, P.; Silva, M.A. Environmental drivers of large-scale movements of baleen whales in the mid-North Atlantic Ocean. Divers. Distrib. 2020, 26, 683–698. [Google Scholar] [CrossRef] [Green Version]
  42. Clapham, P.J.; Aguilar, A.; Hatch, L.T. Determining spatial and temporal scales for management: Lessons from whaling. Mar. Mammal Sci. 2008, 24, 183–201. [Google Scholar] [CrossRef] [Green Version]
  43. Panigada, S.; Notarbartolo di Sciara, G. Balaenoptera physalus in IUCN 2017, IUCN Red List of Threatened Species, Version 2017.3. Available online: http://www.iucnredlist.org (accessed on 27 April 2021).
  44. Geissler, W.H.; Matias, L.; Stich, D.; Carrilho, F.; Jokat, W.; Monna, S.; IbenBrahim, A.; Mancilla, F.; Gutscher, M.-A.; Sallarès, V.; et al. Focal mechanisms for subcrustal earthquakes in the Gulf of Cadiz from a dense OBS deployment. Geophys. Res. Lett. 2010, 37, L18309. [Google Scholar] [CrossRef] [Green Version]
  45. Silva, S.D.M.M.F. Strain Partitioning and the Seismicity Distribution Within a Transpressive Plate Boundary: SW Iberia-NW Nubia. Ph.D. Thesis, University of Lisbon, Lisbon, Portugal, 2017. [Google Scholar]
  46. Schmidt-Aursch, C.M.; Haberland, C. DEPAS (Deutscher Geräte-Pool für amphibische Seismologie): German Instrument Pool for Amphibian Seismology. J. Largescale Res. Facilit. 2017, 3, A122. [Google Scholar] [CrossRef]
  47. Harris, D.; Matias, L.; Thomas, L.; Harwood, J.; Geissler, W.H. Applying distance sampling to fin whale calls recorded by single seismic instruments in the Northeast Atlantic. J. Acoust. Soc. Am. 2013, 134, 3522–3535. [Google Scholar] [CrossRef]
  48. Matias, L.; Harris, D. A single-station method for the detection, classification and location of fin whale calls using ocean-bottom seismic stations. J. Acoust. Soc. Am. 2015, 138, 504–520. [Google Scholar] [CrossRef] [PubMed] [Green Version]
  49. Ottemöller, L.; Voss, P.; Havskov, J. SEISAN: Earthquake analysis software for Windows, Solaris, Linux and Mac OSX, 2011. Available online: http://seisan.info (accessed on 9 June 2021).
  50. Ikelle, L.; Amundsen, L. Introduction to Petroleum Seismology, 2nd ed.; Society of Exploration Geophysicists: Tulsa, OK, USA, 2005; pp. 92–95. [Google Scholar] [CrossRef]
  51. Ludwig, W.J.; Nafe, J.E.; Drake, C.L. Seismic refraction. In The Sea, 1st ed.; Maxwell, A.E., Ed.; Wiley-Interscience: New York, NY, USA, 1970; Volume 4, pp. 53–84. [Google Scholar]
  52. Porter, M. The BELLHOP manual and user’s guide: Preliminary draft. 2011. Available online: http://oalib.hlsresearch.com/Rays/HLS-2010-1.pdf (accessed on 27 April 2021).
  53. Stimpert, A.K.; DeRuiter, S.L.; Falcone, E.A.; Joseph, J.; Douglas, A.B.; Moretti, D.J.; Friedlaender, A.S.; Calambokidis, J.; Gailey, G.; Tyack, P.L.; et al. Sound production and associated behavior of tagged fin whales (Balaenoptera physalus) in the Southern California Bight. Anim. Biotelem. 2015, 3, 23. [Google Scholar] [CrossRef] [Green Version]
  54. Boyer, T.P.; Garcia, H.E.; Locarnini, R.A.; Zweng, M.M.; Mishonov, A.V.; Reagan, J.R.; Weathers, K.A.; Baranova, O.K.; Seidov, D.; Smolyar, I.V. World Ocean Atlas 2018. NOAA National Centers for Environmental Information. Dataset. Available online: https://accession.nodc.noaa.gov/NCEI-WOA18 (accessed on 27 April 2021).
  55. Romagosa, M.; Cascão, I.; Merchant, N.D.; Lammers, M.O.; Giacomello, E.; Marques, T.A.; Silva, M.A. Underwater ambient noise in a baleen whale migratory habitat off the Azores. Front. Mar. Sci. 2017, 4, 109. [Google Scholar] [CrossRef] [Green Version]
  56. Wood, S.N. Generalised Additive Models: An Introduction with R, 2nd ed.; Chapman & Hall: Boca Raton, FL, USA, 2017. [Google Scholar] [CrossRef]
  57. RStudio Team. RStudio: Integrated Development for R. RStudio, PBC, Boston, MA, USA 2020. Available online: http://www.rstudio.com/ (accessed on 27 April 2021).
  58. Northrop, J.; Cummings, W.; Thompson, P. 20-Hz signals observed in the central Pacific. J. Acoust. Soc. Am. 1968, 43, 383–384. [Google Scholar] [CrossRef]
  59. Stafford, K.M.; Mellinger, D.K.; Moore, S.E.; Fox, C.G. Seasonal variability and detection range modeling of baleen whale calls in the Gulf of Alaska, 1999–2002. J. Acoust. Soc. Am. 2007, 122, 3378–3390. [Google Scholar] [CrossRef] [PubMed]
  60. Zollinger, S.A.; Brumm, H. Why birds sing loud songs and why they sometimes don’t. Anim. Behav. 2015, 105, 289–295. [Google Scholar] [CrossRef]
  61. Searcy, W.A. Sound-pressure levels and song preferences in female red-winged blackbirds (Agelaius phoeniceus) (Aves, Emberizidae). Ethology 1996, 102, 187–196. [Google Scholar] [CrossRef]
  62. Benítez, M.E.; Roux, A.; Fischer, J.; Beehner, J.C.; Bergman, T.J. Acoustic and Temporal Variation in Gelada (Theropithecus gelada) Loud Calls Advertise Male Quality. Int. J. Primatol. 2016, 37, 568–585. [Google Scholar] [CrossRef]
Figure 1. Locations of the OBS (red stars) that recorded fin whale notes used in this study.
Jmse 09 00646 g001
Figure 2. Flowchart of data acquisition and processing stages to estimate source levels of 20 Hz fin whale notes.
Jmse 09 00646 g002
Figure 3. Distribution of estimated source levels from 20 Hz fin whale notes manually detected in the H-channel (top) and the Z-channel (bottom) of three OBS in the Azores (left) and one OBS in southwest Portugal (right). Estimated source levels for the Z-channel of PO4 were not included because of the small sample size.
Jmse 09 00646 g003
Figure 4. Estimated source levels of fin whale notes by month recorded in the Z-channel (left) and the H-channel (right) of the OBS off southwest Portugal. The upper and lower whiskers represent the maximum and minimum value of the data within 1.5 times the interquartile range over the 75th percentile and under the 25th percentile, respectively.
Jmse 09 00646 g004
Figure 5. Estimated source levels for 20 Hz fin whale notes detected in the H-channel (left) and the Z-channel (right) of the OBS off southwest Portugal plotted against the elapsed time within a sequence. A fitted smoothed line (blue) is fitted to the data with its associated 95% confidence intervals in shaded grey. Black dots represent estimated source levels.
Jmse 09 00646 g005
Figure 6. Estimated source levels from 20 Hz fin whale notes manually detected in the H-channel (left) and the Z-channel (right) from the OBS off southwest Portugal against elapsed time within a sequence longer than 1400 s. A linear regression line (blue) is fitted to the data with its associated 95% confidence intervals (shaded grey). Black dots represent estimated source levels.
Jmse 09 00646 g006
Figure 7. Examples of estimated source levels over elapsed time within sequences recorded on 11 January 2008 (two top), 26 December 2007 (bottom-left), and 1 February 2008 (bottom-right) in the southwest Portugal.
Jmse 09 00646 g007
Figure 8. Estimated source levels from 20 Hz fin whale notes manually detected in the H-channel (left) and the Z-channel (right) from the OBS off southwest Portugal against inter-note interval. The blue line represents a linear regression fitted to the data (black dots).
Jmse 09 00646 g008
Table 1. Technical specifications of each OBS used in this study.
OBSDepth (m)Sensitivity-H (dB re 1 V/µPa)Sensitivity-Z (V/m/s)Gain-H (dB)Gain-Z (dB)Conversion Factor-H (count/Pa)Conversion Factor-Z (count/m/s)
PO2830−168.527.621.3211.91140.4319,898,719.47
PO3760−168.327.621.3211.91166.9919,898,719.47
PO4776−168.127.62611.92046.7219,898,719.47
PO5790−167.927.621.3211.91221.9919,898,719.47
OBS041993−194.71918411797.211,434,804,623
Table 2. Properties of the water column and the seabed of the Azores and southwest Portugal deployment areas.
ParameterAzoresSouthwest Portugal
Water column sound (P-wave) velocity (m/s)15001500
Water column density (kg/m3)10001000
Seabed S-wave velocity (m/s)800300
Seabed P-wave velocity (m/s)18001700
Seabed density (kg/m3)13001400
Table 3. Estimated fin whale mean source levels (SL) and the corresponding coefficient of variation as a function of the deployment location, detection period, and sample size. The sample size of the Z-channel of the Azores dataset corresponds to notes that were accepted after the incidence angle filtering.
LocationDetection PeriodOBSZ-ChannelH-Channel
Sample (n)SL (dB re: 1 µPa at 1 m)CV (%)Sample (n)SL (dB re: 1 µPa at 1 m)CV (%)
Southwest PT11/07–04/08OBS044866196.91.84866186.71.7
OBS041443197.31.61443187.21.5
Azores04/19PO238194.65.00--
PO30--260172.23.2
PO42201.80.20--
PO532163.41.8281171.33.7
Publisher’s Note: MDPI stays neutral with regard to jurisdictional claims in published maps and institutional affiliations.

