
Analysis of the Spatio-Temporal Evolution of Dredging from Satellite Images: A Case Study in the Principality of Asturias (Spain)

 ,
,  ,
, 

Abstract
1. Introduction
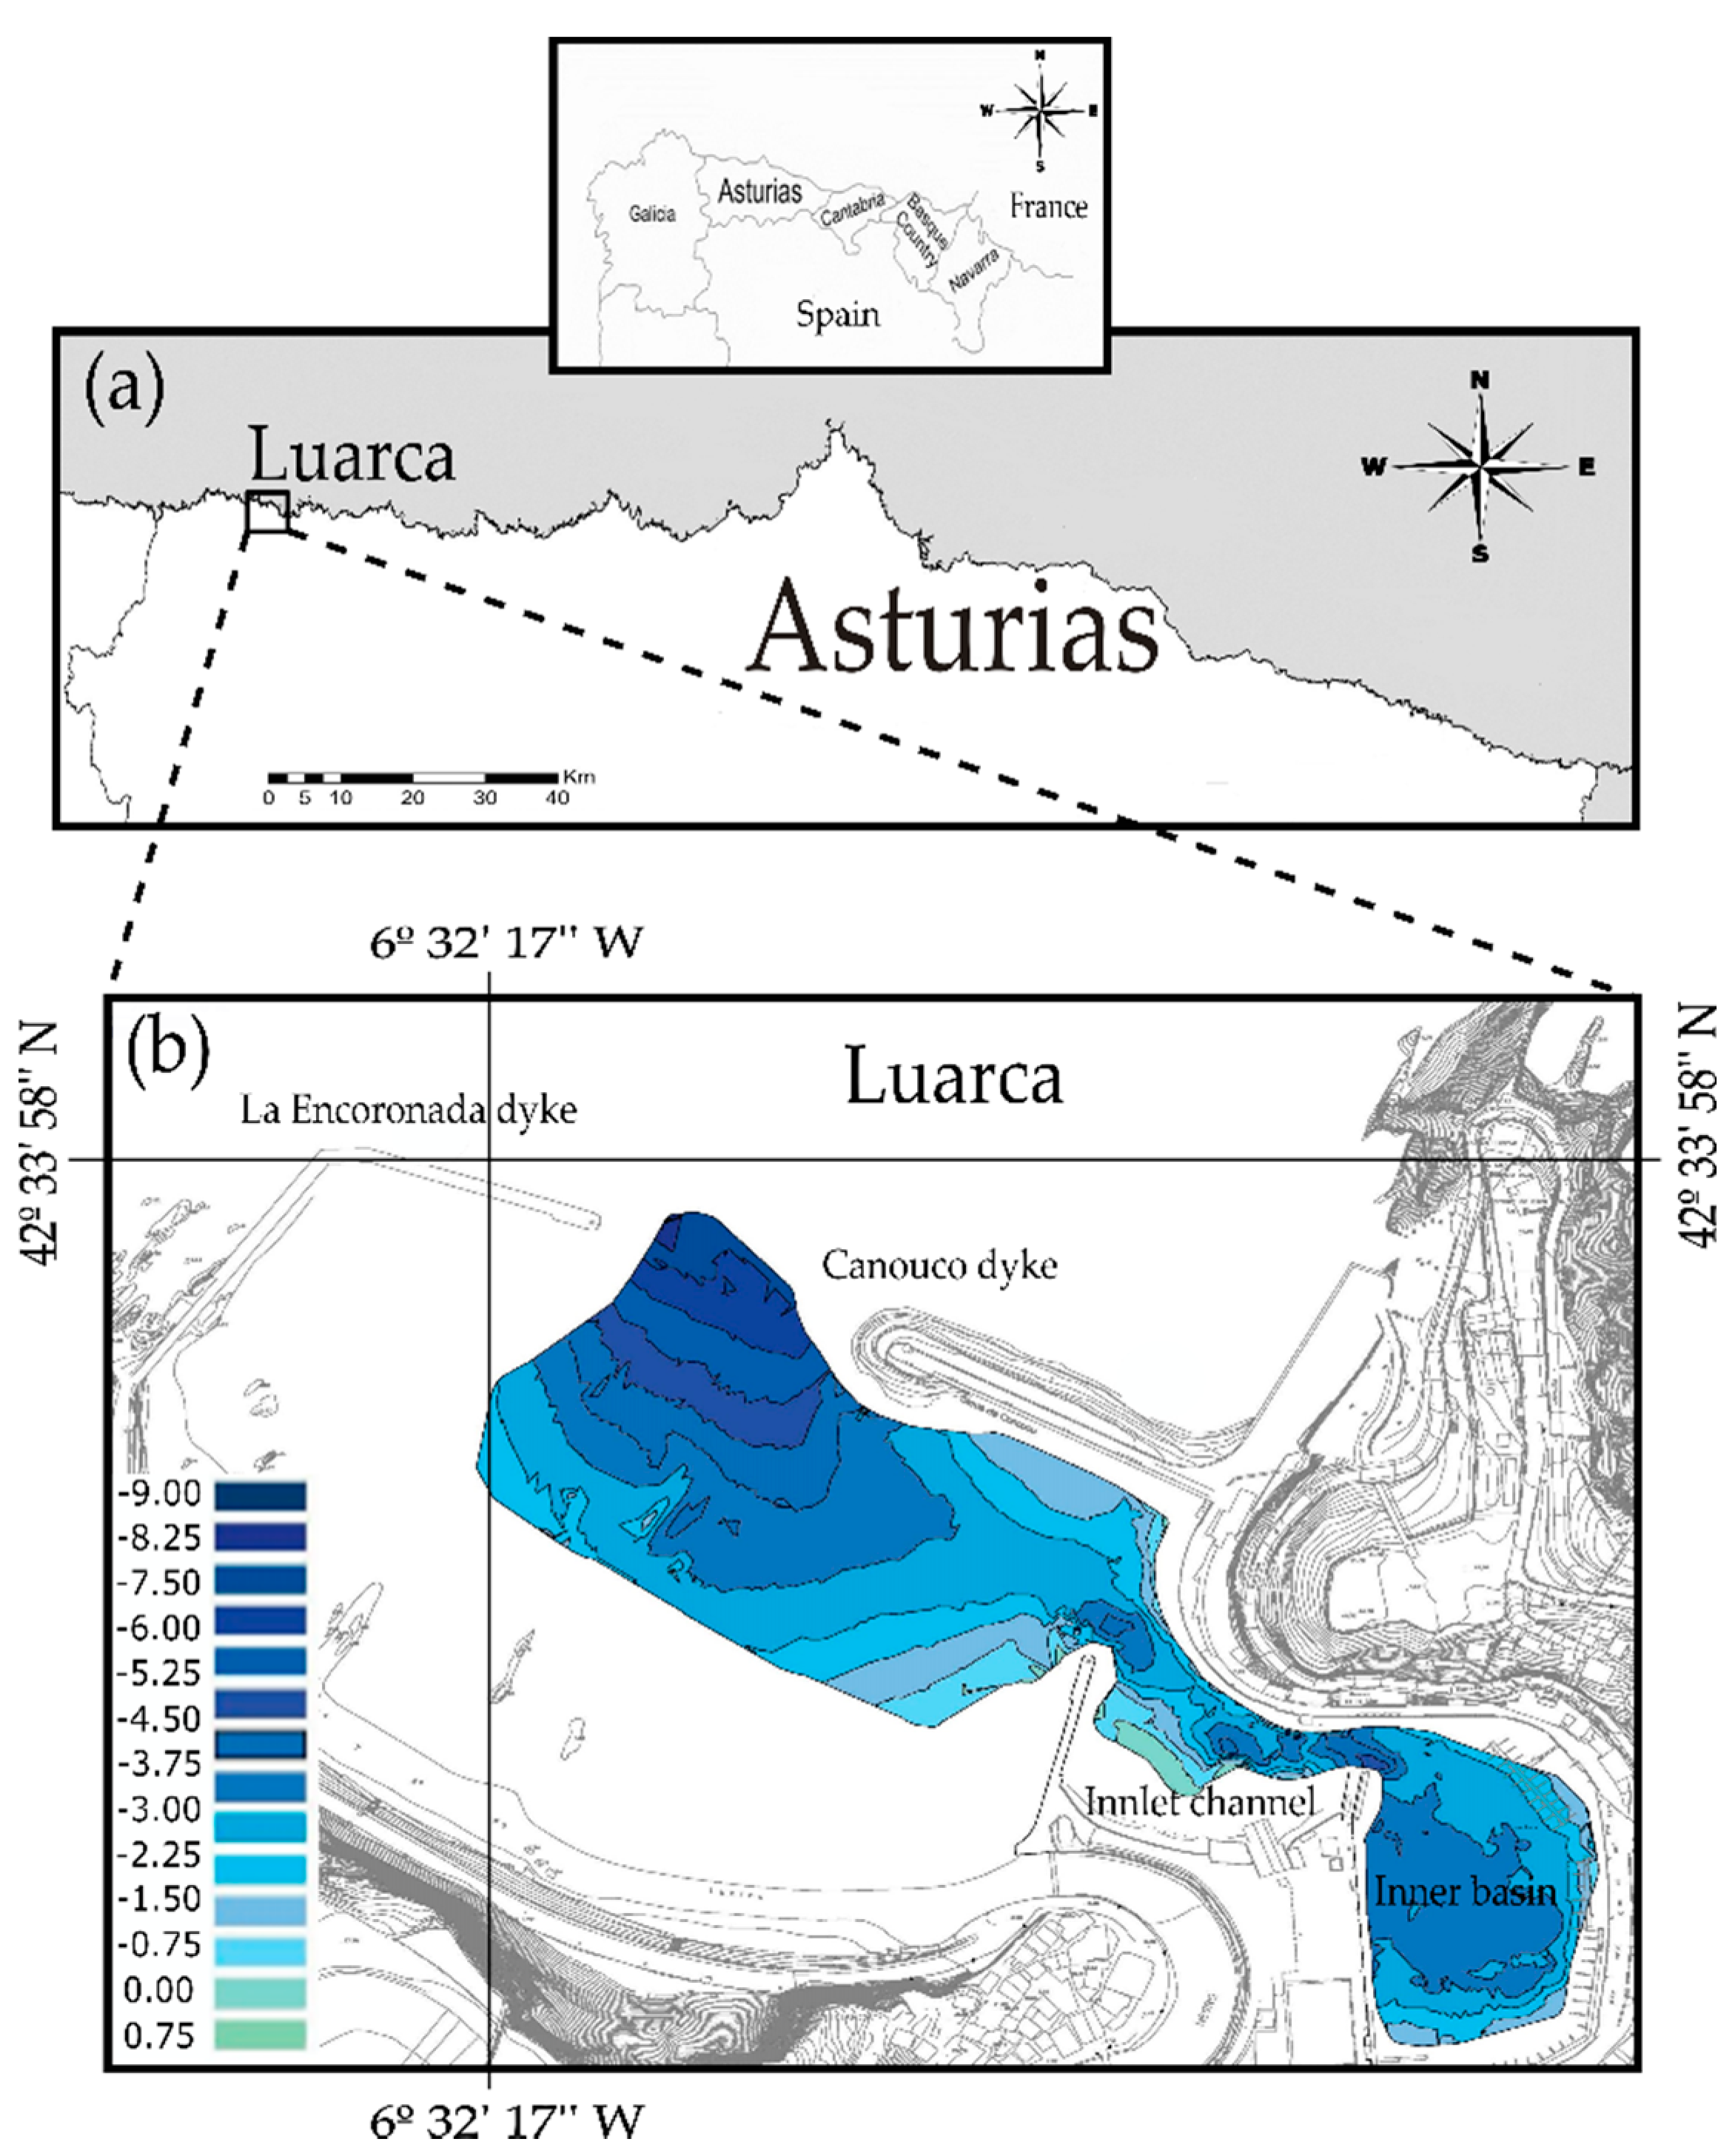
2. Study Site
3. Data and Methodology
3.1. Data In Situ Measurements and Satellite Data
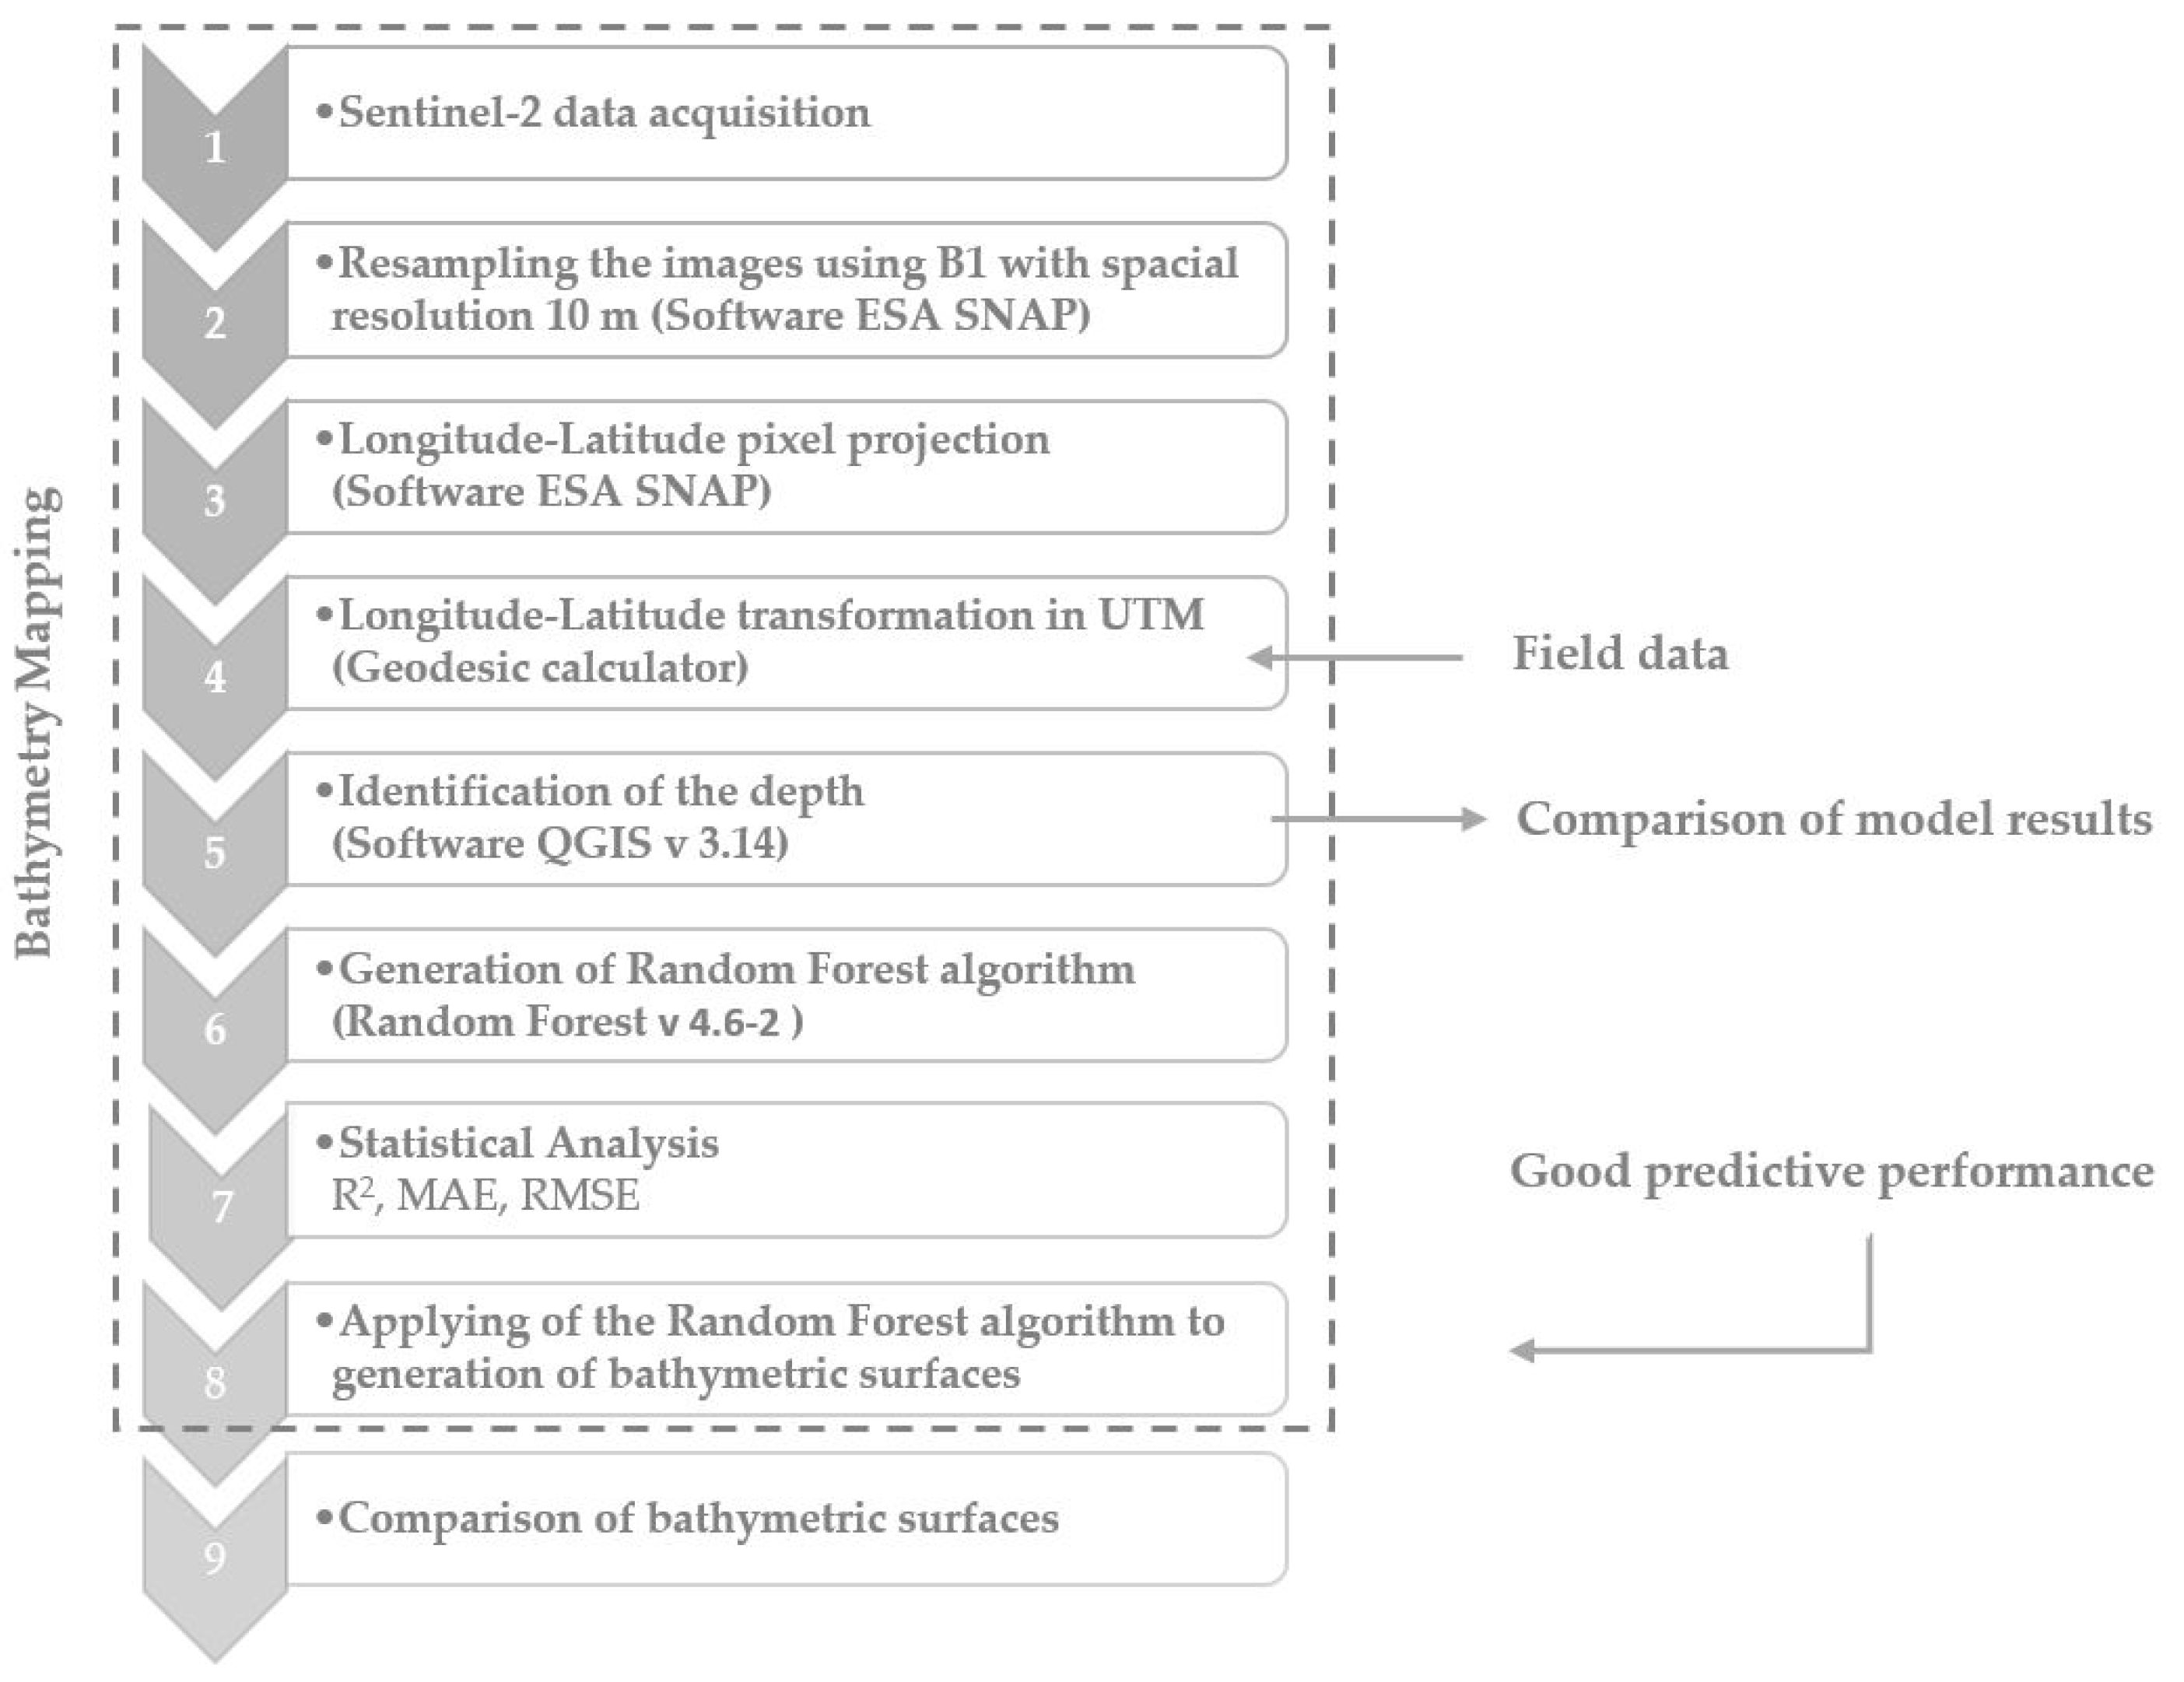
3.2. Methodology
3.2.1. Processing Satellite Images
3.2.2. The Random Forest Algorithm
3.2.3. Training and Testing Dataset
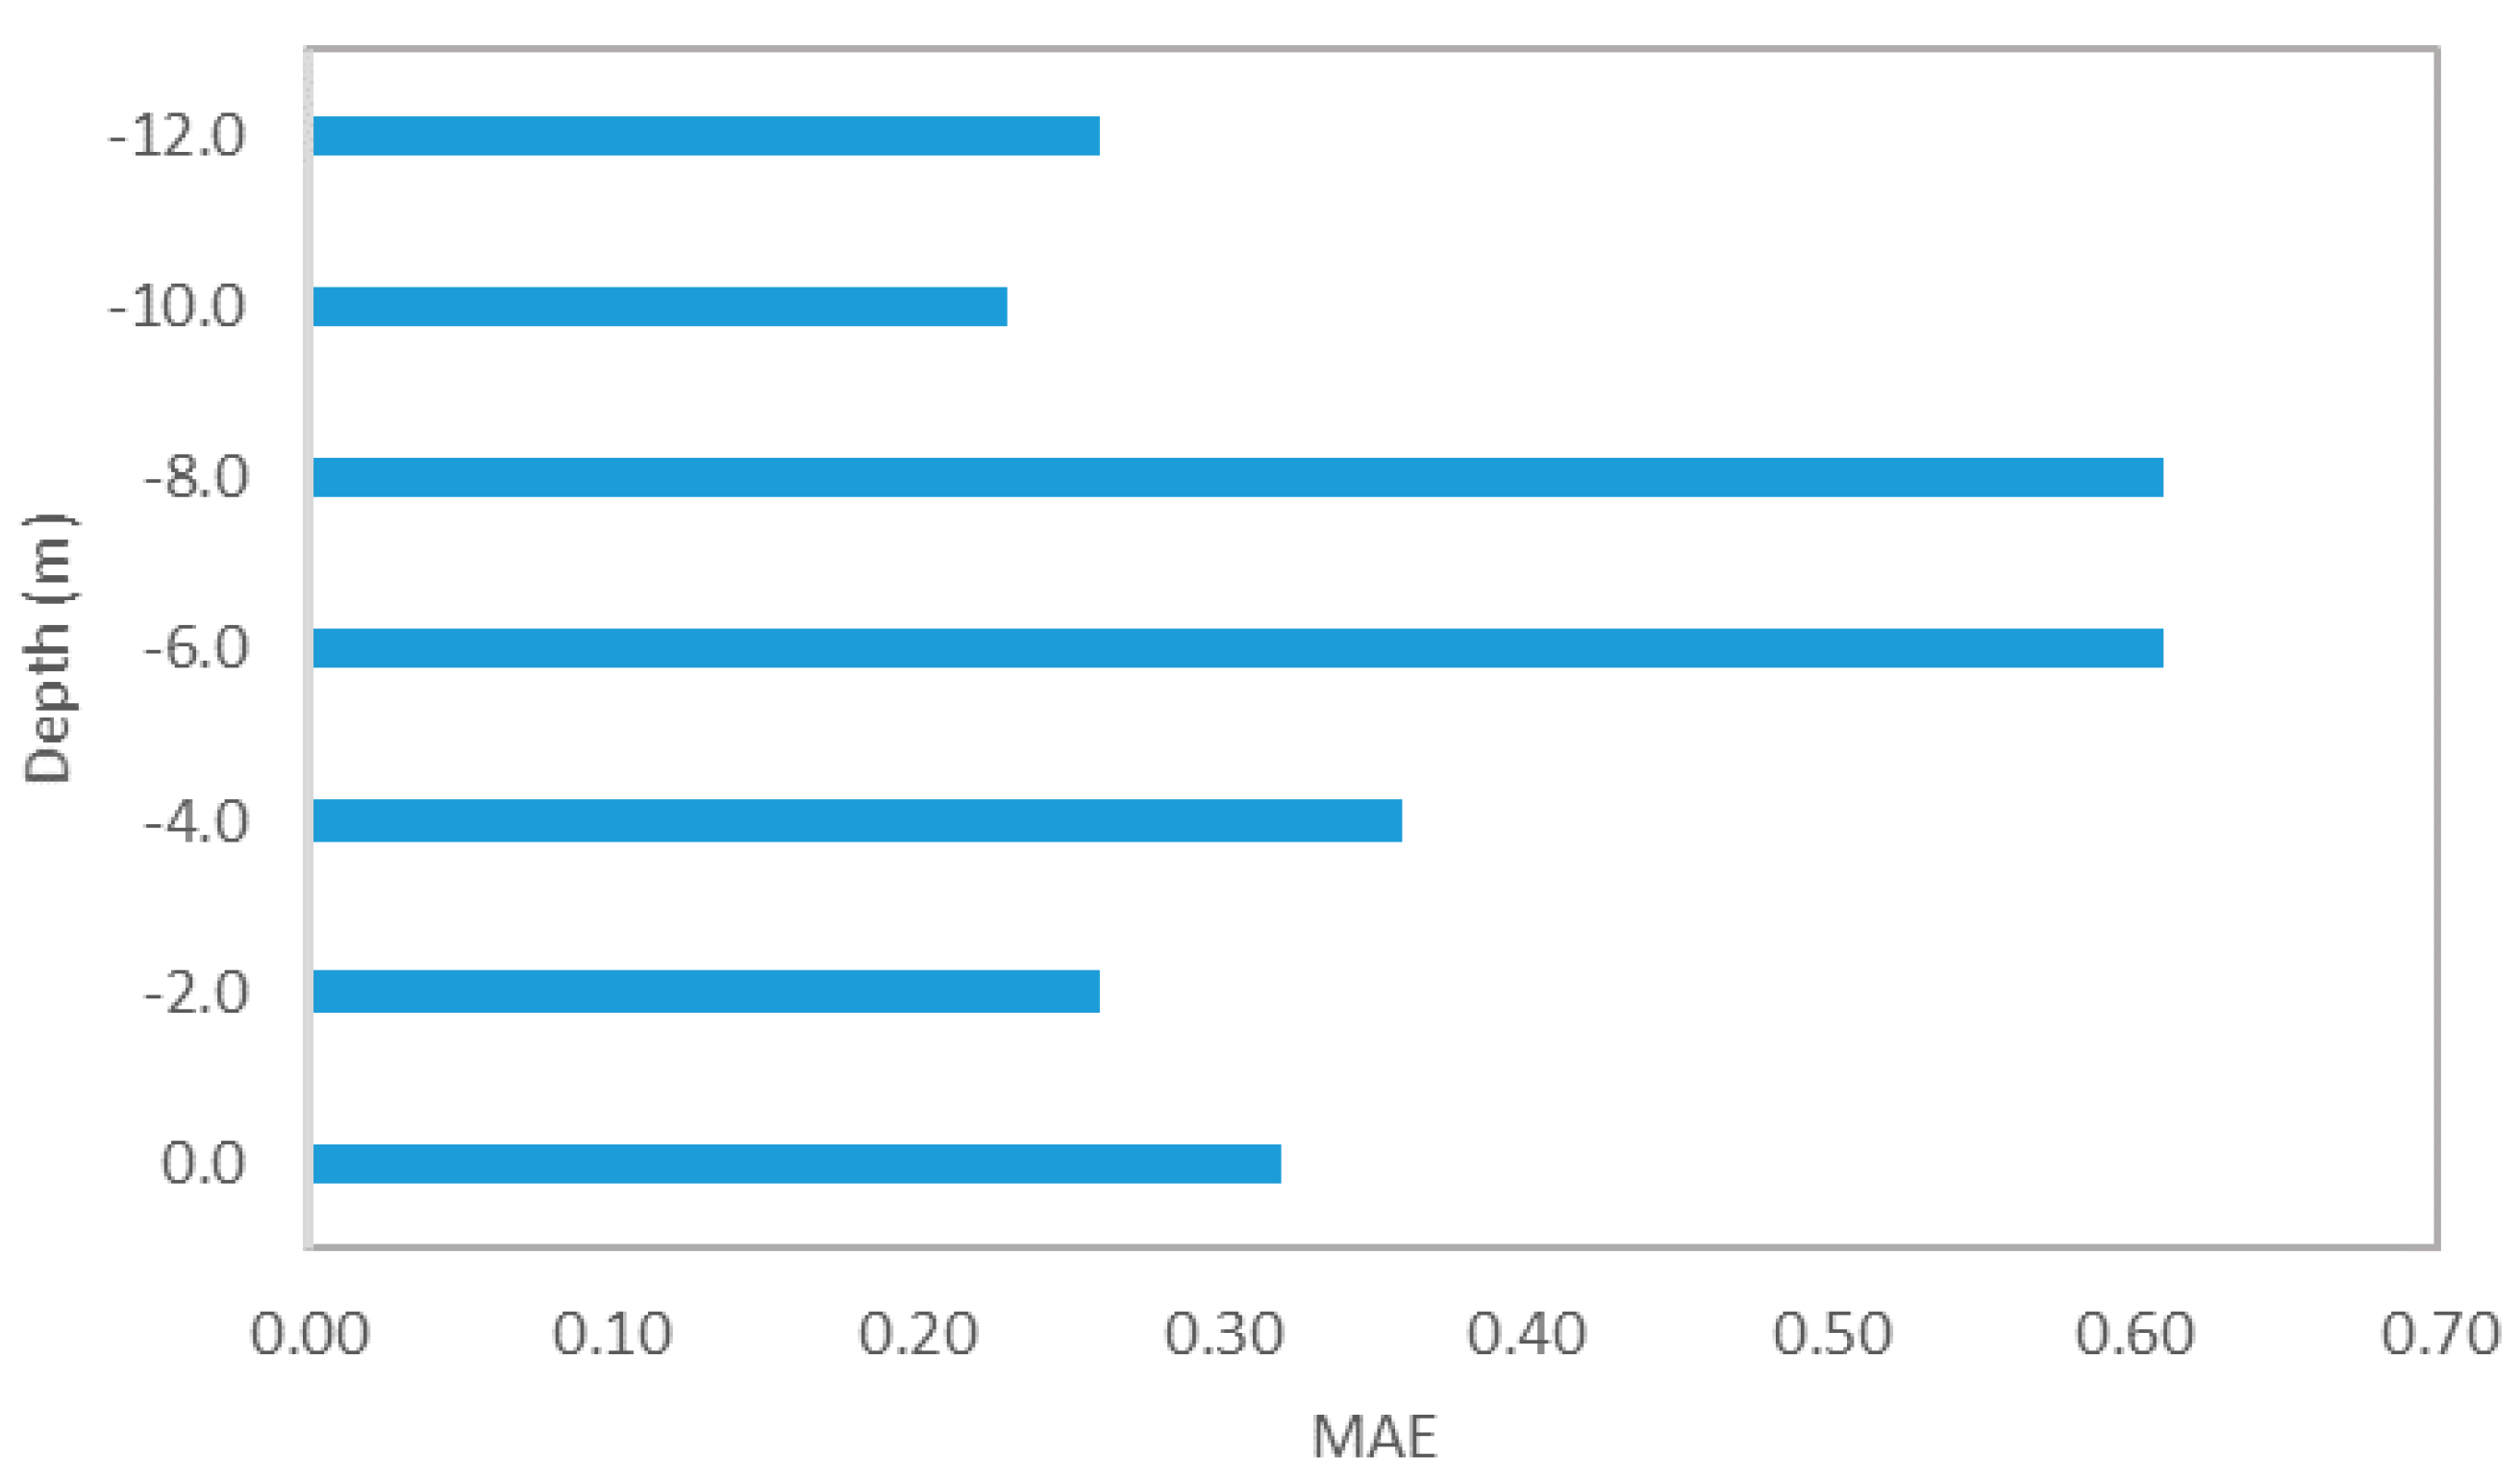
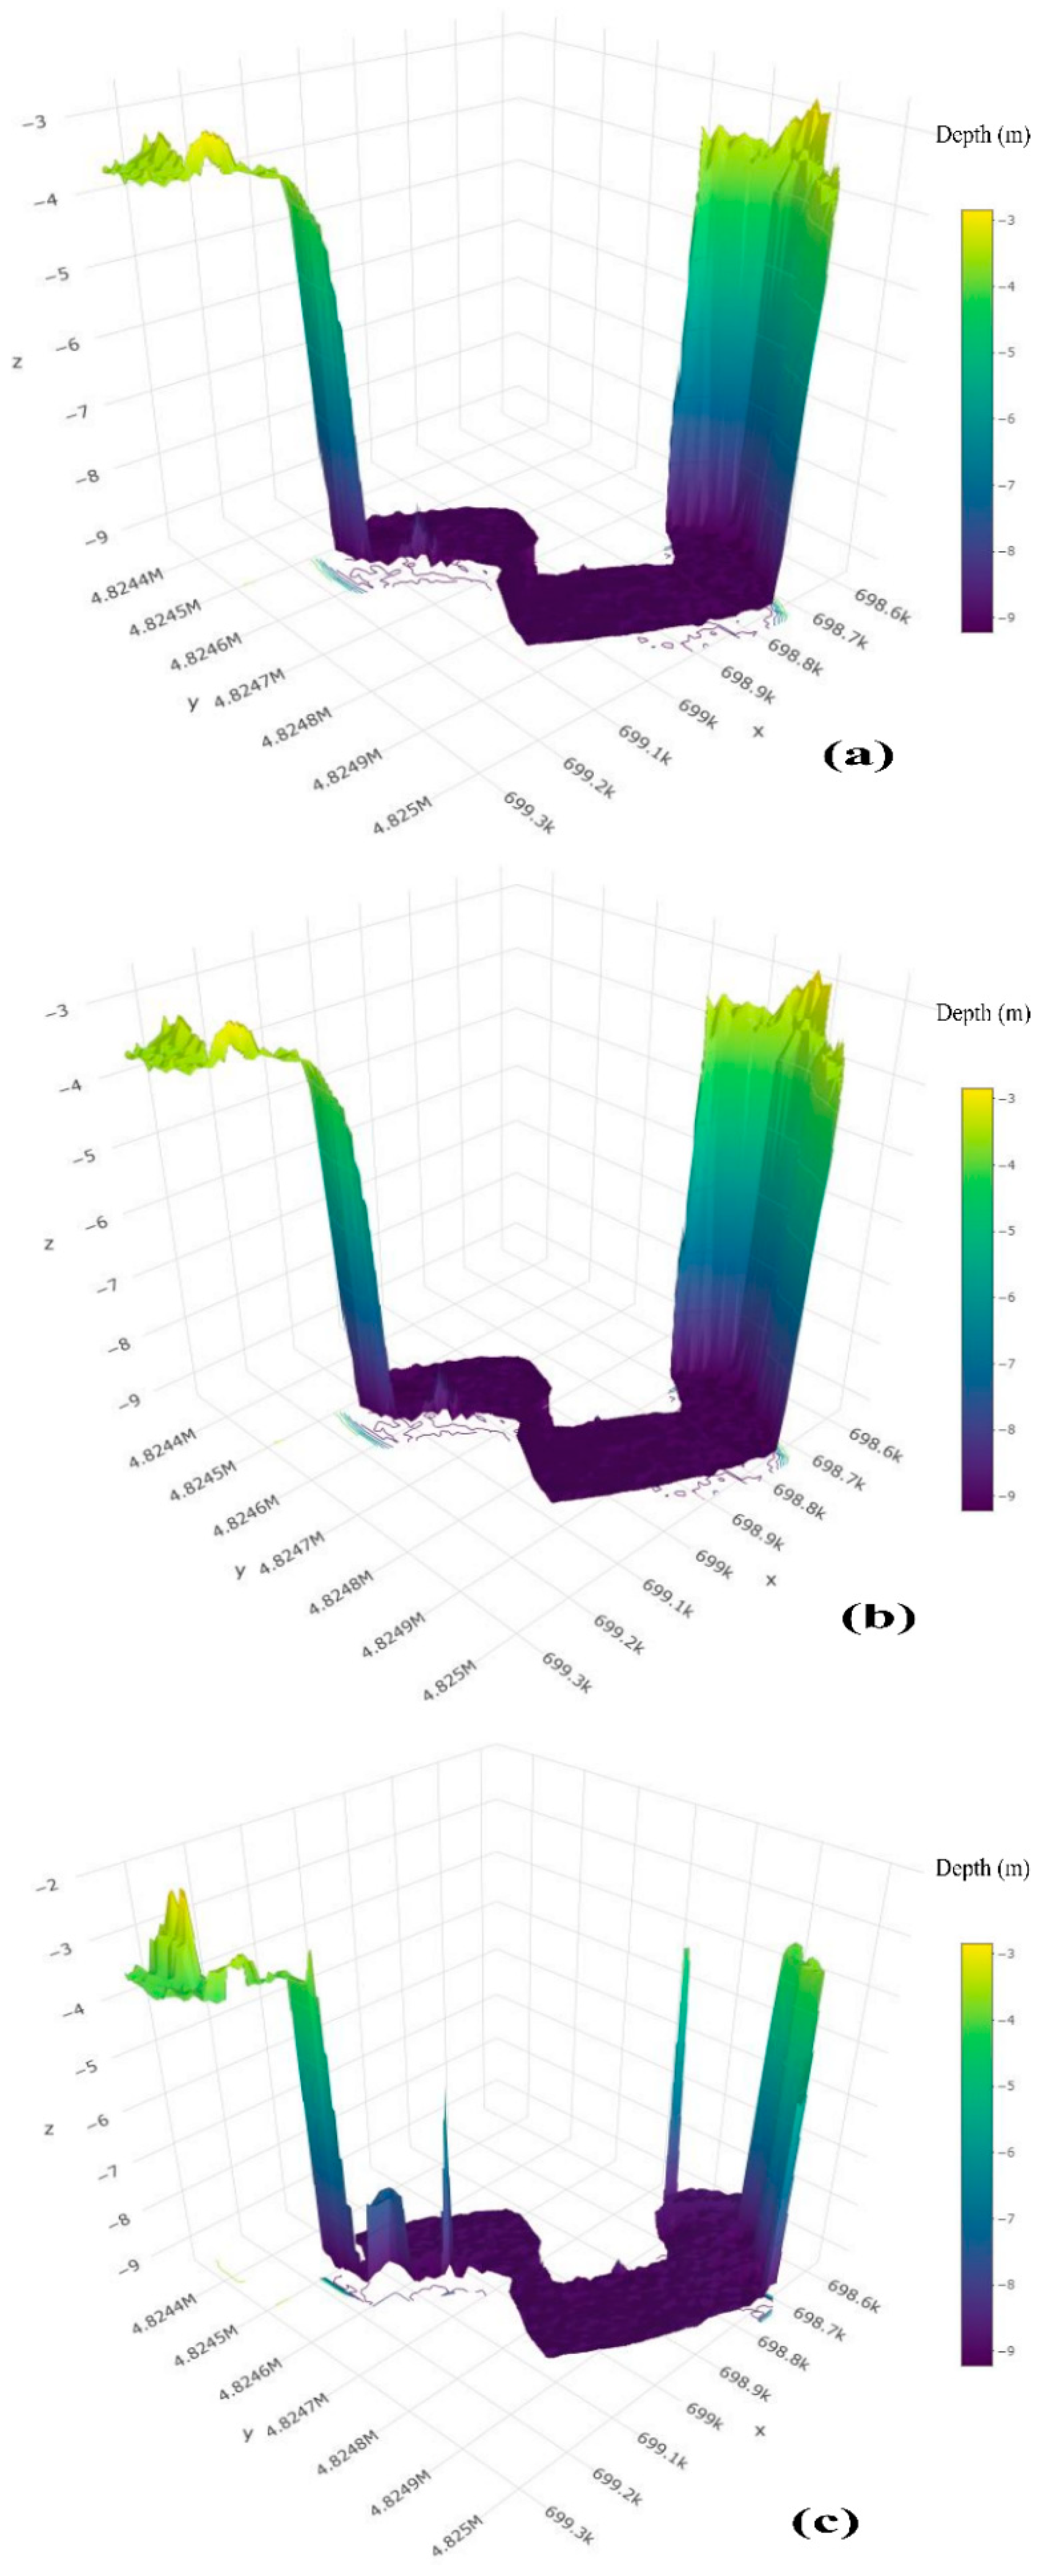
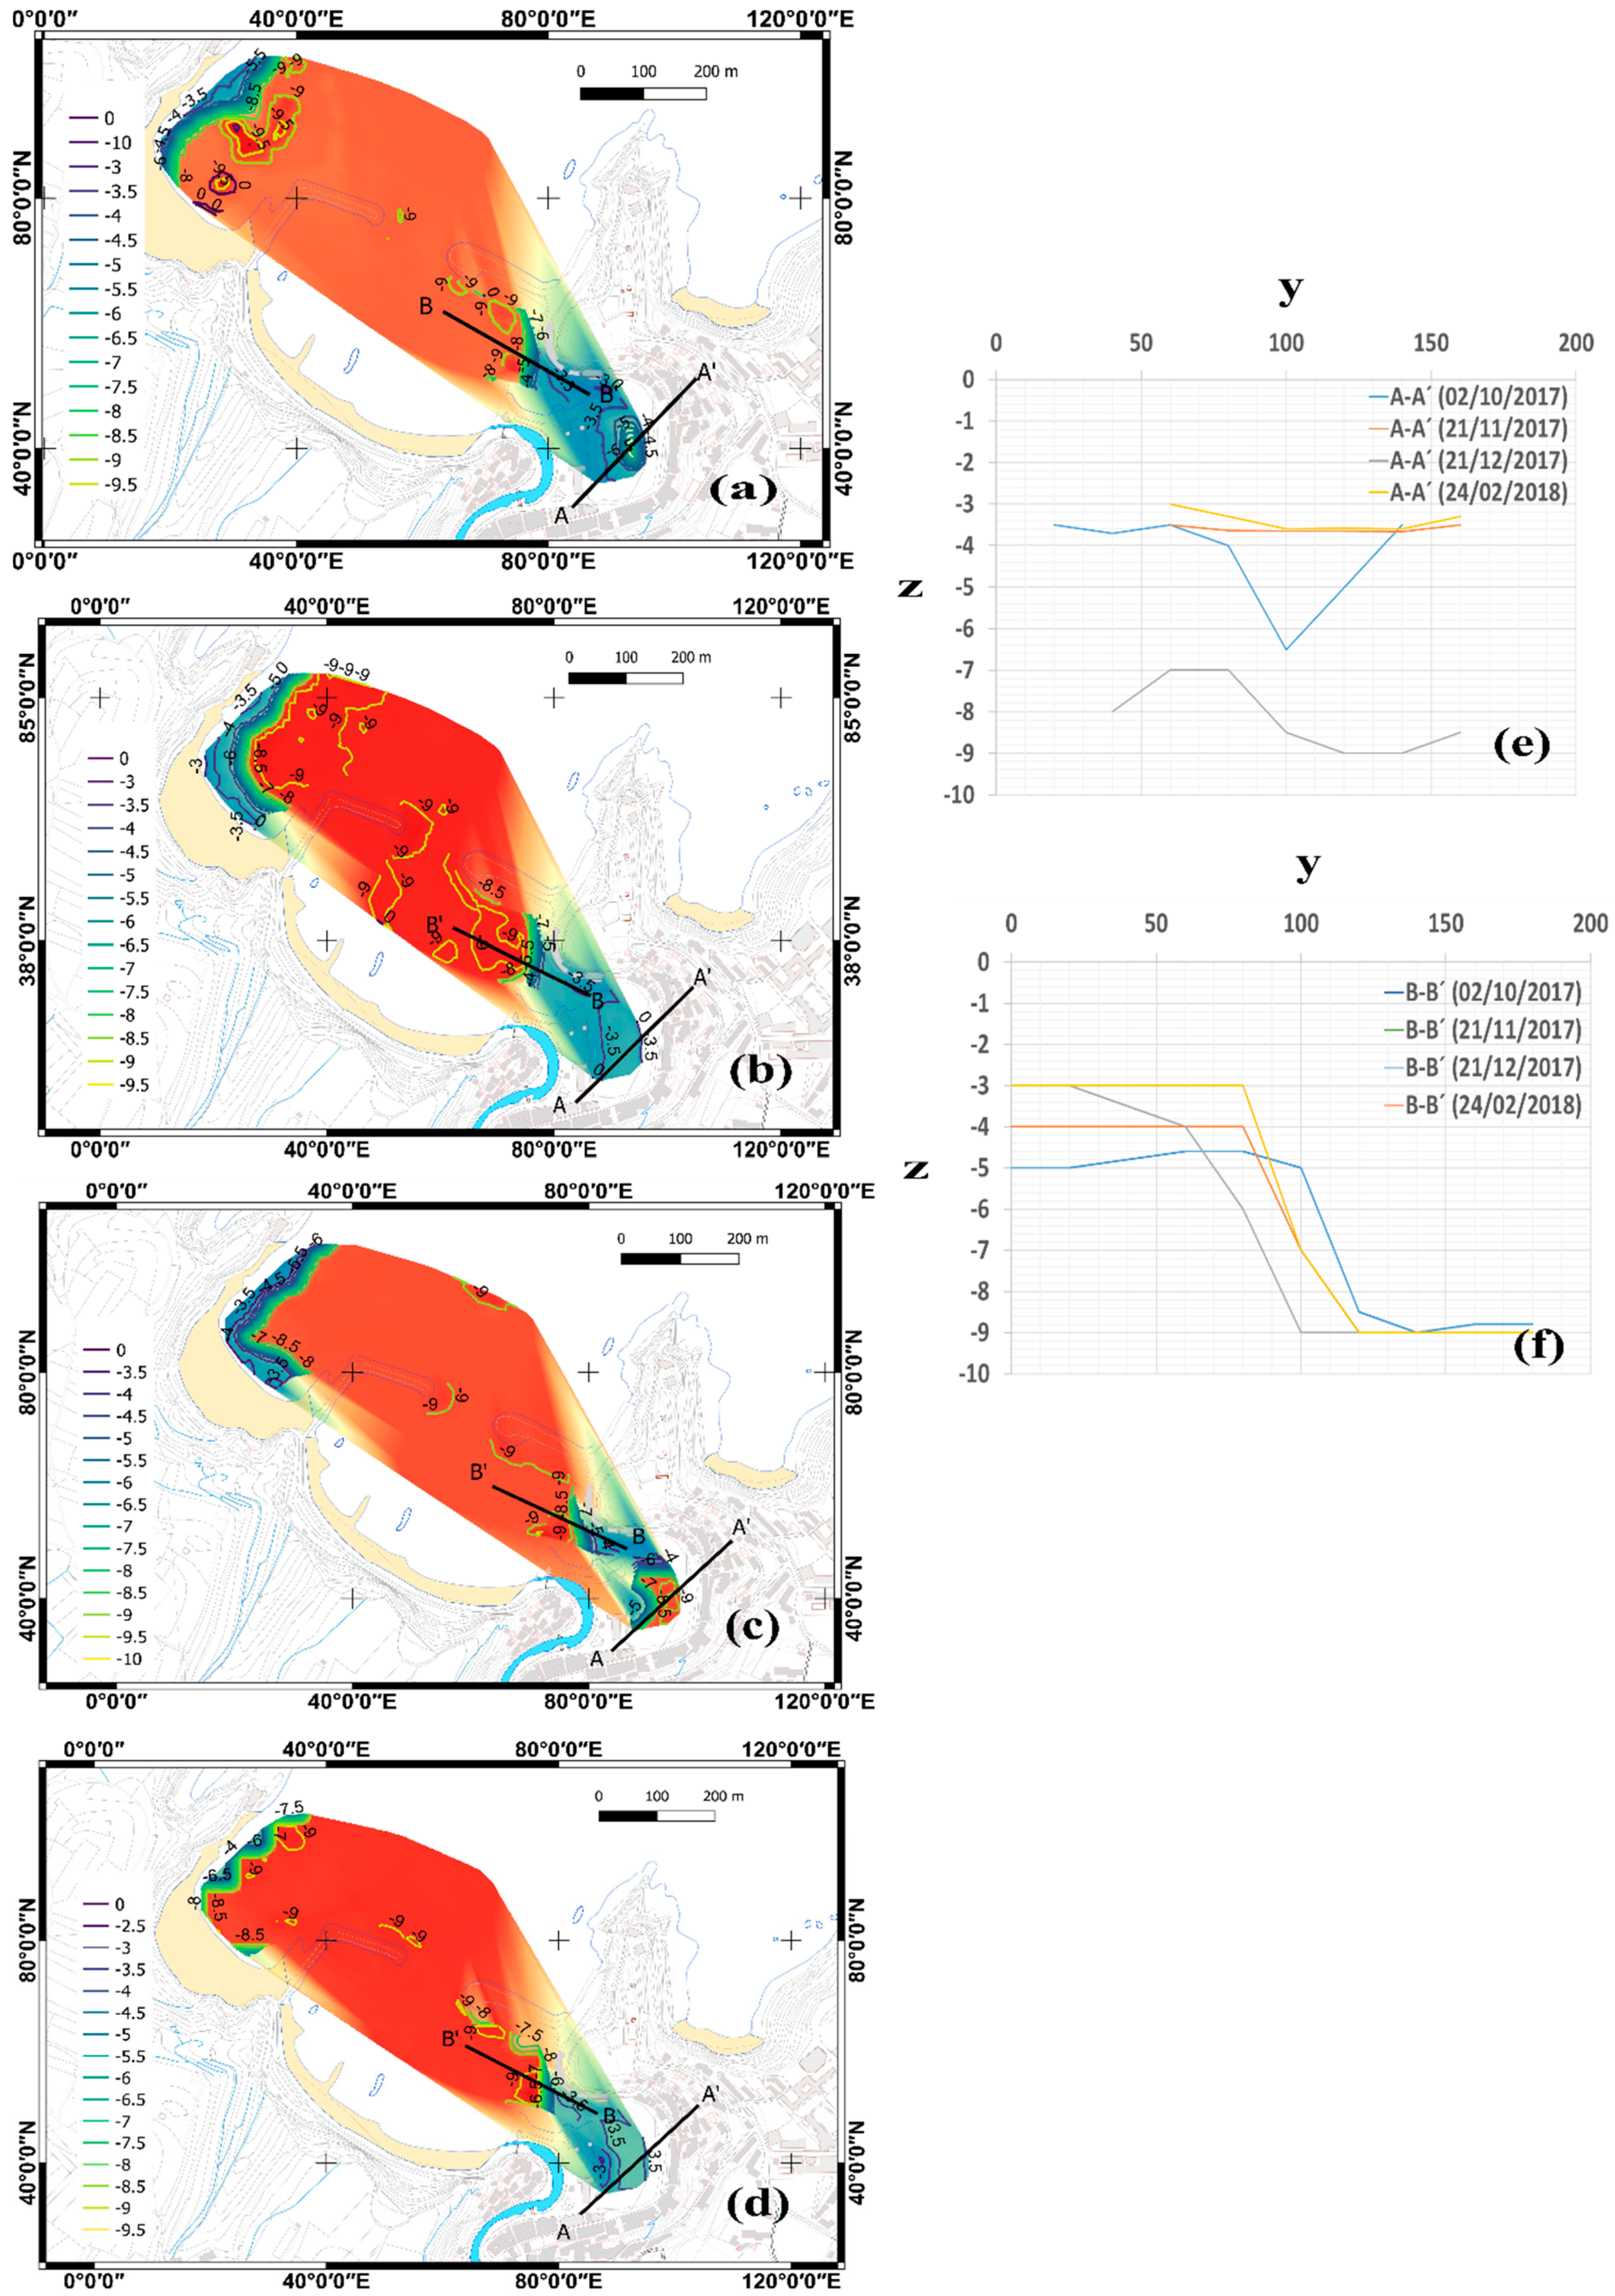
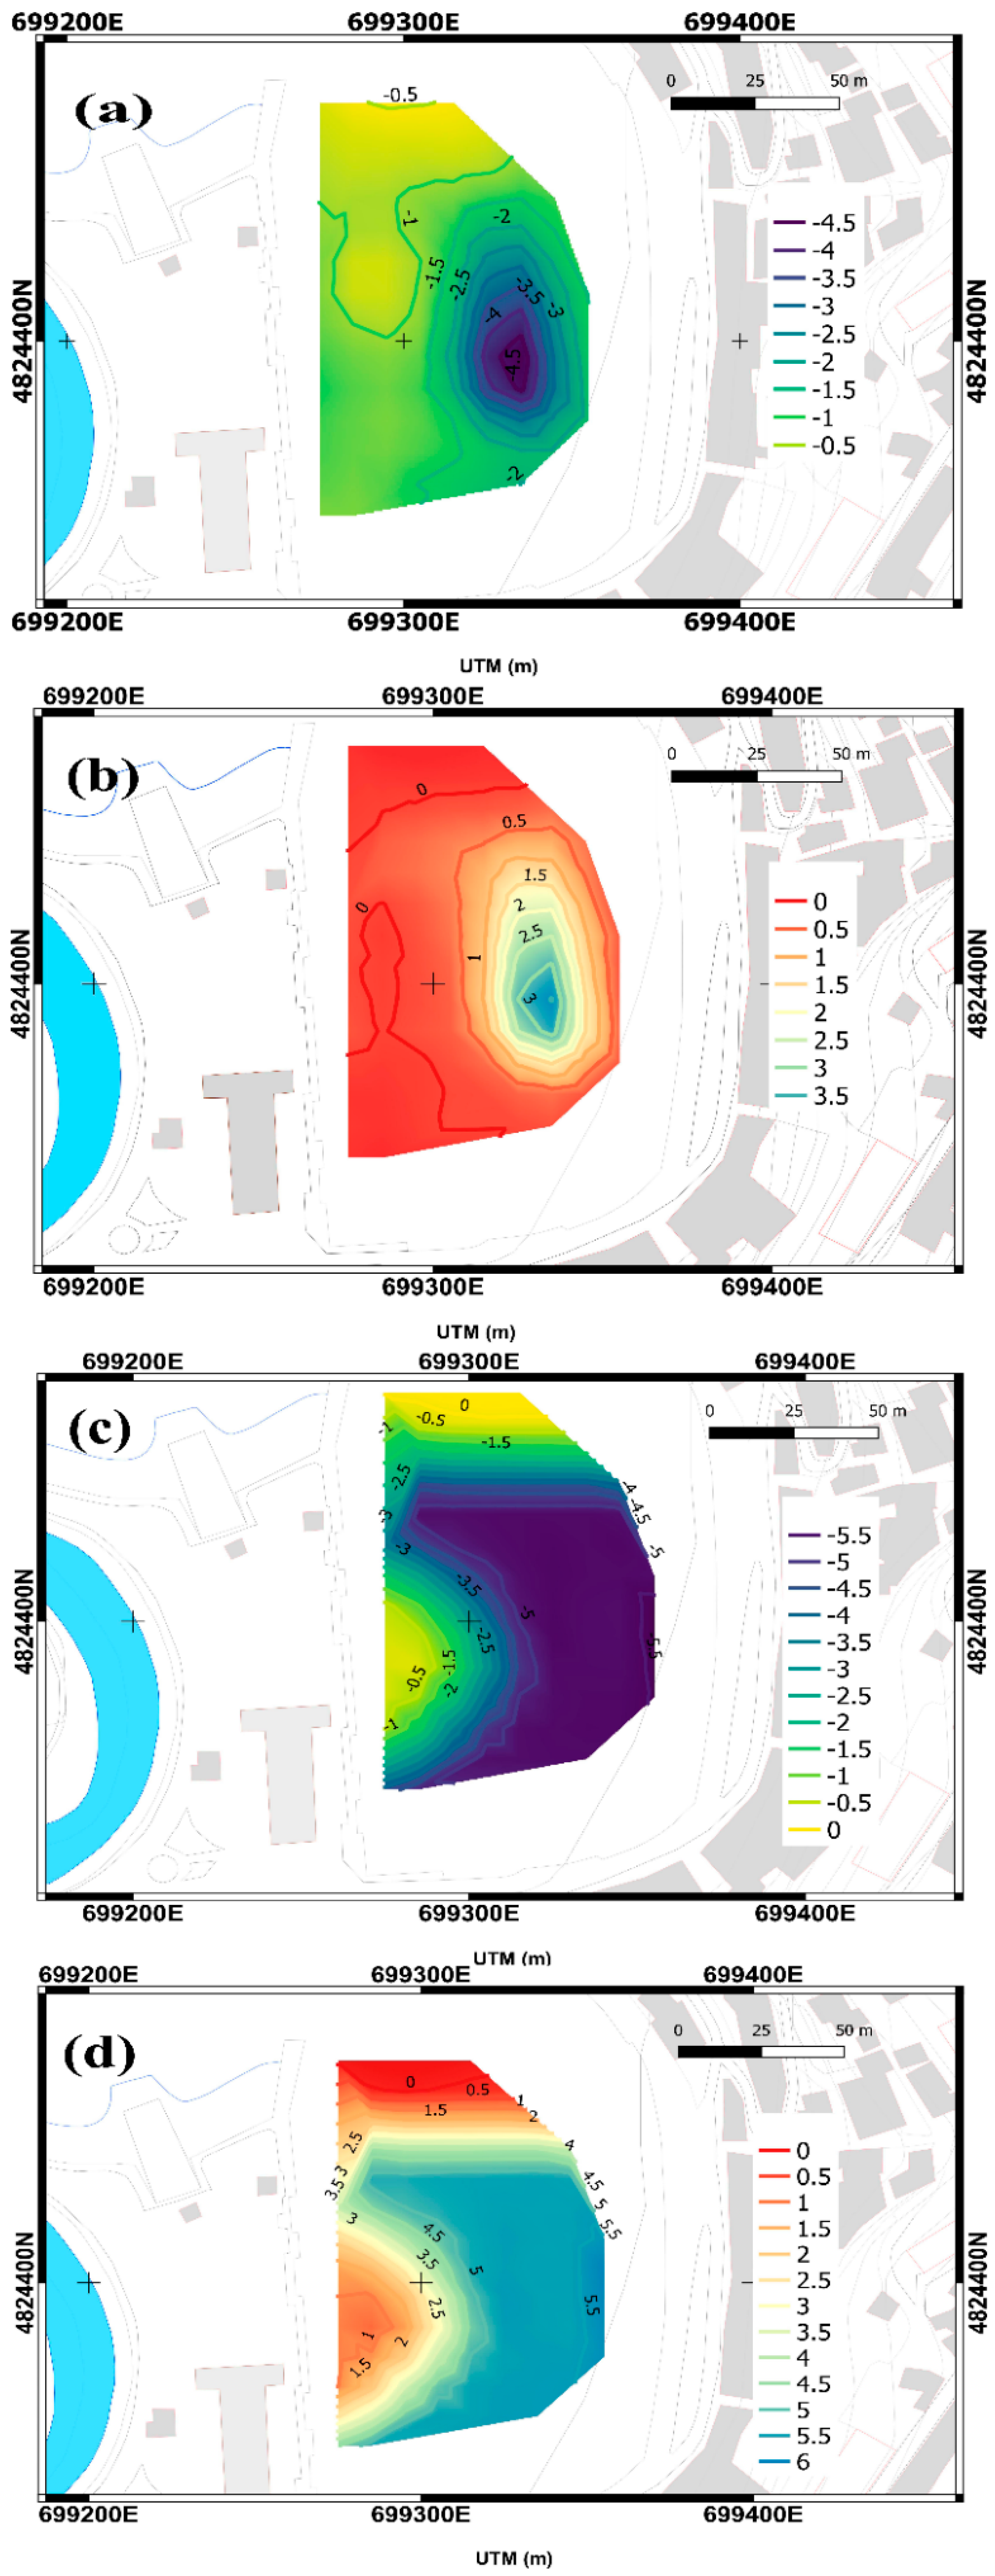
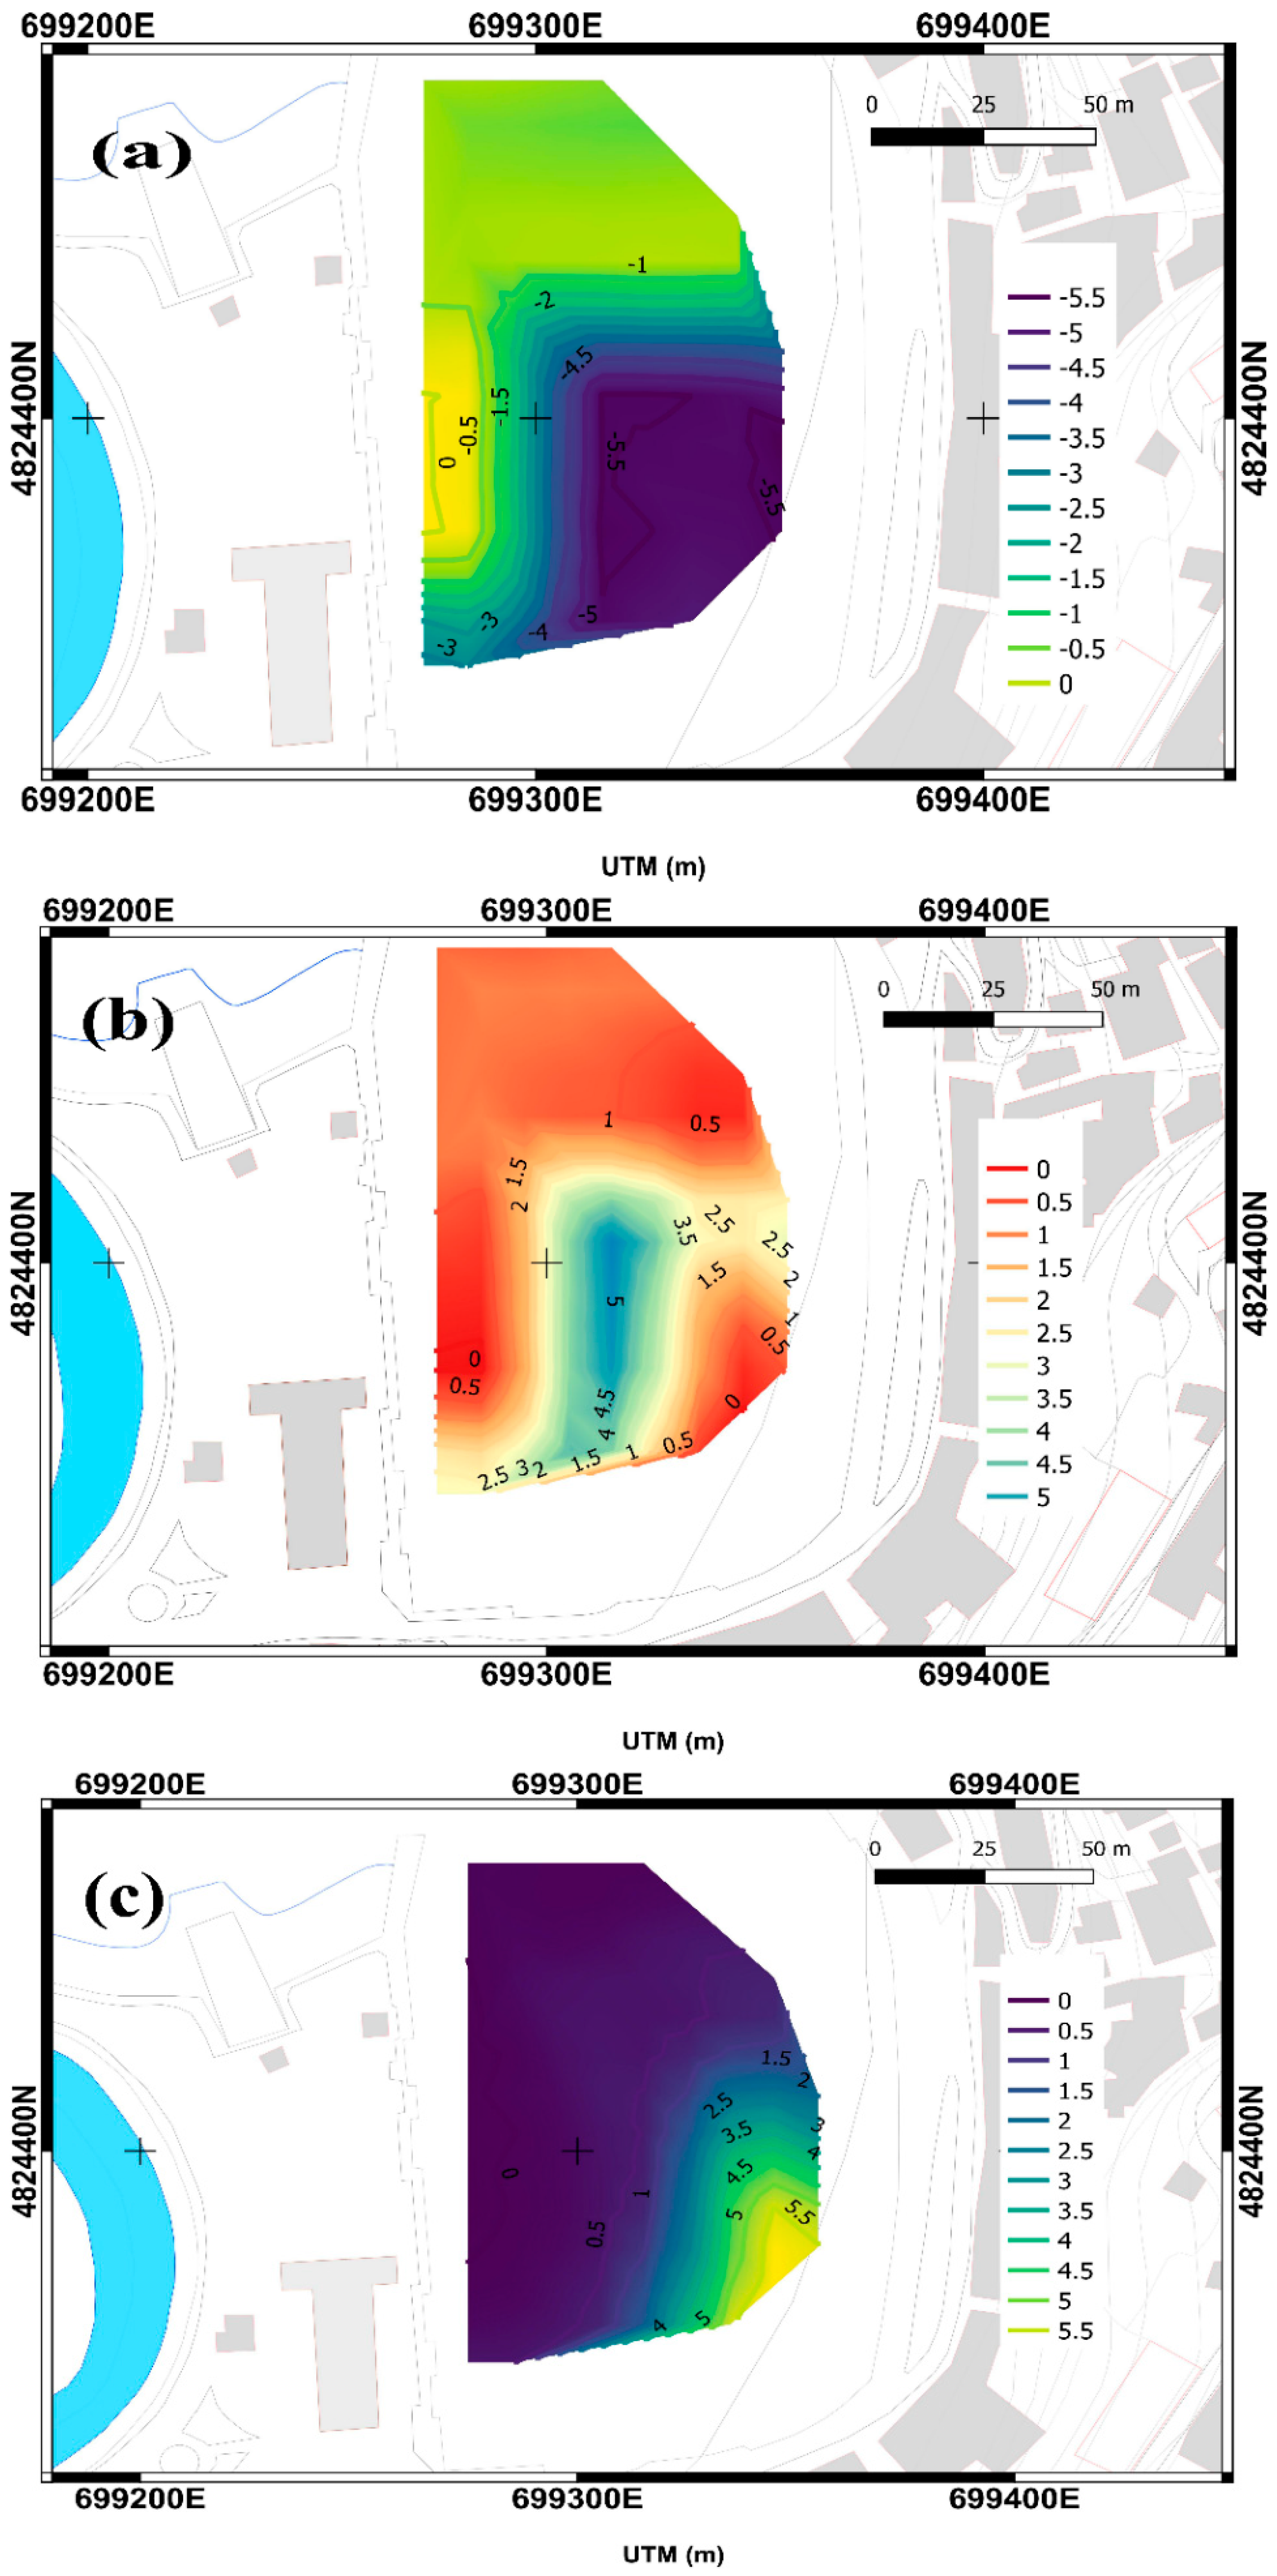
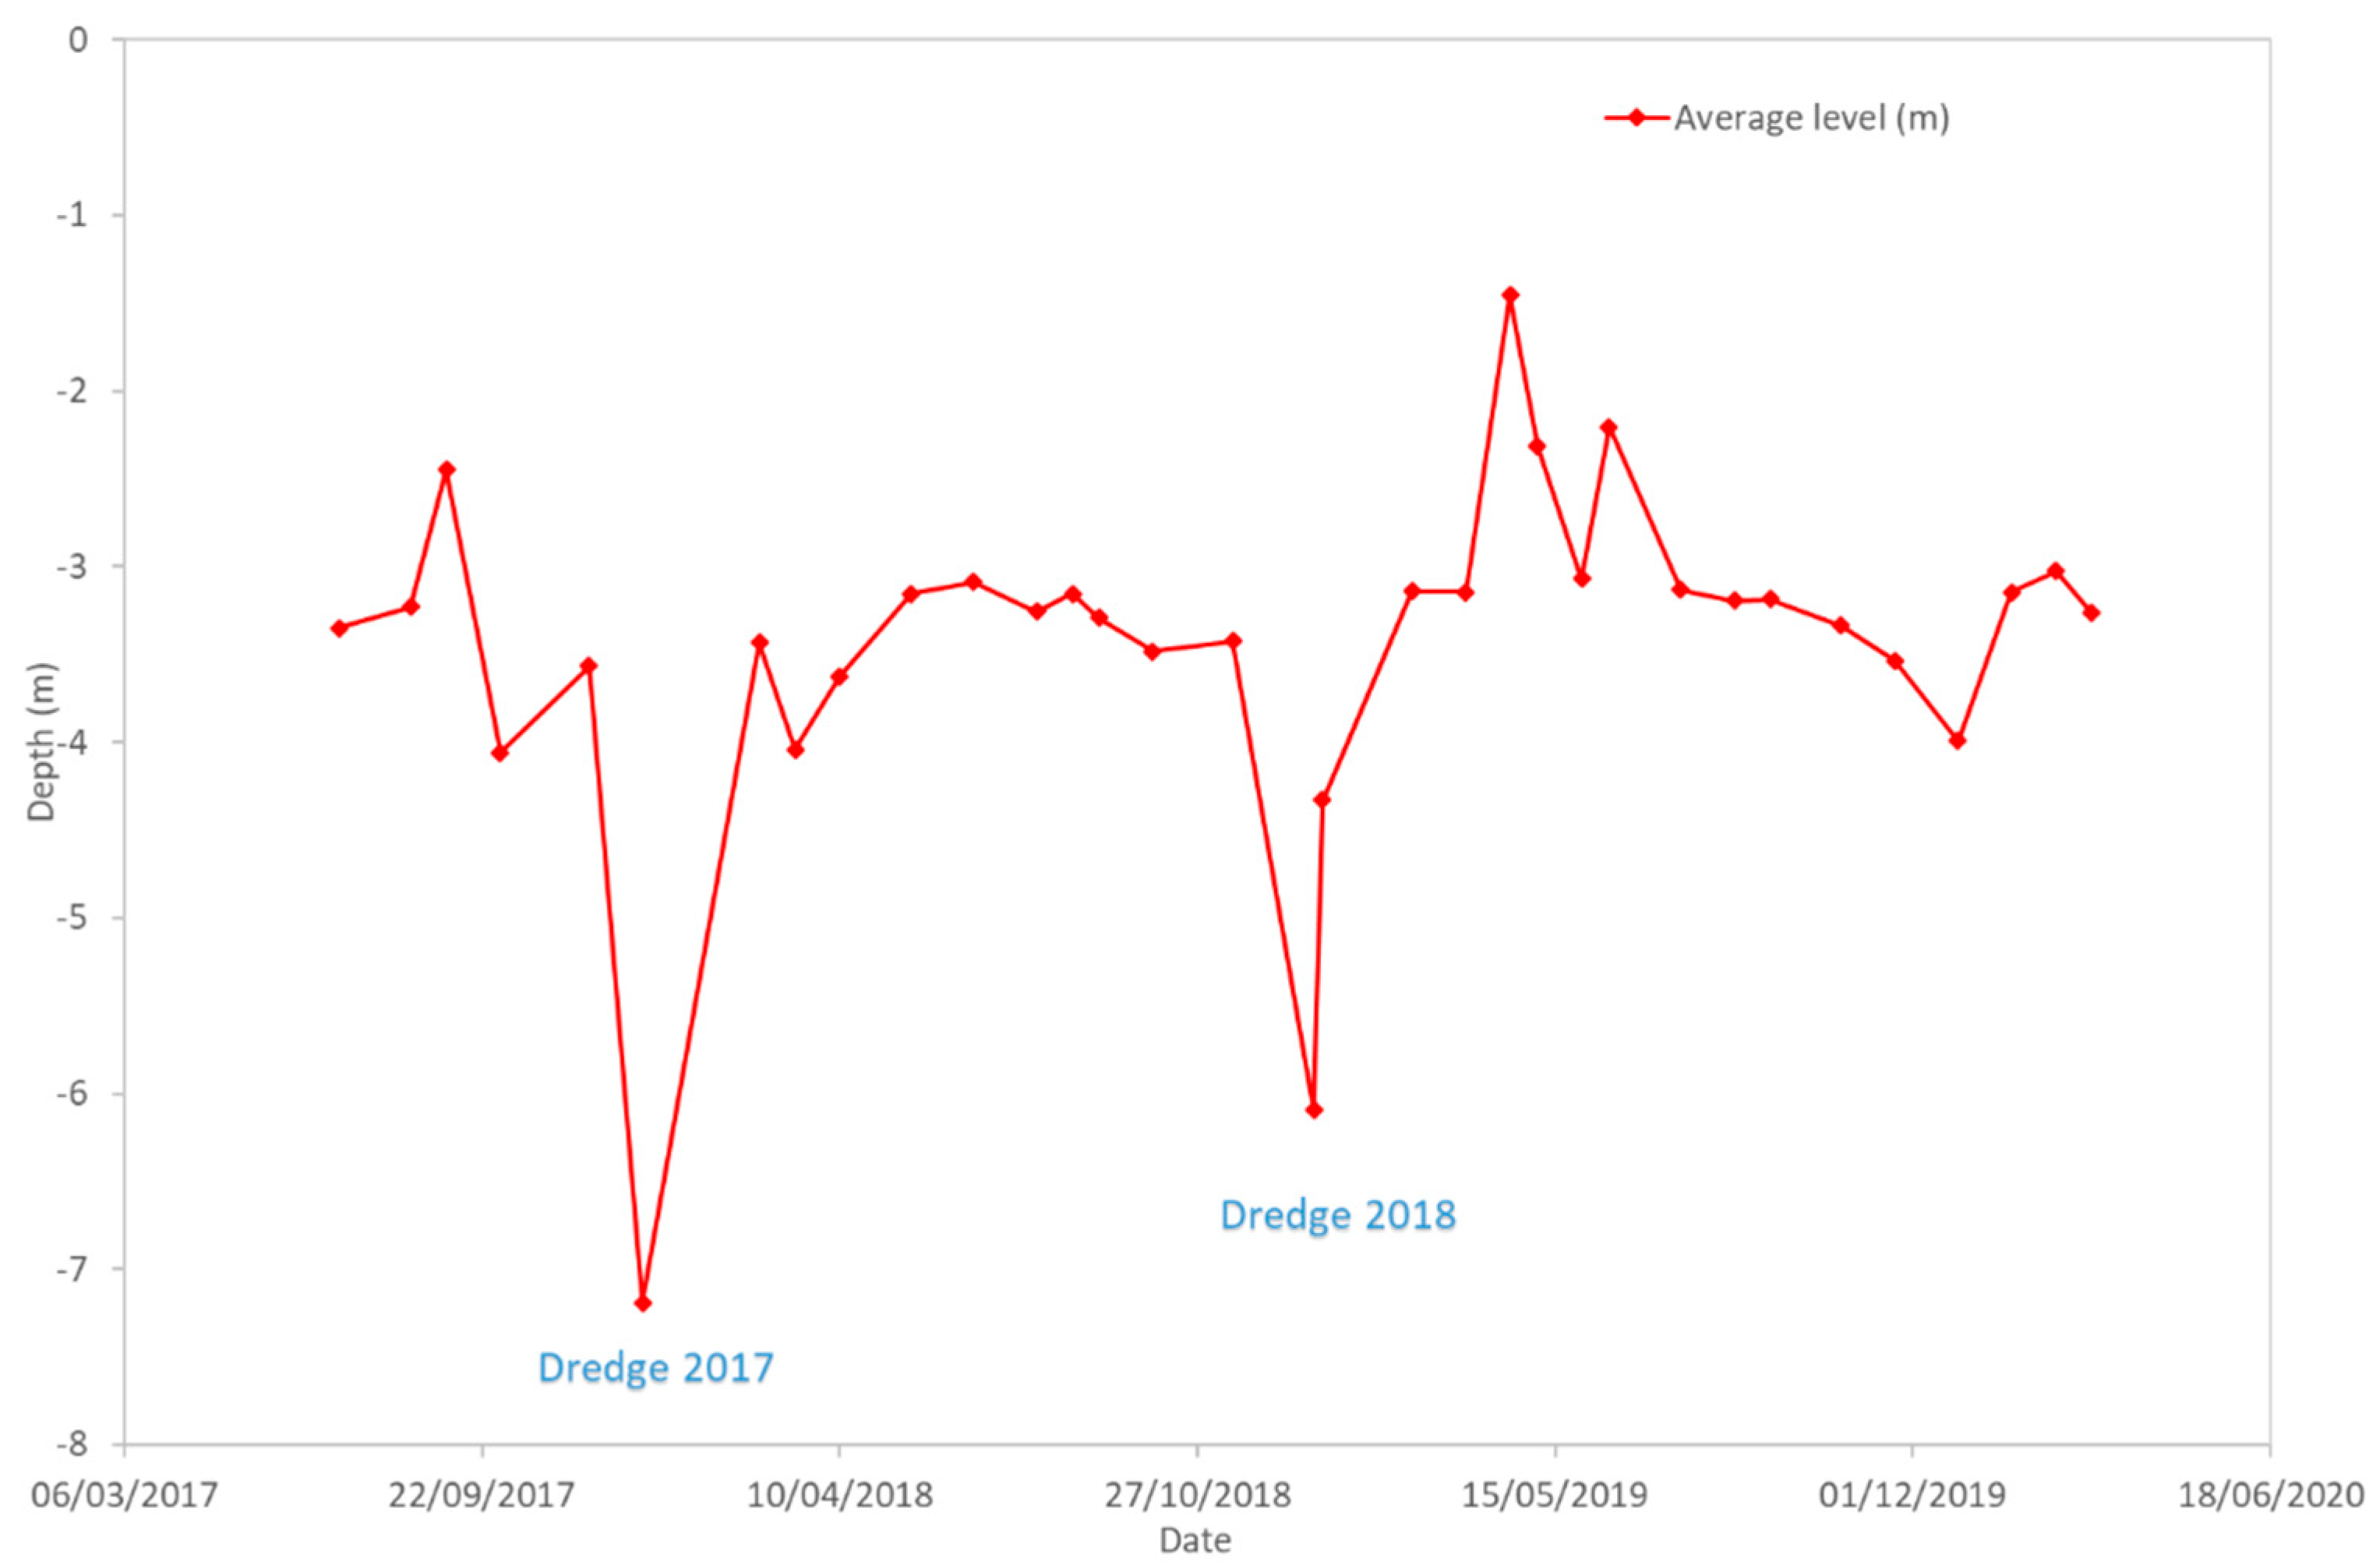
4. Results
5. Conclusions and Discussion
Author Contributions
Funding
Institutional Review Board Statement
Informed Consent Statement
Acknowledgments
Conflicts of Interest
References
- Quang Tri, D.; Kandasamy, J.; Cao Don, N. Quantitative Assessment of the Environmental Impacts of Dredging and Dumping Activities at Sea. Appl. Sci. 2019, 9, 1703. [Google Scholar] [CrossRef]
- Bolam, S.G.; Rees, H.L. Minimizing Impacts of Maintenance Dredged Material Disposal in the Coastal Environment: A Habitat Approach. Environ. Manag. 2003, 32, 171–188. [Google Scholar] [CrossRef]
- Norén, A.; Fedje, K.K.; Strömvall, A.-M.; Rauch, S.; Andersson-Sköld, Y. Integrated Assessment of Management Strategies for Metal-Contaminated Dredged Sediments—What Are the Best Approaches for Ports, Marinas and Waterways? Sci. Total Environ. 2020, 716, 135510. [Google Scholar] [CrossRef]
- Wang, W.; Men, C.; Lu, W. Online Prediction Model Based on Support Vector Machine. Neurocomputing 2008, 71, 550–558. [Google Scholar] [CrossRef]
- Khorram, S.; Khalegh, M.A. A Novel Hybrid MCDM Approach to Evaluate Ports’ Dredging Project Criteria Based on Intuitionistic Fuzzy DEMATEL and GOWPA. WMU J. Marit. Aff. 2020, 19, 95–124. [Google Scholar] [CrossRef]
- Cáceres, R.A.; Zyserman, J.A.; Perillo, G.M.E. Analysis of Sedimentation Problems at the Entrance to Mar Del Plata Harbor. J. Coast. Res. 2016, 32, 301–314. [Google Scholar] [CrossRef]
- Feola, A.; Lisi, I.; Salmeri, A.; Venti, F.; Pedroncini, A.; Gabellini, M.; Romano, E. Platform of Integrated Tools to Support Environmental Studies and Management of Dredging Activities. J. Environ. Manag. 2016, 166, 357–373. [Google Scholar] [CrossRef]
- Mahmoodi, A.; Lashteh Neshaei, M.A.; Mansouri, A.; Shafai Bejestan, M. Study of Current- and Wave-Induced Sediment Transport in the Nowshahr Port Entrance Channel by Using Numerical Modeling and Field Measurements. J. Mar. Sci. Eng. 2020, 8, 284. [Google Scholar] [CrossRef]
- Chen, B.; Wang, K. Suspended Sediment Transport in the Offshore near Yangtze Estuary* *Project Supported by the National Natural Science Foundation of China (Grant No.40576017), the National Basic Research Program of China (973, Program, Grant No. 2007CB411804). J. Hydrodyn. Ser. B 2008, 20, 373–381. [Google Scholar] [CrossRef]
- Zuo, S.; Xie, H.; Ying, X.; Cui, C.; Huang, Y.; Li, H.; Xie, M. Seabed Deposition and Erosion Change and Influence Factors in the Yangshan Deepwater Port over the Years. Acta Oceanol. Sin. 2019, 38, 96–106. [Google Scholar] [CrossRef]
- Erftemeijer, P.L.A.; Robin Lewis, R.R. Environmental Impacts of Dredging on Seagrasses: A Review. Mar. Pollut. Bull. 2006, 52, 1553–1572. [Google Scholar] [CrossRef]
- Flor, G.; del Busto, J.A.; Blanco, G.F. Morphological and Sedimentary Patterns of Ports of the Asturian Region (NW Spain). J. Coast. Res. 2006, 48, 35–40. [Google Scholar]
- Stock, F.; Knipping, M.; Pint, A.; Ladstätter, S.; Delile, H.; Heiss, A.G.; Laermanns, H.; Mitchell, P.D.; Ployer, R.; Steskal, M.; et al. Human Impact on Holocene Sediment Dynamics in the Eastern Mediterranean—the Example of the Roman Harbour of Ephesus. Earth Surf. Process. Landf. 2016, 41, 980–996. [Google Scholar] [CrossRef]
- Sharaan, M.; Ibrahim, M.G.; Iskander, M.; Masria, A.; Nadaoka, K. Analysis of Sedimentation at the Fishing Harbor Entrance: Case Study of El-Burullus, Egypt. J. Coast. Conserv. 2018, 22, 1143–1156. [Google Scholar] [CrossRef]
- Poursanidis, D.; Traganos, D.; Reinartz, P.; Chrysoulakis, N. On the Use of Sentinel-2 for Coastal Habitat Mapping and Satellite-Derived Bathymetry Estimation Using Downscaled Coastal Aerosol Band. Int. J. Appl. Earth Obs. Geoinf. 2019, 80, 58–70. [Google Scholar] [CrossRef]
- Vittori, G.; Blondeaux, P.; Mazzuoli, M.; Simeonov, J.; Calantoni, J. Sediment Transport under Oscillatory Flows. Int. J. Multiph. Flow 2020, 133, 103454. [Google Scholar] [CrossRef]
- Finn, J.R.; Li, M.; Apte, S.V. Particle Based Modelling and Simulation of Natural Sand Dynamics in the Wave Bottom Boundary Layer. J. Fluid Mech. 2016, 796, 340–385. [Google Scholar] [CrossRef]
- Finn, J.R.; Li, M. Regimes of Sediment-Turbulence Interaction and Guidelines for Simulating the Multiphase Bottom Boundary Layer. Int. J. Multiph. Flow 2016, 85, 278–283. [Google Scholar] [CrossRef]
- Kidanemariam, A.G.; Uhlmann, M. Direct Numerical Simulation of Pattern Formation in Subaqueous Sediment. J. Fluid Mech. 2014, 750, 1–13. [Google Scholar] [CrossRef]
- Leont’yev, I.O.; Akivis, T.M. Modeling of Coastal Dynamics of the Anapa Bay-Bar. Oceanology 2020, 60, 279–285. [Google Scholar] [CrossRef]
- Armanini, A.; Cavedon, V.; Righetti, M. A Probabilistic/Deterministic Approach for the Prediction of the Sediment Transport Rate. Adv. Water Resour. 2015, 81, 10–18. [Google Scholar] [CrossRef]
- Flener, C.; Lotsari, E.; Alho, P.; Käyhkö, J. Comparison of Empirical and Theoretical Remote Sensing Based Bathymetry Models in River Environments. River Res. Appl. 2012, 28, 118–133. [Google Scholar] [CrossRef]
- Giardino, C.; Bresciani, M.; Matta, E.; Brando, V.E. Imaging Spectrometry of Inland Water Quality in Italy Using MIVIS: An Overview. In Advances in Watershed Science and Assessment; Younos, T., Parece, T.E., Eds.; Springer International Publishing: Cham, Switzerland, 2015; Volume 33, pp. 61–83. ISBN 978-3-319-14211-1. [Google Scholar]
- Jawak, S.D.; Vadlamani, S.S.; Luis, A.J. A Synoptic Review on Deriving Bathymetry Information Using Remote Sensing Technologies: Models, Methods and Comparisons. Adv. Remote Sens. 2015, 4, 147–162. [Google Scholar] [CrossRef]
- Hedley, J.; Roelfsema, C.; Chollett, I.; Harborne, A.; Heron, S.; Weeks, S.; Skirving, W.; Strong, A.; Eakin, C.; Christensen, T.; et al. Remote Sensing of Coral Reefs for Monitoring and Management: A Review. Remote Sens. 2016, 8, 118. [Google Scholar] [CrossRef]
- Lyzenga, D.R. Passive Remote Sensing Techniques for Mapping Water Depth and Bottom Features. Appl. Opt. 1978, 17, 379. [Google Scholar] [CrossRef]
- Cheng, N.-S.; Chiew, Y.-M. Pickup Probability for Sediment Entrainment. J. Hydraul. Eng. 1998, 124, 232–235. [Google Scholar] [CrossRef]
- Liu, S.; Gao, Y.; Zheng, W.; Li, X. Performance of Two Neural Network Models in Bathymetry. Remote Sens. Lett. 2015, 6, 321–330. [Google Scholar] [CrossRef]
- El-Mewafi, M.; Salah, M.; Fawzi, B. Assessment of Optical Satellite Images for Bathymetry Estimation in Shallow Areas Using Artificial Neural Network Model. Am. J. Geogr. Inf. Syst. 2018, 7, 99–106. [Google Scholar]
- Obelcz, J.; Wood, W.T.; Phrampus, B.J.; Lee, T.R. Machine Learning Augmented Time-Lapse Bathymetric Surveys: A Case Study from the Mississippi River Delta Front. Geophys. Res. Lett. 2020, 47, e2020GL087857. [Google Scholar] [CrossRef]
- Tonion, F.; Pirotti, F.; Faina, G.; Paltrinieri, D. A Machine Learning Approach to Multispectral Satellite Derived Bathymetry. ISPRS Ann. Photogramm. Remote Sens. Spat. Inf. Sci. 2020, 3, 565–570. [Google Scholar] [CrossRef]
- Mavraeidopoulos, A.K.; Oikonomou, E.; Palikaris, A.; Poulos, S. A Hybrid Bio-Optical Transformation for Satellite Bathymetry Modeling Using Sentinel-2 Imagery. Remote Sens. 2019, 11, 2746. [Google Scholar] [CrossRef]
- Sagawa, T.; Yamashita, Y.; Okumura, T.; Yamanokuchi, T. Satellite Derived Bathymetry Using Machine Learning and Multi-Temporal Satellite Images. Remote Sens. 2019, 11, 1155. [Google Scholar] [CrossRef]
- Manessa, M.D.M.; Kanno, A.; Sekine, M.; Haidar, M.; Yamamoto, K.; Imai, T.; Higuchi, T. Satellite-Derived Bathymetry Using Random Forest Algorithm and Worldview-2 Imagery. Geoplanning J. Geomat. Plan. 2016, 3, 117–126. [Google Scholar] [CrossRef]
- Kogut, T.; Weistock, M. Classifying Airborne Bathymetry Data Using the Random Forest Algorithm. Remote Sens. Lett. 2019, 10, 874–882. [Google Scholar] [CrossRef]
- Yunus, A.P.; Dou, J.; Song, X.; Avtar, R. Improved Bathymetric Mapping of Coastal and Lake Environments Using Sentinel-2 and Landsat-8 Images. Sensors 2019, 19, 2788. [Google Scholar] [CrossRef] [PubMed]
- Bures, L.; Sychova, P.; Maca, P.; Roub, R.; Marval, S. River Bathymetry Model Based on Floodplain Topography. Water 2019, 11, 1287. [Google Scholar] [CrossRef]
- Setiawan, K.T.; Suwargana, N.; Ginting, D.N.B.; Manessa, M.D.M.; Anggraini, N.; Adawiah, S.W.; Julzarika, A.; Surahman, S.; Rosid, S.; Supardjo, A.H. Bathymetry extraction from spot 7 satellite imagery using random forest methods. Int. J. Remote Sens. Earth Sci. IJReSES 2019, 16, 23–30. [Google Scholar] [CrossRef]
- Moeinkhah, A.; Shakiba, A.; Azarakhsh, Z. Assessment of Regression and Classification Methods Using Remote Sensing Technology for Detection of Coastal Depth (Case Study of Bushehr Port and Kharg Island). J. Indian Soc. Remote Sens. 2019, 47, 1019–1029. [Google Scholar] [CrossRef]
- Ha, N.T.; Manley-Harris, M.; Pham, T.D.; Hawes, I. A Comparative Assessment of Ensemble-Based Machine Learning and Maximum Likelihood Methods for Mapping Seagrass Using Sentinel-2 Imagery in Tauranga Harbor, New Zealand. Remote Sens. 2020, 12, 355. [Google Scholar] [CrossRef]
- Misra, A.; Ramakrishnan, B. Assessment of Coastal Geomorphological Changes Using Multi-Temporal Satellite-Derived Bathymetry. Cont. Shelf Res. 2020, 207, 104213. [Google Scholar] [CrossRef]
- Huber, M.E.; Zigic, S.; Gilbert, R.; Smith, D.; Edison, K.; Goudkamp, K.; Langtry, S.; Burling, M. Improved Dredge Material Management for the Great Barrier Reef Region. In Proceedings of the Australasian Port and Harbour Conference; Engineers Australia: Barton, Australia, 2013; p. 400. [Google Scholar]
- Lara, J.L.; Lucio, D.; Tomas, A.; Di Paolo, B.; Losada, I.J. High-Resolution Time-Dependent Probabilistic Assessment of the Hydraulic Performance for Historic Coastal Structures: Application to Luarca Breakwater. Philos. Trans. R. Soc. Math. Phys. Eng. Sci. 2019, 377, 20190016. [Google Scholar] [CrossRef]
- Nalona (Suction Dredger) Registered in—Vessel Details, Current Position and Voyage Information—IMO 9047453|AIS Marine Traffic. Available online: https://www.marinetraffic.com (accessed on 18 September 2019).
- Sentinel Application Platform. ESA Toolboxes, 2009. SNAP. Available online: http://step.esa.int/main/toolboxes/snap (accessed on 12 January 2020).
- Lanaras, C.; Bioucas-Dias, J.; Galliani, S.; Baltsavias, E.; Schindler, K. Super-Resolution of Sentinel-2 Images: Learning a Globally Applicable Deep Neural Network. ISPRS J. Photogramm. Remote Sens. 2018, 146, 305–319. [Google Scholar] [CrossRef]
- Rumora, L.; Miler, M.; Medak, D. Impact of Various Atmospheric Corrections on Sentinel-2 Land Cover Classification Accuracy Using Machine Learning Classifiers. ISPRS Int. J. Geo-Inf. 2020, 9, 277. [Google Scholar] [CrossRef]
- Son, N.-T.; Chen, C.-F.; Chen, C.-R.; Guo, H.-Y. Classification of Multitemporal Sentinel-2 Data for Field-Level Monitoring of Rice Cropping Practices in Taiwan. Adv. Space Res. 2020, 65, 1910–1921. [Google Scholar] [CrossRef]
- Alwhaely, U.; Hussein, M.A.; AL-Kaaby, L.F. Using GIS and Remote Sensing Satellite Data to Mapping and Monitoring Shatt Al-Arab Estuary (out Bar Area) and Nearby Coastline Southern Iraq. Al-Qadisiyah J. Pure Sci. 2020, 25, 1–21. [Google Scholar] [CrossRef]
- Breiman, L. Random Forests. Mach. Learn. 2001, 45, 5–32. [Google Scholar] [CrossRef]
- Reiss, H.; Cunze, S.; König, K.; Neumann, H.; Kröncke, I. Species Distribution Modelling of Marine Benthos: A North Sea Case Study. Mar. Ecol. Prog. Ser. 2011, 442, 71–86. [Google Scholar] [CrossRef]
- James, G.; Witten, D.; Hastie, T.; Tibshirani, R. An Introduction to Statistical Learning; Springer: Cham, Switzerland, 2013; Volume 112. [Google Scholar]
- Prasad, A.M.; Iverson, L.R.; Liaw, A. Newer Classification and Regression Tree Techniques: Bagging and Random Forests for Ecological Prediction. Ecosystems 2006, 9, 181–199. [Google Scholar] [CrossRef]
- Peters, J.; Baets, B.D.; Verhoest, N.E.C.; Samson, R.; Degroeve, S.; Becker, P.D.; Huybrechts, W. Random Forests as a Tool for Ecohydrological Distribution Modelling. Ecol. Model. 2007, 207, 304–318. [Google Scholar] [CrossRef]
- Kuhn, M. Caret: Classification and Regression Training. R Package Version. Available online: https://www.R-project.org (accessed on 5 February 2021).
- Mateo-Pérez, V.; Corral-Bobadilla, M.; Ortega-Fernández, F.; Vergara-González, E.P. Port Bathymetry Mapping Using Support Vector Machine Technique and Sentinel-2 Satellite Imagery. Remote Sens. 2020, 12, 2069. [Google Scholar] [CrossRef]
- Confederación Hidrográfica del Cantábrico. Available online: https://www.chcantabrico.es/las-cuencas-cantabricas/marco-fisico/hidrologia/rios/negro (accessed on 12 November 2019).


| Navisound 210/400 | Specifications |
|---|---|
| Frequency | 190–235 kHz |
| Potency of transmission | 300 W |
| Impedance | 100 Ohm |
| Echo approval length | 100 µs–210 kHz |
| Depth range | 0.5–100/400/1200 m depending on the frequency |
| Resolution | 1 cm |
| Accuracy | 1 cm at 210 kHz (1 σ) assuming correct sound velocity, transducer depth etc. |
| Year | |||
|---|---|---|---|
| 2017 | 2018 | 2019 | 2020 |
| 05/01/2019 | 25/01/2020 | ||
| 24/02/2018 | 24/02/2019 | 19/02/2020 | |
| 16/03/2018 | 10/03/2020 | ||
| 10/04/2018 | 20/04/2019 | ||
| 30/05/2019 | |||
| 24/06/2018 | 14/06/2019 | ||
| 04/07/2017 | 29/07/2018 | 24/07/2019 | |
| 13/08/2017 | 18/08/2018 | 23/08/2019 | |
| 02/09/2017 | 02/09/2018 | 12/09/2019 | |
| 02/10/2017 | 02/10/2018 | 22/10/2019 | |
| 21/11/2017 | 16/11/2018 | 21/11/2019 | |
| 21/12/2017 | 31/12/2018 | ||
| Algorithm | MAE (m) | RMSE (m) | R2 |
|---|---|---|---|
| Random forest | 0.37 | 0.47 | 0.974 |
| Starting Date | Finishing Date | Time (Day) | Rate (m³/Day) | Erosion Volume (m³) | Sedimentation Volume (m³) | Total (m³) | Total Error (m³) | |
|---|---|---|---|---|---|---|---|---|
| 04/07/2017 | 13/08/2017 | 40 | 29.26 | 74.88 | 1245.11 | 1170.23 | ±110.31 | |
| 13/08/2017 | 02/09/2017 | 20 | 402.46 | 0.00 | 8049.16 | 8049.16 | ±878.69 | |
| 02/09/2017 | 02/10/2017 | 30 | −548.80 | 16,463.97 | 0.00 | −16,463.97 | ±1571.27 | Start Dredge |
| 02/10/2017 | 21/11/2017 | 50 | 99.10 | 263.30 | 5218.13 | 4954.82 | ±337.91 | Stop Dredge |
| 21/11/2017 | 21/12/2017 | 30 | −1231.98 | 37,030.08 | 70.80 | −36,959.29 | ±3343.98 | Dredge |
| 21/12/2017 | 24/02/2018 | 65 | 589.90 | 80.24 | 38,423.49 | 38,343.25 | ±3502.55 | |
| 24/02/2018 | 16/03/2018 | 20 | −310.62 | 6215.43 | 2.93 | −6212.50 | ±432.64 | |
| 16/03/2018 | 10/04/2018 | 25 | 169.35 | 24.94 | 4258.79 | 4233.86 | ±287.25 | |
| 10/04/2018 | 20/05/2018 | 40 | 120.86 | 0.00 | 4834.25 | 4834.25 | ±370.84 | |
| 20/05/2018 | 24/06/2018 | 35 | 19.80 | 518.85 | 1211.81 | 692.96 | ±68.85 | |
| 24/06/2018 | 29/07/2018 | 35 | −48.44 | 2084.56 | 389.03 | −1695.53 | ±165.76 | |
| 29/07/2018 | 18/08/2018 | 20 | 46.14 | 159.70 | 1082.48 | 922.78 | ±89.14 | |
| 18/08/2018 | 02/09/2018 | 15 | −104.60 | 1668.90 | 99.85 | −1569.05 | ±150.34 | |
| 02/09/2018 | 02/10/2018 | 30 | −57.35 | 1792.12 | 71.55 | −1720.57 | ±157.61 | |
| 02/10/2018 | 16/11/2018 | 45 | 14.65 | 532.99 | 1192.31 | 659.32 | ±59.24 | |
| 16/11/2018 | 31/12/2018 | 45 | −597.85 | 26,910.49 | 7.34 | −26,903.15 | ±2752.28 | Dredge |
| 31/12/2018 | 05/01/2019 | 5 | 3556.35 | 12.93 | 17,794.68 | 17,781.76 | ±1655.70 | |
| 05/01/2019 | 24/02/2019 | 50 | 239.28 | 33.00 | 11,997.16 | 11,964.16 | ±832.46 | |
| 24/02/2019 | 26/03/2019 | 30 | −1.03 | 438.94 | 408.12 | −30.82 | ±3.04 | |
| 26/03/2019 | 20/04/2019 | 25 | 697.02 | 0.00 | 17,425.54 | 17,425.54 | ±1971.12 | |
| 20/04/2019 | 05/05/2019 | 15 | −592.93 | 8893.90 | 0.00 | −8893.90 | ±1227.16 | |
| 05/05/2019 | 30/05/2019 | 25 | −311.02 | 7775.56 | 0.00 | −7775.56 | ±894.89 | |
| 30/05/2019 | 14/06/2019 | 15 | 594.02 | 0.00 | 8910.36 | 8910.36 | ±1046.90 | |
| 14/06/2019 | 24/07/2019 | 40 | −236.76 | 9470.57 | 0.00 | −9470.57 | ±1101.37 | |
| 24/07/2019 | 23/08/2019 | 30 | −20.47 | 697.96 | 83.96 | −614.01 | ±60.14 | |
| 23/08/2019 | 12/09/2019 | 20 | 2.99 | 267.98 | 327.82 | 59.84 | ±5.82 | |
| 12/09/2019 | 22/10/2019 | 40 | −39.67 | 1632.29 | 45.49 | −1586.80 | ±150.54 | |
| 22/10/2019 | 21/11/2019 | 30 | −66.90 | 2007.10 | 0.00 | −2007.10 | ±181.28 | |
| 21/11/2019 | 26/12/2019 | 35 | −132.28 | 4742.30 | 112.66 | −4629.64 | ±319.05 | |
| 26/12/2019 | 25/01/2020 | 30 | 287.98 | 0.00 | 8639.33 | 8639.33 | ±630.13 | |
| 25/01/2020 | 19/02/2020 | 25 | 46.14 | 120.48 | 1273.91 | 1153.43 | ±115.83 | |
| 19/02/2020 | 10/03/2020 | 20 | −118.73 | 2374.51 | 0.00 | −2374.51 | ±234.22 | |
| 10/03/2020 | 04/04/2020 | 25 | 52.91 | 137.30 | 1459.93 | 1322.63 | ±128.26 |
Publisher’s Note: MDPI stays neutral with regard to jurisdictional claims in published maps and institutional affiliations. |
© 2021 by the authors. Licensee MDPI, Basel, Switzerland. This article is an open access article distributed under the terms and conditions of the Creative Commons Attribution (CC BY) license (http://creativecommons.org/licenses/by/4.0/).
Share and Cite
Mateo-Pérez, V.; Corral-Bobadilla, M.; Ortega-Fernández, F.; Rodríguez-Montequín, V. Analysis of the Spatio-Temporal Evolution of Dredging from Satellite Images: A Case Study in the Principality of Asturias (Spain). J. Mar. Sci. Eng. 2021, 9, 267. https://doi.org/10.3390/jmse9030267
Mateo-Pérez V, Corral-Bobadilla M, Ortega-Fernández F, Rodríguez-Montequín V. Analysis of the Spatio-Temporal Evolution of Dredging from Satellite Images: A Case Study in the Principality of Asturias (Spain). Journal of Marine Science and Engineering. 2021; 9(3):267. https://doi.org/10.3390/jmse9030267
Chicago/Turabian StyleMateo-Pérez, Vanesa, Marina Corral-Bobadilla, Francisco Ortega-Fernández, and Vicente Rodríguez-Montequín. 2021. "Analysis of the Spatio-Temporal Evolution of Dredging from Satellite Images: A Case Study in the Principality of Asturias (Spain)" Journal of Marine Science and Engineering 9, no. 3: 267. https://doi.org/10.3390/jmse9030267
APA StyleMateo-Pérez, V., Corral-Bobadilla, M., Ortega-Fernández, F., & Rodríguez-Montequín, V. (2021). Analysis of the Spatio-Temporal Evolution of Dredging from Satellite Images: A Case Study in the Principality of Asturias (Spain). Journal of Marine Science and Engineering, 9(3), 267. https://doi.org/10.3390/jmse9030267