
Garbage Patches and Their Environmental Implications in a Plastisphere


Abstract
:1. Introduction
2. Trends from the Literature
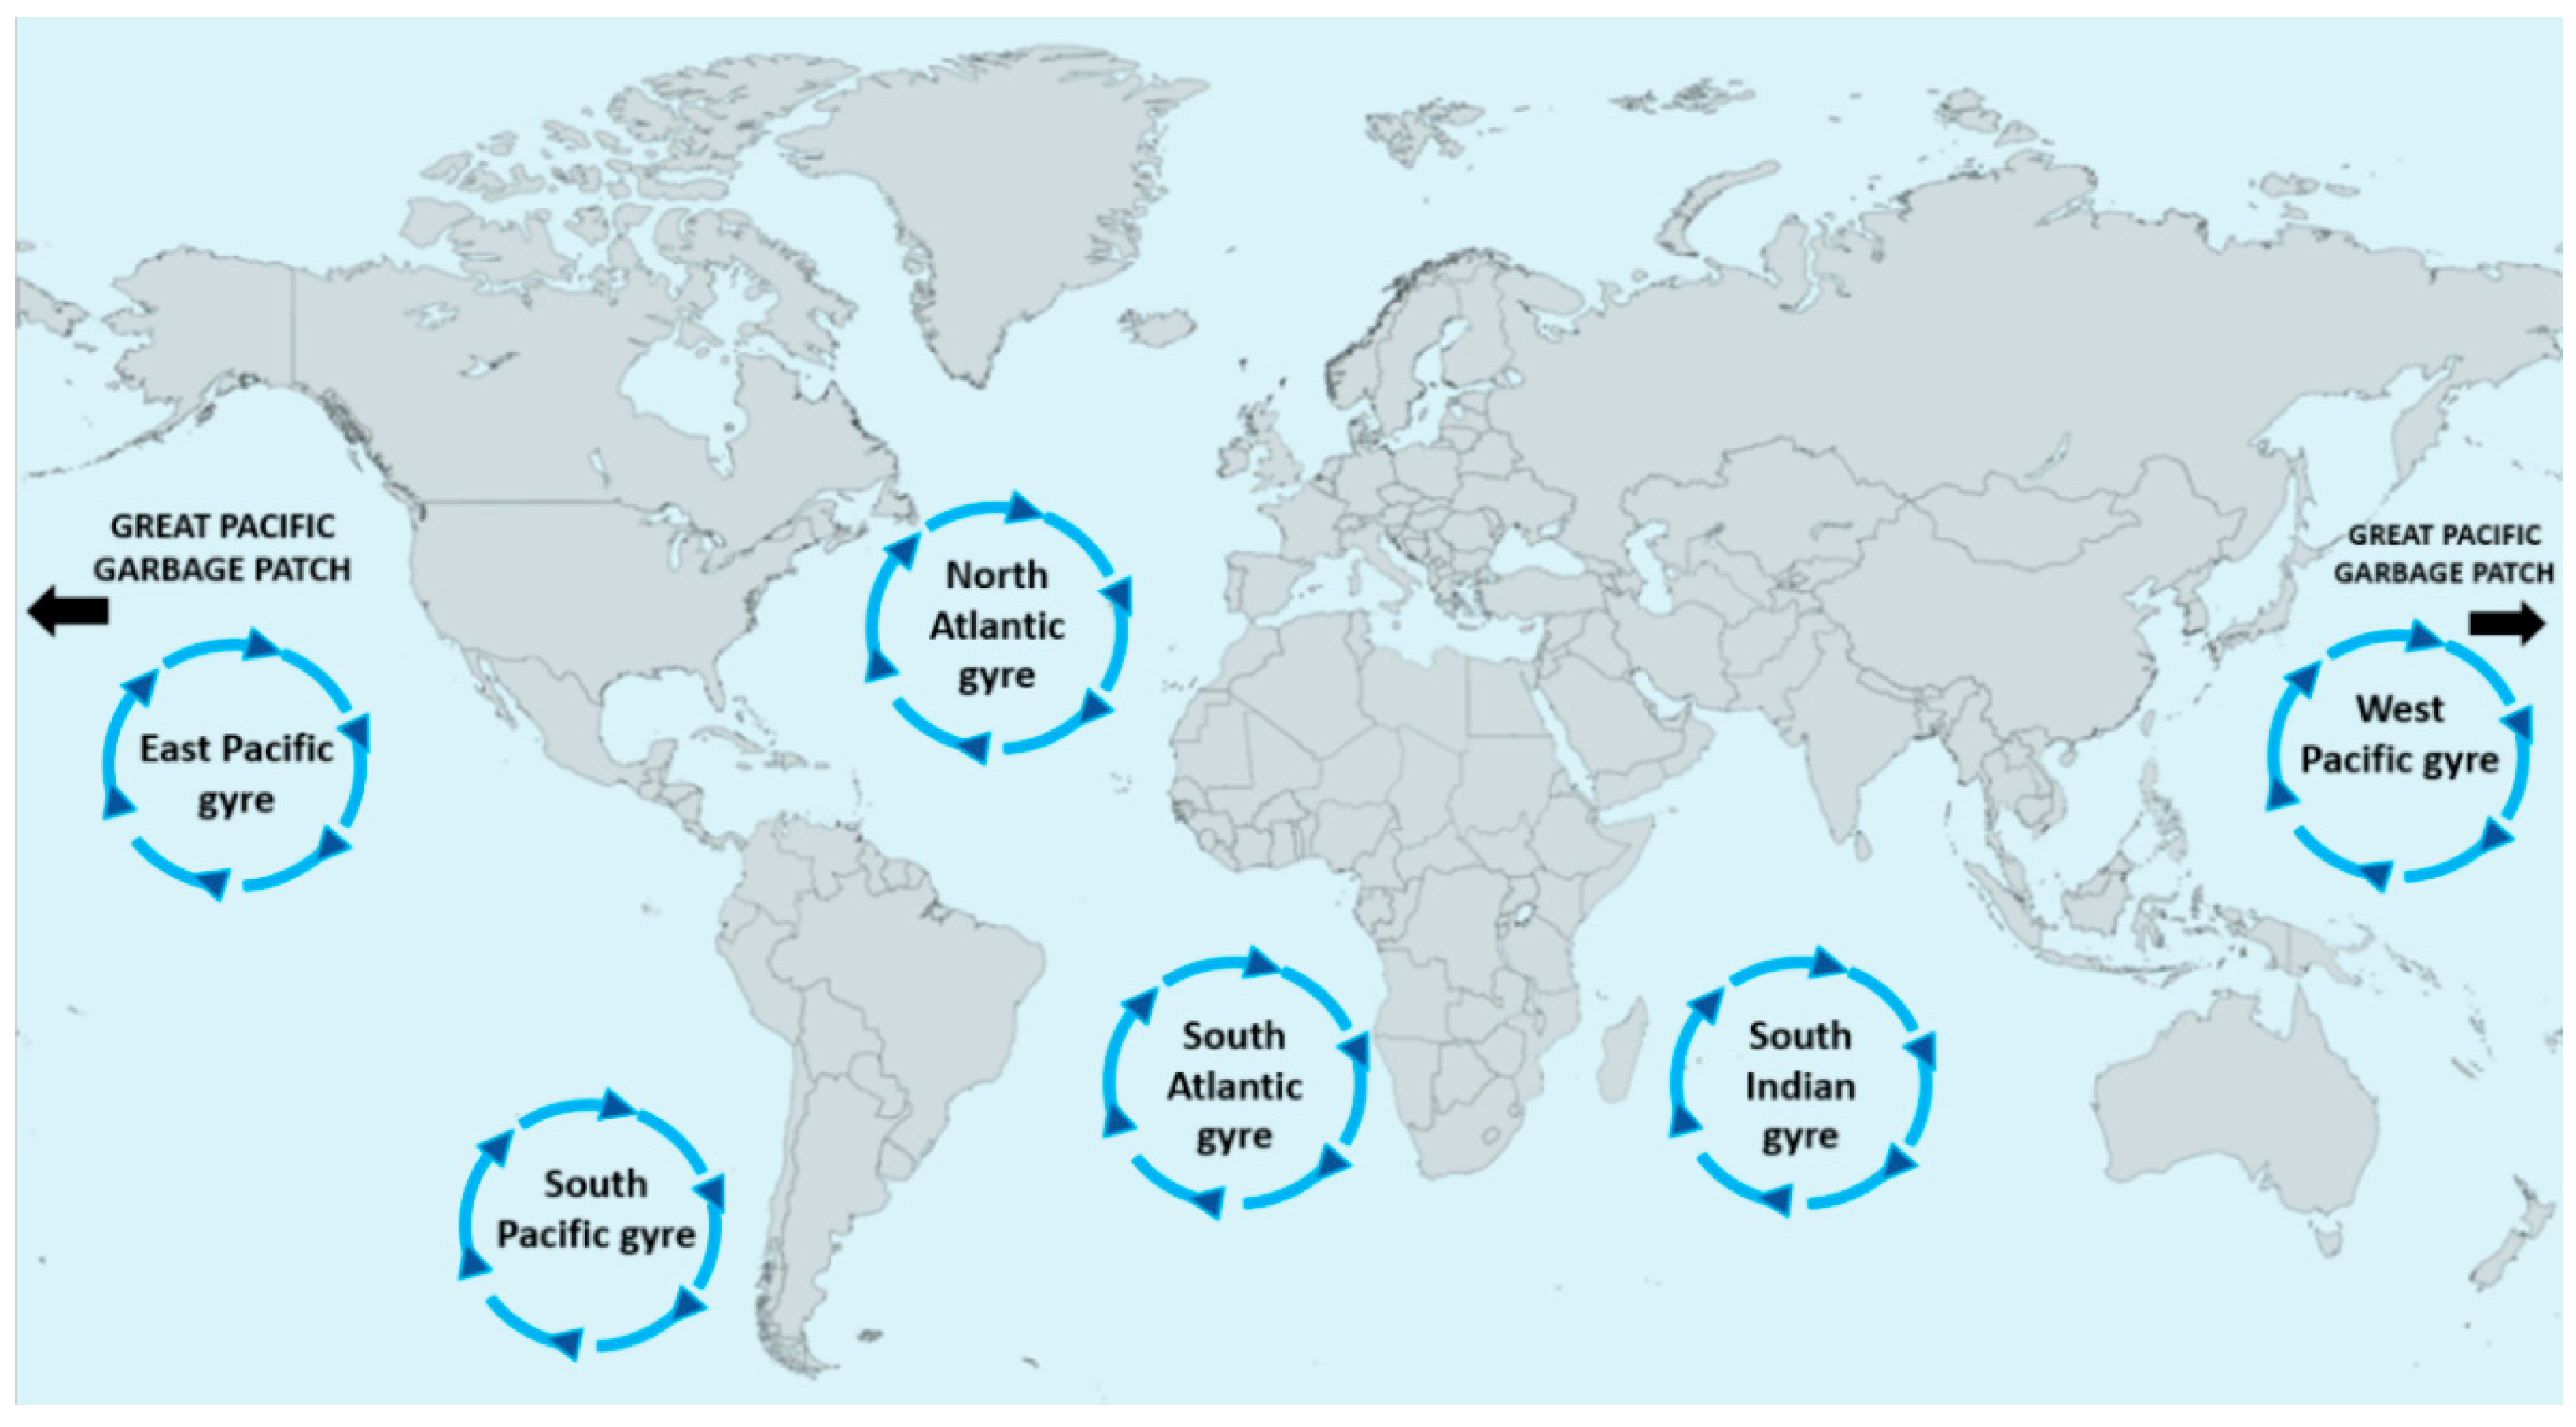
3. The Environmental Problems Caused by Garbage Patches
4. Conclusions
Author Contributions
Funding
Conflicts of Interest
References
- Leal Filho, W.; Havea, P.H.; Balogun, A.-L.; Boenecke, J.; Maharaj, A.A.; Ha’apio, M.; Hemstock, S.L. Plastic debris on Pacific Islands: Ecological and health implications. Stoten 2019, 670, 181–187. [Google Scholar] [CrossRef]
- NOAA. Garbage Patches. 2021. Available online: https://marinedebris.noaa.gov/info/patch.html (accessed on 9 March 2021).
- Lebreton, L.; Slat, B.; Ferrari, F.; Sainte-Rose, B.; Aitken, J.; Marthouse, R.; Hajbane, S.; Cunsolo, A.; Schwarz, A.; Levivier, A.; et al. Evidence that the Great Pacific Garbage Patch is rapidly accumulating plastic. Sci. Rep. 2018, 8, 4666. [Google Scholar] [CrossRef] [Green Version]
- TheOceanCleanup. The Great Pacific Garbage Patch. 2021. Available online: https://theoceancleanup.com/great-pacific-garbage-patch/#:~:text=The%20GPGP%20covers%20an%20estimated,times%20the%20size%20of%20France.&text=To%20formulate%20this%20number%2C%20the,elaborate%20sampling%20method%20ever%20coordinated (accessed on 2 March 2021).
- Loomis, I. Expedition Finds South Pacific Plastic Patch Bigger than India. Science News for Students. 2017. Available online: https://www.sciencenewsforstudents.org/article/expedition-finds-south-pacific-plastic-patch-bigger-india (accessed on 12 March 2021).
- Iberdrola. Discover the Plastic Islands That Pollute Our Oceans. Garbage Islands in the World. 2021. Available online: https://www.iberdrola.com/environment/5-garbage-patches-in-the-ocean (accessed on 10 March 2021).
- Riskas, K. The Indian Ocean’s Great Disappearing Garbage Patch. Coastal Science and Societies. 2019. Available online: https://www.hakaimagazine.com/news/the-indian-oceans-great-disappearing-garbage-patch/ (accessed on 25 February 2021).
- Atlas-Obscura. North Atlantic Garbage Patch. 2021. Available online: https://www.atlasobscura.com/places/north-atlantic-garbage-patch (accessed on 25 February 2021).
- Ryan, P.G.; Dilley, B.J.; Ronconi, R.A.; Connan, M. Rapid increase in Asian bottles in the South Atlantic Ocean indicates major debris inputs from ships. Proc. Natl. Acad. Sci. USA 2019, 116, 20892–20897. [Google Scholar] [CrossRef] [Green Version]
- Kaiser, J. The dirt on ocean garbage patches. AAAS 2010, 328, 1506. [Google Scholar] [CrossRef]
- Zhang, Y.; Zhang, Y.B.; Feng, Y.; Yang, X.J. Reduce the plastic debris: A model research on the great Pacific Ocean garbage patch. Adv. Mat. Res. 2010, 113, 59–63. [Google Scholar] [CrossRef]
- Egger, M.; Sulu-Gambari, F.; Lebreton, L. First evidence of plastic fallout from the North Pacific Garbage Patch. Sci. Rep. 2020, 10, 7495. [Google Scholar] [CrossRef]
- Law, K.L.; Morét-Ferguson, S.; Maximenko, N.A.; Proskurowski, G.; Peacock, E.E.; Hafner, J.; Reddy, C.M. Plastic accumulation in the North Atlantic subtropical gyre. Science 2010, 329, 1185–1188. [Google Scholar] [CrossRef] [Green Version]
- Reisser, J.; Slat, B.; Noble, K.; du Plessis, K.; Epp, M.; Proietti, M.; de Sonneville, J.; Becker, T.; Pattiaratchi, C. The vertical distribution of buoyant plastics at sea: An observational study in the North Atlantic Gyre. Biogeosciences 2015, 12, 1249–1256. [Google Scholar] [CrossRef] [Green Version]
- Debroas, D.; Mone, A.; Ter Halle, A. Plastics in the North Atlantic garbage patch: A boat-microbe for hitchhikers and plastic degraders. Stoten 2017, 599, 1222–1232. [Google Scholar] [CrossRef]
- Miron, P.; Beron-Vera, F.; Helfmann, L.; Koltai, P. Transition paths of marine debris and the stability of the garbage patches. arXiv 2020, arXiv:2009.11234. [Google Scholar] [CrossRef]
- Van Sebille, E.; England, M.H.; Froyland, G. Origin, dynamics and evolution of ocean garbage patches from observed surface drifters. Environ. Res. Lett. 2012, 7, 044040. Available online: https://iopscience.iop.org/article/10.1088/1748-9326/7/4/044040/meta (accessed on 2 March 2021).
- Eriksen, M.; Maximenko, N.; Thiel, M.; Cummins, A.; Lattin, G.; Wilson, S.; Hafner, J.; Zellers, A.; Rifman, S. Plastic pollution in the South Pacific subtropical gyre. Mar. Pollut. Bull. 2013, 68, 71–76. [Google Scholar] [CrossRef]
- Markic, A.; Niemand, C.; Bridson, J.H.; Mazouni-Gaertner, N.; Gaertner, J.-C.; Eriksen, M.; Bowen, M. Double trouble in the South Pacific subtropical gyre: Increased plastic ingestion by fish in the oceanic accumulation zone. Mar. Pollut. Bull. 2018, 136, 547–564. [Google Scholar] [CrossRef]
- Sesini, M. The Garbage Patch in the Oceans: The Problem and Possible Solutions. Master’s Thesis, Columbia University, Earth Institute Columbia University, New York, NY, USA, 2011. [Google Scholar]
- Ryan, P.G. Litter survey detects the South Atlantic ‘garbage patch’. Mar. Pollut. Bull. 2014, 79, 220–224. [Google Scholar] [CrossRef]
- Andrades, R.; Santos, R.G.; Joyeux, J.-C.; Chelazzi, D.; Cincinelli, A.; Giarrizzo, T. Marine debris in Trindade Island, a remote island of the South Atlantic. Mar. Pollut. Bull. 2018, 137, 180–184. [Google Scholar] [CrossRef]
- Van der Mheen, M.; Pattiaratchi, C.; van Sebille, E. Role of Indian Ocean dynamics on accumulation of buoyant debris. J. Geophys. Res. Ocean. 2019, 124, 2571–2590. [Google Scholar] [CrossRef] [Green Version]
- Ryan, P.G. The transport and fate of marine plastics in South Africa and adjacent oceans. S. Afr. J. Sci. 2020, 116, 1–9. [Google Scholar] [CrossRef]
- Pattiaratchi, C.; van der Mheen, M.; Schlundt, C.; Narayanaswamy, B.E.; Sura, A.; Hajbane, S.; White, R.; Kumar, N.; Fernandes, M.; Wijeratne, S. Plastics in the Indian Ocean–sources, fate, distribution and impacts. Ocean Sci. Discuss. 2021, 1–40. [Google Scholar] [CrossRef]
- Bryant, J.A.; Clemente, T.M.; Viviani, D.A.; Fong, A.A.; Thomas, K.A.; Kemp, P.; Karl, D.M.; White, A.E.; DeLong, E.F. Diversity and activity of communities inhabiting plastic debris in the North Pacific Gyre. MSsytems 2016, 1, 12–19. [Google Scholar] [CrossRef] [Green Version]
- Amaral-Zettler, L.A.; Zettler, E.R.; Mincer, T.J. Ecology of the plastisphere. Nat. Rev. Microbiol. 2020, 18, 139–151. [Google Scholar] [CrossRef]
- European Bioplastics. Bioplastics Market Data; European Bioplastics e.V.: Berlin, Germany, 2020. [Google Scholar]
- Statista. Plastic Production Worldwide. 2021. Available online: https://www.statista.com/statistics/1019758/plastics-production-volume-worldwide/ (accessed on 20 February 2021).
- Eriksen, M.; Lebreton, L.C.M.; Carson, H.S.; Thiel, M.; Moore, C.J.; Borerro, J.C.; Galgani, F.; Ryan, P.G.; Reisser, J. Plastic Pollution in the World’s Oceans: More than 5 Trillion Plastic Pieces Weighing over 250,000 Tons Afloat at Sea. PLoS ONE 2014, 9, e111913. [Google Scholar] [CrossRef] [PubMed] [Green Version]

| Name of Patch | Title of Article | Scope | Reference |
|---|---|---|---|
| North Pacific Garbage Patch | The Dirt on Ocean Garbage Patches | Provides an early overview of the Great Pacific Garbage patch and its contents. | [10] |
| Reduce the Plastic Debris: A Model Research on the Great Pacific Ocean Garbage Patch | Assessment of plastic debris in the patch and designing of models that may help reduce the plastic content in the future. | [11] | |
| Evidence that the Great Pacific Garbage Patch is rapidly accumulating plastic | Summarizes the latest evidence of plastic constituents found in the patch. | [3] | |
| First evidence of plastic fallout from the North Pacific Garbage Patch | Details the correlation between plastic fallout at sea level and at the deeper levels. | [12] | |
| North Atlantic Garbage Patch | Plastic Accumulation in the North Atlantic Sub-tropical Gyre | Provides early evidence of the plastic found in the North Atlantic gyre and the accumulation associated with the garbage patch. | [13] |
| The vertical distribution of buoyant plastics at sea: an observational study in the North Atlantic Gyre | Provides information about the distribution of microplastics in the water column of the ocean. | [14] | |
| Plastics in the North Atlantic garbage patch: A boat-microbe for hitchhikers and plastic degraders | Summarizes the micro-organisms found on the surface of the patch. | [15] | |
| Transition paths of marine debris and the stability of the garbage patches | Assesses possible pathways of marine debris that lead to different gyres, including the North Atlantic gyre. | [16] | |
| South Pacific Garbage Patch | Origin, dynamics, and evolution of ocean garbage patches from observed surface drifters | Describes changes associated with the size of different garbage patches, including the South Pacific patch. | [17] |
| Plastic pollution in the South Pacific subtropical gyre | Details the average abundance and mass of plastic particles found in the patch. | [18] | |
| Expedition finds South Pacific plastic patch bigger than India | Details the size and constituents of the patch following an assessment study. | [5] | |
| Double trouble in the South Pacific subtropical gyre: Increased plasticingestion by fish in the oceanic accumulation zone | The study found significant increases in plastic ingestion by fish in the area, which is harmful to consumers. | [19] | |
| South Atlantic Garbage Patch | The Garbage Patch in The Oceans: The Problem and Possible Solutions | Provides an overview of the patch, including surface area and density of particles. | [20] |
| Litter survey detects the South Atlantic ‘garbage patch’ | A study discovered the litter constituents of the patch, as well as how far it extends. | [21] | |
| Marine debris in Trindade Island, a remote island of the South Atlantic | Evidence shows that the pollution found within the gyre and patch negatively affects the flora and fauna of the island located on the edge of the gyre. | [22] | |
| Rapid increase in Asian bottles in the South Atlantic Ocean indicates major debris inputs from ships | The study found that bottle pollution from ships contributes greatly to the increased size of the patch. | [9] | |
| Indian Ocean Garbage Patch | Origin, dynamics, and evolution of ocean garbage patches from observed surface drifters | Describes changes associated with the size of the South Indian garbage patch and other evolutions. | [17] |
| Role of Indian Ocean Dynamics on Accumulation of Buoyant Debris | Assesses the factors that influence accumulation at the garbage patch, including different currents. | [23] | |
| The transport and fate of marine plastics in South Africa and adjacent oceans | Details South Africa’s contribution to waste in the Indian ocean that may potentially feed the gyre and patch. | [24] | |
| Plastics in the Indian Ocean: Sources, fate, distribution and impacts | Describes the outcomes for plastics in the Indian ocean, including feeding the gyre and leakage to other gyres. | [25] |
| Problem | Potential Impacts |
|---|---|
| Entanglement of marine life | Marine life is caught and trapped in the debris, especially larger species |
| Ghost fishing | Fishing through lost nets that are not recovered |
| Ingestion of debris | Plastic and other debris mistakenly eaten by bird/fish as food |
| Transport of foreign species | Ocean currents transport plant/animal species from one area to the other, away from their natural habitat, with the risk of invasive ones |
| Water contamination | Ocean currents may transport chemicals deriving from the decomposition of debris, which may impact sea fauna/flora |
| 2013 | 2023 | 2063 | |
|---|---|---|---|
| North Pacific Ocean | 964.0 | 1234.0 | 3313.4 |
| North Atlantic Ocean | 564.7 | 722.9 | 1941.0 |
| Indian Ocean | 591.3 | 756.9 | 2032.4 |
| South Atlantic Ocean | 127.8 | 163.6 | 439.3 |
| South Pacific Ocean | 210.2 | 269.1 | 722.5 |
Publisher’s Note: MDPI stays neutral with regard to jurisdictional claims in published maps and institutional affiliations. |
© 2021 by the authors. Licensee MDPI, Basel, Switzerland. This article is an open access article distributed under the terms and conditions of the Creative Commons Attribution (CC BY) license (https://creativecommons.org/licenses/by/4.0/).
Share and Cite
Leal Filho, W.; Hunt, J.; Kovaleva, M. Garbage Patches and Their Environmental Implications in a Plastisphere. J. Mar. Sci. Eng. 2021, 9, 1289. https://doi.org/10.3390/jmse9111289
Leal Filho W, Hunt J, Kovaleva M. Garbage Patches and Their Environmental Implications in a Plastisphere. Journal of Marine Science and Engineering. 2021; 9(11):1289. https://doi.org/10.3390/jmse9111289
Chicago/Turabian StyleLeal Filho, Walter, Julian Hunt, and Marina Kovaleva. 2021. "Garbage Patches and Their Environmental Implications in a Plastisphere" Journal of Marine Science and Engineering 9, no. 11: 1289. https://doi.org/10.3390/jmse9111289
APA StyleLeal Filho, W., Hunt, J., & Kovaleva, M. (2021). Garbage Patches and Their Environmental Implications in a Plastisphere. Journal of Marine Science and Engineering, 9(11), 1289. https://doi.org/10.3390/jmse9111289