Abstract
Offshore wind energy is a key enabler of the global net-zero transition. As nearshore fixed-bottom projects reach maturity, floating offshore wind turbines (FOWTs) are becoming the next major focus for large scale deployment. To accelerate this development and reduce construction costs, it is essential to optimize mooring systems through a systematic and performance driven framework. This study focuses on the mooring assessment of the Taiwan-developed DeltaFloat semi-submersible platform supporting a 15 MW turbine at a 70 m water depth offshore Hsinchu, Taiwan. A full-chain catenary mooring system was designed based on site specific metocean conditions. The proposed framework integrates ANSYS AQWA (version 2024 R1) and Orcina OrcaFlex (version 11.5) simulations with sensitivity analyses and performance-based fitness metrics including offset, inclination, and line tension to identify key parameters governing mooring behavior. Additionally, an analysis of variance (ANOVA) was conducted to quantitatively evaluate the statistical significance of each design parameter. Results indicate that mooring line length is the most influential factor affecting system performance, followed by line angle and diameter. Optimizing these parameters significantly improves platform stability and reduces tension loads without excessive material use. Building on the optimized symmetric configuration, an asymmetric mooring concept with unequal line lengths is proposed. The asymmetric layout achieves performance comparable to traditional 3 × 1 and 3 × 2 systems under extreme environmental conditions while demonstrating potential reductions in material use and overall cost. Nevertheless, the unbalanced load distribution highlights the need for multi-scenario validation and fatigue assessment to ensure long-term reliability. Overall, the study establishes a comprehensive and sensitivity-based evaluation framework for floating wind mooring systems. The findings provide a balanced and practical reference for the cost-efficient design of floating offshore wind farms in the Taiwan Strait and other shallow-water regions.
1. Introduction
Offshore wind energy has expanded rapidly over the past decade. By the end of 2023, global installed and planned capacity reached 453.6 GW, with industry forecasts projecting growth to 422–492 GW by 2035 [1]. However, most existing wind farms are concentrated in shallow waters with fixed-bottom foundations. As these areas approach saturation and costs increase sharply beyond the economic depth range for fixed foundations, the industry faces urgent pressure to develop deeper-water sites. Over 80% of viable offshore wind resources lie in waters deeper than 60 m [2], where conventional fixed-bottom foundations encounter significant cost and technical barriers. Floating offshore wind turbines (FOWTs) therefore provide a pathway to sustain growth by enabling deployment in deep-water regions with stronger and more consistent wind regions.
In Taiwan, offshore wind development in waters shallower than 50 m has reached a relatively mature stage, and the next deployment phase is expected to move toward deeper waters. This transition makes the 50–100 m depth range in the Taiwan Strait a practical near-term target for floating wind, where mooring design is critical for station keeping and motion control. While conventional chain catenary systems are widely adopted, their performance under shallow water presents critical design challenges. In this shallow-water environment, mooring systems exhibit nonlinear behavior, particularly in tension fluctuation, touchdown point variation, and angle-dependent restoring forces. If inadequately designed, these factors can accelerate fatigue damage or compromise station-keeping performance.
Recent work has improved both the analysis fidelity and the systematic comparison of mooring options for floating wind. Coupled experimental–numerical studies and time-domain simulations are commonly used to capture dynamic tensions and platform motions more accurately than quasi-static approximations. Tomasicchio et al. [3] demonstrated through coupled model tests and simulations that dynamic mooring analysis provides better accuracy compared to quasi-static approaches in capturing line tensions and platform motions. Alongside dynamic analysis developments, parametric studies have systematically compared mooring configurations across design criteria. Campanile et al. [4] evaluated 3-line, 6-line, and 9-line mooring systems for a semi-submersible platform with the NREL 5 MW turbine over water depths of 50–350 m, assessing ULS, FLS, and ALS conditions. Their results indicated that a 6-line catenary arrangement can offer a practical balance: compared with a 3-line system, it improves redundancy under single-line failure, while avoiding the added weight and installation burden of higher line-count configurations.
Cost has become an equally important part of the design logic. Li et al. [5] used a coupled CFD–FEM model to assess mooring upgrades for a floating wind platform under extreme wave loading. They reported limited benefits from adding a heavy chain segment or simply increasing line count, whereas increasing line number together with optimized deployment angles improved stability and supported compliance with safety requirements. Larger line diameters provided the highest safety level but incurred the highest cost and still produced high peak tensions. This indicates that mooring design must balance safety and cost, and it also highlights the importance of nonlinear effects that govern tension spikes under severe conditions.
The nonlinear mechanisms responsible for tension spikes and large tension fluctuations are increasingly documented. Huang and Yang [6] found that mooring tension fluctuations become more severe under depth-limited conditions. In restricted water depths, the touchdown point (TDP) can shift significantly with platform motion. When a line segment lifts off the seabed in shallow water, the sudden loss of seabed contact can trigger sharp tension spikes. Moreover, excessive pretension applied to stiffen the system may counterproductively amplify platform motion, leading to larger dynamic tension excursions. Cheng et al. [7] further reported that shallow water mooring systems exhibit pronounced nonlinear characteristics, including higher tension variability, reduced seabed contact length, and larger mooring angles compared to deep water systems. If not properly accounted for in design, these nonlinear effects can accelerate fatigue damage and increase mooring failure risk.
These studies emphasize that beyond meeting basic station-keeping requirements, shallow water mooring design must ensure even tension distribution and avoid excessive localized loads. In practice, optimizing the tension profile and stiffness characteristics of mooring lines is essential to prevent sudden overloads. Meanwhile, as turbine sizes increase and projects move farther offshore, cost-effectiveness in mooring design has become increasingly important. Modern design approaches seek to eliminate unnecessary redundancy and concentrate material usage on critical load-bearing components, thereby improving efficiency, reducing the levelized cost of energy (LCOE), and enhancing overall project feasibility.
To address these challenges, recent research has explored multiple strategies, including asymmetric mooring arrangements. Asymmetric mooring designs intentionally distribute lines unevenly around the platform to counteract dominant environmental loads. Yue et al. [8] conducted parametric studies examining how key mooring layout parameters—including line length, radial span (mooring radius), and angular spacing—influence platform dynamics. Through algorithmic optimization of these parameters, the study achieved notable reductions in platform offset and motion, improving stability and reducing collision risk. Formosa & Sant [9] observed that asymmetric mooring arrangements can significantly affect platform pitch and roll responses as well as line tension distribution, highlighting the potential of non-uniform layouts to enhance stability under certain conditions. Using a more formal optimization approach, Yu et al. [10] combined an improved particle swarm optimization (PSO) algorithm with a radial basis function (RBF) surrogate model to design optimal asymmetric mooring systems. By adjusting variables including mooring radius, line azimuth angles, inter-line distribution angles, line count, and segment lengths, their optimized design reduced mean platform offset by 8.29% while effectively balancing system redundancy and cost [11] demonstrated in an aquaculture context that a carefully engineered 14-line asymmetric mooring system can maintain excellent structural integrity under environmental loads while minimizing ecological impact on coastal ecosystems.
Existing research has primarily focused on sensitivity analysis of individual mooring parameters or performance comparisons of specific configurations. For large-scale 15 MW turbines in transitional water depths (50–100 m), systematic assessment of the interaction between mooring configuration parameters and their combined effects on platform motion and mooring tension remains limited. This study uses the DeltaFloat platform with 15 MW in 70 m water depth in the Taiwan Strait as a case study to systematically quantify the influence of mooring line length, nominal diameter, layout pattern, and fairlead angle on system dynamic response through a three-stage design spiral strategy. The research establishes a fitness-based evaluation framework integrating platform motion and mooring tension and employs ANSYS AQWA and Orcina OrcaFlex for hydrodynamic and coupled dynamic simulations to quantify the comprehensive performance of mooring system configurations and platform dynamics, providing technical guidance for mooring design of large-scale FOWTs in transitional water depths.
This study employs a three-stage design spiral strategy to systematically refine and optimize mooring system configurations, as shown in Figure 1,. The first stage develops a 3-line mooring system, primarily to identify fundamental design trends and understand the relationship between mooring parameters and platform motion response. The second stage introduces a 6-line mooring configuration and applies Analysis of Variance (ANOVA) to determine key design parameters that significantly influence system performance, with emphasis on minimizing failure risk and ensuring cost-effectiveness. The third stage proposes and optimizes an asymmetric mooring layout that balances structural safety and economic feasibility, ultimately providing a practical solution suited to Taiwan’s offshore environmental conditions. The study scope covers ULS, serviceability limit state (SLS), FLS, and ALS design conditions to ensure robust mooring system performance across various operational scenarios.
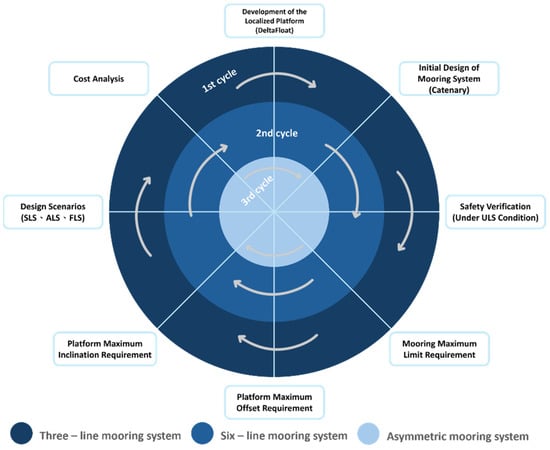
Figure 1.
Design spiral of mooring system.
2. Floating Wind Turbine Model
2.1. Wind Turbine
To align with the trend of increasing wind turbine size, this study utilizes the IEA-15 MW reference wind turbine, which has a larger installed capacity and is more widely used, for numerical simulation. The detailed specifications of this turbine can be found in the report published by the International Energy Agency (IEA) [12]. The 15 MW wind turbine key parameters used in the OrcaFlex simulation are listed in Table 1. The power curve and wind thrust curve of the wind turbine are shown in Figure 2, which serves as the basis for mooring fatigue analysis in this study.

Table 1.
IEA-15 MW wind turbine parameter in OrcaFlex.
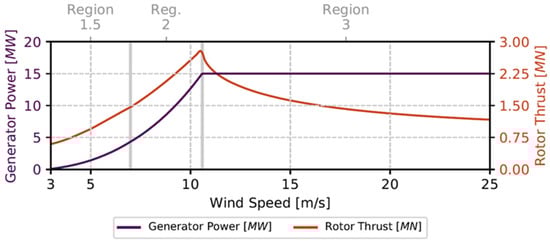
Figure 2.
Power and rotor thrust curves of IEA-15 MW wind turbine.
2.2. Floater Design
The original DeltaFloat semi-submersible platform was proposed and designed to support a 10 MW wind turbine. Its structure primarily consists of three vertical columns connected by horizontal pontoons, featuring an eccentric tower design that offers advantages in turbine installation while reducing the platform’s steel weight and overall costs.
To support the IEA 15 MW reference turbine, the platform geometry was modified within Taiwan’s manufacturing and installation constraints, which limit the maximum transportable width to approximately 85 m. The design requires a static heel angle below 10° under rated turbine thrust while maintaining a freeboard of 15 m and a draft of 20 m. The final platform geometry, shown in Figure 3, has a characteristic length W1 of 79.5 m and a characteristic width W2 of 89.3 m, with design parameters provided in Table 2.
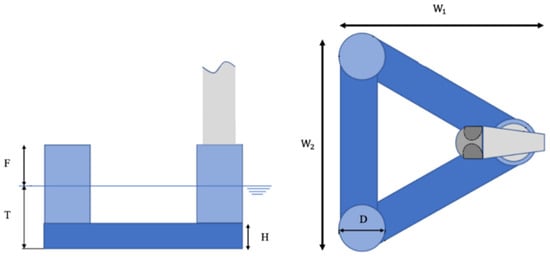
Figure 3.
Positions of DeltaFloat components.
Table 2.
Platform parameter with different capacity of DeltaFloat.
2.3. Mooring System
This study examines catenary mooring systems using R4-grade studless chains at a water depth of 70 m. The fairleads are located 16 m below the still water surface, positioned on the outer columns in a 120° symmetric configuration with a radial spacing of 48.25 m from the platform centerline. The anchor radius is fixed at 800 m and the baseline mooring line length is set at 770 m [13].
The Minimum Breaking Load (MBL) of the selected mooring chains is determined according to the target environmental conditions. For chains of different nominal diameters and strength grades, the MBL can be estimated using the formulation:
where is the load factor obtained from Table 3, is the nominal chain diameter in millimeters, and the minimum breaking load () is calculated in [14]. This study compares the effects of mooring line length, chain diameter, and the number of mooring lines on system performance. Five chain diameters (137 to 180 mm) are evaluated under the environmental conditions offshore Hsinchu. The minimum breaking load (MBL) for each diameter is calculated according to DNV-OS-E302 [15]. Table 4 summarizes the mass per unit length, MBL, and axial stiffness (EA) for each chain size.
Table 3.
Load factor requirements for design of mooring lines.
Table 4.
Key parameters of mooring system.
Following DNV-ST-0119 [16], the mooring design tension is defined as:
where is the characteristic mean tension, is the characteristic dynamic tension, and and are the partial safety factors for mean and dynamic components, respectively.
The ULS and ALS conditions for assessing the wind turbine in the parked condition are evaluated using environmental conditions associated with 50-year and 1-year return periods, respectively. The characteristic mean tension is defined as the sum of the mooring line pretension and the mean environmental load induced by wind, waves, and current, corresponding to the selected return period. The characteristic dynamic tension is defined as the mooring tension resulting from low-frequency and wave frequency effects for a different return period. The partial safety factors are summarized in Table 5.
Table 5.
Safety factors for different condition [16].
In the absence of statistical data, the design breaking strength can be taken as 95% of the minimum breaking strength
To ensure clarity and consistency in the presentation of the mooring design cases, a systematic naming convention is adopted throughout this study. Each mooring configuration is labeled using three key parameters: chain diameter (D), line-to-line angle (A), and mooring line length (L). The naming structure is defined as follows:
where Dxxx is chain nominal diameter in millimeters, Axx is angle between two mooring lines on the same side (degrees), and Lxxxx is mooring length in meters.
Case Code = Dxxx Axx Lxxxx
For example, the code D180A15L770 refers to a configuration with a chain diameter of 180 mm, a line-to-line angle of 15°, and a mooring line length of 770 m.
3. Environmental Conditions
3.1. Normal Environmental Conditions
This study references the normal sea state data presented by Su [17], who used ERA5 reanalysis to investigate and statistically analyze the sea conditions offshore of Hsinchu. In this study, ERA5 data from 2013 to 2022 is used as input for wind and wave conditions, with data extracted from the node located at 25.0° N, 120.5° E. Meanwhile, current data is sourced from measurements collected by the Hsinchu buoy in 2021.
According to Su [16], northeast monsoon winds raise Taiwan Strait wind speeds from October to March, typically within the IEA-15 MW turbine’s rated range (11–25 m/s), creating favorable generation conditions. This monsoon period is thus used as the representative normal condition to assess mooring safety and performance, since turbine operation then strongly affects mooring tensions and platform responses.
Furthermore, the study by Chen [13] highlights a strong correlation between mooring line fatigue damage and wind speed. Chen’s analysis indicates that when the wind speed reaches 12 m/s corresponding to the maximum wind thrust design condition for the 15 MW wind turbine the mooring lines experience the highest fatigue damage.
In summary, it is evident that wind speed is closely related to the performance of the wind turbine. When the wind speed exceeds 11 m/s, it becomes a critical indicator for evaluating both the SLS and the FLS of the system equipped with the IEA-15MW wind turbine. Therefore, this study designs and conducts evaluations of normal operating conditions based on these findings. Detailed information is summarized in Table 6.
Table 6.
Summary of Normal Conditions.
3.2. Summary of Extreme Conditions
Based on the collected metocean data, the extreme environmental conditions for the offshore area of Hsinchu at a water depth of 70 m have been defined. These conditions incorporate the key environmental factors wave characteristics, current speed, and wind conditions to enable a comprehensive assessment of the selected site.
The wave conditions are modeled based on a 50-year typhoon return period, utilizing the JONSWAP wave spectrum to ensure realistic and accurate wave representation. Additionally, the wind and current speeds corresponding to a 1-year return period are evaluated based on the findings of Chung et al. [18] Detailed information is presented in Table 7.
Table 7.
Summary of different return periods for environmental conditions.
4. Methodology
This chapter outlines the methodology adopted in this study, with the overall workflow presented in Figure 4. The analysis begins with three conceptual mooring-system configurations. The initial design stage is carried out using the three-line mooring system to determine the feasible ranges of mooring-line length and diameter. The investigation then advances to the six-line mooring system, where an ANOVA is conducted on mooring length, diameter, and line angle to identify the governing design parameters. Subsequently, the asymmetric mooring system is introduced, and the overall performance of each configuration is evaluated using the defined Fitness metric, from which the preferred layout is selected. Finally, RAO analysis, SLS and FLS evaluations, ALS verification, and cost assessments are performed across the three mooring configurations to complete the comparative assessment of structural performance and economic feasibility.
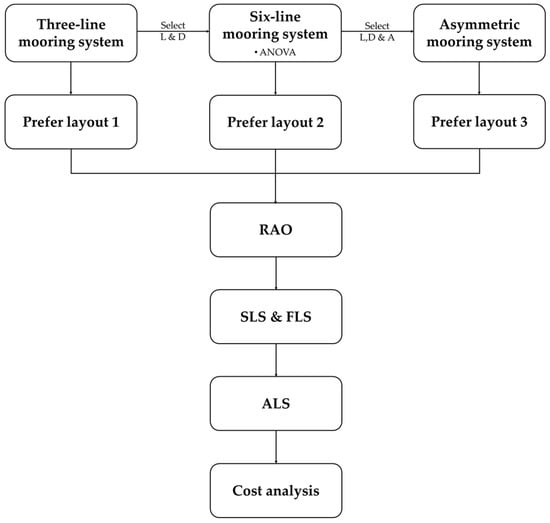
Figure 4.
Flow chart of methodology in this study.
Numerical simulations are carried out using ANSYS AQWA and Orcina OrcaFlex. AQWA is first employed to perform frequency-domain motion-response analyses and to obtain the hydrodynamic coefficients, which are then transferred to OrcaFlex. In OrcaFlex, the environmental conditions and initial mooring configurations are specified, followed by fully coupled time-domain dynamic analyses of the wind turbine, floating platform, and mooring system.
4.1. ANSYS AQWA
AQWA is a numerical simulation software widely validated by major classification societies, including DNV (Høvik, Norway), Lloyd’s Register (London, UK), China Classification Society (CCS, Beijing, China), RINA (Genoa, Italy), and ABS (Houston, TX, USA). It utilizes the Boundary Element Method to solve potential flow numerical hydrodynamics solutions. In its computations, AQWA assumes the fluid is homogeneous, incompressible, inviscid, and irrotational, employing 3D radiation and diffraction theory for analysis [19].
Equation of motion that is used in AQWA, can be written as:
where Fω is the sum of Froude-Krylov excitation force and wave diffraction force, Mis structure mass (includes platform and ballast), MA (ω) and B (ω) are the radiation added mass and damping in the frequency domain, D is linear structural/viscous damping, K is the hydrostatic restoring, and KH is the mooring/tower stiffness.
In this study, the hydrodynamic analysis used a panel mesh of approximately 5800 elements for the hull. The platform was modeled as a rigid 6-DOF body. Wave frequencies from 0.017 Hz to 0.36 Hz (periods of 2.8 to 60 s) were analyzed.
4.2. Orcina OrcaFlex
OrcaFlex, developed by Orcina, is a dynamic analysis software widely used across industries such as oil & gas, wind energy, oceanography, seismic studies, and aquaculture. In this study, OrcaFlex is utilized for floating platform analysis, mooring system design, and stability assessment. However, OrcaFlex does not compute hydrodynamic radiation effects. Therefore, hydrodynamic calculations are first performed in ANSYS AQWA, and the results are then imported into OrcaFlex for further analysis [20].
Following the hydrodynamic data import, the OrcaFlex model was configured as follows: the platform was modeled as a rigid 6-DOF body, the tower as a homogeneous pipe, and the nacelle as a lumped 6-DOF buoy with mass and inertia properties based on the IEA 15 MW specifications [12]. Each mooring line was discretized with a segment length of 5 m, resulting in approximately 154 segments per line. Time-domain simulations for irregular waves used a time step of 0.025 s with a total duration of 3 h to ensure statistical convergence of extreme responses. The soil-mooring interaction employed a linear elastic seabed (stiffness: 100 kN/m/m2, damping: 0%) with Coulomb friction (coefficient: 0.5). Hydrodynamic coefficients: Cd = 2.4/1.15 (normal/axial), Cm = 2.0/1.5 (normal/axial).
4.2.1. Equation of Motion
In OrcaFlex, the time-domain calculation for a floater is based on the following equation:
where M(x,a) is the system of inertia force, C(x,v) is the damping force, K(x) is the stiffness force, and F(x,v,t) is the external force loading on floater.
4.2.2. Morison Equation
In OrcaFlex, the Morison equation is the primary method for calculating hydrodynamic forces acting on lines (mooring) and six-degree-of-freedom floating bodies (6D Buoys), which are commonly used in small offshore structures. This equation estimates forces on fixed vertical cylinders and consists of two main components: fluid inertia force related to the acceleration of water particles and drag force related to the velocity of particles. The original equation is written as:
where f is the total fluid force, Cm is the floater inertia coefficient, Δ is the floater of fluid displaced, af is the fluid acceleration relative to earth, ρ is water density, Cd is the drag coefficient, A is the drag area, and vf is the fluid velocity relative to earth.
4.3. Floating Wind Turbine Design Requirements
According to DNV RP 0286 [21], under normal operating conditions (e.g., IEC-61400 design load cases DLC 1.2 and 1.6), the average inclination angle of a floating wind turbine (FOWT) should not exceed 5°, with a maximum limit of 10° during operation. Under shutdown and extreme conditions (e.g., DLC 6.1 and 6.2), the tilt angle of a non-operational FOWT should not exceed 15°.
Industry guidelines [22] indicate that allowable horizontal offsets for floating platforms should be defined as a function of water depth rather than based on a uniform criterion.
- For shallow-water sites with depths on the order of 100 m, feedback from ongoing floating wind developments supports adopting an excursion limit of approximately 30% of the local water depth.
Given that the present study considers a site with a water depth of 70 m, the allowable horizontal excursion is derived proportionally from the shallow-water guideline, yielding a limit of approximately 21 m. The calculation methods for evaluating platform motion responses, including offset and inclination, are as follows:
where xd is the platform displacement along the x-axis, yd is the platform displacement along the y-axis, θx is the platform pitch angle, and θy is the platform roll angle.
4.4. Fatigue Analysis
In this study, the fatigue damage assessment of mooring lines follows the API RP 2SK standard [23] and is analyzed using the T-N curve approach. The T-N curve describes the relationship between stress range (R) and the corresponding fatigue life (N, the number of cycles a material can withstand before failure). The equation is expressed as:
where N is the number of cycles and R is the ratio of the stress range to the minimum breaking strength of the mooring line. M and K are constants determined empirically for the specific material and application.
The evaluation of cumulative fatigue damage in mooring lines typically involves two key steps. Load cycles are extracted using the rainflow counting method implemented in OrcaFlex [20], converts the cyclic loading history of mooring lines into a series of fatigue cycles. As illustrated in Figure 5, this method processes time-series data, identifying closed or semi-closed stress cycles, which allows for calculating cycle counts within specific stress ranges. These calculations serve as the foundation for fatigue damage analysis.
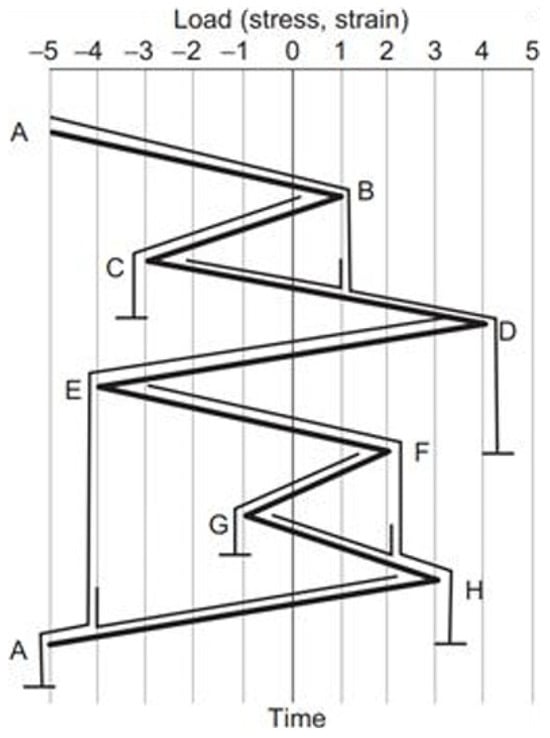
Figure 5.
Rainflow method.
This study integrates the Palmgren–Miner rule with the Rainflow Counting Method to assess fatigue damage. The analysis assumes a uniaxial cycle counting method for different loading conditions, and fatigue damage is calculated using the following equation:
When damage equals one, it indicates that the material has been damaged. is the number of cycles of operation, is the total number of cycles that produce failure at that stress level, and is the total number of strain ranges. Failure is assumed when D ≥ 1, indicating the mooring line has reached its fatigue limit.
4.5. Statistical Methods
4.5.1. Fitness Parameter
To evaluate the motion and loading responses of the floating wind turbine system, this study adopts a fitness function approach following Rentschler et al. [24] for quantitative assessment. Under ultimate limit state (ULS) conditions, the design is optimized by minimizing the fitness value to enhance overall safety and stability. Based on recommendations from COREWIND) [22] and DNV-RP-0286 [21], the maximum offset range (MOR) is set at 21 m and the maximum inclination range (MIR) at 15°.
The extreme value statistics are obtained as follows: time-domain simulations are conducted for 3 h under combined irregular wave, wind, and current conditions. The maximum values of platform motion and mooring tension are extracted from the time series as extreme response indicators. The fitness function is defined as:
where Tmax is the maximum tension in the mooring line, MBL is the minimum breaking load of the mooring line, Omax is the maximum offset range, MOR is the maximum allowable offset range, Imax is the maximum inclination range, and MIR is the maximum allowable inclination range.
4.5.2. Analysis of Variance (ANOVA)
ANOVA is a statistical technique used to compare multiple datasets and determine whether significant differences exist among them. This method is widely applied across engineering, science, and business fields to analyze experimental results and assess variability within data sets. One of the key advantages of ANOVA is its ability to efficiently compare multiple groups while controlling the risk of Type I error, which occurs when a true null hypothesis is incorrectly rejected.
In this study, ANOVA is applied to identify the key parameters that significantly influence mooring line performance within the proposed system. The ANOVA process used in this study is outlined in the following steps.
- Between-group variation (SSB)
The variation between groups (SSB) represents the differences among group means. If the means of different groups vary significantly, SSB will be large, indicating a pronounced difference between groups. SSB is computed as follows:
where is the sample size of group i, is the meaning of group i, and is the overall meaning of all samples.Within-group variation (SSW, Residual)
The variation within groups (SSW) measures how dispersed the data points are inside each group. A larger SSW indicates higher data variability within groups, which may be attributed to random variation. SSW is given by:
where represents the value of the jth sample in group i and is the meaning of group i.
- Total Variation (SST)
Total variation (SST) is the sum of the between-group variation (SSB) and the within-group variation (SSW). A higher SST indicates greater overall dispersion of the data, suggesting that external factors or random variation have a significant impact. SST is given by:
- Degrees of Freedom (df)
Degrees of freedom represent the number of independent values that can vary within the statistical analysis. The degrees of freedom for between-group variation () and within-group variation () are defined as follows:
where k is the number of levels for the factor and N is the total sample size.
- Mean Square (MS) Calculation
The mean square values measure the average degree of variation. The mean square between groups (MSB) represents the variation among groups and is calculated as:
A large MSB indicates significant differences between groups.
The mean square within groups (MSW) represents the variation within groups and is calculated as:
A large MSW suggests a high level of random variation within groups.
- Calculation of the F-value
The F-value represents the ratio of between-group variation to within-group variation, expressed as follows:
A larger F-value suggests that the variation between groups (SSB) is significantly greater than the variation within groups (SSW), indicating that the difference between groups is statistically significant.
- F-Test Decision Criteria
After calculating the F-value, the corresponding p-value is determined using reference tables to assess whether the independent variable has a statistically significant impact on the dependent variable. The commonly used significance level (α) of 0.05 is a long-standing statistical convention, originally proposed by Fisher [25].
In practical applications, a p-value less than 0.05 typically indicates that the observed differences between groups are unlikely to have occurred by random chance and are therefore considered statistically significant. This result leads to the rejection of the null hypothesis () and suggests the presence of a real effect.
4.6. Numerical Model Validation
The numerical tools employed in this study—ANSYS AQWA and OrcaFlex—were validated through water tank experiments [26] on a 1:70 scale model of the DeltaFloat platform supporting a 10 MW turbine at National Cheng Kung University. Validation tests encompassed free decay, static offset, regular waves, and irregular waves. Natural period comparisons showed errors below 4% for heave (0.8%), roll (0.5%), and pitch (4.0%) in unmoored conditions, confirming the reliability of both codes for modeling platform hydrodynamics and mooring dynamics. The 15 MW platform evaluated in this study employs the same DeltaFloat semi-submersible concept, with column and pontoon dimensions scaled to accommodate increased turbine mass while maintaining a 20 m draft for the 70 m water depth site offshore Taiwan.
5. Numerical Model Result and Discussions
5.1. Free Decay Test
Since the mooring parameters differ across subsequent analyses, any modification to the mooring configuration directly influences the system’s natural behavior. Accordingly, the free-decay tests in this section are conducted without the mooring system installed, focusing on the six degrees of freedom governed primarily by the platform’s inherent restoring forces. Among these, Heave and Pitch are of particular interest, as they are less affected by mooring constraints and therefore provide a clearer indication of the platform’s intrinsic dynamic characteristics.
The objective of these tests is to identify the platform’s natural periods and to validate the accuracy of the numerical model, thereby ensuring sufficient reliability for the subsequent dynamic simulations. It is also essential to confirm that the natural periods remain well separated from the dominant wave periods in the target sea area, reducing the risk of resonance and enhancing overall structural safety, as illustrated in Figure 6.
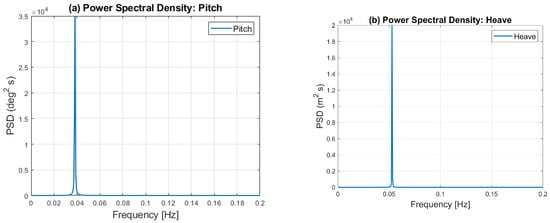
Figure 6.
Power Spectral Density results: (a) Pitch (natural period: 25.7 s); (b) Heave (natural period: 19.0 s).
5.2. Three-Line Mooring System Optimization
This study first establishes the baseline configuration of the three-line mooring system as the foundation for subsequent analyses. To evaluate and refine the design parameters, an environmental-direction sensitivity analysis is performed under co-directional wind, wave, and current conditions. This analysis identifies the incident angles that induce the maximum system responses (Figure 7), and the corresponding peak tensions across all incident angles are summarized in Table 8. In this study, values in the table are visualized using a warm color gradient, where higher values correspond to darker red shading.
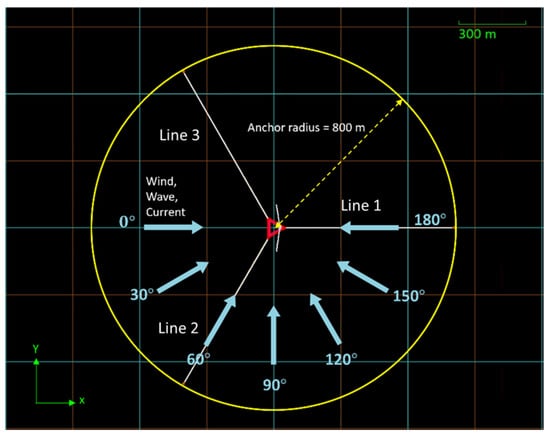
Figure 7.
Top view of the three-line mooring system configuration. (White lines: mooring lines; arrows: environmental loading direction; yellow circle: anchor radius.)
Table 8.
Maximum tension for L770 mooring configurations.
In operational practice, the platform heading is adjusted such that the predominant environmental loading corresponds to an incident angle of 0°. Based on the preceding environmental-direction sensitivity analysis, Line 2 is selected as the reference mooring line for tension comparison. The relationships between the key design parameters—mooring line length and chain diameter—are subsequently investigated, and their performance is evaluated using the defined Fitness metric. As shown in Figure 8, when the line diameter is fixed at 152 mm, increasing the mooring length leads to a pronounced reduction in the overall fitness value, with the minimum occurring at L770. This configuration therefore provides the most balanced performance across the criteria of maximum tension, horizontal offset, and platform inclination. Furthermore, when the mooring length is held constant at 770 m, varying the line diameter reveals that the D180 mm configuration yields the lowest total fitness value. Accordingly, the L770D180 combination is identified as the optimal design option.
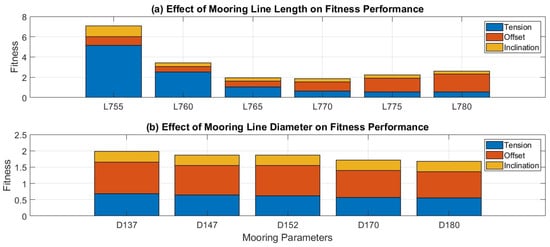
Figure 8.
Fitness performance comparison of mooring parameters in three-line system: (a) Effect of mooring line length on fitness performance; (b) Effect of mooring line diameter on fitness performance.
Overall, the three-line mooring system converges to an optimal configuration of L770 m line length and D180 mm diameter, providing a stable balance between tension control and platform motion performance under the 800 m anchor radius constraint.
To determine whether mooring line diameter and length are the dominant design parameters for this mooring system, we performed a combined sensitivity analysis. In this analysis, both parameters were varied simultaneously to observe their coupled effects on system performance. The goal is to validate whether the currently selected configuration represents the optimal setup for the three-line mooring system under the specified design conditions, and to provide a basis for further optimization if necessary.
In this analysis, the environmental incident angle is fixed at 0 degrees. However, for Line 2, based on the results of previous calculations, that which is aligned with the incident direction is selected as the reference for tension analysis. Variations in mooring line length or diameter have a minimal impact on platform inclination. Therefore, this parameter study will primarily focus on the comparison of mooring line tension and platform offset as the key performance indicators, as shown in Figure 9.
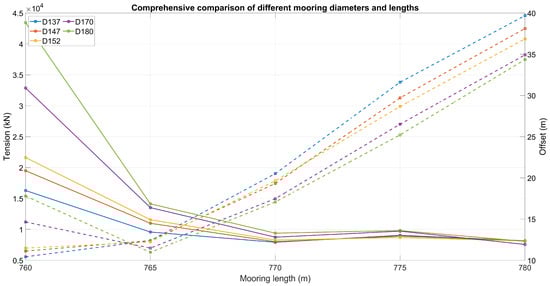
Figure 9.
Interaction effects between different mooring line lengths and diameters.
According to the results, increasing the mooring line length effectively reduces the maximum tension by relieving the system’s overall tension load. Nevertheless, this reduction comes with a corresponding increase in platform offset, which is consistent with the trends observed in previous analyses.
The results also reveal that mooring line length significantly influences the shape of the catenary segment. When the line length is relatively short (e.g., L760 case), the tension differences among various diameters (D137, D147, D152, D170, D180) are more pronounced. In contrast, when the line length increases to 780 m, these tension differences diminish, indicating a reduced sensitivity to diameter variations.
This suggests that in longer mooring configurations, the tension response is governed more by the shape of the catenary segment provided by the increased line length, rather than by the unit weight differences associated with varying line diameters. Therefore, it can be concluded that mooring line length is the dominant design parameter for catenary mooring systems in shallow-water applications.
It is worth noting that when the mooring line length is 760 m, the platform offset appears to be greater than that of the 765 m configuration when the mooring line diameter is increased (e.g., to D170 or D180). Upon further investigation, it was found that larger mooring line diameter enhances the restoring force during platform oscillation. However, with a shorter line length of 760 m, the catenary segment becomes relatively stiff and limited in flexibility, causing the swinging forces to be transmitted more directly and rapidly to the platform. This results in excessive oscillation, leading to an unexpected increase in platform offset that deviates from the general trend.
These findings highlight the importance of carefully balancing both mooring line length and diameter in the design of catenary mooring systems, particularly in shallow-water or space-constrained environments, to ensure optimal system performance and avoid undesirable motion amplification.
Additionally, the results reveal that the intersection points of the overall trend lines for tension and offset occur at a mooring line length of approximately 767.5 m, showing a slight deviation from the initially selected 770 m. Based on this observation, L767.5 and L770 are selected for further comparison in the next phase of the analysis to determine the optimal mooring line length configuration.
Following this, a quantitative comparison will be conducted using the Fitness parameter, focusing on the maximum values of each performance indicator such as tension and platform motion under the evaluated environmental load directions (from 0 to 180°), as shown in Figure 10.
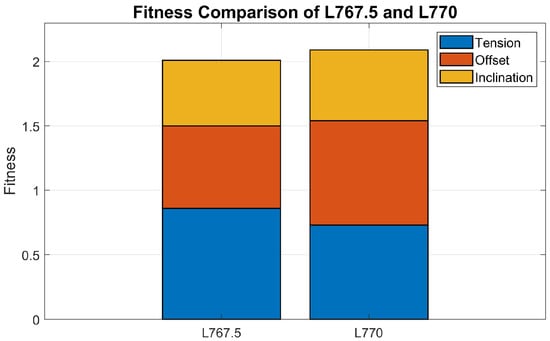
Figure 10.
Compare with L767.5 and L770 Fitness values.
5.3. Six-Line Mooring System Optimization
Based on the optimization results of the three-line mooring system presented in Section 5.2, although the configuration meets international standards, it still exhibits limited tension redundancy under certain incident angles. Additionally, recent studies [27,28] have highlighted that three-line mooring systems generally lack sufficient safety redundancy in extreme or accidental scenarios.
In response to these concerns, this section proposes the development of a six-line mooring configuration. The objective is to reduce tension concentration and improve safety redundancy by increasing the number of mooring lines, thereby enhancing the overall reliability and robustness of the mooring system, as shown in Figure 11.
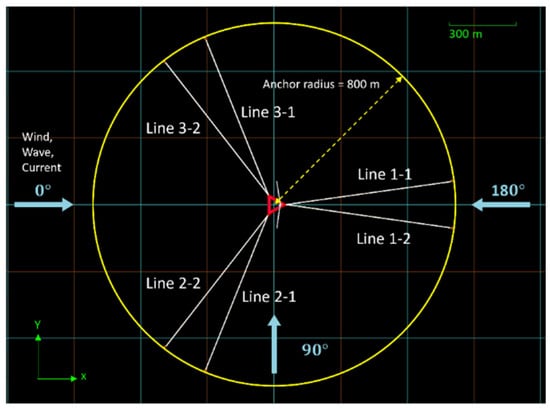
Figure 11.
Top view of the six-line mooring system configuration.
In a six-line mooring system, the environmental incident angle is fixed at 0 degrees, and analysis of a composite performance metric (combining mooring line tension, platform offset, and inclination) shows that mooring line length and diameter significantly influence overall system performance. Among the lengths examined, a 770 m mooring line (L770) achieves the lowest total fitness value, indicating the best balance of reduced tension, moderate offset, and limited inclination. In contrast, a shorter 760 m line (L760) produces excessive tension and deviates from the design trend and is therefore excluded from consideration.
Mooring line angles also play a crucial role in performance. Increasing the line deployment angle improves the system’s resistance to offset and inclination at the expense of slightly higher tension. Among the angles evaluated, a 30° line angle produces the lowest overall fitness value, representing the optimal trade-off, as shown in Figure 12.
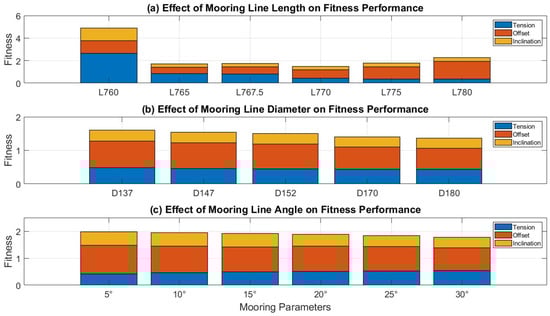
Figure 12.
Fitness performance comparison of mooring parameters in six-line system: (a) Effect of mooring line length on fitness performance; (b) Effect of mooring line diameter on fitness performance; (c) Effect of mooring line angle on fitness performance.
Building on the completed optimization process described above, the Fitness values of all mooring line design parameters will now be integrated to support the next stage of analysis. Recognizing that the previous configurations may have been inconsistent or not fully comprehensive, this section will expand the exploration to include a broader range of parameter combinations. The goal is to identify the final optimal configuration for the six-line mooring system, ensuring a well-balanced design that meets performance and safety requirements. The combination selection in this section will follow the approach of previous studies [29], utilizing the Design of Experiments (DOE) method to systematically recombine different parameters and revalidate the reliability of earlier results.
- Mooring line length will be selected based on the trend of decreasing tension, focusing on the 765, 770 and 775 m, where a significant tension reduction was observed.
- Mooring line diameter will be categorized into thin, medium, and thick specifically 137 mm, 152 mm, and 180 mm to comprehensively cover the design space.
- Mooring line angle will be selected as 15°, 20°, and 30°, based on the Fitness-integrated evaluation discussed earlier.
Environmental conditions will continue to be evaluated through a full environmental sensitivity analysis (Incident angle from 0 to 180°) to support a comprehensive assessment as shown in Table 9, Table 10 and Table 11.
Table 9.
Results of each configuration with a diameter of 137 mm.
Table 10.
Results of each configuration with a diameter of 152 mm.
Table 11.
Results of each configuration with a diameter of 180 mm.
After combining various mooring line diameters, angles between mooring lines, and line lengths, the results indicate that mooring line length has the greatest influence on the system’s overall performance. Configurations with a line length of L765 generally exhibited higher Fitness values, suggesting less favorable performance compared to other configurations.
The results also show that if the line is too short (e.g., 760 m), increasing the diameter can lead to a substantial rise in tension, resulting in a worse Fitness score than smaller-diameter configurations. As a result, tension limitations are no longer critical when the line length is properly proportioned.
Moreover, increasing the mooring line diameter further reduces platform motions, leading to better overall Fitness performance. Therefore, although the D152 was initially favored for cost-effectiveness, the D180 offers a comprehensively superior design in terms of structural reliability and system stability.
Among all the evaluated configurations, the D180A15L770 configuration demonstrates the best overall performance and is selected as the optimal six-line mooring system configuration for further analysis and design validation.
5.4. ANOVA Analysis
In Section 5.3, the optimal configuration for the six-line mooring system was identified, and the overall design trends were analyzed. Although the system’s performance has already been objectively evaluated using the quantitative Fitness assessment, it is important to note that, as demonstrated in Section 5.2, the three-line mooring system also meets the relevant regulatory requirements under the same evaluation criteria, despite showing a lower Fitness performance compared to the six-line configuration.
This observation suggests that the current six-line system may include overdesign redundancies that could be further optimized or simplified without compromising regulatory compliance or essential performance requirements.
To further clarify how different parameter combinations such as mooring line length, diameter, and angle between mooring lines influence Fitness performance within the six-line mooring system configuration, this section applies the ANOVA method. The objective is to quantify the influence of each parameter, verify its impact on system performance, and identify a mooring system configuration that achieves the best balance between performance and practicality. This analysis provides a solid foundation for the initial design and helps define key optimization directions for future mooring system development as shown in Table 12.
Table 12.
ANOVA results for main effects and interaction effects.
Based on the results of the ANOVA analysis, it can be concluded that a F-value indicates a greater influence of the corresponding parameter on the variation in the Fitness value of the mooring system. Among the single-parameter effects, mooring line length is identified as the most dominant factor, followed by the angle between mooring lines, with mooring line diameter having the least impact. Importantly, the influence of line length is found to be significantly greater than that of the other two parameters, confirming its critical role in mooring system performance.
In the two-parameter interaction analysis, the results further confirm that combinations involving mooring line length exhibit significantly higher F-value compared to interactions involving only diameter and angle. This finding reinforces the conclusion that mooring line length plays a dominant role in driving system performance variations, making it the most critical parameter to prioritize in mooring system design and optimization.
Furthermore, according to the p-value criteria referenced from Cowles & Davis, 1982 [30], when the p-value is less than 0.05, the effect is considered statistically significant, allowing the rejection of the null hypothesis that the observed effect is due to random chance. The results show that both mooring line angle and line length have statistically significant effects on Fitness performance, whether considered individually or through their interaction.
Therefore, based on the ANOVA analysis, this study further conducted main effect and interaction effect analyses to correct for biases introduced by other factors, while also accounting for interaction effects and addressing design imbalance through result normalization. The objective is to identify the Global Stable Optimal Configuration, representing the overall best-performing trend across various parameter combinations. This configuration will serve as the foundation for subsequent design refinements, with the goal of further reducing redundancy in the six-line mooring system as shown in Figure 13 and Figure 14.
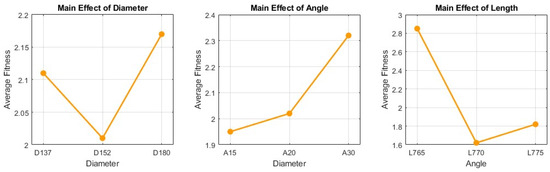
Figure 13.
Main effects plot of mooring parameters.
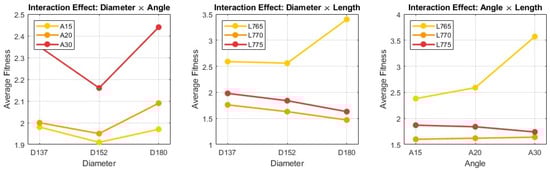
Figure 14.
Interaction effects plot of mooring parameters.
The purpose of the main effects plots is to examine the average influence of each individual parameter such as mooring line diameter, angle, and length on the Fitness value.
From the diameter main effect plot, it is evident that diameter variations have a significant impact on the Fitness value, with D152 identified as the optimal design choice. The angle main effect plot shows a clear upward slope from A15 to A30, indicating a strong main effect and suggesting that angle variations have a considerable influence on overall system performance.
Meanwhile, the length main effect plot identifies L770 a medium line length as the most suitable design point, balancing system stability and tension performance.
The purpose of the interaction plot is to explore whether two parameters interact in their influence on the Fitness value. In the diameter–angle interaction plot, the A30 trend line shows a significant increase under D180, indicating that the impact of angle varies depending on diameter. In the diameter–length interaction plot, the L765 trend line rises notably, while the L770 trend line remains relatively flat or shows a slight decrease, suggesting that the effect of diameter is not consistent across different line lengths. This finding reinforces the earlier observation in the three-line mooring system, confirming that diameter and length exhibit strong interaction effects and must be carefully balanced in the design process.
Lastly, in the angle–length interaction plot, the L765 trend line shows a sharp increase, indicating that shorter line lengths are more sensitive to angle variations. Based on these results, a slightly longer line length is recommended to enhance system robustness and reduce sensitivity to angle changes.
Based on the above analysis and the observed trends in the main and interaction plots, D152A15L770 is identified as the Global Stable Optimal Configuration. However, as noted in Section 5.4, the configuration with the lowest single-point Fitness value among all parameter combinations is D180A15L770, representing the single-point optimal configuration.
This distinction highlights an important insight from the main effects analysis: while D180 achieves the best Fitness performance under specific conditions (e.g., A15 and L770), it performs poorly under other conditions (such as A20 or L765). This suggests that D180-based designs are more sensitive and less stable when subjected to broader parameter variations.
In contrast, D152 demonstrates a lower average Fitness across all parameter combinations, indicating more consistent and reliable performance. This makes D152A15L770 the preferred choice for establishing a robust starting point for further tuning and optimization.
Therefore, considering both design reliability and tolerance to environmental variability, this study recommends D152A15L770 as the initial design configuration. This selection aims to achieve a balanced outcome between system performance and operational stability, providing a robust foundation for subsequent design refinement and optimization.
5.5. Asymmetric Mooring Design
Building on the ANOVA results presented in Section 5.4, this study identifies mooring line length as the dominant design parameter for catenary mooring systems in shallow water. Accordingly, the previously derived balanced configuration is adopted as the baseline for further design development.
Starting from this baseline, the mooring layout is modified by reinforcing the windward lines, which are aligned with the predominant environmental loading directions, while reducing the number of leeward lines. This asymmetric design approach is intended to eliminate redundant capacity and reduce overall system cost, while maintaining sufficient global stability and operational performance.
At the Taiwan Strait site, environmental conditions from October to March are primarily governed by the northeast monsoon, which represents both the most demanding normal operating conditions and the principal source of wind energy for power generation. In addition, the region is frequently affected by typhoons, and long-term observations indicate that a significant portion of typhoon tracks pass through the Taiwan Strait. These factors necessitate a mooring design that remains robust under both seasonal monsoon loading and extreme typhoon events.
To evaluate the structural strength and safety of the asymmetric mooring layout, numerical simulations are conducted under co-directional wind–wave–current loading. Taking advantage of the geometric symmetry of the floating platform, the analysis focuses on an incident wave angle of 0°, and a fitness indicator is employed to compare the performance of different configurations.
Based on the site-specific environmental conditions, a 2–2–1 asymmetric mooring configuration, hereafter referred to as the Asym system, is proposed. In this layout, the number of mooring lines on the windward and wave-facing sides is increased to enhance system response under northeast monsoon conditions. The initial lengths of both windward and leeward lines are set to the value previously identified as yielding the best fitness performance. This configuration ensures stable platform motion during normal operation as well as during typhoons approaching from the south, while effectively controlling line tension and platform offset. As a result, the proposed system supports reliable long-term operation, as illustrated in Figure 15.
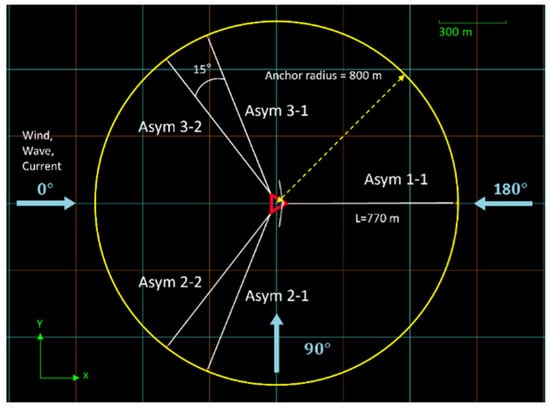
Figure 15.
Top View of asymmetric mooring system.
After establishing the initial Asym mooring system design, this study will proceed with further optimization to identify the best-performing asymmetric configuration. Building on the ANOVA analysis results, which highlighted mooring line length as the key parameter influencing mooring strength performance, this phase focuses on evaluating the effects of varying mooring line lengths. The objective is to refine the asymmetric layout and achieve improved system performance under site-specific environmental conditions.
Three design categories are defined based on different length arrangements:
- Type A: Equal line lengths on both the wave-facing and back-wave-facing sides
- Type B: Longer wave-facing lines and shorter back-wave-facing lines
- Type C: Shorter wave-facing lines and longer back-wave-facing lines
The range of mooring line lengths will follow the six-line mooring system design scope, i.e., from 765 to 780 m. Each test condition will be named using the format: Asym (Asymmetric mooring system)-Wave-facing line length (L)-Back-wave-facing line length (L), e.g., Asym-L770-L770 as shown in Table 13 and Table 14.
Table 13.
Classification combinations and test naming of asym mooring system.
Table 14.
Fitness performance comparison of asymmetric mooring configurations with various line length combinations (Types A, B, C) using D152 diameter.
Based on the evaluation of various mooring line length combinations across Types A, B, and C, it can be concluded that moderate adjustments to line length can further optimize overall system performance compared to uniform line length configurations. Among the three design strategies, the Type B asymmetric mooring system offers the greatest safety redundancy by balancing tension distribution and platform motion control.
Of all the configurations evaluated, Asym-L775-L770 achieved the best overall Fitness performance and is therefore identified as the optimal configuration for the asymmetric mooring system.
To further compare the performance of this optimal asymmetric configuration with the three-line and six-line mooring systems, the mooring line diameter in the Asym-L775-L770 configuration will be increased to D180, aligning with the benchmark diameter used in the previous evaluations. This adjustment aims to address tension-related concerns and validate whether the Fitness performance of this configuration better satisfies the design requirements when compared to the other mooring system alternatives, as shown in Table 15 and Table 16.
Table 15.
Fitness comparison between D152 and D180 diameters for the optimal asymmetric configuration (Asym-L775-L770).
Table 16.
Comparison of Fitness for different mooring configurations in ULS.
The design redundancy of this benchmark-adjusted configuration performs as expected, with its Fitness value falling close to that of the three-line mooring system. However, whether performance discrepancies may arise under other design scenarios remains uncertain and requires further evaluation.
To address this, the subsequent analysis will compare the optimal configurations of the three-line, six-line, and asymmetric mooring systems under different design conditions, including normal operating conditions and accidental line failure scenarios, to provide a more comprehensive performance assessment.
5.6. Regular Wave Test
The RAO is a commonly used dynamic response indicator for ships and offshore platforms. It characterizes the response behavior of a structure when subjected to external wave forces at different wave frequencies. The RAO quantifies the sensitivity of the platform to wave excitation across a range of frequencies, providing critical insights for marine structure design and dynamic performance analysis. Here, Z_a represents the motion amplitude at the center of gravity, and δ_a represents the amplitude of the incident wave, as defined by the following equation:
In this section, RAO analysis is conducted for different mooring system configurations. The analysis uses regular waves as the external loading condition, covering a wave period range from 2 s to 50 s, with simulations performed at 2 s intervals, resulting in a total of 25 wave period cases. In each simulation scenario, the wave height is set to 2 m with a fixed incident angle of 0 degrees, aiming to assess whether different mooring configurations cause the platform’s motion response to deviate from its original natural periods.
This analysis focuses primarily on the surge, heave and pitch degrees of freedom, which are critical to power generation efficiency and generator safety. The platform’s motion characteristics are recorded across a full range of wave periods, providing essential data for mooring system design and dynamic performance assessment, as shown in Figure 16, Figure 17 and Figure 18.
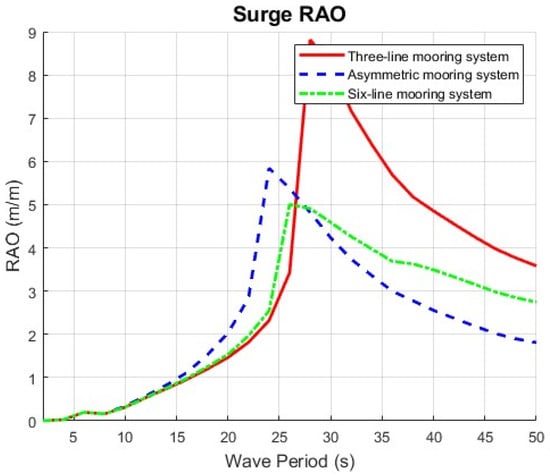
Figure 16.
Surge RAOs under different mooring configurations.
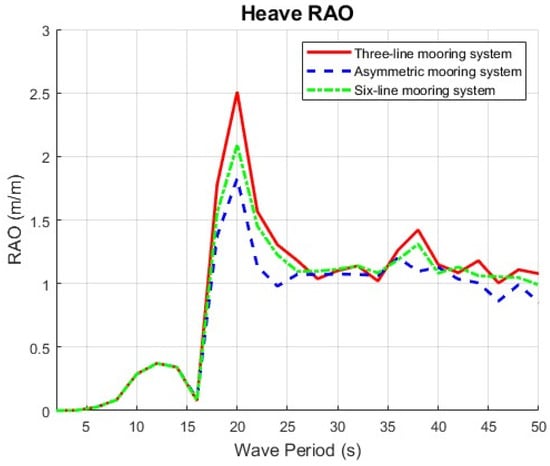
Figure 17.
Heave RAOs under different mooring configurations.
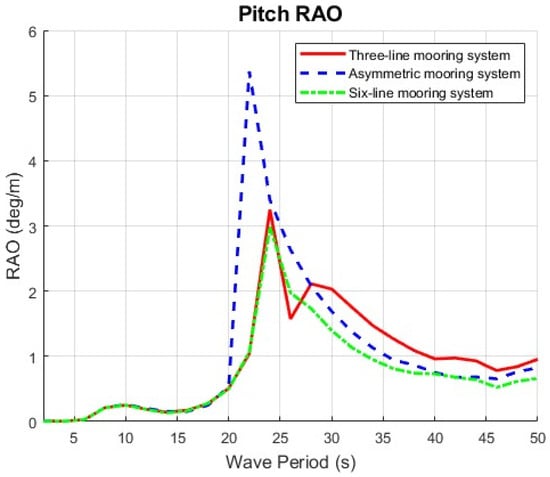
Figure 18.
Pitch RAOs under different mooring configurations.
The RAO analysis indicates that the heave motion response is only minimally influenced by the mooring configuration, although the number of mooring lines introduces different levels of vertical motion for the platform. In contrast, the surge and pitch responses show marked variations among the evaluated configurations. Since the restoring forces provided by the mooring system primarily govern the platform’s horizontal and rotational motions, differences in mooring layout lead to distinct surge and pitch response behaviors.
The peak surge and pitch responses occur at relatively short wave periods, with the peak locations shifting depending on the mooring arrangement. Among the configurations considered, the symmetric three-line and six-line systems demonstrate superior control of surge and pitch motions, as reflected by their lower peak RAO values. Their balanced load distribution also reduces the likelihood of shifting the platform’s natural periods, thereby contributing to improved dynamic stability.
5.7. Normal Sea State (SLS & FLS)
Based on the normal environmental conditions summarized in Section 3.2, it was observed that during the northeast monsoon season, the wind and wave directions are nearly co-directional, while the current flows from the opposite (leeward) direction. To better reflect real-world operational conditions, the environmental condition analysis in this chapter will adopt this specific wind–wave–current directional setup as the basis for performance evaluation as shown in Figure 19.
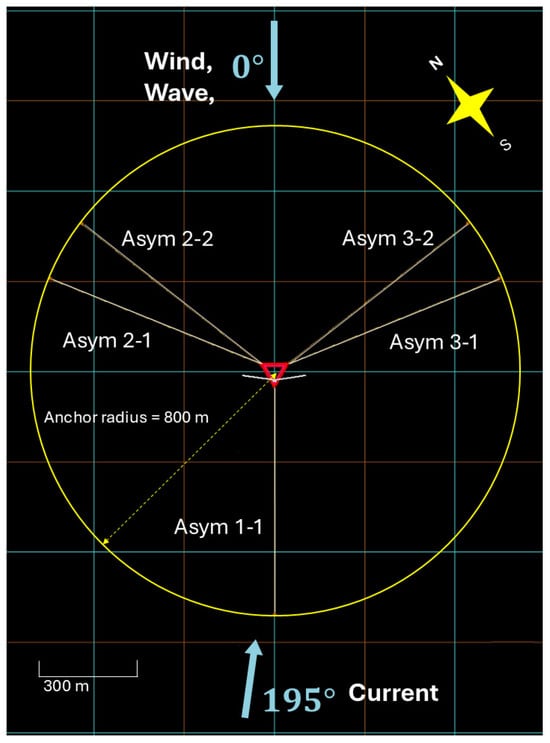
Figure 19.
Simulation setup configuration for normal environmental conditions.
5.7.1. SLS Design Scenario
For the SLS design assessment, the three-line, six-line, and asymmetric mooring system configurations will be evaluated using the deployment layout illustrated in Figure 20. Finally, the platform inclination response will be examined and verified to ensure compliance with operational safety and performance requirements, as shown in Figure 20 and Figure 21.
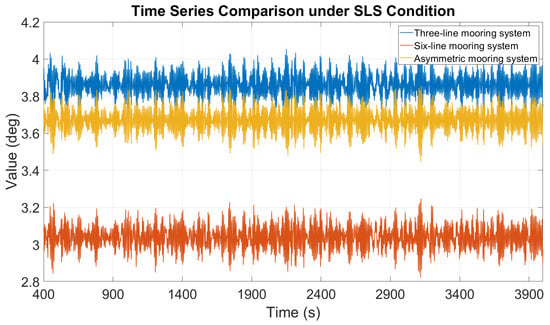
Figure 20.
Time series of inclination responses under normal environmental conditions.
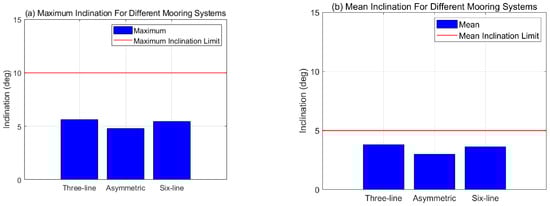
Figure 21.
Inclination statistics for different mooring configurations: (a) Maximum inclination; (b) Mean inclination.
Based on the design evaluation under normal environmental conditions, all three mooring configurations three-line, six-line, and asymmetric are confirmed to meet international regulatory standards. Notably, the asymmetric mooring system demonstrates superior performance in terms of both mean and maximum platform inclination when compared to the traditional three-line and six-line symmetric systems.
The analysis indicates that this enhanced performance is attributed to the four mooring lines on the windward side of the asymmetric system, which matches the restraint capacity of the six-line symmetric system in that direction, providing sufficient resistance against environmental forces. At the same time, the reduced number of mooring lines on the leeward side, compared to the six-line configuration, helps to minimize unnecessary mooring force, improving system efficiency.
As a result, the asymmetric mooring system maintains high strength on the windward side to counteract wind-induced platform motions, while the reduction in leeward mooring resistance enhances overall system performance, making it more efficient than the traditional six-line mooring system.
5.7.2. FLS Design Scenario
To assess the influence of mooring configuration on fatigue performance under normal environmental conditions, numerical simulations were performed at the rated wind speed, where wind loading dominates the fatigue response. Wave and current conditions were held constant according to the previously defined normal environment. Fatigue damage was quantified in terms of annual fatigue accumulation, allowing consistent comparison across different mooring layouts and wind directions.
The distribution of accumulated fatigue among individual lines within each configuration was analyzed to identify the most fatigue-sensitive locations, as shown in Figure 22, Figure 23 and Figure 24. The results indicate that, for both the three-line and six-line mooring systems, the upwind mooring lines exhibit the largest fatigue damage. The asymmetric configuration presents the highest fatigue levels overall: due to its nonuniform line arrangement, the single line on the weaker side (Asym 1–1) experiences disproportionately elevated loading, making it the dominant fatigue hotspot and a critical limitation of the asymmetric layout. Even so, aside from this weaker-side line, the overall fatigue performance of the asymmetric system remains broadly comparable to that of the six-line configuration, demonstrating that the proposed asymmetric layout can retain acceptable structural reliability while reducing mooring material requirements.
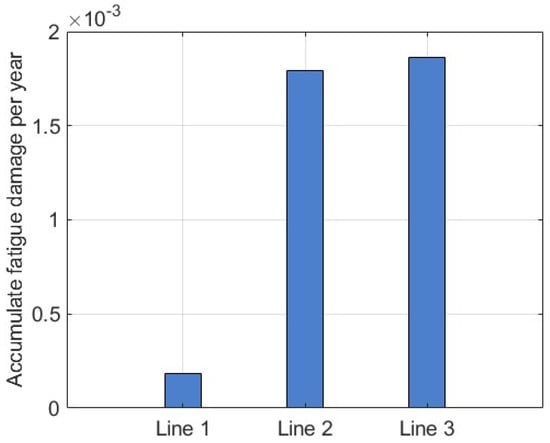
Figure 22.
Maximum fatigue damage per year on three-line mooring system.
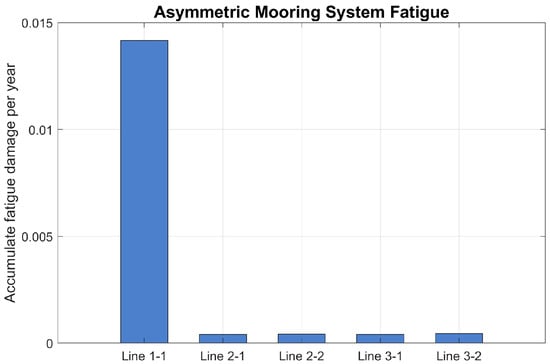
Figure 23.
Maximum fatigue damage per year on asymmetric mooring system.
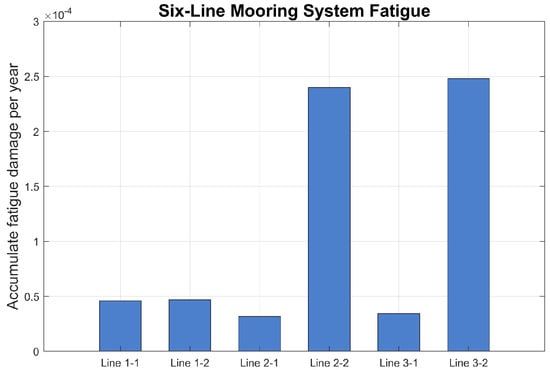
Figure 24.
Maximum fatigue damage per year on six-line mooring system.
5.8. ALS Design Scenario
For the evaluation of accidental scenarios, this study references the failure considerations proposed by (J. Huang et al., 2024) [31], which highlights the risk of unexpected mooring line failure. Two high-probability scenarios are considered: (a) Accidental line breakage during normal operation, caused by fatigue damage or external impacts such as vessel collisions. (b) Mooring failure under extreme environmental conditions, when the system lacks sufficient safety redundancy.
This section will further evaluate the mooring system’s performance based on relevant industry standards, with a focus on windward-side line failure, which represents the primary load-bearing direction. The objective is to verify whether the system can maintain sufficient structural integrity in the event of a line break, thereby preventing cascading failures, excessive platform offset, and potential collisions with navigation routes or other secondary hazards, as shown in Figure 25.
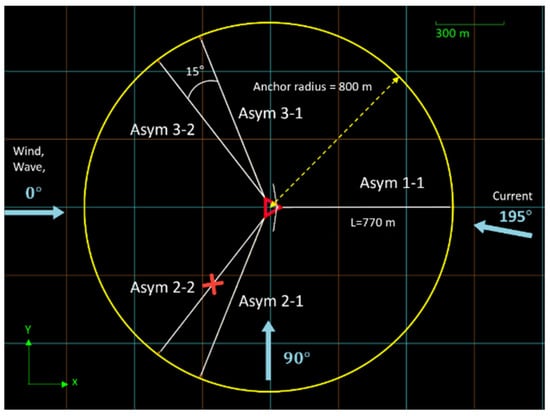
Figure 25.
Top view of the ALS mooring line failure scenario design.
5.8.1. Normal Operation Conditions
The design scenario under normal environmental conditions assumes that the wind turbine remains operational when an unexpected mooring line failure occurs, either due to external impacts or long-term fatigue damage. The primary objective of this evaluation is to determine whether the remaining mooring system can retain sufficient strength to resist the wind thrust generated by the turbine and the existing environmental loads prior to turbine shutdown. Successfully maintaining this balance is essential to prevent cascading mooring failures and excessive platform drift, which could compromise structural safety and operational continuity, as shown in Figure 26.
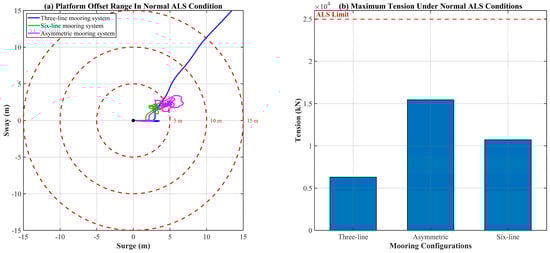
Figure 26.
Normal ALS scenarios: (a) Platform offset trajectories; (b) Maximum tension comparison.
Under the normal accidental line failure conditions, it is assumed that after environmental forces have stabilized, a mooring line failure occurs at 400 s. The results indicate that when a line fails in the three-line mooring system, the mooring restraint capacity is effectively lost, resulting in minimal remaining tension and the largest platform offset an undesirable outcome from a safety and operational perspective.
As a result, the ALS analysis focuses on comparing the asymmetric mooring system with the six-line mooring system. While the surge motion results show only minimal differences between the two configurations, a closer examination of the overall platform offset reveals that the six-line mooring system provides better restraining performance, maintaining a post-failure equilibrium position that is closer to the original operating location.
Upon further inspection, it was found that when line failure occurs in the asymmetric mooring system, the remaining configuration becomes 1–2–1, leaving one mooring line on both the failed side and the leeward side, while the opposite side retains two mooring lines. This imbalance in mooring line distribution causes the platform to shift further toward the upper right, resulting in slightly reduced restraining performance compared to the six-line mooring system, which maintains a more balanced post-failure configuration.
5.8.2. Extreme Environmental Conditions
According to the extreme conditions defined by DLC 7.1, the accidental mooring line failure scenario under turbine shutdown conditions will adopt the 1-year return period as the basis for environmental loading. The inflow directions will follow those defined for normal operating conditions, with co-directional wind and waves, and the current flowing in the opposite direction.
However, compared to normal operating conditions, the wind, wave, and current intensities in this scenario are significantly more severe. The objective of this design assessment is to evaluate whether the mooring system retains sufficient structural capacity to withstand these extreme and unexpected loads, ensuring the integrity and safety of the platform even under failure conditions, as shown in Figure 27.
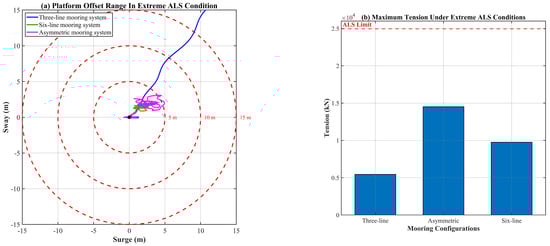
Figure 27.
Maximum offset and tension under extreme ALS design scenarios: (a) platform offset trajectories; (b) maximum mooring line tension comparison.
Under the extreme shutdown mooring line failure scenario, it was observed that both the maximum mooring tension and platform offset were lower than those recorded under normal operating conditions (with the turbine running). This outcome is likely attributed to the coupled effect of environmental loads and rotor thrust during operation, which imposes greater stress on the damaged mooring system compared to shutdown conditions.
In this scenario, the six-line mooring system once again demonstrated the best performance among the three configurations, providing superior platform restraint and tension control following mooring line failure. The asymmetric mooring system followed, showing acceptable but slightly reduced performance in comparison.
5.9. Cost Analysis and Comprehensive Comparison
In the cost analysis, this study considers only the mooring system, using the installed capacity of BlueFloat’s 1-GW floating wind project in the Taiwan Strait as the reference scale for comparing the cost requirements associated with different mooring configurations [32], see Table 17.
Table 17.
Cost estimation for different mooring configurations in a 1 GW wind farm.
For the estimation of mooring costs, the cost calculation methodology for R4-grade mooring lines is adopted, following the formulas and parameters provided in COREWIND D2.1 [22]. Because mooring system costs are primarily governed by material properties and the selected mooring configuration, the cost of an individual line can be evaluated based on its total weight. The corresponding calculation is expressed as follows:
Based on the cost calculations for the evaluated mooring configurations, using the three-line mooring system as the baseline representing the most cost-effective but highest-risk design it was found that the asymmetric mooring system, while offering slightly lower overall stability compared to the six-line system, can achieve a cost reduction of approximately 33%, significantly lowering overall project costs.
This study conducted a comprehensive evaluation of all three mooring configurations, starting from the initial optimized design under ULS conditions, through the normal operational scenarios of SLS and FLS, and including the accidental line failure assessment under ALS conditions. The evaluation concluded with a cost-based ranking applied to a 1 GW floating wind farm scenario.
Based on the ranking results, the proposed asymmetric mooring system demonstrates a well-balanced performance between safety and installation cost efficiency across various design conditions. This system may serve as a valuable reference for future mooring system design strategies, particularly in cost-sensitive floating wind developments as shown in Table 18.
Table 18.
Ranking of the different configurations under different design scenarios.
6. Conclusions and Future Works
This study investigates the Taiwan-developed 15 MW DeltaFloat floating wind turbine platform and its mooring system through numerical simulations. The mooring system was optimized and evaluated using environmental and parameter sensitivity analyses, with system and platform responses compared via a Fitness indicator and ANOVA to ensure objective, robust assessment.
The result shows that in pure-chain catenary systems in Taiwan’s shallow-water regions, mooring-line length is identified as the most critical design parameter, followed by line angle and diameter. Simply increasing diameter to satisfy international standards can raise MBL. However, it is a high-cost strategy rather than an optimal, performance-driven design. Thus, a combined approach that balances diameter selection with line length optimization can improve platform stability while reducing overall construction costs.
Building on these results, an asymmetric 2–2–1 configuration is proposed to reinforce the windward side while reducing leeward redundancy; under normal operating conditions, it shows better performance than traditional symmetric systems. Regular-wave RAO analysis indicates that increasing symmetrically arranged lines effectively limits platform motions and preserves natural periods, whereas asymmetric layouts may shift natural periods due to unbalanced forces, raising potential resonance risks with dominant wave frequencies. But under irregular-wave FLS scenarios, the asymmetric side with fewer lines experiences greater fatigue damage because of mechanically unbalanced load distribution, a consideration that warrants careful attention in future extended designs to ensure long-term structural reliability.
As for future work, this study proposes the following recommendations for improvements and future studies:
- Since the software used in this analysis is based on potential flow theory, its ability to capture viscous effects and nonlinear fluid phenomena is limited, even with damping compensation applied. It is recommended that future studies utilize Computational Fluid Dynamics (CFD) tools or conduct experimental validations to verify and refine the results.
- Future research is encouraged to expand the design scope by including hybrid mooring configurations and integrating machine learning techniques such as surrogate modeling and optimization algorithms to broaden the design space and address more diverse design considerations.
- In the final mooring system comparison, this study evaluates configurations based on different design scenarios and cost rankings. Future research is recommended to integrate data from actual project implementations or construction reports, and to apply varied design weighting factors to better reflect practical considerations in real-world offshore engineering assessments.
Author Contributions
R.-Y.Y.: Conceptualization, Methodology, Software, Validation, Investigation, Resources, Writing—review & editing, Visualization, Supervision, Project administration, Funding acquisition. S.-W.C.: Conceptualization, Methodology, Software, Validation, Investigation, Writing—review & editing, Visualization. N.-C.C.: Conceptualization, Validation, Investigation, Writing—review & editing, Visualization. C.-H.C.: Conceptualization, Methodology, Software, Investigation. All authors have read and agreed to the published version of the manuscript.
Funding
This research was funded by the National Science and Technology Council, Taiwan, grant number NSTC 112-2221-E-006-053-MY3.
Data Availability Statement
The original contributions presented in this study are included in the article.
Conflicts of Interest
The authors declare that they have no known competing financial interests or personal relationships that could have appeared to influence the work reported in this paper.
References
- McCoy, A.; Musial, W.; Hammond, R.; Mulas Hernando, D.; Duffy, P.; Beiter, P.; Pérez, P.; Baranowski, R.; Reber, G.; Spitsen, P. Offshore Wind Market Report, 2024th ed.; U.S. Department of Energy: Washington, DC, USA, 2024. Available online: https://www.nrel.gov/docs/fy24osti/90525.pdf (accessed on 6 May 2025).
- Global Wind Energy Council (GWEC). Floating Offshore Wind—A Global Opportunity; GWEC: Lisbon, Portugal, 2022. [Google Scholar]
- Tomasicchio, G.R.; Avossa, A.M.; Ricciardelli, F.; Musci, E.; D’Alessandro, F.; Vicinanza, D. Dynamic Modelling of a Spar Buoy Wind Turbine. In Proceedings of the 36th International Conference on Ocean, Offshore and Arctic Engineering (OMAE2017), Trondheim, Norway, 25–30 June 2017. [Google Scholar] [CrossRef]
- Campanile, A.; Piscopo, V.; Scamardella, A. Mooring design and selection for floating offshore wind turbines on intermediate and deep water depths. Ocean. Eng. 2018, 148, 349–360. [Google Scholar] [CrossRef]
- Li, B.; Qin, H.; Zhang, H.; Long, Q.; Ma, D.; Xu, C. Mooring Evaluation of a Floating Offshore Wind Turbine Platform Under Rogue Wave Conditions Using a Coupled CFD-FEM Model. J. Mar. Sci. Eng. 2025, 13, 1443. [Google Scholar] [CrossRef]
- Huang, W.H.; Yang, R.Y. Water depth variation influence on the mooring line design for FOWT within shallow water region. J. Mar. Sci. Eng. 2021, 9, 409. [Google Scholar] [CrossRef]
- Chen, J.; Wang, C.; Wu, X.; Feng, F.; Li, Y. Parametric Sensitivity Analysis of Mooring Chains of a Floating Offshore Wind Turbine in Shallow Water. J. Mar. Sci. Eng. 2024, 12, 2202. [Google Scholar] [CrossRef]
- Yue, Y.; Jin, X.; Zhou, P.; Wu, A. Layout Optimization of Redundant Mooring for Floating Offshore Wind Turbines. 2023. Available online: https://ssrn.com/abstract=4649113 (accessed on 6 May 2025).
- Formosa, W.; Sant, T. Modelling the loads and motions of a floating offshore wind turbine with asymmetric moorings. J. Phys. Conf. Ser. 2022, 2362, 012013. [Google Scholar] [CrossRef]
- Yu, Y.; Zhao, M.; Li, Z.; Zhang, B.; Pang, H.; Xu, L. Optimal design of asymmetrically arranged moorings in a floating production system based on improved particle swarm optimization and RBF surrogate model. Mar. Struct. 2024, 94, 103576. [Google Scholar] [CrossRef]
- Mulyadi, Y.; Purnawanti, Y.N.; Armono, H.D.; Mahdyansyah, M.H.; Syarifudin, M.R. Integrity and Safety Factors of Asymmetric Mooring Line Arrangement on Ocean Farm ITS. Int. J. Mar. Eng. Innov. Res. 2024, 9, 495–503. [Google Scholar] [CrossRef]
- Gaertner, E.; Rinker, J.; Sethuraman, L.; Zahle, F.; Anderson, B.; Barter, G.; Abbas, N.; Meng, F.; Bortolotti, P.; Skrzypinski, W.; et al. Definition of the IEA Wind 15-Megawatt Offshore Reference Wind Turbine Technical Report. 2020. Available online: https://www.nrel.gov/publications (accessed on 6 May 2025).
- Chen, N.-C. Nonlinear Stiffness Modeling for Hybrid Mooring Systems of Floating Offshore Wind Turbine. Master’s Thesis, National Cheng Kung University, Tainan, Taiwan, 2024. [Google Scholar]
- Karimirad, M.; Michailides, C.; Nematbakhsh, A. Offshore Mechanics: Structural and Fluid Dynamics for Recent Applications; John Wiley & Sons Ltd.: Hoboken, NJ, USA, 2018. [Google Scholar]
- DNV-OS-E302; Offshore Standards Offshore Mooring Chain. DNV AS: Høvik, Norway, 2022.
- DNV GL. DNVGL-ST-0119: Floating Wind Turbine Structures, Edition July 2018; DNV GL AS: Oslo, Norway, 2018. [Google Scholar]
- Su, Y.-S. Design and Analysis of Dynamic Cable Configurations for 15 MW Floating Offshore Wind Turbines. Master’s Thesis, National Cheng Kung University, Tainan, Taiwan, 2024. [Google Scholar]
- Chung, C.-H.; Kim, S.-S.; Yang, S.-H.; Chiang, T.-L.; Tsai, Y.-S.; Chu, C.-H.; Ou, C.-C.; Chen, C.-J.; Shen, Y.-C.; Li, Y.-Y.; et al. Floating Wind Power Generation Marine Engineering Promotion and System Technology Development Project; Technical Report No. 113-D0106; Ship and Ocean Industries R&D Center: New Taipei, Taiwan, 2024. [Google Scholar]
- ANSYS, Inc. Aqwa Theory Manual; ANSYS, Inc.: Canonsburg, PA, USA, 2024. [Google Scholar]
- Orcina. OrcaFlex Manual; Orcina: Ulverston, UK, 2024; Available online: https://www.orcina.com (accessed on 6 May 2025).
- DNV-RP-0286; Recommended Practice Coupled Analysis of Floating Wind Turbines. DNV AS: Høvik, Norway, 2019.
- Corewind. D2.1 Review of the State of the Art of Mooring and Anchoring Designs; Corewind: Brussels, Belgium, 2020. [Google Scholar]
- American Petroleum Institute (API). Recommended Practice 2SK: Design and Analysis of Stationkeeping Systems for Floating Structures; American Petroleum Institute (API): Washington, DC, USA, 2005. [Google Scholar]
- Rentschler, M.U.T.; Adam, F.; Chainho, P. Design optimization of dynamic inter-array cable systems for floating offshore wind turbines. Renew. Sustain. Energy Rev. 2019, 111, 622–635. [Google Scholar] [CrossRef]
- Fisher, R.A. Statistical Methods for Research Workers. In Breakthroughs in Statistics; Springer: New York, NY, USA, 1992; pp. 66–70. [Google Scholar] [CrossRef]
- Huang, Z.Z.; Chou, S.K.; Chung, C.H.; Wu, H.T.; Hsu, H.T.; Wu, Y.W.; Chiu, F.C. Investigation of Simulation and Tank Tests for Motion Behavior of Semi-Submersible Platform DeltaFloat With a 10 MW Wind Turbine. In Proceedings of the International Conference on Offshore Mechanics and Arctic Engineering, Melbourne, Australia, 11–16 June 2023; American Society of Mechanical Engineers: New York, NY, USA; Volume 86908, p. V008T09A050. [Google Scholar]
- Timmington, D.; Efthimiou, L. Mooring Systems for Floating Offshore Wind: Integrity Management Concepts, Risks and Mitigation; WFO: Seattle, WA, USA, 2022. [Google Scholar]
- Castillo, F.; Mechinaud Innosea, L.; Youssef Mahfouz Ustutt, M.; Willeke Ustutt, L.; Bredmose Dtu, H.; Borisade Ramboll, F.; Trubat Casal Upc, P.; Molins Borrel, C. Corewind D2.4 Design Practices and Guidelines for Mooring, Anchoring System Design; Corewind: Brussels, Belgium, 2023. [Google Scholar]
- Xie, S.; Kan, Y.; Li, Y.; Li, Y.; Jiang, S.; Song, M. Responses analysis and structural optimization of a semisubmersible platform based on the Taguchi experiment method. Ocean Eng. 2024, 306, 118074. [Google Scholar] [CrossRef]
- Cowles, M.; Davis, C. On the origins of the .05 level of statistical significance. Am. Psychol. 1982, 37, 553–558. [Google Scholar] [CrossRef]
- Huang, J.; Xu, H.; Chen, L.; Lin, K.; Guo, M.; Yang, M.; Rui, S. Analysis of Mooring Performance and Layout Parameters of Multi-Segment Mooring System for a 15 MW Floating Wind Turbine. Front. Energy Res. 2024, 12, 1502684. [Google Scholar] [CrossRef]
- Memija, A. EIA for BlueFloat’s 1 GW Taiwanese Floating Offshore Wind Project Gets Green Light. Offshore Wind, 9 October 2023. Available online: https://www.offshorewind.biz/2023/10/09/eia-for-bluefloats-1-gw-taiwanese-floating-offshore-wind-project-gets-green-light/ (accessed on 6 May 2025).
Disclaimer/Publisher’s Note: The statements, opinions and data contained in all publications are solely those of the individual author(s) and contributor(s) and not of MDPI and/or the editor(s). MDPI and/or the editor(s) disclaim responsibility for any injury to people or property resulting from any ideas, methods, instructions or products referred to in the content. |
© 2026 by the authors. Licensee MDPI, Basel, Switzerland. This article is an open access article distributed under the terms and conditions of the Creative Commons Attribution (CC BY) license.