Abstract
The global transition towards sustainable energy has accelerated the development and deployment of offshore wind turbines. Jacket foundations, commonly installed in intermediate to deep water depths to access available space and higher load capacities, are built to withstand intensified hydrodynamic loads. Due to their structural complexity near the seabed, however, they are prone to local and global scour, which can compromise stability and increase maintenance costs. While extensive research has addressed scour protections around monopiles, limited attention has been given to complex foundation geometries or even hybrid configurations that combine energy-harvesting devices with structural support. These hybrid systems introduce highly unsteady flow fields and amplified turbulence effects that current design frameworks appear to be unable to capture. This study provides an experimental characterisation of scour damage in riprap-protected jackets as well as additional tests for a hybrid jacket foundation. A novel adaptation of a high-resolution overlapping sub-area methodology was employed. For the first time, it was successfully applied to quantify the damage to riprap protections for a complex offshore foundation. Results revealed that, although hybrid jackets showed the capacity to attenuate incident waves, the scour protection experienced damage numbers (S3D) two to six times higher than conventional jackets due to flow amplifications. The findings highlight the need for revised design guidelines that can account for the complex hydrodynamic-structural interactions of next-generation marine harvesting technologies integrated into complex foundations.
1. Introduction
Offshore wind energy (OWE) is a significant contributor to the global energy transition, and the European Union has identified the sector as a key component in achieving climate neutrality by 2050 [1]. It has expanded rapidly in recent years, driven by competitiveness, technological maturity, increasing efficiency, and a steady reduction in the Levelized Cost of Energy (LCoE). For fixed offshore wind foundations (OWFs), scour represents a critical challenge that may compromise structural stability [2]. Riprap scour protections are commonly applied as countermeasures but represent a substantial share of the investment costs [3]. Optimising design guidelines is essential for achieving economic competitiveness while maintaining structural safety.
The concept of dynamic scour protection marked a significant advance over the well-established but conservative static approach. Dynamic protection depends on the size, geometry, layer thickness, and reshaping capacity of the armour layer units. The design is based on the damage number (Equation (1)), which was introduced by [4,5].
where N is the number of waves, g is the gravitational acceleration, d is the water depth, Um is the wave orbital velocity, Tm−1,0 is the energy wave period, s is the ratio between ρs and ρw, Uc is the current depth-average velocity, ws is the settling velocity, a0, a2, a3 and b0 are regression coefficients equal to 0.00076, −0.022, 0.0079, and 0.243, respectively, and a1 and a4 are coefficients for hydrodynamic conditions [5].
Unlike the static approach, based on critical shear stress [6,7], the dynamic design approach enables these limitations to be surpassed while providing less expensive alternatives by using rubble-mound material with a lower nominal diameter (Dn50). This reduces costs associated with materials, transport, and installation [2]. However, the S3D-based design approach is limited by a lack of diverse datasets, its focus on monopiles, and the restricted range of water depths and layer thicknesses used within the study by [5]. Later studies by [8,9,10] expanded the testing conditions and reported overlapping situations regarding stability limits, with failure occurring above the threshold of S3D = 1.0.
Presently, research related to scour and scour protection at complex-geometry and hybrid foundations has gained momentum. However, existing scour protection design approaches often neglect the structural complexity features of these foundations. Jackets have emerged as a consensus choice for increased water depths or locations with increased hydrodynamic conditions, due to their lightweight construction, higher stability, and adaptability under more intense hydrodynamic conditions [11,12,13,14,15]. According to [16], approximately 10% of the offshore wind turbines in Europe utilise jackets as their foundations. The bracings, joints, and secondary elements alter hydrodynamics by creating blockage effects, flow contractions, enhanced turbulence, and sediment transport gradients (Figure 1), leading to significant local scour [17]. Several experimental studies [13,14,15,18,19,20,21,22,23,24] aimed to contribute to an improved understanding of the complex scouring process at jackets, with some studies even comparing these interactions to those in monopiles.
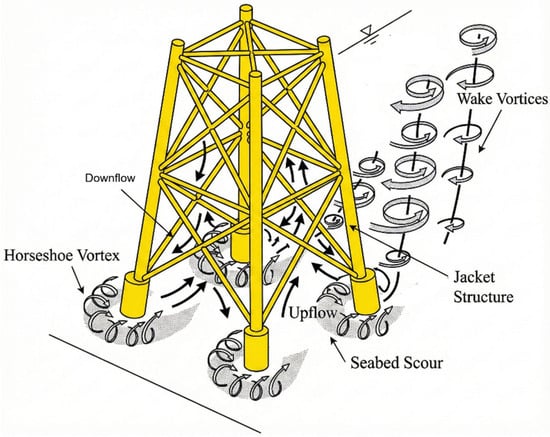
Figure 1.
Scour Patterns in a jacket foundation.
The research conducted by [19] showed that the equation developed by [25] was inadequate for predicting local scour around jacket-type foundations. The authors propose an empirical formulation to estimate the end scour depth (Send) under combined perpendicular wave-current loading at the piles, introducing structural parameters to represent the effects of flow obstruction that depend on the jacket leg position. Regarding temporal scour development, it was shown that the relationship between Ucw (wave-current velocity ratio) and T* (dimensionless time scale) differs significantly for the rear piles compared to a monopile. However, no method was provided to quantify this difference. It was further reported that in wave-dominated regimes, scour protections should be designed locally for each pile or reinforced with a higher thickness [20]. In contrast, in current-dominated regimes, protections should be extended across the entire footprint area. Additionally, a set of formulas was proposed to estimate the spatial global scour pattern, defined as the cumulative dimensionless erosion volume (VA,i), that enabled the quantification of eroded sediment volume over a specific area. This parameter can be directly converted into a mean scour depth, described as incremental erosion depth (DV,i), normalised over the jacket pile’s diameter (Djacket)—the equivalent of S/D (relative scour depth) for monopiles.
According to [21], minor variations in node elevation or brace distance can significantly affect scour depth and extent. It also shown that scour behaviour differs under different hydrodynamic regimes, highlighting the importance of structural geometry in estimating scour and in designing scour countermeasures. More recently, ref. [22] observed that under clear-water conditions, when the upstream shear stress is insufficient to initiate sediment motion, the flow was diverted outwards, producing higher scour rates at the outer pile edges. However, under live-bed conditions, when the upstream shear stress exceeds the critical shear stress, resulting in continuous sediment transport, flow acceleration beneath and between the structure truss became more prominent, shifting scour towards the inside edge of the piles.
The current-only tests conducted by [14] found that maximum scour occurs at the upstream piles, where the upper truss induces strong flow disturbances. In contrast, kinetic energy dissipation and sediment deposition result in lower scour depths on the leeside of the piles. The study showed that scour tends to increase with Uc, and for constant current velocity, scour may also increase for increased water depths. The research performed by [23] extended the work conducted by [14], using regular-wave-only conditions for the same structure, reporting that scour dynamics depend strongly on wave characteristics. Larger wave heights and periods enhanced near-bed velocities and scour rates, whereas increasing water depths reduced scour due to weaker wave-seabed interactions. Additionally, shorter wave periods promoted deeper scour holes in the upstream piles. In comparison, longer periods shifted maximum scour depths downstream of the piles, due to delayed interaction with the upper truss. Based on these studies, ref. [15] investigated combined wave-current conditions and found that the resulting flow fields exhibit strong non-linear characteristics. Scour was found to increase with both the Keulegan-Carpenter number (KC), as defined in Equation (2), and Ucw. Higher Ucw values shifted the dominant flow patterns from streamline contractions and wake vortices to horseshoe vortices. Moreover, while scour rates consistently increased with KC under clear-water conditions, in live-bed regimes, scour first increased and then decreased with higher KC values.
An equation developed by [24] was proposed to refine the prediction formula established by [19], emphasising the importance of additional experimental data in developing robust prediction methods.
Regarding scour depth comparisons between jackets and monopiles, ref. [19] compared their jacket experimental test results with those from monopile tests by [26], noting that lower scour rates were observed for jackets under similar conditions. However, opposite findings were reported by [14,23], as scour depths were found to be higher in jackets. These different observations highlight the uncertainty regarding the structural complexity of jacket foundations, leading [24] to conclude that geometrical features (structure transparency, pile distance/distribution, node distance to seabed), sediment characteristics, and hydrodynamic parameters—Uc, Um, Ucw, KC, water depth, and relative angle between waves and currents—are paramount to develop more accurate equations for such complex foundations.
Collectively, studies found in the literature address key scour parameters, including S/D, scour extent/width, T*, Seq (equilibrium scour depth), eroded volumes and areas, and scour behaviour under current-, wave-, and wave-current regimes. Although scour protections were not considered, the findings provide valuable guidance for creating future design guidelines by identifying scour patterns, depths, and volumes, thereby indicating where reinforcement is more critical. Comparisons to in situ measurements showed good levels of correspondence, supporting the reliability of the findings [27,28,29].
With the growing interest in these foundations, efforts have been made to develop scour protection design equations, since monopile-based formulations inaccurately predict and capture the damage around complex geometries. Therefore, some studies have tested scour protections for three-leg and four-leg jackets [13,30,31]. However, no universal guidelines were derived for the design of riprap scour protection systems.
The situation becomes even more severe when hybrid foundations are considered, as the interaction between the energy converters and the structural complexity of the foundations introduces additional challenges and uncertainties. Nonetheless, despite new risks associated with scour, instability, fatigue, and differential settlements, hybrid structures can improve energy yield per site per structure. To date, the application of scour protections to hybrid configurations remains unexplored, and the real effects of converter dynamics on the protection performance represent a significant knowledge gap [32]. A comparative analysis was provided by [33], evaluating riprap-protected monopiles against hybrid monopiles by incorporating an OSWEC. While the converter showed promise in incident hydrodynamics attenuation, its oscillatory motion substantially altered the local flow patterns (downflow, horseshoes, and lee-wake vortices), bed shear stresses, and pore pressure acting on the seabed and in the protection’s armour layer.
To help advance this field of research, the present study provides a comparative analysis of a square riprap scour countermeasure applied to both a four-leg jacket and a hybrid jacket. The S3D was predicted for different wave-current combinations, Equation (1), and then compared to the measured damage using a modified version of the overlapping-circle method developed by [34], which is used to characterise the damage in rubble-mound protections for marine and coastal structures, as a function of the eroded volume in each sub-area circle of the analysed mesh (Equation (3)).
A thorough analysis of all variables, including an examination of other empirical formulations for scour and deposition, was conducted to enhance insights that could aid in future extensions and generalisations of scour protections for complex structures. The results showed that existing monopile-based criteria, as defined by [4,5], fail to predict damage for complex foundations. For the jacket tests, the protection remained stable or presented dynamic behaviour without failure. In contrast, for most cases, the hybrid jackets exhibited irreversible damage to the armour layer due to pressure variations caused by the converter’s oscillatory motion, associated with enhanced flow patterns.
The authors acknowledge the importance of the topic to understand how scour, damage, and hydrodynamic interactions develop around complex and hybrid structures. Some of the core innovations and contributions presented in this study are summarised as follows:
- It establishes a thorough experimental campaign that applies riprap scour protections designed according to recommendations found in the literature to the entire footprint area of a jacket foundation, to evaluate their performance and to compare the damage results with existing design criteria, developed for monopile foundations.
- Performs one of the first physical model tests on protected hybrid jackets, by coupling an OSWEC to the foundation, comparing them to the jacket results to highlight disparities, to demonstrate how the OSWEC paddle’s oscillatory motion can modify the governing mechanisms of scour, influence turbulence, hydrodynamics, and be a key driver of armour-layer damage.
- Presents and successfully applies a novel adaptation of the overlapping-circle method suitable for complex foundations, allowing for improved analysis of damage distribution, as the use of fixed sub-areas often overlooks damage occurring in intersection sub-area zones.
- Suggests alternative metrics presented by [33] to better quantify and evaluate the performance of scour protections in complex offshore settings, which may successfully identify the correct protection behaviour.
The results and insights provided in this research regarding the design, applicability, and performance of riprap protections are expected to aid in the development of more effective scour mitigation strategies, thereby highlighting the need for design approaches that account for a broader range of offshore and marine infrastructures.
2. Materials and Methods
2.1. Experimental Setup
Experiments were conducted in a 29 m long, 1 m wide, and 1 m deep wave-and-current flume (Figure 2) at the Hydraulics Laboratory of the Hydraulics, Water Resources, and Environmental Division (LH-SHRHA) in the Faculty of Engineering of the University of Porto–FEUP (Portugal), which contains two sediment pits, with a length of 3.4 m, a width of 1 m, and a depth of 0.4 m. The infrastructure can reproduce regular, irregular, and solitary waves up to 0.25 m in height, with a maximum water depth of 0.7 m, due to its upstream piston-type design. Co-directional currents are produced by two-intake pipelines, achieving a Uc of up to 0.16 m/s for a target water depth of d = 0.4 m.
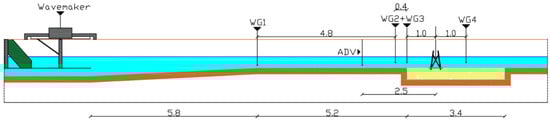
Figure 2.
Partial flume’s cross-section that represents the experimental setup, ADV, and wave gauge placement-dimensions in meters.
The experiments were conducted using a similar setup, geometric scale (1:50), and hydrodynamic conditions as in the research developed by [33], with incident waves propagating in the direction of the currents. Irregular waves were reproduced following JONSWAP spectrum with a peak enhancement factor γ = 3.3. The geometric scale was selected as the maximum feasible model size to fit the physical constraints of the wave-current flume while maximising the data resolution. The model follows a Froude (Fr) similitude to ensure the conservation of gravity effects, as gravity is the dominant driving force in free-surface flows and wave mechanics. However, when reproducing reduced-scale models, perfect similarity is unattainable due to inherent scale effects that arise from force ratios that are not identical between the model and the prototype, resulting in oversimplifications. One such case is the impossibility of simultaneously satisfying the Froude and Reynolds (Re) criteria, which relates to viscous-driven phenomena. According to ref. [35], scale effects resulting from the inaccurate scaling of the Re number can be mitigated for 103 < Re < 105, a condition that was satisfied as the experimental setup’s Re number was maintained within the range of 103 < Re < 104.
Furthermore, one of the major limitations in scour testing is related to sediment scaling. While non-cohesive sediments were used to match the prototype’s nature, the sediment size was not geometrically scaled to avoid introducing cohesive forces, which would be inconsistent with the prototype. Consequently, the dimensions of the ripples and the associated bed roughness are not geometrically scaled, which can contribute to potential deviations in sediment transport magnitude compared to prototype conditions. Minor scale effects related to the boundary layer and pile surface roughness are also acknowledged.
The free-surface elevation was recorded at 100 Hz by four resistive wave gauges positioned along the flume. One gauge was placed near the wavemaker, two gauges were positioned seaward of the model to measure the local wave conditions, and one final gauge was located on the leeward side to determine the effects of the model on wave transmission. Data from the gauges were used to estimate the Um value using a MATLAB (v.R2022b) routine developed by [36].
Flow velocities were measured using an Acoustic Doppler Velocimeter (ADV; Vectrino+, Nortek AS, Rud, Norway) with a sampling rate of 100 Hz. The ADV was positioned 2.5 m upstream from the model at an elevation of 0.16 m (0.4d) above the bed, with the x-axis aligned with the current direction. The location was chosen to avoid signal interference from the bed ripple migration and to capture undisturbed flow conditions. Additional sensors were excluded from the immediate vicinity (side/rear) and inside the structure due to spatial constraints of both the flume and the model, to avoid blockage effects that could potentially induce significant flow disturbances and signal interference with the downstream wave gauge. The target Uc values were calibrated during preliminary tests conducted without waves.
The model of a generic four-leg jacket-type was constructed using stainless steel. The structure featured a 0.33 m-wide platform, 2.5 mm pile diameters, and diagonal bracings of 1.5 mm—with no additional post piles and mud mats (Figure 3). The model was positioned 12 m from the wavemaker and 1 m from the leading edge of the first sediment box (Figure 2). The scour protection (Figure 4) was designed and constructed around the foundation with a square-shaped configuration with varying thickness. As suggested by [20], the armour layer thickness (ts) was reinforced around the piles, indicated by the red squares in Figure 5, to 5Dn50 (nominal median grain size) and 3Dn50 in the adjacent areas, a range consistent with the scour depths reported by [31]. The protection’s spatial extent covered 1.25 times the foundation’s footprint (1.5 times including slopes), based on the scour patterns and findings reported by [21].
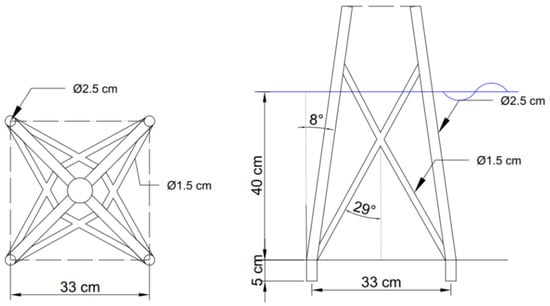
Figure 3.
Jacket physical model scheme (geometric scale: 1:50).
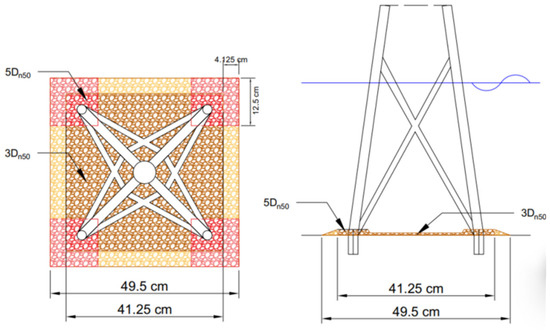
Figure 4.
Scour protection model scheme—red/pink colours: ts = 5Dn50; orange/brown colours: ts = 3Dn50 (geometric scale: 1:50).
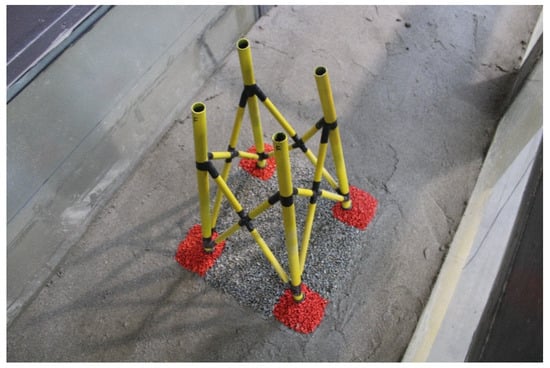
Figure 5.
Scour protection for the four-leg jacket model.
The armour layer material had a Dn50 = 3.696 mm, a density of ρs = 2666 kg/m3, and a grading ratio D85/D15 = 3, classifying it as a very wide grading material [37]. To visually track displacements, some stones around the piles were painted with different colours (Figure 5). A polypropylene geotextile with a surface density of 0.330 kg/m2 was first deployed as a filter layer, with the same area as the armour layer. The sediment bed was composed of sand with a median diameter of d50 = 0.215 mm, a density of ρs = 2590 kg/m3, and a geometric standard deviation .
One of the main objectives of this study was not only to investigate how scour develops for complex foundations, but also to address existing knowledge gaps concerning hybrid foundations. To evaluate the influence of a converter’s oscillatory motion, the same OSWEC device used by [33] was adapted to fit the jacket foundation model. The converter corresponds to a simplified version of the FOSWEC (floating oscillating surge wave energy converter), originally designed, constructed, and tested by [38,39,40]. In this setup, the OSWEC model was attached to a cut-off section of the jacket via a square, flat, perforated platform, locking all the converter’s body DOFs (Degrees-of-Freedom)—Figure 6 and Figure 7. A tip clearance, i.e., vertical distance between the converter’s bottom and the sediment bed, of 15 cm, was maintained (Figure 6 and Figure 7). Instead of incorporating a PTO (Power Take-Off) system, a simplified spring-based mechanism was implemented to limit the flaps’ pitch to a motion angle of ±25°, consistent with the maximum motion of the FOSWEC device [38]. This simplification followed the rationale used by [33], which prioritises the impact evaluation of the device on flow amplification and scour enhancement over the assessment of the converter’s power-harvesting capacity under the experimental conditions.
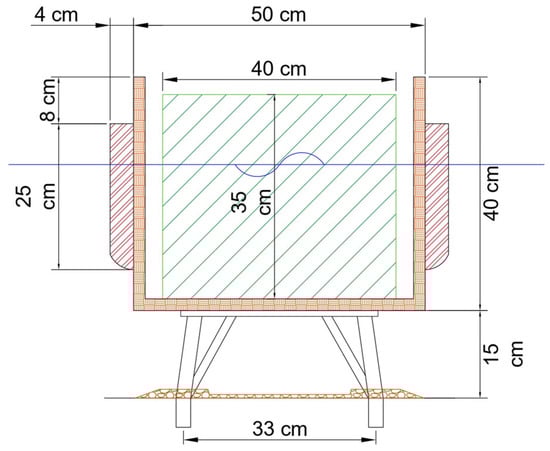
Figure 6.
Hybrid jacket model scheme (geometric scale: 1:50).
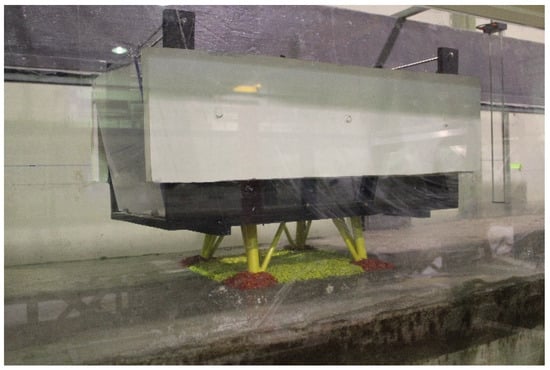
Figure 7.
Hybrid jacket model.
In the tip clearance region, beneath the keel of the OSWEC and the sediment bed, the reference blockage ratio of 1/6 proposed by [41] was maintained to ensure that the near-bed flow dynamics, which are critical driver of the scour process in this study, were affected by the OSWEC and by the distance of the device to the seabed, not by sidewall interference.
Overall, the present study provides insights into scour around complex and hybrid jackets, emphasising the hydrodynamic interactions that govern scour protection performance. It is expected that the results will contribute to advancing the understanding of the complex process for both marine and offshore structures, with implications for the design optimisation of scour countermeasures.
2.2. Experimental Procedures, Measurements, and Test Conditions
The seabed bathymetry and scour were measured using a FARO® Focus (FARO Technologies, Lake Mary, FL, USA) laser scanner, capable of capturing 2 million points/second, with a 3D precision of 2 mm at 10 m and a 1 mm standard deviation at a range of 10–25 m. The scanner enables the measurement and generation of high-resolution 3D Digital Terrain Models (DTM), providing an accurate representation of erodible areas and their surroundings. Scans were conducted before and after each experimental test, as well as for each 1000-wave train. Since the scanner’s precision is smaller than the armour layer’s Dn50, even small unit displacements and spot deformations could be reliably detected.
DTM post-processing was carried out using Autodesk ReCap and CloudCompare, resulting in precise point clouds of the sediment bed, scour protection, and the foundation model profiles. The DTMs were subsequently analysed to determine scour depth and S3D,measured values, through a MATLAB (v.R2022b) routine developed to adapt the overlapping-circle method to four-leg jackets and square-shaped scour protections. The methodology established by [34] was initially developed for monopiles and circular scour protection, utilising radial symmetry to define the mesh. While effective for circular cross-sections, this approach was not prepared to address other complex foundations and different protection geometries. In this study, we introduce a novel adaptation of this method, generalising the mesh-grid generation process to map onto complex, non-circular geometries. This approach allows the method to be applied to a wide range of marine and offshore structures, independent of their geometric complexity. To the author’s knowledge, this was the first successful application of this mesh-based approach to a complex scour protection-foundation setup. Complementary visual observations and photographic records were systematically collected to support and validate the results obtained and to compare the observed material displacements to the measured damage.
The hydrodynamic conditions used in this study (Table 1) were based on those of ref. [33], allowing for a comparison of scour effects on protection for offshore foundations with different geometries. These conditions covered different ranges of Ucw and KC. Each test was conducted for up to 3000 waves, unless premature failure of the scour protection occurred. Three types of hydrodynamic conditions were used for the jacket (J) and hybrid jacket (JH): irregular waves combined with co-directional currents (WC), irregular waves-only (WI), and regular waves-only (WR). For the selected hydrodynamics and scour protection configurations, different responses of the scour protection were anticipated, mainly ranging from stable to dynamic behaviour, and possible failure for the hybrid jacket.

Table 1.
Physical model hydrodynamic conditions (geometric scale: 1:50).
2.3. Method of Analysis
The analysis of the experimental results combines high-resolution spatial damage quantification with novel methodologies and comparisons to existing predictive formulas, as well as the assessment of alternative performance-aligned scour metrics. As previously mentioned, the damage quantification utilises an adaptation of the overlapping-circle method [34]. The method was developed to characterise damage in circular rubble mound scour protections for monopiles. It was demonstrated that the resulting S3D was highly sensitive to the selected grid ratio (ηS3D,grid).
The effectiveness of the technique has been recently applied to both a monopile and a hybrid monopile by [33], concluding that the analysis of the maximum damage (S3D,max) across different grid ratios was effective when compared to other methods [5,42]. The results obtained by [33] also confirmed that the sensitivity of the grid ratio by performing a statistical evaluation of the standard deviation and the 95th percentile (P95) of the damage number, concluding that the optimal value converges to a grid ratio interval of 1/6 to 1/4, aligned with the findings reported by [34].
Despite the method’s flexibility in accommodating complex scour protection geometries and foundations, the methodology was shifted from the original radial discretisation centred on the monopile to a linear vertex-initiated grid generation. This approach builds the mesh row by row from the protection’s upper boundary, ensuring spatially homogeneous overlapping distances across the entire domain. While this topology minimises data noise and complies with the overlapping distance defined in the inputs, it presents challenges related to discretisation near the piles when using large sub-areas. By reducing the sub-areas (Asub) of the circles, a mesh refinement is generated locally, thereby increasing resolution and accuracy in the critical zones immediately surrounding the piles.
In addition, alternative performance-aligned scour metrics, S/ts (scour depth relative to the scour protection thickness) and S3D/ns (damage number relative to the number of rock stone layers), will also be evaluated. The S/ts and S3D/ns ratios provide a more accurate and straightforward indicator of scour protection performance in complex wave-current hydrodynamics [33]. By shifting the relative reference from the foundation diameter to the protection thickness, these metrics provide a more accurate representation of the riprap state and the performance of the scour protection. Specifically, they offer a more reliable basis for future design approaches by moving beyond the S/D and S3D thresholds of 1.0, which are often limited in scope.
Given the inclusion of a WEC as part of the hybrid jacket, a hydrodynamic analysis could also provide valuable information. As the focus of this study was not on the WEC’s performance or efficiency, but instead on the influence of the device on its surroundings, particularly its potential to modify flow patterns and therefore the potential to enhance scour, only two simple metrics, the wave transmission coefficient (Kt) and the wave reduction coefficient (KRed), were measured. These coefficients will provide insight into the modifications in the flow field induced by the presence of the WEC, offering an understanding of the coupling effects of integrating a WEC into an offshore foundation.
3. Results
3.1. Damage Number (S3D)
For all the tests, the overlapping-circle technique was applied using a and an overlapping distance of 50%, as described by [34], allowing for an objective quantification of the scour protection damage under each test condition. Table 2 summarises all the measured conditions. The Ucw values distinguish the wave-dominated tests (Ucw < 0.44) from the current-dominated tests (Ucw > 0.44). The novel yielded high-resolution representations of the scour patterns, showing high accuracy in measuring S3D values and representing the damage’s spatial distribution (see Appendix A). As expected, S3D generally correlates highly with the intensity of the hydrodynamic load. For low-energy conditions, the S3D,max values were lower and increased with higher wave heights and periods. Also, when comparing the results of the wave-only tests (J_WI vs. J_WR and JH_WI vs. JH_WR), the S3D values were slightly higher when using regular waves, aligned with a study performed by [43] concerning a rubble-mound structure, which attributed these differences to the fact that the root-mean-square wave height (Hrms) for irregular waves tends to be smaller than the wave height for regular waves.
Table 2.
Experimental measured conditions for scour protection tests—model values.
Under all tested hydrodynamic conditions, the scour protections associated with the jacket test configurations (J_WC, J_WI, and J_WR) demonstrated consistently lower damage rates when compared to those in hybrid jackets (JH_WC, JH_WI, and JH_WR), as evidenced in Figure A1, Figure A2, Figure A3, Figure A4, Figure A5, Figure A6, Figure A7, Figure A8, Figure A9, Figure A10, Figure A11, Figure A12, Figure A13, Figure A14, Figure A15, Figure A16, Figure A17, Figure A18, Figure A19, Figure A20, Figure A21 and Figure A22 and Table 2. In alignment with the findings of ref. [33], the hybrid configuration exhibited pronounced scour deformations, particularly under moderate to high hydrodynamic regimes. The damage amplification was both quantitatively measured and visually confirmed, correlating high S3D values with severe sediment displacement, extensive washout of the armour layer material, and substantial sinking of the seabed beneath the filter layer (Figure 8).
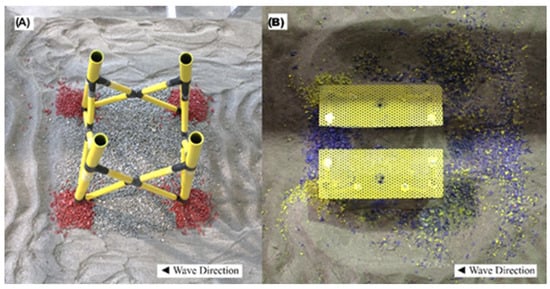
Figure 8.
Comparison of scour protection damage under wave loading: (A) J_WR_14_1000 (Jacket) and (B) JH_WR_14_1000 (Hybrid Jacket). The hybrid jacket visualisation represents the final state following extensive armour layer deformation, after only 1000 waves.
The damage number in the hybrid jackets was increased by factors ranging from 1.71 to 6.23 (Table 3), suggesting that the hydrodynamic interaction induced by the WEC exerts a significantly more destabilising influence on the scour protection integrity than the geometric complexity of the jacket structure alone.
Table 3.
Damage amplification comparison between jacket and hybrid jacket tests.
For most of the hybrid jacket tests, failure occurred within the first 1000 waves, with a damage number significantly above the S3D > 1.0 failure threshold. The only hybrid test that provided scour protection support and successfully endured the flow-enhanced patterns for the duration of all 3000 waves was the JH_WC_7. In this test, the initial visual inspection suggested a static behaviour (Figure A16, Figure A17 and Figure A18), as no intense movement of the armour layer units was observed. However, the measured damage number (Table 2) indicated a value significantly above the S3D > 0.25 static threshold defined by [5], due to edge scour occurring on the leeward side of the protection. Therefore, the protection was visually deemed to be on the edge between the static and dynamic behaviour.
Although sediment-flow-structure interactions in jackets have been well reported in the literature, the results obtained for the hybrid jackets confirm that the OSWEC body and the oscillatory movement of its paddles are responsible for enhancing the flow patterns that contribute to scour dynamics. The oscillatory movement of the front paddles appears to enhance downward pressures, downflow, and horseshoe vortices. In contrast, the movement of the downstream paddle seems to strengthen the intensity of the lee-wake and counter-rotating vortices. Moreover, due to the dimensions of the WEC, the approaching flow conditions increase the streamline contractions around and beneath the device.
As for the jacket foundation, the scour protection retained its effectiveness throughout the entire experimental test (all 3000 waves), demonstrating an apparent static behaviour for the first two tested conditions and a dynamic behaviour for the remaining conditions. However, for the J_WC_15.5 and J_WR_14 tests, the protection almost reached failure in the back-pile region (see Appendix A Figure A9 and Figure A15). For the jacket test set, the measured damage number failed to be within the static and failure thresholds defined by [5] when classifying the scour protections according to the level of deformation and visual classification.
The highest S3D,max values in this study were associated with increased wave heights and longer wave periods, as observed by [23]. When analysing the damage distribution near the pile reinforced region in jacket-only configurations, using parameters such as the mean damage, the 90th or 95th percentile, the results indicated that the front pile region was more affected by scour when subjected to waves with shorter peak periods. For larger Tp values, the same parameters pointed out that the most affected regions shifted to the rear-pile area (Table 4), an observation also reported by [23], except for the J_WI_14 test, where damage had a distribution very similar in value but with a slight edge to one of the front piles.
Table 4.
Dependency of the most affected area on the peak period (Tp).
The observed shift in the most damaged zone from the front to the rear-pile region with increasing wave height and peak period could be attributed to a transition in the most dominant scour mechanism. Under lower Hs and Tp conditions, damage is primarily driven by local horseshoe vortices formed at the front piles, while rear piles benefit from a sheltering effect provided by the upstream structural elements. Conversely, under more energetic conditions, the interaction between the flow and the jacket’s structural elements intensifies. This results, on the rear pile region, in stronger wake vortices shedding, more pronounced horseshoe vortices, and a significant increase in streamline contractions between the legs and around the edge of the protection. The consequent flow acceleration and amplification of turbulence and shear stresses acting in the wake region of the scour protection explain the higher damage rate observed in the rear section of the jacket foundation.
In contrast, the hybrid jackets consistently exhibited massive damage rates at the front piles across all test conditions. Test JH_WC_15.5 (Figure A20) revealed extensive damage to both the front and rear piles, although the front was affected more significantly. These findings suggest that the integration of the WEC fundamentally alters the scour distribution pattern, may diminish the influence of the peak period, and induce intensified scour rates at the frontal areas.
A distinct disparity was observed between the S3D,max and the S3D,predicted, Table 2, using the formula developed by [5]. Overall, predictive values underestimate scour for both the jacket and the hybrid jacket. For the hybrid jacket foundations, the difference was even more noticeable. The underestimation could imply that the formula is not well-suited for complex geometry foundations, that it does not account for nonlinear elements related to intricate hydrodynamics in hybrid systems, or that the measuring sub-areas approach between the two methods is inherently different. Moreover, the differences between the measured and predicted values also illustrate the fundamental approach distinctions between the methodologies developed by [5,34]. The former employs fixed sub-areas equivalent to the monopile cross-section, averaging the scour depth over larger regions and neglecting the protection thickness, and is thus only applicable to circular geometries so far. In contrast, the latter employs mobile, overlapping sub-areas of predefined size, allowing for higher-resolution damage assessment.
3.2. Overlapping Grid Ratio
The damage assessment methodology originally established by [34] was predicated on the radial symmetry of monopile foundations and circular scour protections. While effective for circular cross-sections, this radial approach lacks the versatility required for the complex, non-circular geometries utilised in this study (e.g., multi-pile foundation and squared protection layout). To overcome this geometric constraint, a novel adaptation of the algorithm was developed, transitioning from a structure-centred radial grid to a linear, vertex-initiated topology (Figure 9). This approach generates the mesh row by row from the protection’s boundary, ensuring spatially homogeneous overlapping distances across the entire domain. Furthermore, to resolve discretisation challenges near the piles’ interface, local mesh refinement can be applied by reducing the sampling sub-areas, thereby maximising resolution and accuracy in these critical zones. As previously mentioned, to the authors’ knowledge, this constitutes the first successful generalisation of the overlapping-circle method to complex scour protection-foundation combinations.
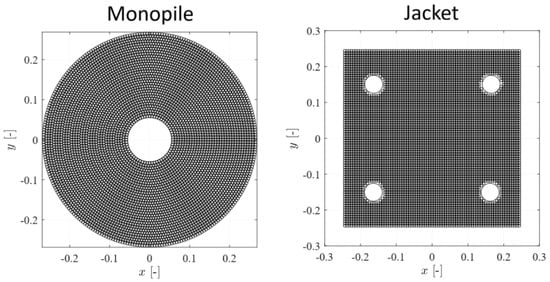
Figure 9.
Overlapping-circle method sub-area arrangement for different structures (Asub = 4).
It was demonstrated by [34] that the computed damage number was susceptible to the grid ratio. Therefore, an analysis of the S3D,max variation across different ηS3D,grid was conducted. Additionally, since the maximum damage number corresponds to the value at the deepest point within the scour protection, a statistical assessment of the standard deviation and the 95th percentile of the damage number was performed to assess potential convergence behaviour.
The selected grid ratios encompassed a wide range of Asub values, Figure 10, including the jacket pile cross section, Apile_jacket, as in ref. [6], as a metric for possible detection of spot deformations, and several others that represent multiple arrangements of armour layer units (nDn50 × nDn50 or nDn50 × mDn50).
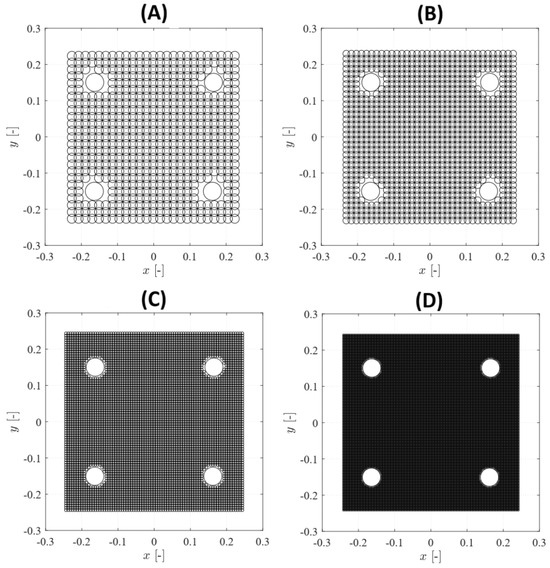
Figure 10.
Overlapping-circle sub-area arrangement for different ηS3D,grid: (A) ηS3D,grid = 2.78 × 10⁻², Asub = Apile_jacket; (B) ηS3D,grid = 1/20, Asub = ; (C) ηS3D,grid = 1/4, Asub = 4; (D) ηS3D,grid = 1, Asub = .
Modifying the grid ratio affects the number of elements analysed, resulting in significant variations in S3D,max, and considerable variations in the accuracy of measurements near the piles. Higher grid ratios, corresponding to smaller Asub and more elements analysed, produced scour representations that closely match the detailed topography obtained from DTMs. In contrast, lower grid ratios, which are associated with larger Asub and fewer elements analysed, can be less accurate and exhibit difficulties in properly representing overlapping elements near the corners and around the piles. Figure 11 illustrates this effect for the J_WI_14_3000 case, where a considerable variation in the damage number was observed for different ratios: for Asub = Apile_jacket, the larger sub-area and least amount of elements analysed, a S3D,max = 3.21 was obtained, whereas for Asub = , the smaller sub-area and highest amount of analysed elements, a S3D,max = 5.14 was registered, representing an increase of almost 64%—a possible result of localized, possibly a spot deformation with negligible filter exposure.
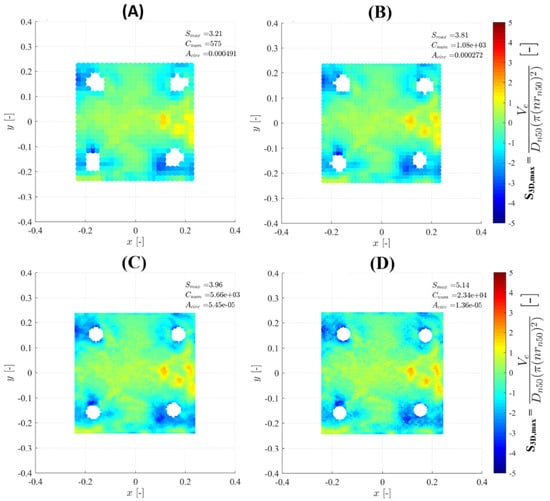
Figure 11.
Influence of ηS3D,grid on S3D,max value (J_WI_14_3000): (A) ηS3D,grid = 2.78 × 10⁻², Asub = Apile_jacket, S3D,max = 3.49; (B) ηS3D,grid = 1/20, Asub = , S3D,max = 3.40; (C) ηS3D,grid = 1/4, Asub = 4, S3D,max = 3.96; (D) ηS3D,grid = 1, Asub = , S3D,max = 5.14.
Figure 12 (jacket) and Figure 13 (hybrid jacket) plot the S3D,max vs. ηS3D,grid results present in Table A1 (jacket) and Table A2 (hybrid jacket). Both plots reveal a dependence and positive correlation between the two variables, which aligns with the findings reported by [34]. This demonstrates that the grid ratio needs to be carefully selected, as it can provide a wide range of outcomes, which may result in different interpretations of scour protection behaviour. The results support the need to develop a universal failure criterion for assessing scour protection performance.
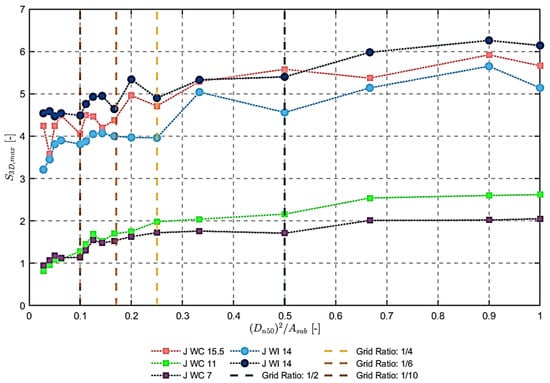
Figure 12.
Variation in S3D,max with ηS3D,grid—Jacket Tests.
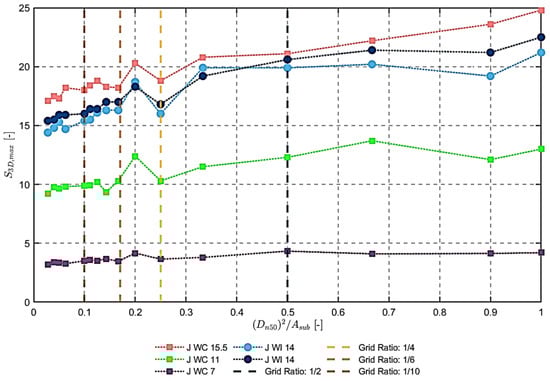
Figure 13.
Variation in S3D,max with ηS3D,grid—Hybrid Jacket Tests.
The S3D,max growth for the jacket foundation in Figure 12 resembles a logarithmic trend from ηS3D,grid = 2.78 × 10⁻² (Asub = Apile_jacket) to ηS3D,grid = 1/4 (Asub = 4). For the highest wave conditions tested, the damage number shows an erratic variation in this interval. From ηS3D,grid = 1/4 to ηS3D,grid = 1 (Asub =), in general, S3D,max follows a linear trend. The hybrid jacket (Figure 13) exhibits a linear increase in S3D,max, primarily due to the extreme damage suffered by the scour protection and seabed throughout almost all grid ratios and test conditions. For both foundations, a localized spike is seen for ηS3D,grid = 1/5 (Asub = 5 in most of the tests.
Based on the results, the most suitable range of grid ratios and sub-areas values to accurately determine the protection’s S3D in foundations and protections with a complex geometry, seems to be located within the ηS3D,grid = 1/8 (Asub = 8) to ηS3D,grid = 1/4 (Asub = 4) range, except ηS3D,grid = 1/5 (Asub = 5). The ideal range for monopiles and common scour protection geometries was determined by [33] to be ηS3D,grid = 1/6 (Asub = 6) to ηS3D,grid = 1/4 (Asub = 4), with the same ηS3D,grid = 1/5 exception. As a result, both findings align with previous research performed by [34], supporting the adaptability of the overlapping method to various foundations and scour protection geometries. Albeit, since low grid ratios, i.e., high Asub values, exhibit difficulties in properly representing and overlapping elements near the corners and around the piles in complex foundations and squared protections, ηS3D,grid = 1/4 (Asub = 4) seems to be the most suitable grid ratio-sub-area selection to be applied independently of the foundation and scour protection’s configuration. Hence, it implies that the failure criterion set by [6] may still be, in fact, the most reasonable cut-off threshold to identify failure correctly.
The standard deviation (Figure 14) and the 95th percentile (Figure 15) of all S3D,sub values were plotted against the jacket tests to confirm the convergence behaviour across all grid ratios analysed, since S3D,max appears to be particularly sensitive to small fluctuations in ηS3D,grid. Up to ηS3D,grid = 1/4, both metrics show a slight logarithmic trend, followed by a nearly linear trend beyond this point. Predominantly, there is marginal variation for grid ratios above 1/6, and even above 1/10 in 4 out of the five conditions tested for the 95th percentile (Figure 15). The evolution of these statistical metrics as a function of the grid ratio shows considerably less variability than S3D,max, providing a clear indicator of damage convergence. Both these metrics are beneficial since they are less affected by small fluctuations in the scour pattern, such as spot deformations or the displacement of a single armour layer unit. As a result, incorporating the standard deviation and 95th percentile assessment ensures a more robust damage evaluation that does not rely solely on the damage number, while confirming that convergence is reached for the selected grid ratio and the respective sub-area. Overall, the overlapping-circle method has a negligible impact on the convergence of statistical parameters.
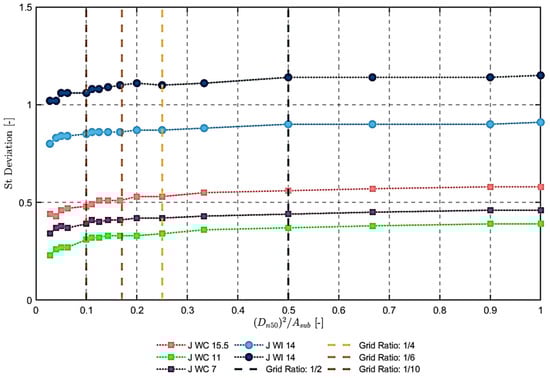
Figure 14.
Variation in the standard deviation of S3D,sub with ηS3D,grid—Jacket.
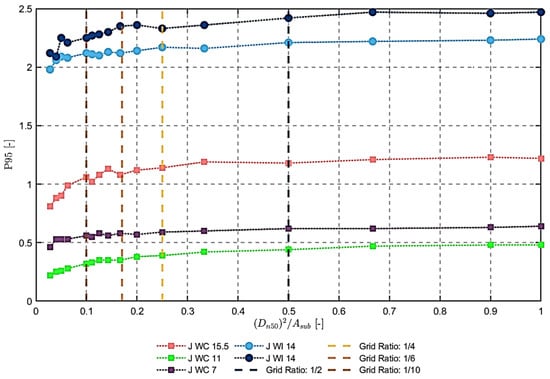
Figure 15.
Variation in the 95% Percentile (P95) of S3D,sub with ηS3D,grid—Jacket.
3.3. S3D/ns and S/ts Analysis
The damage number was defined by [5] as the number of protection layers lost to scour, normalised by Dn50, with static and failure limits of S3D > 0.25 and S3D > 1.0, respectively. Consequently, observing a S3D > 1.0 for a model thickness of ts = 5Dn50 around the piles, or ts = 3Dn50 in the remaining area, may be overly conservative and not accurately reflect failure, since it only represents a loss of a layer. On the contrary, the method developed by [34], which applies the ref. [6] failure criterion, suggests that filter exposure and failure only occur under the specific S3D × Dn50 ≥ ts condition. In this context, ref. [33] demonstrated that a comparison between S3D with ts, as a function of Dn50, provides additional insight into the actual state of the protection. Without disregarding the necessity to account for a certain degree of uncertainty, it is recommended to establish the failure limit (S3D,failure) as a range around S3D,failure = ns for ts = ns × Dn50.
By adopting this perspective, comparing S3D,max values against a failure threshold of S3D = 5.0 (Table 5) facilitates a more precise assessment of the protection’s behaviour, particularly when applying the overlapping method, and a better understanding of the physical meaning behind the damage number. Although it was suggested by [33] to set the static limit at 0.25, in line with ref. [5], further examination of the results, mainly for the J_WC_7 and J_WC_11 cases (test categorised as static), revealed that S3D,measured values exceeded this threshold.
Table 5.
S3D,max comparison with static and failure threshold proposed based on the protection’s thickness.
This discrepancy highlights the necessity for both static and failure limits to be defined relative to the protection thickness, not solely the last one. The static limit S3D = 0.25 was appropriate for circular protections with ts = 2.5Dn50 used by both [5,33]. However, for complex structures and scour configurations/thicknesses, a fixed threshold has proven incompatible. This reinforces the assessment that both boundaries for classifying scour protections should be established as a certain percentage of ts value and/or defined by a range, rather than a single fixed value.
The damage increase ratio (ΔS3D/ns), introduced by [8], emerged as an alternative to the drawbacks of the fixed sub-areas approach by [5]. Despite being effective in describing the pace at which damage evolves, ref. [33] demonstrated that it fails to reliably indicate the proximity of protection to failure and observed overlapping ranges across the three different behavioural categories. Similarly, for riprap protections, the conventional S/D ratio has limited relevance, as it poorly reflects the deformation status or the loss of armour layers.
As a result, S/ts and S3D/ns ratios suggested by [33] are employed in this research, which provides a more robust physical correspondence of the protection’s overall damage state. The following threshold ratios were defined for the following:
- Failure: ;
- Dynamic Protection: ;
- Static Protection: ;
- Recovery (Sediment Accretion): ;
The proposed limits for the two ratios were applied to rate the scour protection. Failures detected visually or by the overlapping-circle method corresponded to S3D/ns or S/ts > 1.0, while dynamic protections remained below these limits (Table 6). However, for the static J_WC_7 and J_WC_11 tests, S3D/ns or S/ts < 0.25 conditions were not satisfied, with most values ranging approximately around 1/3. These results imply that, despite both ratios being reliable in capturing dynamic or failure behaviour, the static limit should be reevaluated or adjusted to accommodate complex structural and different protection configurations.
Table 6.
Scour depth (S), S3D/ns, and S/ts comparison.
Ultimately, the overlapping approach emerges as highly effective for visualising and measuring scour, offering a consistent tool for damage evaluation and/or identification. Moreover, the ratio-based indicators, such as S3D/ns, and S/ts, show promise for developing adaptive design frameworks, thereby enhancing the reliability of scour protections in complex hydrodynamic environments.
3.4. Ucw and KC Effects
The analysis of damage evolution in relation to Ucw ratio reveals that S3D values tend to increase as Ucw decreases (Table 2 and Figure 16), contrary to the findings reported by [15]. The results, however, are not regarded as conflicting. Instead, they offer additional proof of the intricacy of the wave-current regime, emphasising that the analysis cannot be made without considering the impact and importance of the KC number. In fact, the tendency majorly reflects the hydrodynamic conditions imposed during testing: higher Ucw tests were characterised by reduced wave heights and elevated current velocities, whereas lower Ucw values were performed using more energetic wave conditions—namely, higher wave heights with lower influence of current.
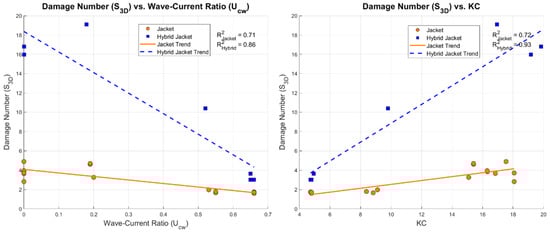
Figure 16.
Damage number comparison with Ucw (right) and KC number (left).
As noted by [23], increased wave energy significantly amplifies scour rates. Further examination of tests with comparable KC numbers (J_WC_15.5, J_WI_14, and J_WR_14) indicates that the J_WC_15.5_3000 test (KC = 15.41, Ucw = 0.19, S3D,max = 4.71) exhibited damage numbers that were slightly larger than or similar to those recorded in the J_WI_14_3000 (KC = 16.30, Ucw = 0, S3D,max = 3.96) and J_WR_14_3000 tests (KC = 17.54, Ucw = 0, S3D,max = 4.90), respectively. This small sample aligns with findings reported by [15,44], for jacket and monopile foundations, respectively, that a slight superimposition of a current load can increase scour depths.
Overall, the results presented in Table 2 and Figure 16, consistently indicate that damage increases with increasing KC values, regardless of the prevailing hydrodynamic regime, as it is directly related to the amplification of shear stress and vortex shedding around the foundation, the primary cause of scour. When comparing the jacket-only configurations with the hybrid jackets, the influence of a lower Ucw ratio was found to be even more pronounced for the hybrid structures. Deformation is highly influenced by intensified oscillatory flow patterns and by enhanced shear stresses (captured by KC number). The intensified damage rates associated with high KC and reduced Ucw values can be attributed to the distinctive hydrodynamic interactions induced by the oscillatory motion of the OSWEC paddle. In highly energetic, wave-dominated regimes, this motion generates significant variations in local flow velocities and pore pressures, thereby enhancing bed shear stress, turbulence, and upward/downward pressure cycles, as well as flow acceleration in the vicinity of the structure. These dynamic interactions serve as an additional scour-driving mechanism, substantially increasing sediment mobilisation compared to conventional jacket foundations under similar conditions.
3.5. Hybrid Jacket vs. Hybrid Monopiles
This research performed a comparative analysis of the results regarding the damage number and the visual classification with those obtained for the (hybrid) monopile setup by [33], as the test settings and hydrodynamic conditions were similar. The comparison enables a more comprehensive assessment of the structural effects on scour between such distinctly different foundation types.
Table 7 shows that the measured values under the least energetic hydrodynamic condition were very similar across all model configurations (jacket vs. monopile and hybrid jacket vs. hybrid monopile). Under the intermediate condition (Hs = 0.11 m), comparable damage numbers were only registered between the jacket-monopile pair. As for the three highest wave-tested cases, the jacket/hybrid jacket configurations have substantially higher S3D,measured values in comparison to their monopile counterpart. These results are consistent with the findings of ref. [14], who studied jackets in current-only conditions, and ref. [23], who performed tests with wave-only scenarios. Conversely, it differs from the results stated by [19], whose experiments involved perpendicular wave-current alignments. Given that the present study employed collinear wave-current and wave-only conditions, the results may suggest that flow direction has a significant impact on the sediment-structure-flow interaction, a factor that warrants further investigation.
Table 7.
S3D,measured and visual damage comparison between (hybrid) jackets and (hybrid) monopile foundations.
Although differences in the damage number values were observed between both studies, the visual classification of the scour protections in both studies (Table 7) revealed that the characteristics of the protection setup applied to the (hybrid) jacket exhibited an overall enhanced performance. For the jacket, the protection withstood the full test duration, whereas in ref. [33], failures occurred for the WC_15.5 and WR_14 tests within the first 1000 waves. A similar trend was observed for the WC_7 test in the hybrid jacket, where the protection withstood the complete 3000-wave test. In contrast, the protection used for the hybrid monopile failed prematurely. These performance improvements can be attributed to the increased protection thickness used for the (hybrid) jackets—3Dn50 over most of the footprint area and locally reinforced to 5Dn50 at each pile, following the recommendations proposed by [20,31]—when compared to the ts = 2.5Dn50 protection tested by [33].
Nevertheless, even with the thicker armour layer, the damage numbers recorded under the more energetic wave conditions for the hybrid jacket were nearly twice those registered for the hybrid monopile. The amplification of the damage rate between both hybrid structures is in line with the severe armour layer damage, sediment erosion, and local seabed sinking observed beneath and around the filter layer—effects even more pronounced than those observed for the hybrid monopile. These results highlight the intricate hydrodynamic interactions and increased turbulence generated by hybrid structures, underscoring the need for tailored scour design guidelines for hybrid and geometrically complex offshore foundations.
3.6. Wave Transmission (Kt) and Wave Reduction (KRed) Coefficients
The primary objective of this experimental study was to evaluate the damage to the scour protection of two different types of foundations. However, incorporating a WEC to transform a jacket foundation into a hybrid jacket revealed significant variations in flow patterns and hydrodynamic behaviour. Since the study did not target the mechanical-power performance of the WEC, parameters such as captured energy efficiency or power per unit front were not evaluated. Instead, simplified hydrodynamic interactions—namely the wave transmission coefficient (Kt), which compares seaside and leeside wave heights for each test, and the wave reduction coefficient (KRed), which compares wave heights between jacket-only and hybrid jacket configurations under similar conditions—were employed to quantify the influence of both foundations on wave attenuation.
For jacket-only tests, the Kt values remained slightly above 100% (Table 8), with deviations ranging from 1.4% to 7.5%. Although the upper truss was expected to obstruct flow and slightly reduce leeward wave height, the structure’s open cross-section likely facilitated near-complete wave propagation, confirming its limited wave-sheltering capacity. In contrast, the hybrid jacket with the integrated WEC achieved a pronounced reduction in Kt, particularly under higher wave heights, with up to 27% attenuation on the leeward side. These reductions were achieved using a simplified mechanical actuation system for the WEC paddles, indicating that a fully operational power take-off (PTO) system could further enhance attenuation. The observed trends are consistent with the findings of ref. [33], reinforcing that hybridisation can be effectively extended not only to monopiles but to more complex foundation geometries. Such configurations enhance dissipative capacity, increase wave absorption, and reduce transmitted wave energy. Nevertheless, a trade-off was identified: the hybrid jacket induced higher turbulence magnitudes and enhanced flow pattern contraction, which were responsible for the significant increase in the damage measured at the scour protection system.
Table 8.
Wave transmission coefficients (Kt).
Regarding the wave reduction coefficient, most seaside KRed values for the hybrid jacket (Table 9) were negative, indicating local wave amplification of up to 10%. This effect is likely due to intense scour erosion that lowered the seabed, thereby increasing local water depth and enabling larger, non-breaking waves. Conversely, the leeside KRed values consistently demonstrated substantial reductions in wave height—up to 33%—in line with the results reported by [33]. These findings highlight the potential of WECs as multifunctional components in offshore infrastructure, serving not only as renewable energy devices but also as protective elements that mitigate wave energy and coastal erosion [3,32]. However, the optimisation and strategic integration of PTO systems remain crucial to address the scour intensification associated with WECs. While the WEC reduced transmitted wave height, it simultaneously enhanced scour damage to the armour layer. This outcome suggests that both the paddle’s rotational angle and its clearance from the seabed are critical design parameters to mitigate excessive scour or structural damage.
Table 9.
Wave reduction coefficients (KRed).
The same conclusion was reported by [44], who implemented an OSWEC on the seabed as a protective element for pipelines, observing that the variation in the angle between the flap and the seabed affected the scour rates. When a smaller rotational amplitude around the vertical axis was used, which limited oscillatory motion and velocity, scour depths were reduced. Regarding converter’s tip clearance—defined as the vertical distance between a rotating blade/paddle and the seabed—ref. [45,46,47] investigated the effect of tip clearance on scour development in tidal-current turbines. Both reported that the converter enhanced local velocities, downflow, and horseshoe vortices, thus increasing scour. According to ref. [46], scour was intensified by 10–20% in extent and 30% in depth. It was also found that scour increased more rapidly with smaller tip clearances. However, the equilibrium scour depth was independent of tip clearance, indicating that further reduction in distance beyond a threshold had a negligible effect on scour progression.
4. Conclusions
This research characterises scour in riprap-protected jackets and hybrid jackets. The primary aim was to evaluate the performance of scour protection systems for jackets and hybrid jackets, and to clarify the governing scour mechanisms, damage progression, and hydrodynamic interactions for both types of structures. The research seeks to understand how local and global scour evolve at different locations and rates under the influence of a WEC. By comparing these results with those observed by [33] for monopiles and hybrid monopiles, this study provides valuable insights to guide future research in the marine harvesting technologies and offers a critical assessment of current design limitations for offshore foundations with a complex geometry.
As one of the novelties, the results of experimental testing of protected hybrid jacket foundations revealed that, although the WEC successfully attenuated incident hydrodynamic conditions—lowering the leeward wave heights by up to 33%—the oscillatory motion of the converter’s paddles paradoxically amplified local scour mechanisms. The generation of complex flow patterns, more specifically, horseshoe vortices, lee-wake vortices, streamline contractions, and downflow, resulted in severe, irreversible damage to the scour protection. This highlights a crucial design trade-off: the energy-harvesting benefit of the WEC comes at the cost of structural stability for the foundation and its scour protection.
Regarding the differences between the jacket and hybrid jacket foundation tests, the study shows that the scour protections designed for the jackets, following the recommendations by [20,21,31], have retained their structural integrity, proving that both recommendations offer a valuable starting point for future design guidelines. However, the results also highlight that the exact same protection system applied to the hybrid configuration is highly vulnerable. The protection system on hybrid jackets often sustained premature failure, typically within the first 1000 waves, indicating that the WEC-flow complex relation is a key driver of irreversible damage.
Regarding the S3D measured for both foundations, the results demonstrate that the design equation developed for monopile foundations (Equation (1)) is insufficient to capture the intricacies of complex and hybrid foundations, raising concerns about the feasibility and conservatism of the design principles presented by [5].
As an alternative, the overlapping-circle methodology developed by [34] was successfully adapted and validated for complex foundations and non-standard scour protection geometries. It allowed an accurate quantification of the damage spatial distribution. The analysis also confirmed a strong dependency of S3D,max on the grid ratio (ηS3D,grid) and the selected sub-area size (Asub), consistent with the findings reported by [34]. The grid ratios of 1/8 and 1/4, corresponding to sub-areas of 8 and 4, respectively, were found to be the most suitable for estimating the damage number, within a similar range observed by [33]. Although the ηS3D,grid = 1/4 (Asub = 4) was identified as the most representative for assessing protection failure, in line with the failure criterion proposed by [6].
Alternative metric limits, such as S/ts > 1.0 and S3D/ns > 1.0, were found to provide a more representative assessment of protection failure than S3D > 1.0, proposed by [5]. Both metrics appear to be closer to the experimentally observed behaviours and visual classifications attributed to each test, thus suggesting a need to reconsider the limits as a function of the protection thickness. Nonetheless, the exact S3D, S/ts, or S3D/ns value for the static-to-dynamic threshold needs to be reconsidered and defined through further testing.
The interpretations of these results must be contextualised within specific experimental limitations to avoid overgeneralization.
- Scale effects: the use of the Froude similitude with a 1:50 geometric scale inevitably introduces some scale effects regarding viscous forces and sediment size. While the Re number was maintained in a range to restrain vortex shedding discrepancies, as suggested by [35], the scaling of granular bed material may not perfectly replicate prototype sediment transport regimes.
- OSWEC model: The WEC selected for the experimental study was modelled as a simplified oscillating paddle system. While macroscopically this reproduces the potential effects and influences of the device in enhancing flow and scour mechanisms, it does not fully capture the real effects of damping and control strategies of a full-scale device with a fully functional PTO system.
Overall, the authors believe that this study contributes to a broader comprehension of hydrodynamic interactions in complex and hybrid offshore foundations, emphasising the need to revise existing scour protection design frameworks. Although based on a limited dataset, the results clearly indicate the necessity of a uniform and optimised design criterion that integrates structural complexities, dynamic load interactions, and energy-harvesting components. These approaches are essential to ensure that resilient, efficient, and protective solutions continue to be developed for future offshore and marine renewable infrastructures.
The following points summarise the key contributions of this research:
- Scour protection applied to a hybrid jacket-WEC system: comparative evaluation of the S3D between a jacket and a hybrid jacket foundation. Results demonstrated that paddle-based WECs intensify scour due to the influence of the paddle’s oscillatory motion, thereby enhancing turbulence and flow patterns, despite its capacity to attenuate wave heights up to 33%.
- Overlapping-circle 3D method implemented to a complex geometry foundation: the research successfully adapted and implemented the methodology developed by [34] to a jacket foundation, a structure with higher complexity when compared to a monopile, and to a square scour protection (different from the typical circular shape). The method demonstrated a high-resolution scour quantification capability through a highly accurate computation of S3D, thereby providing valuable insights into complex and hybrid configurations. Despite the sensitivity to the grid ratio, results suggest an ideal range between 1/8 and 1/4. However, low grid ratios present some difficulties in properly representing overlapping elements near the corners and around the piles in complex foundations/protections. Therefore, the 1/4 ratio remains the most reliable, consistent with the findings disclosed by [6,34];
- Scour protection design predictive formulas limitations: the study’s findings raise some questions regarding the underestimation and application of current design standards, developed primarily for monopiles, which do not account for increased flow and structural complexity of other structures and hybrid configurations. Hybrid jackets failed prematurely, with massive damage rates, within the first 1000 waves. The results emphasise that currently, there is no methodology capable of effectively considering the additional loads caused by the interaction between sediment flow, WEC, and the structure.
- Alternative scour metrics for scour protection performance: the S/ts and S3D/ns parameters, proposed as alternatives by [33] to better quantify and evaluate the performance of scour protections in complex offshore settings, can successfully identify when a protection is dynamic, closer to failure, and when failure occurs. These measurements shift the evaluation focus from the foundation to the armour layer itself, providing a clearer picture of relative performance. Both indicators outperform traditional parameters such as the S/D and the S3D > 1.0 threshold. However, the static limit may need to be reconsidered, as it can be overly conservative and result in thicker protections.
To further advance the understanding of scour processes in hybrid offshore foundations, future research should strategically expand the experimental test matrix to encompass a broader spectrum of hydrodynamic conditions, alternative scour protection layouts, various WEC devices, and variations in some structural parameters. One key component could be related to the influence of hydrodynamic directionality. This experimental campaign used only co-directional wave-current conditions due to the facilities’ constraints. While this configuration generally represents the most critical loading case, the offshore and marine environments often involve complex, multi-directional flow interactions. Consequently, the influence of transverse and counter-directional wave-current regimes on the damage patterns and distribution for protected complex and hybrid foundations should be addressed to determine if the asymmetry of the incoming flow induces preferential damage zones and different S3D values from those observed in co-directional regimes. Expanding these elements will be fundamental to developing comprehensive datasets that reflect the entire range of scour and damage mechanisms in such complex and hybrid systems. These initiatives could be critical to increase knowledge and optimise the next generation of design approaches and predictive models that incorporate hydrodynamic–structural coupling and energy-harvesting dynamics. Such developments could be crucial to achieving safer, more efficient, and sustainable offshore solutions, ultimately supporting the transition towards a more resilient marine renewable energy sector.
Author Contributions
Writing—original draft preparation, formal analysis, visualisation, J.C.; conceptualisation, J.C., T.F.-F., M.A. and P.L.; methodology, J.C., T.F.-F. and M.A.; writing—review and editing, J.C., T.F.-F., M.A., F.T.-P. and P.L.; supervision, T.F.-F., F.T.-P. and P.L.; funding, T.F.-F.; project administration, T.F.-F. and F.T.-P. All authors have read and agreed to the published version of the manuscript.
Funding
J. Chambel acknowledges funding in the form of a Ph.D. scholarship grant awarded to J. Chambel by the Portuguese Foundation for Science and Technology (FCT) and the European Social Fund (ESF) of the European Union (EU), with the reference number 2021.07393.BD (https://doi.org/10.54499/2021.07393.BD). This work was performed in the scope of the POSEIDON project (Project Reference: PTDC-ECI-EGC-5177-2020), which was funded through the FCT.
Data Availability Statement
The original contributions presented in this study are included in the article material. Further inquiries can be directed to the corresponding author.
Acknowledgments
The authors would like to acknowledge Miguel Guerra for the support and expertise during the physical modelling experiments.
Conflicts of Interest
Author Mahdi Alemi was employed by the company IMDC. The remaining authors declare that the research was conducted in the absence of any commercial or financial relationships that could be construed as a potential conflict of interest.
Abbreviations
The following abbreviations are used in this manuscript:
| ADV | Acoustic Doppler Velocimeter |
| Apile_jacket | Overlapping-circle sub-area equivalent to jacket’s pile area |
| Asub | Area of the overlapping-circle sub-areas |
| a0, a2, a3 | Regression fitting coefficients |
| a1, a4 | Coefficient for hydrodynamic conditions |
| b0 | Regression fitting coefficient |
| Djacket | Diameter of jacket piles |
| Dn50 | Nominal stone diameter of the scour protection |
| Dv,i | Incremental erosion depth |
| D15 | 15th percentile of scour protection material grading |
| D85 | 85th percentile of scour protection material grading |
| DOF | Degrees of freedom |
| DTM | Digital Terrain Model |
| d | Water depth |
| d16 | 16th percentile of sediments |
| d50 | Mean diameter of sediments |
| d84 | 84th percentile of sediments |
| Fr | Froude number |
| FOSWEC | Floating Oscillating Surge Wave Energy Converter |
| g | Gravitational acceleration |
| H | Wave height |
| Hm0 | Spectral significant wave height |
| Hs | Significant wave height |
| Hrms | Root-mean square wave height |
| J | Jacket |
| JH | Hybrid jacket |
| JONSWAP | Joint North Sea Wave Project |
| KRed | Wave reduction coefficient |
| Kt | Wave transmission coefficient |
| KC | Keulegan–Carpenter number (wave contribution) |
| LCoE | Levelized Cost of Energy |
| N | Number of waves |
| ns | Number of rock stone sizes (layers) |
| OSWEC | Oscillating Surge Wave Energy Converter |
| OWE | Offshore wind energy |
| OWF | Offshore Wind Foundation |
| PTO | Power-take off |
| p | Multiplication factor for overlapping-circle sub-area |
| Rcircle | Radius of overlapping-circle sub-area |
| Re | Reynolds number |
| S | Scour depth |
| Seq | Equilibrium scour depth |
| Send | End scour depth |
| S/D | Relative scour depth |
| S/ts | Scour depth relative to the scour protection thickness |
| S3D | Damage number |
| S3D,hybrid | Damage number at hybrid jacket |
| S3D,jacket | Damage number at jacket foundations |
| S3D,max | Damage number (maximum) |
| S3D,measured | Damage number (measured) |
| S3D,predicted | Damage number (predicted) |
| S3D/ns | Damage number relative to the number of rock stone sizes (layers) |
| S3D,measured/ns | Measured damage number relative to the number of rock stone sizes (layers) |
| s | Specific density (ρs/ρw) |
| T* | Dimensionless time scale |
| Tm−1,0 | Energy wave period |
| Tp | Wave peak period |
| ts | Scour protection thickness |
| Uc | Depth-averaged current velocity |
| Ucw | Wave–current velocity ratio |
| Um | Wave orbital bottom velocity |
| VA,i | Cumulative dimensionless erosion volume |
| Vcircle | Volume of overlapping-circle sub-area |
| WC | Waves-and-currents |
| WEC | Wave Energy Converter |
| WI | Irregular waves |
| WR | Regular waves |
| ws | Settling velocity |
| ΔS3D/ns | Damage increase ratio |
| ηS3D,grid | Grid ratio |
| ρs | Density of rock material |
| ρw | Water mass density |
| σs | Standard deviation of sediments |
| γ | Wave spectrum peak enhancement factor |
Appendix A. Jacket and Hybrid Jacket S3D Results (Asub = 4

Figure A1.
J_WC_7_1000: (a) DTM and (b) S3D distribution—waves and currents from left to right.

Figure A2.
J_WC_7_2000: (a) DTM and (b) S3D distribution—waves and currents from left to right.

Figure A3.
J_WC_7_3000: (a) DTM and (b) S3D distribution—waves and currents from left to right.

Figure A4.
J_WC_11_1000: (a) DTM and (b) S3D distribution—waves and currents from left to right.

Figure A5.
J_WC_11_2000: (a) DTM and (b) S3D distribution—waves and currents from left to right.

Figure A6.
J_WC_11_3000: (a) DTM and (b) S3D distribution—waves and currents from left to right.

Figure A7.
J_WC_15.5_1000: (a) DTM and (b) S3D distribution—waves and currents from left to right.

Figure A8.
J_WC_15.5_2000: (a) DTM and (b) S3D distribution—waves and currents from left to right.

Figure A9.
J_WC_15.5_3000: (a) DTM and (b) S3D distribution—waves and currents from left to right.

Figure A10.
J_WI_14_1000: (a) DTM and (b) S3D distribution—waves from left to right.

Figure A11.
J_WI_14_2000: (a) DTM and (b) S3D distribution—waves from left to right.

Figure A12.
J_WI_14_3000: (a) DTM and (b) S3D distribution—waves from left to right.

Figure A13.
J_WR_1000: (a) DTM and (b) S3D distribution—waves from left to right.

Figure A14.
J_WR_2000: (a) DTM and (b) S3D distribution—waves from left to right.

Figure A15.
J_WR_3000: (a) DTM and (b) S3D distribution—waves from left to right.

Figure A16.
JH_WC_7_1000: (a) DTM and (b) S3D distribution—waves and currents from left to right.

Figure A17.
JH_WC_7_2000: (a) DTM and (b) S3D distribution—waves and currents from left to right.

Figure A18.
JH_WC_7_3000: (a) DTM and (b) S3D distribution—waves and currents from left to right.

Figure A19.
JH_WC_11_1000: (a) DTM and (b) S3D distribution—waves and currents from left to right.

Figure A20.
JH_WC_15.5_1000: (a) DTM and (b) S3D distribution—waves and currents from left to right.

Figure A21.
JH_WI_14_1000: (a) DTM and (b) S3D distribution—waves from left to right.

Figure A22.
JH_WR_14_1000: (a) DTM and (b) S3D distribution—waves from left to right.
Appendix B. Jacket and Hybrid Foundations S3D Results for Different Grid Ratios (ηS3D,grid)
Table A1.
S3D,max for different grid ratios (ηS3D,grid)—(A): J_WC_7_3000; (B): J_WC_11_3000; (C) J_WC_15.5_3000; (D) J_WI_14_3000; (E) J_WR_14_3000.
Table A1.
S3D,max for different grid ratios (ηS3D,grid)—(A): J_WC_7_3000; (B): J_WC_11_3000; (C) J_WC_15.5_3000; (D) J_WI_14_3000; (E) J_WR_14_3000.
| Jacket | (A) | (B) | (C) | (D) | (E) | ||||
|---|---|---|---|---|---|---|---|---|---|
| Asub | Value [m2] | ηS3D,grid | p Value | Rcircle [m] | S3D,max | ||||
| 1.362 × 10⁻⁵ | 1.000 | 1.1284 | 2.082 × 10⁻³ | 2.05 | 2.62 | 5.66 | 5.14 | 6.14 | |
| 1.513 × 10⁻⁵ | 0.900 | 1.1894 | 2.194 × 10⁻³ | 2.02 | 2.60 | 5.92 | 5.65 | 6.26 | |
| 2.042 × 10⁻⁵ | 0.667 | 1.3820 | 2.550 × 10⁻³ | 2.01 | 2.54 | 5.37 | 5.14 | 5.98 | |
| 2.723 × 10⁻⁵ | 0.500 | 1.5958 | 2.944 × 10⁻³ | 1.71 | 2.16 | 5.58 | 4.56 | 5.40 | |
| 4.085 × 10⁻⁵ | 0.333 | 1.9544 | 3.606 × 10⁻³ | 1.76 | 2.04 | 5.29 | 5.04 | 5.33 | |
| 5.446 × 10⁻⁵ | 0.250 | 2.2568 | 4.164 × 10⁻³ | 1.72 | 1.98 | 4.71 | 3.96 | 4.90 | |
| 6.808 × 10⁻⁵ | 0.200 | 2.5231 | 4.655 × 10⁻³ | 1.63 | 1.75 | 4.96 | 3.97 | 5.34 | |
| 8.170 × 10⁻⁵ | 0.167 | 2.7640 | 5.099 × 10⁻³ | 1.53 | 1.70 | 4.38 | 4.00 | 4.64 | |
| 9.531 × 10⁻⁵ | 0.143 | 2.9854 | 5.508 × 10⁻³ | 1.48 | 1.52 | 4.20 | 4.07 | 4.95 | |
| 1.089 × 10⁻⁴ | 0.125 | 3.1915 | 5.888 × 10⁻³ | 1.55 | 1.69 | 4.47 | 4.05 | 4.93 | |
| 1.225 × 10⁻⁴ | 0.111 | 3.3851 | 6.246 × 10⁻³ | 1.30 | 1.45 | 4.50 | 3.88 | 4.76 | |
| 1.362 × 10⁻⁴ | 0.100 | 3.5682 | 6.583 × 10⁻³ | 1.14 | 1.28 | 4.05 | 3.81 | 4.49 | |
| 2.179 × 10⁻⁴ | 0.063 | 4.5135 | 8.327 × 10⁻³ | 1.13 | 1.10 | 4.49 | 3.90 | 4.54 | |
| 2.723 × 10⁻⁴ | 0.050 | 5.0463 | 9.310 × 10⁻³ | 1.18 | 1.08 | 4.24 | 3.81 | 4.47 | |
| 3.404 × 10⁻⁴ | 0.040 | 5.6419 | 1.041 × 10⁻² | 1.07 | 0.96 | 3.58 | 3.45 | 4.59 | |
| Apile_jacket | 4.909 × 10⁻³ | 0.02774 | 6.7751 | 1.250 × 10⁻² | 0.95 | 0.82 | 4.24 | 3.21 | 4.54 |
Table A2.
S3D,max for different grid ratios (ηS3D,grid)—(A): JH_WC_7_3000; (B): JH_WC_11_1000; (C) JH_WC_15.5_1000; (D) JH_WI_14_1000; (E) JH_WR_14_1000.
Table A2.
S3D,max for different grid ratios (ηS3D,grid)—(A): JH_WC_7_3000; (B): JH_WC_11_1000; (C) JH_WC_15.5_1000; (D) JH_WI_14_1000; (E) JH_WR_14_1000.
| Hybrid Jacket | (A) | (B) | (C) | (D) | (E) | ||||
|---|---|---|---|---|---|---|---|---|---|
| Asub | Value [m2] | ηS3D,grid | p Value | Rcircle [m] | S3D,max | ||||
| 1.362 × 10⁻⁵ | 1.000 | 1.1284 | 2.082 × 10⁻³ | 4.20 | 13.00 | 24.80 | 21.20 | 22.50 | |
| 1.513 × 10⁻⁵ | 0.900 | 1.1894 | 2.194 × 10⁻³ | 4.13 | 12.10 | 23.60 | 19.20 | 21.20 | |
| 2.042 × 10⁻⁵ | 0.667 | 1.3820 | 2.550 × 10⁻³ | 4.10 | 13.70 | 22.20 | 20.20 | 21.40 | |
| 2.723 × 10⁻⁵ | 0.500 | 1.5958 | 2.944 × 10⁻³ | 4.33 | 12.30 | 21.10 | 19.90 | 20.60 | |
| 4.085 × 10⁻⁵ | 0.333 | 1.9544 | 3.606 × 10⁻³ | 3.80 | 11.50 | 20.80 | 19.90 | 19.20 | |
| 5.446 × 10⁻⁵ | 0.250 | 2.2568 | 4.164 × 10⁻³ | 3.65 | 10.30 | 18.80 | 16.00 | 16.80 | |
| 6.808 × 10⁻⁵ | 0.200 | 2.5231 | 4.655 × 10⁻³ | 4.16 | 12.40 | 20.30 | 18.70 | 18.30 | |
| 8.170 × 10⁻⁵ | 0.167 | 2.7640 | 5.099 × 10⁻³ | 3.47 | 10.30 | 18.20 | 16.30 | 17.00 | |
| 9.531 × 10⁻⁵ | 0.143 | 2.9854 | 5.508 × 10⁻³ | 3.68 | 9.35 | 18.30 | 16.30 | 17.00 | |
| 1.089 × 10⁻⁴ | 0.125 | 3.1915 | 5.888 × 10⁻³ | 3.52 | 10.20 | 18.80 | 16.10 | 16.40 | |
| 1.225 × 10⁻⁴ | 0.111 | 3.3851 | 6.246 × 10⁻³ | 3.60 | 9.94 | 18.40 | 15.50 | 16.40 | |
| 1.362 × 10⁻⁴ | 0.100 | 3.5682 | 6.583 × 10⁻³ | 3.51 | 9.89 | 18.00 | 15.40 | 16.00 | |
| 2.179 × 10⁻⁴ | 0.063 | 4.5135 | 8.327 × 10⁻³ | 3.27 | 9.81 | 18.20 | 14.70 | 15.90 | |
| 2.723 × 10⁻⁴ | 0.050 | 5.0463 | 9.310 × 10⁻³ | 3.36 | 9.65 | 17.30 | 15.30 | 15.90 | |
| 3.404 × 10⁻⁴ | 0.040 | 5.6419 | 1.041 × 10⁻² | 3.39 | 9.76 | 17.50 | 14.80 | 15.50 | |
| Apile_jacket | 4.909 × 10⁻³ | 0.02774 | 6.7751 | 1.250 × 10⁻² | 3.17 | 9.20 | 17.10 | 14.40 | 15.40 |
References
- Wind Europe. Getting Fit for 55 and Set for 2050: Electrifying Europe with Wind Energy; Wind Europe: Brussels, Belgium, 2021. [Google Scholar]
- Matutano, C.; Negro, V.; López-Gutiérrez, J.S.; Esteban, M.D. Scour prediction and scour protections in offshore wind farms. Renew. Energy 2013, 57, 358–365. [Google Scholar] [CrossRef]
- Fazeres-Ferradosa, T.; Taveira-Pinto, F.; Rosa-Santos, P.; Chambel, J. A review of reliability analysis of offshore scour protections. Proc. Inst. Civ. Eng. Marit. Eng. 2019, 172, 104–117. [Google Scholar] [CrossRef]
- De Vos, L. Optimisation of Scour Protection Design for Monopiles and Quantification of Waves Run-Up. Ph.D. Thesis, Ghent University, Ghent, Belgium, 2008. [Google Scholar]
- De Vos, L.; De Rouck, J.; Troch, P.; Frigaard, P. Empirical design of scour protections around monopile foundations: Part 2: Dynamic approach. Coast. Eng. 2012, 60, 286–298. [Google Scholar] [CrossRef]
- den Boon, J.H.; Sutherland, J.; Whitehouse, R.J.S.; Soulsby, R.L.; Stam, C.J.M.; Verhoeven, K.; Hald, T. Scour behaviour and scour protection for monopile foundations of offshore wind turbines. Proc. Euro. Wind Energy Conf. Exhib. 2004, 14, 26. [Google Scholar]
- De Vos, L.; De Rouck, J.; Troch, P.; Frigaard, P. Empirical design of scour protections around monopile foundations: Part 1: Static approach. Coast. Eng. 2011, 58, 540–553. [Google Scholar] [CrossRef]
- De Schoessitter, P.; Audenaert, S.; Baelus, L.; Bolle, A.; Brown, A.; das Neves, L.; Fazeres-Ferradosa, T.; Haerens, P.; Taveira-Pinto, F.; Troch, P. Feasibility of a dynamically stable rock armour layer scour protection for offshore wind farms. In Proceedings of the ASME 2014 33rd International Conference on Ocean, Offshore and Arctic Engineering, San Jose, CA, USA, 8–13 June 2014. [Google Scholar]
- Whitehouse, R.J.S.; Brown, A.; Audenaert, S.; Bolle, A.; de Schoessiter, P.; Haerens, P.; Baelus, L.; Troch, P.; das Neves, L.; Fazeres-Ferradosa, T. Optimising scour protection stability at offshore foundations. In Proceedings of the 7th International Conference on Scour and Erosion, Perth, Australia, 2–4 December 2014; CRC Press: Boca Raton, FL, USA, 2014. [Google Scholar]
- Fazeres-Ferradosa, T.; Taveira-Pinto, F.; Reis, M.T.; das Neves, L. Physical modelling of dynamic scour protections: Analysis of the damage number. Proc. Inst. Civ. Eng. Marit. Eng. 2018, 171, 11–24. [Google Scholar] [CrossRef]
- Augustyn, D.; Nielsen, M.B.; Pedersen, R.R. 17.04: Design of offshore wind turbine jacket foundations: On the influence of subsequent modifications on fatigue performance. ce/papers 2017, 1, 4323–4332. [Google Scholar] [CrossRef]
- Hao, E.; Liu, C. Evolution and comparison of anti-impact performance to offshore wind turbine foundations: Monopiles, tripods, and jacket. Ocean Eng. 2017, 130, 218–227. [Google Scholar] [CrossRef]
- Chen, H.-H.; Yang, R.-Y.; Hwung, H.-H. Study of Hard and Soft Countermeasures for Scour Protection of Jacket-Type Offshore Wind Turbine Foundation. J. Mar. Sci. Eng. 2014, 2, 551–567. [Google Scholar] [CrossRef]
- Chen, H.; Zhang, J.; Wang, F.; Guo, Y.; Guan, D.; Feng, L. Experimental investigation of the current induced local scour around a jacket foundation. Ocean Eng. 2023, 285, 115369. [Google Scholar] [CrossRef]
- Chen, H.; Zhang, J.; Guo, Y.; Cui, L.; Guan, D.; Jiang, L. Laboratory modeling study on the scour characteristics around a jacket foundation subjected to combined wave-current loading. Renew. Energy 2025, 242, 122443. [Google Scholar] [CrossRef]
- Wind Europe. Offshore Wind in Europe—Key Trends and Statistics 2020; Wind Europe: Brussels, Belgium, 2021. [Google Scholar]
- Fazeres-Ferradosa, T.; Chambel, J.; Taveira-Pinto, F.; Rosa-Santos, P.; Taveira-Pinto, F.V.C.; Giannini, G.; Haerens, P. Scour Protections for Offshore Foundations of Marine Energy Harvesting Technologies: A Review. J. Mar. Sci. Eng. 2021, 9, 297. [Google Scholar] [CrossRef]
- Welzel, M. Wave-Current Induced Scouring Processes Around Complex Offshore Structures. Ph.D. Thesis, Leibniz University, Hannover, Germany, 2021. [Google Scholar]
- Welzel, M.; Schendel, A.; Hildebrandt, A.; Schlurmann, T. Scour development around a jacket structure in combined waves and current conditions compared to monopile foundations. Coast. Eng. 2019, 152, 103515. [Google Scholar] [CrossRef]
- Welzel, M.; Schendel, A.; Schlurmann, T.; Hildebrandt, A. Volume-Based Assessment of Erosion Patterns around a Hydrodynamic Transparent Offshore Structure. Energies 2019, 12, 3089. [Google Scholar] [CrossRef]
- Welzel, M.; Schendel, A.; Goseberg, N.; Hildebrandt, A.; Schlurmann, T. Influence of Structural Elements on the Spatial Sediment Displacement around a Jacket-Type Offshore Foundation. Water 2020, 12, 1651. [Google Scholar] [CrossRef]
- Welzel, M.; Schendel, A.; Satari, R.; Neuweiler, I.; Schlurmann, T. Spatio-temporal analysis of scour around complex offshore foundations under clear water and live bed conditions. Ocean Eng. 2024, 298, 117042. [Google Scholar] [CrossRef]
- Zhang, J.; Chen, H.; Guo, Y.; Wang, F.; Guan, D.; Deng, X.; Hou, D. Experimental study on the scour characteristics around a jacket foundation under wave actions. Ocean Eng. 2025, 299, 117290. [Google Scholar] [CrossRef]
- Jalloul, M.H.; Satari, R.; Welzel, M.; Schendel, A.; Kerpen, N.B.; Wynants, M.; Neuweiler, I.; Schlurmann, T. Wave-current induced scour around complex offshore structures: Towards a refined analysis of local scour at jacket piles. Ocean Eng. 2025, 338, 121983. [Google Scholar] [CrossRef]
- Sumer, B.M.; Fredsøe, J. The Mechanics of Scour in the Marine Environment; World Scientific: Singapore, 2002. [Google Scholar]
- Schendel, A.; Hildebrandt, A.; Goseberg, N.; Schlurmann, T. Processes and evolution of scour around a monopile induced by tidal currents. Coast. Eng. 2018, 139, 65–84. [Google Scholar] [CrossRef]
- Rudolph, D.; Bos, K.J.; Luijendijk, A.; Rietema, K.; Out, J. Scour around offshore structures-analysis of field measurements. In Proceedings of the 2nd International Conference on Scour and Erosion: Meritus Mandarin, Singapore, 14–17 November 2004; World Scientific Publishing: Singapore, 2004. [Google Scholar]
- Bolle, A.; de Winter, K.; Goossens, W.; Haerens, P.; Dewaele, G. Scour monitoring around offshore jackets and gravity-based foundations. In Proceedings of the 6th International Conference on Scour and Erosion (ICSE), Paris, France, 27–31 August 2012; Societe Hydrotechnique de France: Paris, France, 2012. [Google Scholar]
- Baelus, L.; Bolle, A.; Szengel, V. Long-term scour monitoring around offshore jacket foundations on a sandy seabed. In Proceedings of the 9th International Conference on Scour and Erosion (ICSE 2018), Taipei, Taiwan, 5–8 November 2018; CRC Press: Boca Raton, FL, USA, 2018. [Google Scholar]
- Bruinsma, N.; Van Velzen, G.; Riezebos, H.; Tilmans, W.M.K. Scour development and conceptual scour protection layout at OHVS HKN and HKFWa. Deltares 2018. [Google Scholar]
- Sarmiento, J.; Guanche, R.; Iturrioz, A.; Ojanguren, T.; Ávila, A.; Yanes, C. Experimental Evaluation of Dynamic Rock Scour Protection in Morphodynamic Environments for Offshore Wind Jackets. Energies 2021, 14, 3379. [Google Scholar] [CrossRef]
- Chambel, J.; Fazeres-Ferradosa, T.; Miranda, F.; Bento, A.; Taveira-Pinto, F.; Lomonaco, P. A Comprehensive Review on Scour and Scour Protections for Complex Bottom-Fixed Offshore and Marine Renewable Energy Foundations. Ocean Eng. 2024, 304, 117829. [Google Scholar] [CrossRef]
- Chambel, J.; Fazeres-Ferradosa, T.; Welzel, M.; Taveira-Pinto, F.; Lomonaco, P. Comparative Analysis of Scour in Riprap-Protected Monopiles and Hybrid Foundations. J. Mar. Sci. Eng. 2025, 13, 1639. [Google Scholar] [CrossRef]
- Fazeres-Ferradosa, T.; Welzel, M.; Schendel, A.; Baelus, L.; Santos, P.R.; Pinto, F.T. Extended characterization of damage in rubble mound scour protections. Coast. Eng. 2020, 158, 103671. [Google Scholar] [CrossRef]
- Sumer, B.M.; Fredsøe, J.; Christiansen, N. Scour around vertical pile in Waves. J. Waterw. Port Coast. Ocean Eng. 1992, 118, 15–31. [Google Scholar] [CrossRef]
- Wiberg, P.L.; Sherwood, C.R. Calculating wave-generated bottom orbital velocities from surface-wave parameters. Comput. Geosci. 2008, 34, 1243–1262. [Google Scholar] [CrossRef]
- Construction Industry Research and Information Association; Civieltechnisch Centrum Uitvoering Research en Regelgeving (Netherlands). The Rock Manual: The Use of Rock in Hydraulic Engineering, 2nd ed.; CIRIA: London, UK, 2007; Volume 683. [Google Scholar]
- Ruehl, K.M.; Forbush, D.D.; Lomonaco, P.; Bosma, B.; Simmons, A.; Gunawan, B.; Bacelli, G.; Michelen, C. Experimental Testing of a Floating Oscillating Surge Wave Energy Converter; Sandia National Laboratories: Albuquerque, NM, USA, 2019. [Google Scholar]
- Ruehl, K.M.; Forbush, D.D.; Yu, Y.H.; Tom, N. Experimental and numerical comparisons of a dual-flap floating oscillating surge wave energy converter in regular waves. Ocean Eng. 2020, 196, 106575. [Google Scholar] [CrossRef]
- Coe, R.G.; Bacelli, G.; Forbush, D.; Spencer, S.J.; Dullea, K.J.; Bosma, B.; Lomonaco, P. FOSWEC Dynamics and Controls Test Report; Sandia National Laboratories: Albuquerque, NM, USA, 2020. [Google Scholar]
- Whitehouse, R.J.S. Scour at marine structures: A manual for practical applications. Oceanogr. Lit. Rev. 1998, 45, 171. [Google Scholar] [CrossRef]
- Broekema, Y.B.; van Steijn, P.W.; Wu, M.; Robijns, T. Predicting loose rock scour protection deformation around monopiles using relative mobility numbers and the Keulegan–Carpenter number. Ocean Eng. 2024, 300, 117475. [Google Scholar] [CrossRef]
- Sumer, B.M.; Fredsøe, J. Experimental study of 2D scour and its protection at a rubble-mound breakwater. Coast. Eng. 2000, 40, 59–87. [Google Scholar] [CrossRef]
- Schendel, A.; Welzel, M.; Schlurmann, T.; Hsu, T.-W. Scour around a monopile induced by directionally spread irregular Waves in combination with oblique currents. Coast. Eng. 2020, 161, 103751. [Google Scholar] [CrossRef]
- Taheri, O.; Kolahdoozan, M.; Faghihirad, S. Experimental study of bed level changes in the vicinity of flap-type wave energy converters. Ships Offshore Struct. 2022, 18, 450–461. [Google Scholar] [CrossRef]
- Chen, L.; Hashim, R.; Othman, F.; Motamedi, S. Experimental study on scour profile of pile-supported horizontal axis tidal current turbine. Renew. Energy 2017, 114, 744–754. [Google Scholar] [CrossRef]
- Sun, C.; Lam, W.H.; Cui, Y.; Zhang, T.; Jiang, J.; Guo, J.; Ma, Y.; Wang, S.; Tan, T.H.; Chuah, J.H. Empiricial models for Darrieus-type tidal current turbine induced seabed scour. Energy Convers. Manag. 2018, 171, 478–490. [Google Scholar] [CrossRef]
Disclaimer/Publisher’s Note: The statements, opinions and data contained in all publications are solely those of the individual author(s) and contributor(s) and not of MDPI and/or the editor(s). MDPI and/or the editor(s) disclaim responsibility for any injury to people or property resulting from any ideas, methods, instructions or products referred to in the content. |
© 2026 by the authors. Licensee MDPI, Basel, Switzerland. This article is an open access article distributed under the terms and conditions of the Creative Commons Attribution (CC BY) license.