Abstract
Submerged floating tunnel (SFT) may be subjected to sudden explosive loads such as internal vehicle explosions, terrorist attacks, and external explosions during operation. Based on the Arbitrary Lagrange–Euler (ALE) method, the locally truncated SFT model and fluid–structure interaction model of internal air and external water are established. Spherical explosives are used to simulate the destructive impact of internal explosions at different positions of the road inside the SFT and key positions at the bottom of the road. The results show that the peak accelerations at the monitoring points caused by the explosions of vehicles on the road rapidly decay within a range of three times the radius of the SFT, and circularly distributed damage appears on the explosion-facing side of the road surface. Longitudinal extensional damage occurs at the junction of the road surface and the SFT wall as well as the bottom supporting wall. Longitudinal cracks appear on the SFT wall. The peak accelerations at the monitoring points of the internal road caused by the concealed bomb at the bottom of the SFT rapidly decay within a range of twice the radius of the SFT, and the damage to the SFT is mainly concentrated on the road surface and the supporting wall. The most dangerous direction of external underwater explosion is determined to be directly below the SFT. When the scaled distance of the explosion is less than 0.543 m/kg1/3, the accelerations at the monitoring points of the internal road show a single-peak trend with rapid rise and decay, and circumferential through-cracks appear on the SFT wall. The supporting wall connecting the SFT wall and the internal road transmits stress to the road, causing extensive damage.
1. Introduction
Submerged floating tunnel (SFT) is a new type of long-distance and deep-water cross-sea transportation infrastructure for vehicles such as trains and cars, which can significantly reduce the time cost. The constant increase in global passenger traffic and freight volume has increased the demand for deep-water transportation infrastructures. However, the common cross-sea bridges, immersed tunnels and submarine tunnels all have certain limitations. The advantages of the SFT, such as being less affected by weather and seabed topography, and being capable of spanning deep-water areas, make it highly competitive [1,2].
The SFT may be subjected to loads such as gravity, buoyancy, wave, current, and vehicle loads during operation, causing relatively regular periodic motion. In addition, the SFT is exposed to accidental loads such as explosions. Although the probability of occurrence is low and the duration is short, it will pose a serious threat to the SFT and the people inside if it occurs [2,3].
Current research mainly focuses on non-contact explosive loads on the SFT. Seo et al. [4] linearly simplified the underwater explosion in space and time and reduced the SFT to a uniform simply supported beam with continuous elastic springs, establishing the motion equation of the SFT under the explosion and verifying it through a simple SFT finite element beam model calculation. Luo et al. [5] simplified the SFT to an Euler–Bernoulli elastic supported beam with uniform cross-section and stiffness, calculated the fluid force based on the Morison equation, and linearly simplified the Zamyshlyayev–Cole semi-empirical formula for underwater explosion in space and time, establishing the dynamic model of the SFT under explosion and solving it by using the Galerkin method. Then, they discussed the influence of the explosive weight, the distance from the explosion center, and the vertical stiffness of the anchor cables on the displacement, velocity, and acceleration of the SFT. Kristoffersen et al. [6] established full-scale numerical models of the SFT of circular and rectangular cross-section based on ABAQUS, simulated the explosion inside the SFT using the CONWEP method, and evaluated the blast resistance performance of different cross-section types based on the equivalent plastic tensile strain. The results show that the circular cross-section is superior. Luo et al. [7] used the LS-DYNA finite element software to establish numerical calculation models of the SFT of circular, elliptical, and rectangular cross-sections, and to simulate the external underwater explosion, comparing the displacement, pressure, and effective stress of the SFT for different cross-section types. The results indicate that the SFT of circular cross-section is the least affected by explosions. Du et al. [8] designed a 1/10 scale SFT model based on relevant tunnel design specifications, conducted three underwater explosion tests, and compared the free-field explosion experimental data with the Zamyshlyayev–Cole empirical formula. The results show that the peak pressure on the explosion-facing side of the SFT was 1.626 to 1.716 times that of the free-field peak pressure. The vibration process of the SFT is divided into three stages: rapid structural deformation, large-scale structural vibration, and structural flutter. Yang et al. [9] simulated the effect of underwater explosion on the reinforced concrete shallow-buried submarine tunnel based on the Coupled Lagrangian and Euler (CLE) method, studied the potential failure modes of the tunnel through extensive numerical simulations, and proposed an empirical relationship for predicting the damage degree of the tunnel based on the weight of the explosive and the safety distance. They also studied the vibration reduction effects of different reinforcement schemes, and the results show that attaching carbon fiber-reinforced composite materials could significantly increase the stiffness and load-bearing capacity of the tunnel. Fan et al. [10] established a fully coupled numerical model of an underwater shallow-buried tunnel based on the ALE method, comprehensively considering the strain rate effect of concrete and steel under explosion, the propagation of explosion waves, the interaction between fluid and solid, and the nonlinear response of the structure, studying the failure process and mechanism of the shallow-buried tunnel, and discussing the influence of saturated soil cover layer, explosive weight, buried depth, and water depth on the dynamic behavior and damage mode of the tunnel.
The above studies have conducted preliminary explorations on the dynamic response and cross-sectional characteristics of the SFT under explosive loads by means of theoretical derivation, experimental research, and numerical simulation. However, they are all limited to non-contact explosive loads at a relatively long distance. There is a lack of research on the internal and external contact explosions of the SFT. Due to the closed structure and limited space of the SFT, the structural damage and the amplitude of dynamic response caused by internal explosions are more severe. Meanwhile, external close-contact explosions not only cause damage and destruction to the SFT body but also lead to significant instantaneous responses of the internal road, affecting driving safety. Therefore, it is of great significance to study the dynamic response and structural damage under internal and external explosive loads for the safety design and structural optimization of the SFT. In this study, a truncated numerical model of the SFT is established based on LS-DYNA. The ALE method is adopted to simulate the contact between the SFT and the inside and outside fluids, and the pressure transmission of explosive loads in the fluids. Through numerical simulation, the dynamic response and damage development under different explosion scenarios are analyzed, and the dangerous explosion positions are identified, providing a basis for the cross-sectional optimization and safety design of the SFT.
2. Dynamic Response and Damage Analysis Model of SFT Under Explosive Loads
2.1. Numerical Simulation Model
The typical cross-section and size parameters of the SFT are shown in Figure 1. This research focuses on the external and internal explosion conditions that may occur during operation. The damage caused by the close-contact explosions is mainly concentrated near the explosion area, and the peak load of the explosions occurs in an extremely short time. Therefore, the SFT tube is truncated to improve the computational efficiency. The longitudinal displacement at the end of the truncated model is constrained, and the symmetrical boundary is set. The fluid–structure interaction model is established based on the ALE method, comprehensively considering the contact between the SFT and the external water as well as the internal air. Non-reflecting boundaries are set to eliminate the boundary effect. The details are shown in Figure 2.
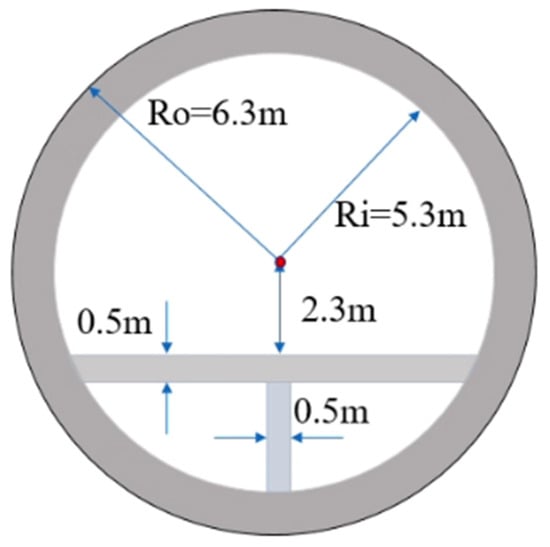
Figure 1.
Basic parameters of SFT.
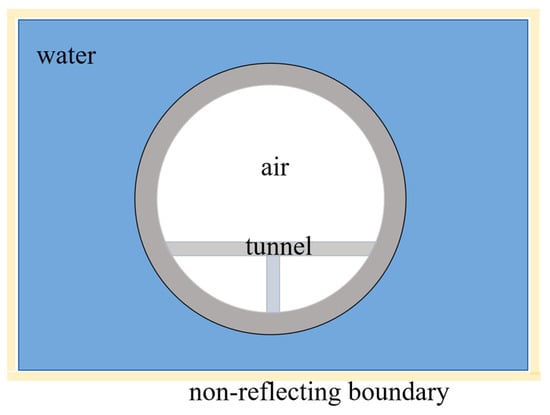
Figure 2.
Schematic diagram of the ALE coupling model.
2.2. Material Model Parameters
The explosive is filled with spherical TNT and described by the JWL equation of state [11], which is expressed as follows:
where pTNT represents the detonation pressure; V represents the relative volume of the explosive before and after explosion; ETNT is the initial internal energy of the explosive; ATNT, BTNT, R1, R2, and ω are constants. The parameters are shown in Table 1.

Table 1.
Material parameters of TNT.
The air is described by the linear_polynomial equation [12], and its expression is as follows:
where pair represents air pressure; Eair is the internal energy per unit volume; C0~C6 are equation coefficients related to the air; μa = ρa/ρa0 − 1, and ρa/ρa0 is the ratio of current density to reference density of air. The material parameters are shown in Table 2.
Table 2.
Material parameters of air.
The water is described by the Gruneisen equation [13], and the expression is as follows:
where pw represents the water pressure; Cw is the speed of sound in water; μw = ρw/ρw0 − 1, in which ρw and ρw0 are the current density and reference density of water; S1, S2, S3 and γ0 are dimensionless constants; α is the first-order volume correction of γ0; Ew is the internal energy of water. The material parameters are shown in Table 3.
Table 3.
Material parameters of water.
The Holmquist–Johnson–Cook (HJC) model is employed to represent the behavior of concrete, which can comprehensively consider the strain rate effect, damage accumulation, and failure behavior [14]. The failure mode is set as the maximum principal strain failure and tensile failure. The HJC model describes the yield characteristics through dimensionless equivalent stress to control the shape change in material elements, which is expressed as follows:
where σ* and P* represent the normalized equivalent stress and pressure; ε* is the dimensionless equivalent strain rate; ε0 is the reference strain rate; A is the normalized cohesive strength coefficient; B is the normalized pressure hardening coefficient; C is the strain rate coefficient; N is the pressure hardening exponent; fc′ is the quasi-static uniaxial compressive strength of concrete.
The relationship between the pressure and the volumetric strain is divided into steps of elastic, fragmentation, and compaction, and describes the volume change in the material elements under high pressure with the following state equations:
where Pcrush, μcrush, Plock, and μlock are, respectively, the critical pressures and volumetric strains for crushing and locking; K1, K2, and K3 are pressure constants; Ec is the elastic modulus; and vc is Poisson’s ratio.
The damage is represented through the accumulation of equivalent plastic strain and plastic volumetric strain, which is described by the following equations:
where Δεp and Δμp represent the increments of equivalent plastic strain and equivalent volumetric strain within one integration step, εf and μf denote the plastic strain and volumetric strain at failure under atmospheric pressure, and D1 and D2 are the damage constants. The parameters are shown in Table 4.
Table 4.
Material parameters of HJC.
2.3. Fluid–Structure Interaction Method
Based on the ALE method, a numerical model of the SFT under explosive loads is established in the LS-DYNA, and the contact between the fluids and the SFT is set through keywords. After the pressure of the explosion has been input into the fluid domain, the fluid pressure is updated based on the ALE control Equation (7) and the equation of state (2, 3). The calculated area is determined by detecting the overlapping elements at the fluid–structure contact interface, and the displacement and velocity of nodes are solved by the central difference method [15,16,17].
where ρ represents density; v and u represent the velocity of the material and the grid, respectively; σ is the stress tensor; ε is the strain tensor; e stands for energy.
3. Dynamic Response and Damage Analysis of SFT Under Internal Explosive Loads
3.1. Case Settings
The TNT equivalent of the explosive material is set based on the assessment data from the Federal Emergency Management Agency of the United States. The TNT equivalent for a sedan is set at 230 kg, and that for a small truck is set at 1800 kg. Due to the difference in vehicle sizes, the heights of the explosion positions from the road surface are set at 0.5 m and 1.2 m, respectively, based on the positions of the center of gravity when fully loaded. The explosion positions are selected at the middle of the road, the middle of one side of the road, and near the SFT wall to simulate the explosions of the two types of vehicles. For the closed area at the bottom of the SFT, the concealed bomb (40 kg TNT equivalent) being placed by humans is considered. The explosion positions are selected near the junctions of the road and the SFT wall, the road and the supporting wall, as well as the supporting wall and the SFT wall, with the center of the explosion 0.4 m away from the nearest wall. The specific details are shown in Figure 3.
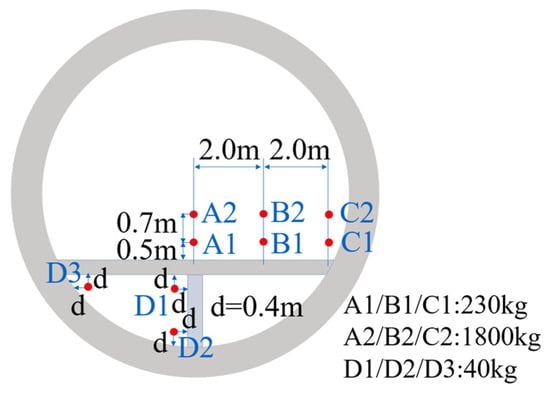
Figure 3.
Schematic diagram of the internal explosion positions.
3.2. Model Validation
Kingery and Bulmash summarized the empirical formula for calculating the peak pressure of free air blast of TNT based on a large number of experiments [18], as shown in Equation (8), where Z is the scaled distance, R is the radius of the TNT explosive, W is the mass of the explosive, and Pi is the peak value of the incident shock wave. Karlos et al. [19] corrected the equation for near-field explosions (0.053 ≤ Z ≤ 0.4), which made the results well match the numerical simulation results. The parameters after correction are shown in Table 5.
Table 5.
Empirical formula coefficient modified by Karlos.
Four sets of grid sizes of 0.05 m/0.10 m/0.15 m/0.20 m were selected for the verification of grid convergence. The computational models of spherical TNT explosives in free air were established, respectively, and the peak values of the explosion at the corresponding distances of each group of explosion conditions were solved. The peak values under different grid sizes in Table 6 were compared with the calculation results of the corrected empirical formula. It can be seen that the 0.01 m grid size fits well, and this size was adopted for the calculations for the internal explosions.
Table 6.
Comparison of peak pressure in grids of different sizes (Mpa).
3.3. Result Analysis
3.3.1. Dynamic Response Analysis of Monitoring Points
Internal explosions cause instantaneous accelerations, which seriously endanger the safety of vehicles and passengers. Therefore, monitoring points are selected in the cross-section of the SFT to study the distributions of peak accelerations and the attenuation law along the longitudinal direction. As shown in Figure 4, four groups of monitoring points are selected on the road surface and SFT wall in the case of explosions above the internal road, and four groups of monitoring points are selected for analysis in the case of explosions in the closed area at the bottom of the SFT. The layout of the monitoring sections is shown in Figure 5, with the distance between sections being one times the radius of the SFT (Ri).
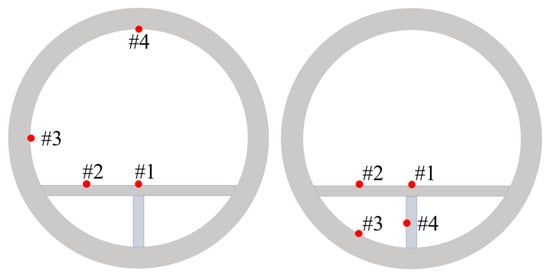
Figure 4.
Layout of monitoring points.
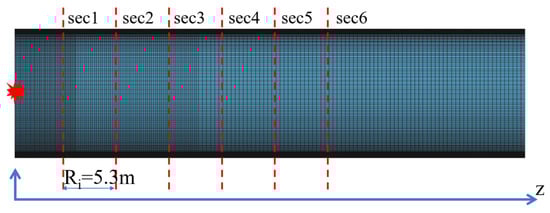
Figure 5.
Layout of monitoring sections.
Figure 6 shows the acceleration histories of the monitoring points (MP1-4) at different sections in case A1. It can be observed that the intervals of the peak accelerations of the monitoring points on the road are basically equal, and the duration is extremely short. However, for the monitoring points on the SFT wall, due to their greater distances from the explosion position, the arrival moments of the peak accelerations are delayed, and the peak values are significantly reduced. Figure 7 presents the acceleration histories of the monitoring points in case A2. The peak accelerations within the range of 1Ri (5.3 m) caused by the explosion of 1800 kg TNT exceed 14,000 m/s2, and the differences among the peak accelerations at the four monitoring points are relatively small.
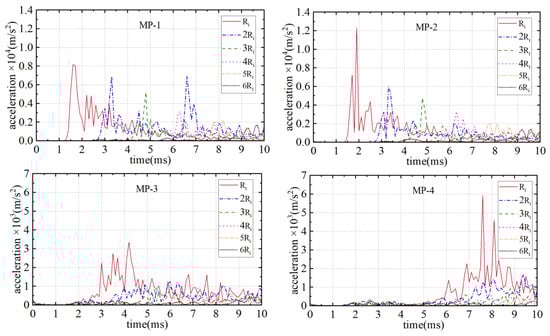
Figure 6.
Histories of peak accelerations in case A1.
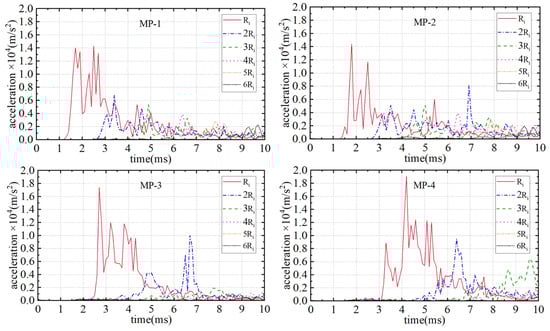
Figure 7.
Histories of peak accelerations in case A2.
The distributions of peak accelerations along the longitudinal direction of the SFT for the monitoring points on the road surface in case A1/A2/B1/B2/C1/C2 are shown in Figure 8. It can be seen that in cases A1/B1/C1, the road surface accelerations within the range of 1Ri (5.3 m) from the explosion centers exceed 8000 m/s2. As the explosion positions gradually approach the side wall of the SFT, the peak accelerations on the road surface also increase. The road surface accelerations outside the range of 6Ri (31.8 m) from the explosion centers drop below 2000 m/s2; the peak accelerations of the side and top walls of the SFT decrease as the explosion positions approach the side wall, and the peak accelerations of the SFT wall drop below 1000 m/s2 at a distance of 6Ri (31.8 m) from the explosion centers. In cases A2/B2/C2, the mass of explosives and the heights of the explosion centers increase. Therefore, the peak accelerations on the road surface within 1Ri (5.3 m) of the explosion centers almost all exceed 10,000 m/s2, and the peak accelerations on the SFT wall almost all exceed 16,000 m/s2; the peak accelerations outside the range of 6Ri (31.8 m) drop below 2000 m/s2. From the peak values of the six cases, it can be seen that within the range of 3Ri (15.9 m), the peak accelerations decrease significantly. Moreover, the accelerations generated by the explosions of the small truck are notably higher than those of the sedan. The influences of the explosions of the two types of vehicles gradually approach the range of 4Ri~6Ri (21.2 m~31.8 m), and the attenuation rates slow down.
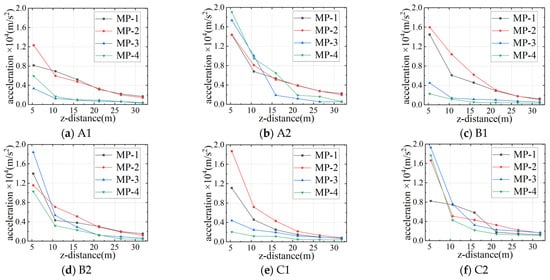
Figure 8.
Longitudinal distributions of peak accelerations in different cases.
Figure 9 shows the longitudinal distributions of peak accelerations caused by the explosions at the bottom of the SFT. Due to the reduction in the explosive mass, the peak accelerations are significantly lower than those of the explosions above the road surface. The maximum peak accelerations in the three cases are approximately 7000 m/s2. The peak accelerations rapidly decay within 2Ri (10.6 m) and drop below 1000 m/s2 at 4Ri (21.2 m).
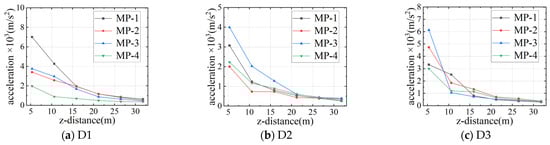
Figure 9.
Longitudinal distributions of peak accelerations in cases D1, D2, and D3.
3.3.2. Damage Analysis of SFT
Figure 10a,b show the stress nephogram of the SFT at different moments when the vehicles explode right in the middle of the road. The shock waves from the explosions first apply to the internal road surface, and then the stress spreads outward along the bottom supporting wall and the road surface. At 1.2 ms, the stress passes through the supporting wall and reaches the bottom wall of the SFT, causing deformation and cracking at the junction. At the same time, the external wall is subjected to tensile stress, resulting in longitudinal cracks. The stress is then transmitted to the junction of the road and the side wall, causing cracking. As the shock waves pressure is applied on the upper wall, tensile cracks appear on the outer surface. Compared with case A1, due to the mass of the explosive and the height of the explosion center increasing, case A2 shows earlier damage occurrence and denser cracks on the wall. Figure 10c,d show the stress nephogram of the SFT at different moments when the vehicles explode in the center of one side of the road. After the explosion, the shock waves first impact one side of the road, and the front side of the SFT wall fails due to the huge shock pressure, while the back side is damaged by tensile stress. When the stress is transmitted to the junction of the road and the side wall, cracks penetrate the wall. Subsequently, the stress is transmitted along the supporting wall to the bottom and causes cracking. The upper wall above the road also develops cracks due to the shock pressure. The number of cracks in B2 is significantly more than that in B1. Figure 10e,f show the stress nephogram of the SFT at different moments when the vehicles explode near the wall on one side of the road. It can be seen that the inner wall of the SFT and the road surface are damaged first due to the huge shock pressure. Subsequently, the stress and the shock pressure cause cracks and penetrate the junction of the wall and the internal road as well as the supporting wall. The number and the depth of cracks in C2 are significantly higher than those in C1.
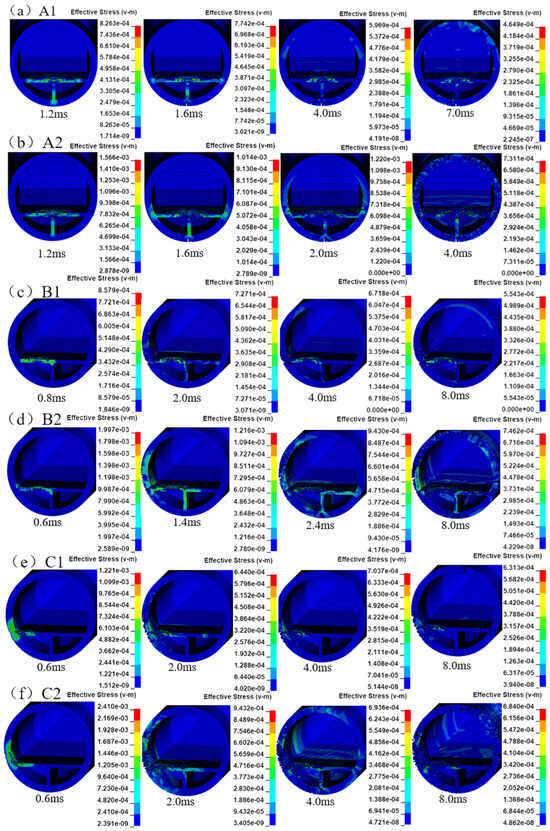
Figure 10.
Damage distributions of the SFT in the explosive sections.
The explosion positions of the six cases are all above the road surface. The shock waves first apply to the internal road, causing extensive damage to the road surface, as shown in Figure 11. The damage center roughly presents a circular distribution. By comparison, it is found that the damage on the road surface caused by the explosion of the small truck is significantly greater than that of the sedan. Additionally, longitudinal extensional damage occurs at the junction of the road and the walls on both sides, as well as the bottom supporting wall, mainly due to the relatively concentrated stress at these junctions, leading to strain failure. There is no significant difference in the width of the damage caused by the explosions of the two types of vehicles. The damage radii caused by the two types of vehicles are 2.8 m and 5.1 m, respectively, and there is no obvious relationship with the explosion positions. Since the explosion centers in cases C1 and C2 are close to the SFT walls, the damage is more severe. As shown in Figure 12, the damage nephogram on the outer wall reveals a damage area with a radius of approximately 3 m, and the cracks extend longitudinally along the SFT for more than 15 m.
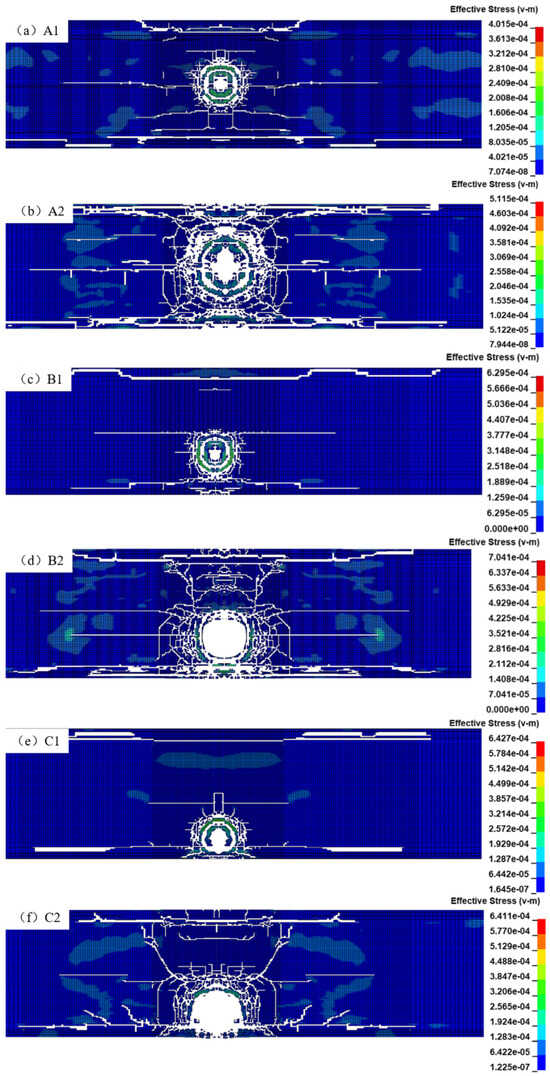
Figure 11.
Damage distributions of the internal road.
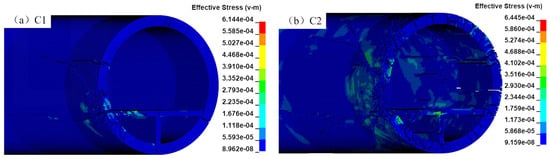
Figure 12.
Outer damage distributions in C1 and C2.
The damage nephogram at different moments caused by the concealed bombs at different positions at the bottom is shown in Figure 13. D1 is located at the upper part of the supporting wall. The shock waves first apply on the bottom of the road and the supporting wall, causing failure of the front face and tensile damage to the back face. Then, the stress is successively transmitted to the bottom of the supporting wall and the junction of the SFT wall and the road, as well as the supporting wall, resulting in a crack through the SFT wall. D2 is located at the lower part of the bottom supporting wall. The shock waves first cause failure of the front face and tensile damage of the back face of the supporting wall, then the stress is transmitted to the bottom of the SFT wall, causing cracks from the inside to the outside, and then to the junction of the road and the side wall, resulting in a crack through the SFT wall. D3 is located below the junction of the road and the side wall. The shock waves first cause damage to the area below the road surface and the inner wall of the SFT and tensile damage to the back face. Then, the crack on the outer wall of the SFT gradually spreads and penetrates, and the back of the supporting wall is extended and cracked, and the junction of its bottom and the SFT wall is penetrated accordingly.
Figure 13.
Damage distributions of the SFT in the explosive section.
Figure 14 shows the damage nephogram of the supporting walls in cases D1 and D2 and the internal road in case D3. The damage width of the supporting wall caused by the concealed bomb is approximately 4 m, and the longitudinal extensional width along the junction is about 16 m. The explosion causes damage to the road surface with a radius of approximately 1.5 m in case D3.
Figure 14.
Damage distributions of the supporting walls and internal roads.
4. Dynamic Response and Damage Analysis of SFT Under External Explosive Loads
4.1. Case Settings
There is uncertainty regarding the position of the underwater external explosion, so the SFT may be subjected to explosion shock waves from any direction. Therefore, five groups of explosion points are set along the external circumference to determine the most dangerous position of the explosion. The damage and response of the SFT under explosive loads at different scaled distances are studied by changing the TNT equivalent of the explosive, as shown in Figure 15.
Figure 15.
Schematic diagram of the external explosion positions.
4.2. Model Validation
The formula for calculating the peak pressure of underwater explosion in Zamyshlyayev–Cole empirical formula [20,21] is as follows. Based on the size of the SFT, the grid sizes of 0.05 m, 0.10 m, 0.15 m, and 0.20 m are initially determined. Different grid size models of underwater explosions are established, respectively. By comparing the peak pressure at different monitoring points with the results calculated by the empirical formula, it can be seen from Figure 16 that the peak pressure at all monitoring points is well fitted when the grid size is 0.05 m and 0.10 m. Considering the computational efficiency and the ratio of the grid sizes of water and SFT, 0.10 m is determined as the final grid size for subsequent analysis.
where p0 represents the peak pressure, W is the equivalent TNT mass, RL is the distance from the monitoring point to the explosion center, and R is the radius of the explosive.
Figure 16.
Comparison of peak pressure in grids of different sizes.
4.3. Result Analysis
4.3.1. Dynamic Response Analysis at Different Explosion Positions
The instantaneous accelerations caused by external explosions have a significant influence on the safety of vehicles traveling on the internal road. Therefore, the monitoring point 1 shown in Figure 4 of Section 3.3.1 is selected to study the acceleration response of the internal road surface. The mass of the TNT explosive is 50 kg, and the explosion distance is 2 m. The time histories of the accelerations on the road at a distance of 1Ri from the explosion center caused by explosions at different positions are shown in Figure 17. It can be seen that the explosion directly below the SFT (case P5) causes the most severe instantaneous acceleration on the road, with the peak acceleration reaching 37,700 m/s2. The peak acceleration in case P4 is approximately 22,500 m/s2, and that in case P3 is about 19,400 m/s2. The occurrence time of the peak accelerations is positively correlated with the distance between the explosion points and the bottom of the SFT. Figure 18 shows the longitudinal distributions of the peak accelerations of the monitoring points in different cases. It can be seen that the peak accelerations on the road caused by explosions at different positions rapidly decay within the range of 3Ri and show significant differences, beyond which the peak accelerations are relatively close.
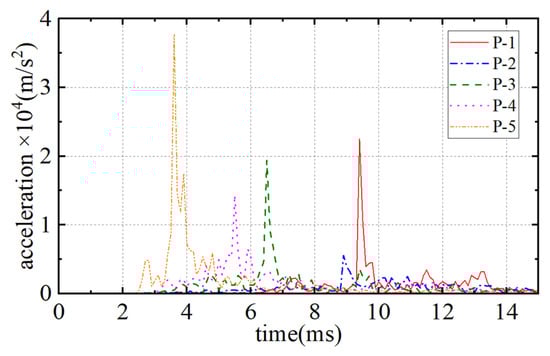
Figure 17.
Histories of accelerations at monitoring point 1 at 1Ri in external explosion cases.
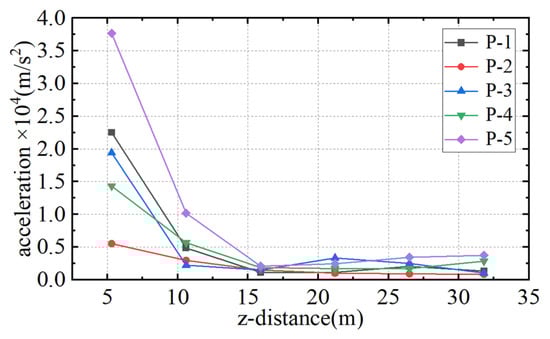
Figure 18.
Longitudinal distributions of peak accelerations in external explosion cases.
4.3.2. Damage Analysis at Different Explosion Positions
Figure 19 shows the damage nephogram of the outer wall of the SFT at different explosion positions. It can be found that the damage centers outside the wall of the SFT are roughly circular, with a radius of approximately 3.5 m, but the crack diffusion paths are different. Figure 20 shows the damage distributions in the explosive sections. It can be seen that the external underwater explosions at five positions all cause several through cracks on the outer wall and longitudinal cracks of different lengths on the internal road. The number of cracks on the wall and the longitudinal length of the internal road cracks in case P5 are significantly higher than those in other cases, which is mainly because the internal stress is transmitted to the road through the supporting wall after the shock pressure is applied on the bottom wall.
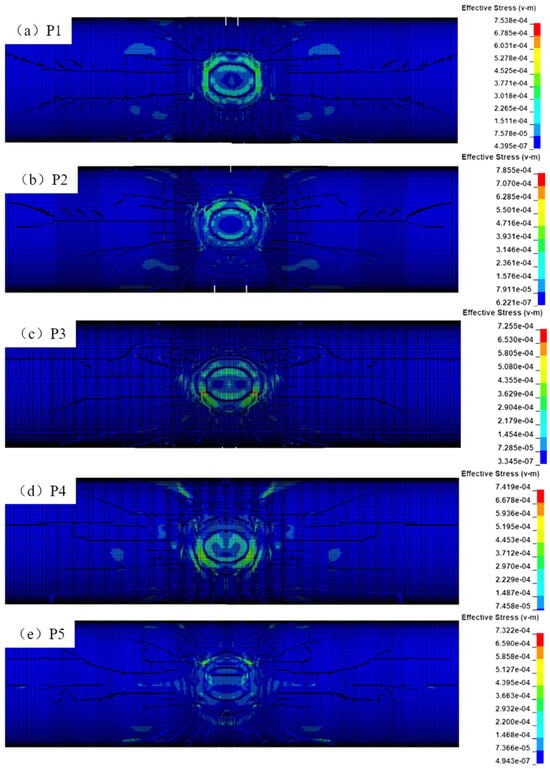
Figure 19.
Outer damage distributions of the SFT.
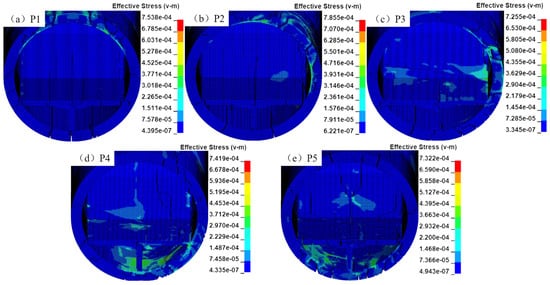
Figure 20.
Damage distributions of the SFT in the explosive section.
4.3.3. Dynamic Response Analysis Under Different Scaled Explosive Distances
The analysis in Section 4.3.1 shows that the acceleration caused by the explosion directly below the SFT (case P5) is the most severe. Meanwhile, Section 4.3.2 indicates that the damage in this case is the greatest. Therefore, four groups of explosions are simulated at P5 with 10 kg, 20 kg, 50 kg, and 100 kg of TNT explosives, whose corresponding scaled distances Z are 0.928 m/kg1/3, 0.737 m/kg1/3, 0.543 m/kg1/3, and 0.431 m/kg1/3, respectively. The time histories of the accelerations on the road at 1Ri from the explosion center in different cases are shown in Figure 21.
Figure 21.
Histories of accelerations at monitor point 1 at 1Ri in external explosion cases.
It can be seen that as the scaled distance decreases, the peak acceleration occurs slightly earlier and the duration is prolonged. When the scaled distance is less than 0.543 m/kg1/3, the peak accelerations increase rapidly with the mass of explosives. When the scaled distance is greater than 0.543 m/kg1/3, the increase rate of the peak accelerations with the mass of explosives slows down significantly.
4.3.4. Damage Analysis Under Different Scaled Explosive Distances
Figure 22 shows the damage nephogram of the outer wall of the SFT in different cases. It can be found that the radius of the circular damage center on the outer wall increases slightly with the decrease in the scaled distance, and the cracks outside the damage center also increase significantly. Figure 23 shows the damage distributions of the explosive sections. It can be seen that the penetrating cracks on the outer wall increase with the decrease in the scaled distance. When the scaled distance is 0.928 m/kg1/3 and 0.737 m/kg1/3, the cracks are mainly concentrated on the wall below the internal road, and only a few longitudinal cracks appear on the internal road. When the scaled distance is 0.543 m/kg1/3, the wall above the internal road also shows penetrating cracks, and at the same time, a large area of severe damage appears on the internal road.
Figure 22.
Outer damage distributions of the SFT.
Figure 23.
Damage distributions of the SFT in the explosion section.
5. Conclusions
Based on the above calculation and analysis, the following conclusions can be drawn:
- (1)
- The peak acceleration on the road of the SFT caused by the explosion of a sedan exceeds 8000 m/s2, and that caused by a small truck exceeds 14,000 m/s2. The accelerations caused by the explosions of both types of vehicles rapidly decrease with the increase in the longitudinal distance. The peak accelerations within three times the radius of the SFT decrease significantly and gradually approach within the range of 4~6 times the radius of the SFT. The accelerations caused by the concealed bombs under the road are significantly lower than those caused by the explosions on the road surface, with the maximum peak acceleration being approximately 7000 m/s2. It rapidly decreases within twice the radius of the SFT, and the peak acceleration drops below 1000 m/s2 at four times the radius of the SFT.
- (2)
- The shock waves from a vehicle explosion above the road will first affect the internal road, causing circular damage on the side of the road facing the explosion, longitudinal extensional damage at the junction of the road surface and the SFT wall as well as the bottom supporting wall, and longitudinal cracks on the SFT wall. When the explosion center is close to the side wall, the damage to the wall is more severe. The radius of the road damage caused by the explosion of a small truck is significantly larger than that of a sedan, but there is no significant difference in the longitudinal extensional width of the damage. The damage caused by a concealed bomb at the bottom of the SFT is mainly concentrated on the road surface and the supporting wall where the explosion occurs. Due to the stress being transmitted to the junctions, longitudinal extensional damage will also occur.
- (3)
- The dangerous position for external underwater explosions is directly below the SFT. Changes in the explosion positions mainly affect the accelerations on the internal road. The time history of the acceleration is a single-peak curve, and the increase and decay of the acceleration are extremely rapid. Within a range of three times the SFT radius along its longitudinal direction, the peak acceleration on the internal road decays rapidly. The main damage range radius of the SFT wall caused by external explosions at different positions does not show significant changes, but the longitudinal extension paths of the cracks are different. The number of cracks on the wall caused by the explosion directly below the SFT and the longitudinal lengths of the cracks on the internal road are significantly longer than those at other locations.
- (4)
- When the scaled distance of the underwater explosion directly below the SFT is higher than 0.543 m/kg1/3, the peak accelerations of the internal road increase rapidly with the mass of the explosives, and the penetrating cracks on the wall mainly occur below the internal road. When the scaled distance is lower than 0. 543 m/kg1/3, the increase in the peak accelerations slows down, and the stress transfer effect of the supporting wall causes large-scale damage to the internal road, and penetrating cracks also appear on the upper wall.
Author Contributions
Conceptualization, X.Y. and D.Q. (developed the research idea and defined the scope of the study); Methodology, D.Q. and L.W. (designed the experimental methods, algorithms, and analytical procedures); Software, M.W. (developed and implemented the code, and performed software testing); Validation, M.W. (conducted validation experiments and verified result accuracy); Formal analysis, M.W. (performed statistical and formal analysis of the results); Investigation, L.W. (carried out literature review, data collection, and case analyses); Resources, X.Y. and D.Q. (provided materials, funding, and instrumental support); Data curation, M.W. (curated, cleaned, and managed the data); Writing—original draft, M.W. (wrote the initial manuscript); Writing—review and editing, D.Q. (revised, edited, and improved the manuscript); Supervision, X.Y., M.W., X.Z., and L.W. (oversaw the research process, provided guidance, and ensured quality control); Project administration, X.Y. and X.Z. (managed project coordination, timeline, and team collaboration). All authors have read and agreed to the published version of the manuscript.
Funding
This work was supported by the National Key R&D Program of China [Grant No. 2022YFB2602800] and Science and Technology Projects of Liaoning Province [Grant No. 2023011352-JH1/110].
Data Availability Statement
The original contributions presented in this study are included in the article. Further inquiries can be directed to the corresponding author.
Conflicts of Interest
Authors Xiangji Ye, Xin Zhao, and Li Wang were employed by the company CCCC First Harbour Consultants Co., Ltd. The remaining authors declare that the research was conducted in the absence of any commercial or financial relationships that could be construed as a potential conflict of interest.
References
- Xiang, Y.Q.; Liu, C.X.; Zhang, K.Q.; Wu, Q.Q. Risk analysis and management of submerged floating tunnel and its application. Procedia Eng. 2010, 4, 107–116. [Google Scholar] [CrossRef][Green Version]
- Lin, H.; Xiang, Y.Q.; Yang, Y.; Chen, Z.Y. Dynamic response analysis for submerged floating tunnel due to fluid-vehicle-tunnel interaction. Ocean Eng. 2018, 166, 290–301. [Google Scholar] [CrossRef]
- Luo, G.; Zhang, Y.L.; Ren, Y.; Guo, Z.R.; Pan, S.K. Response of submerged floating tunnel under action of underwater explosion-moving load. J. Harbin Inst. Technol. 2022, 54, 85–94. [Google Scholar] [CrossRef]
- Seo, S.I.; Sagong, M.; Son, S.W. Global response of submerged floating tunnel against underwater explosion. KSCE J. Civ. Eng. 2015, 19, 2029–2034. [Google Scholar] [CrossRef]
- Luo, G.; Zhang, Y.L.; Pan, S.K.; Jia, H.H.; Liu, C. Response parameter analysis of submerged floating tunnels under underwater shock. Appl. Math. Mech. 2020, 41, 467–479. [Google Scholar] [CrossRef]
- Kristoffersen, M.; Minoretti, A.; Børvik, T. On the internal blast loading of submerged floating tunnels in concrete with circular and rectangular cross-sections. Eng. Fail. Anal. 2019, 103, 462–480. [Google Scholar] [CrossRef]
- Luo, G.; Yang, Y.S.; Yan, L.; Zhang, Y.H.; Ahmed, M.E.; Liu, F.L. Influence of shape of submerged floating tunnel body on structural response to underwater explosion. Tunn. Constr. 2024, 44, 1233–1240. [Google Scholar] [CrossRef]
- Du, C.; Zhang, J.P.; Zhuang, T.Q.; Wu, J.; Xu, W.X.; Zhang, T. Pressure distribution and dynamic response of a submerged tunnel under explosion loading. Explos. Shock Waves 2024, 44, 121–131. [Google Scholar] [CrossRef]
- Yang, G.D.; Wang, G.H.; Lu, W.B.; Yan, P.; Chen, M. Damage assessment and mitigation measures of underwater tunnel subjected to blast loads. Tunn. Undergr. Space Technol. 2019, 94, 103131. [Google Scholar] [CrossRef]
- Fan, Y.; Tan, Z.Y.; Yang, G.D.; Cui, X.Z.; Deng, K.; Tian, B. Analysis of dynamic behavior and damage mode of shallow buried tunnel due to underwater explosions. Ocean Eng. 2024, 296, 117015. [Google Scholar] [CrossRef]
- Zhai, J.Z.; Kong, X.S.; Zhou, H.; Zheng, C.; Jin, Z.Y. Investigation on structure damage equivalence of hull girders with different scales subjected to near-field underwater explosion. Appl. Ocean Res. 2025, 161, 104681. [Google Scholar] [CrossRef]
- Lei, Y.M.; Hu, J.; Chen, Z.Y.; Cao, M.S.; Zhang, X.D.; Wang, R.Z.; Zhao, Y.; Liu, H.C. Failure modes and damage superposition effect of concrete gravity dams subjected to sequential underwater explosions. Eng. Fail. Anal. 2025, 175, 109576. [Google Scholar] [CrossRef]
- Wu, H.; Chen, Z.Q.; Cheng, Y.H. Influence of explosion position on blast resistance of concrete gravity dam against underwater explosion blast wave and bubble pulsation. Eng. Fail. Anal. 2025, 169, 109188. [Google Scholar] [CrossRef]
- Jiang, J.J.; Lu, X.Z. Finite Element Analysis of Concrete Structures; Tsinghua University Press: Beijing, China, 2013; pp. 340–343. [Google Scholar]
- Souli, M.; Ouahsine, A.; Lewin, L. ALE formulation for fluid–structure interaction problems. Comput. Methods Appl. Mech. Eng. 2000, 190, 659–675. [Google Scholar] [CrossRef]
- Gao, Y.; Jia, X.Y.; Lu, X.; Ma, F. Study on the damage patterns of ring-stiffened cylindrical shells under underwater explosion(UNDEX) loading. Int. J. Impact Eng. 2025, 202, 105312. [Google Scholar] [CrossRef]
- Zhang, K. Experimental and Numerical Research on Damage of Stiffened Cylindrical Shells Based on Underwater Explosion Shock Wave and Bubble Impluse. Ph.D. Thesis, Haibin Engeering University, Harbin, China, 2019. [Google Scholar] [CrossRef]
- Kingery, C.; Bulmash, G. Air Blast Parameters from TNT Spherical Air Burst and Hemispherical Surface Burst; Ballistic Research Laboratories: Aberdeen, MD, USA, 1984. [Google Scholar]
- Karlos, V.; Solomos, G.; Larcher, M. Analysis of Blast Parameters in the Near-Field for Spherical Free-Air Explosions; EUR 27823; Publications Office of the European Union: Luxembourg, 2016. [Google Scholar] [CrossRef]
- Cole, R.H. Underwater Explosions; Princeton University Press: Princeton, NJ, USA, 1948; pp. 118–127. [Google Scholar]
- Zamyshlyayev, B.V.; Yakovlev, Y.S. Dynamic Loads in Underwater Explosion; Naval Intelligence Support Center Translation Division: Washington, DC, USA, 1973. [Google Scholar]
Disclaimer/Publisher’s Note: The statements, opinions and data contained in all publications are solely those of the individual author(s) and contributor(s) and not of MDPI and/or the editor(s). MDPI and/or the editor(s) disclaim responsibility for any injury to people or property resulting from any ideas, methods, instructions or products referred to in the content. |
© 2025 by the authors. Licensee MDPI, Basel, Switzerland. This article is an open access article distributed under the terms and conditions of the Creative Commons Attribution (CC BY) license (https://creativecommons.org/licenses/by/4.0/).