Article

Multi-Mode Joint Equalization Scheme for Low Frequency and Long Range Shallow Water Communications

by
Shuang Xiao
1,
Yaqi Zhang
1,
Bin Liu
1,*,
Hongyu Cui
2 and
Dazhi Gao
3
1
College of Information and Communication Engineering, Harbin Engineering University, Harbin 150001, China
2
College of Underwater Acoustic Engineering, Harbin Engineering University, Harbin 150001, China
3
College of Information Science and Technology, Ocean University of China, Qingdao 266100, China
*
Author to whom correspondence should be addressed.
J. Mar. Sci. Eng. 2025, 13(8), 1587; https://doi.org/10.3390/jmse13081587
Submission received: 28 July 2025 / Revised: 14 August 2025 / Accepted: 17 August 2025 / Published: 19 August 2025

Abstract

To improve the spatial processing performance in the low frequency and long range shallow water communication system, a multi-mode joint equalization scheme is proposed, which combines modal depth function estimation, mode filtering, and multi-input equalization. This method first estimates the modal depth function of the effective modes by Singular Value Decomposition (SVD) of Cross Spectral Density Matrix (CDSM), then separates the influence of each mode on the continuous-time signal by the vertical array mode filtering without any prior information. After these pre-processings, the separated signal is only affected by the single channel mode, and the output Signal-to-Noise Ratio (SNR) is enhanced, and channel delay spread is reduced simultaneously. All the separated parts are then sent to a multi-input equalizer to compensate for the channel fading between different modes.Simulation results verify that compared with single channel equalization after beamforming and multichannel equalization, the proposed multi-mode joint equalization can obtain 3 dB and 6 dB gain, respectively. Experimental results also show that the proposed equalization can achieve lower Bit Error Rate (BER) and higher output SNR.

1. Introduction

Long range is one of the important trends in the development of underwater acoustic communication technology [1]. To improve communication performance in such circumstances, a vertical receiver array is often equipped to utilize the spatial characteristics of the acoustic field. Among the various array processing approaches, beamforming and multichannel equalization are most commonly used in communication systems because they can improve the input SNR and combat spatial channel fading by taking advantage of the uncorrelated or independent components of the signals [2,3,4,5,6,7]. Since the water and boundary absorption coefficients obviously increase with frequency, low frequency signal can also be utilized to improve the receive gain during long range underwater transmission. As a result, the low frequency communication systems with array receivers have attracted increasing attention in recent years [8].
However, low frequency acoustic signals show complex properties when they propagate in the long range shallow water environment. Generally, shallow water usually refers to water depths less than 200 m. Since the water depth and wavelength are of the same order, the acoustic waveguide characteristics are more obvious, especially when the range is larger than several times the water depth. Under such circumstances, the acoustic field is modeled by the normal mode theory, which characterizes the received signal by the combination of a few multi-mode components with distinct nonlinear phases [9]. In the time domain, the channel impulse response is the combination of several transmitted pulse replicas with distinct dispersion levels. The time delay spread may be significantly large, which will increase the computation complexity for multichannel estimation and equalization [10]. Besides, a mode is a superposition of upgoing and downgoing plane waves with equal amplitude and vertical wavenumber, while the amplitude and phase vary periodically in the vertical direction [11]. As a result, the signals between receivers show low coherence and beamforming loss. To enhance the spatial processing performance in low frequency and long range shallow water communications, the approach matched to the acoustic waveguide characterisers should be elaborated.
Matched field processing (MFP) is a widely used spatial processing technique in the waveguide. It can realize the target localization and geoacoustic inversion by matching the actual acoustic field with the modeled results when parts of the acoustic propagation characteristics are known [12]. Matched mode processing (MMP) is the extension of MFP, which matches the calculated and real field in the mode space after mode decomposition [13]. The comparisons of the mode filtering approaches conducted in [14,15,16] show that the mode decomposition operation can extract a single propagated mode with the improved output SNR. In [17], Morozov et al. attempted to increase the shallow water communication performance by MMP. The authors exploited the mode filtering to suppress most of the channel fading, and then the information can be equalized by any kind of simple decoder [17,18]. Experimental data validated the approach, and the results show that high-quality data transmission can be achieved even in a complicated environment with low frequencies. Their work is enhanced in [19,20,21,22] to select the least fading mode for communication by waveguide invariant in both shallow water and deep water. However, these methods require a sound velocity profile (SVP) to build the filter matrix and can only exploit partial received information for demodulation, which may lead to poor performance for low SNR.
Inspired by these ideas, a multi-mode joint equalization scheme is proposed for low frequency and long range shallow water communication systems. A modal depth function estimation method is applied for the probe signal to construct the filter matrix. Then, the influence of each mode on the transmitted signal is separated by mode filtering with the help of a large-aperture vertical line array. After these pre-processing steps in the mode space, each filtered signal is only distorted by a single mode, thereby shortening the channel delay spread. Since each mode suffers from different dispersion levels, the coherence among all the filtered signals is low after long range propagation. Thus they can be equalized by a multi-input equalization scheme to combat the channel fading. Compared with commonly used multichannel equalization, the input SNR is enhanced and the required length of the equalizer is decreased, both of which are important in improving the demodulation performance. Besides, the proposed scheme is equivalent to exploiting both the spatial diversity and the frequency diversity of the received array signal without the prior waveguide information. The effectiveness of the proposed scheme is verified by simulation and experimental data.
The remainder of the paper is organized as follows. In the next section, we will briefly introduce the propagation characteristics of low frequency acoustic signals. Section 3 shows the details of the proposed multi-mode joint equalization scheme. Section 4 and Section 5 present the typical simulation results and the experimental data analysis, respectively. Section 6 concludes the paper.

2. The Acoustic Field Model and Channel Characteristic

The normal mode model can obtain the amplitude and phase information at each receiving point, which can provide various signal processing methods to analyze and calculate the acoustic field. According to the theory under the range-independent environments, the acoustic pressure field in range r and depth z excited by an isotropic point source S ω with frequency ω can be represented as [9]
p ω , r , z = Q S ω m = 1 M ψ m ω , z s ψ m ω , z e i k r m ω r k r m ω r ,
where Q = i e i π / 4 8 π ρ z s represents a constant factor, and ρ z s is the water density at source depth z s . M is the number of effective propagating modes. ψ m and k r m are the modal shape functions depending only on depth and horizontal wavenumber of mode m, respectively. For perfect waveguide assumption, whose surface is an ideal pressure release boundary and the bottom at D is the ideal rigid boundary, they are given by
ψ m z = sin ( 2 m 1 ) π z 2 D ,
k r m ω = ω c 2 m 1 2 π D 2 m = 1 , 2 , ,
where c is the sound velocity. For other shallow waveguides, the analytical expressions are more complex, whereas they can be regarded as variants of Equations (2) and (3).
As can be seen, the received signal at r , z is the combination of M modal components. In the vertical direction, the channel is characterized by standing waves represented by the modal depth function ψ m . When functions are considered as continuous functions spanning the entire water column, all the modes are orthogonal to each other as follows
0 D Ψ m z Ψ n z ρ z d z = 0 , for m n
In the horizontal direction, the characteristics of the transmitting waves are described by k r m . According to Equation (3), each mode undergoes different nonlinear phases. For a given mode, the phase and group velocity are defined by the phase function as follows
v p m = ω k r m ω and v g m = d ! d k r m ω .
The phase and group velocities represent the horizontal velocity of a particular phase and the energy transport, respectively. As can be seen in (3), both of them are nonlinear functions of mode order m and frequency ω . For the group velocity, the higher frequency and the lower modal order refer to a faster velocity in most shallow water environments. When ω is high enough, both of the velocities approach the medium velocity c for all mode orders because k r m ω / c . Then, the sound propagation can be modeled by the Ray Tracing theory [23].
Due to the strongly nonlinear change of energy propagation, the transmission delay varies along with modal orders and frequency components naturally. Therefore, the transmitting broadband signal is seriously distorted. As an example, a 0.01 s Continuous Wave (CW) signal transmitted through a non-noisy typical shallow water channel is analyzed by the Short-Time Fourier Transform (STFT) in Figure 1. According to the figure, we can see that the received signal has the multi-mode components. Besides, the higher order modes exhibit a tilt phenomenon in the time-frequency domain, which indicates the waveform is expanded to times of the initial pulse width 0.01 s. These two characteristics are defined as the effect of inter-mode and intra-mode dispersion, respectively [24]. They are observed because different modes and frequencies undergo different delays. As the propagation range increases, the accumulated delay difference will cause waveform separation and broadening.
According to Equation (1) and Figure 1, the channel model in the time domain can be expressed by a general form as [9]
h t = m = 1 M a m t e j Φ m t
by the method of the stationary phase. The a m t and Φ m t are the complex amplitude and time-evolving phase of mode m, respectively. Therefore, the modal dispersion phenomenon of the low frequency shallow water channel shows a significant influence on the transmitted symbols. From the perspective of communication issues, both of the dispersions should be eliminated to decode the transmitted information. Besides, it is better to utilize rather than resist the channel properties, which impose a significant challenge on the receiver design. Fortunately, the inter-mode dispersion offers an idea for diversity processing, which encourages us to raise new methods.

3. The Communication Receiver Design

Due to the waveguide characteristics of low frequency shallow water channels, the received signal exhibits significant time delay spread and severely noise interfere during long range transmission. The traditional communication demodulation methods always recover the transmitted information by solving a noisy linear equation, which will lead to large computation and poor accuracy due to the complex channel condition.
In this paper, we start with the principle of channel distortion, addressing the demodulation issue differently. According to normal mode theory, multi-mode effects caused by the inter-mode dispersion are the main origin of inter-symbol interference (ISI) in received signals. Given the spatial orthogonality in Equation (4), removing multi-mode effects via mode-domain pre-processing of the received signal can suppress channel effects and simplify the inverse problem, potentially leading to a less complex demodulation system. Following this principle, a multi-mode joint equalization scheme is proposed for low frequency shallow water communication systems.
The receiver structure is shown in Figure 2, which mainly consists of three steps: modal depth function estimation, mode filtering, and multi-input equalization. Mode filtering is the core of the processing scheme, and it is suitable for continuous communication signals. By constructing an appropriate mode filtering matrix, the filtered signal is only affected by a single channel mode, which significantly reduces the channel delay spread and improves the SNR, thus showing obvious benefit for the performance of equalization processing. The mode filtering matrix can be obtained by the modal depth functions. When the environmental information is fully known, it can be simulated by a the numerical simulation program, such as Kraken [25]. However, in practical applications, model mismatch or inaccurate environmental parameters often result in significant errors, affecting the effectiveness of mode filtering. To avoid this problem, it is necessary to estimate the modal depth function from the acoustic field data without any a prior information. In the equalization part, for those transmitted communication signals that are only affected by single channel mode, a less complicated single input equalizer can be used for demodulation because of the reduced channel spread. For those symbols that are only affected by low order channel modes, due to the insignificant intra-mode dispersion, they can be observed as the signal transmitted in the Additive White Gaussian Noise(AWGN) channel. In the case of high SNR, symbols may be directly recovered to obtain the transmitted information. When the SNR is low, there are also several suitable techniques that can be used to minimize decision errors. For high order modes whose intra-mode dispersion cannot be ignored, a less complicated equalizer can also be used to demodulate the signal because of the reduced channel spread. Furthermore, to utilize all the received energy carried by the multiple modes and improve the processing gain of long range communication systems, a multi-input equalizer is also under consideration.
The details of the proposed scheme are illustrated as follows.

3.1. Part 1: Modal Depth Function Estimation

Due to the orthogonal properties of the modes in the vertical direction, the Cross Spectral Density Matrix (CSDM) of the acoustic pressure is classified as a Hermitian matrix mathematically, whose singular vectors are a mutually orthogonal set of basis functions, which are proportional to the mode eigenfunctions. Therefore, the singular value decomposition (SVD) method can be used to estimate the modal depth function of normal mode [26,27].
According to Equation (1), the acoustic pressure field in the waveguide is determined by three parameters: receiving depth, receiving distance, and frequency. Therefore, to obtain mode functions at different depths, CSDM can be constructed from the broadband acoustic field radiated by a fixed-position source [26]. In the vertical direction, the received broadband pressure field at a fixed range can be expressed by
P = p z 1 , ω 1 p z 1 , ω L p z N , ω 1 p z N , ω L = Q Ψ Λ F = Q ψ 1 z 1 ψ M z L ψ 1 z N ψ M z L ψ 1 z s 0 0 ψ m z s × S ω 1 e j k 1 ω 1 r k 1 ω 1 r S ω 1 e j k 1 ω L r k 1 ω L r S ω 1 e j k M ω 1 r k M ω 1 r S ω L e j k M ω L r k M ω L r
where N and L are the numbers of vertical grids and signal frequencies, respectively. Calculating the CSDM and performing the SVD, we have
C = P P H = Q 2 Ψ Λ F F H Λ Ψ H = US V H
where U , S and V are the corresponding decomposition matrices of C . For a Hermitian matrix C , S is a real diagonal matrix with values arranged in descending order, and S and V are identical orthogonal matrices. By comparing the right 2 items of Equation (8), we found that if F F H = I and Ψ Ψ H = I are satisfied at the same time, we have S = Λ 2 , V = Ψ . As a result, we can estimate the modal depth function matrix Ψ from the SVD of C , while the polarity and arrangement maybe different. Because the diagonal elements S in SVD are arranged by value, the number of effective modes and the relative contribution of each mode to the synthesized field can be determined by comparing the singular values. The order of the mode can be determined by zero crossing times along the depth, and polarity can also be corrected by signs. Rearranging the column vectors from the estimated V at certain positions, we can get the estimation modal depth function matrix. It should be pointed out that the rearrangement step does not affect the effectiveness of the overall communication system because our task is only to obtain the orthogonal basis matrix.
As shown in Equation (4), the Ψ Ψ H = I holds when the input acoustic pressure field is fully sampled in the vertical direction. For F , we have
l = 1 L F m ω l F m H ω l = l = 1 L S 2 ω l e j k m ω l k m H ω l r r k m ω l k m H ω l
If the input pressure signal amplitude has already been normalized, the spread attenuation and relative source amplitude can be removed. Therefore, the orthogonal condition in Equation (9) can be simplified as
i = 1 L F m ω l F m H ω l l = 1 L e j Re k m ω l k m ω l r L = ? δ m m
It seems that when Re k m ω l k m ω l r is large enough, the off-diagonal components of F F H are very small for m m , and Equation (10) holds approximately.
To further illustrate the physical condition that corresponds to large values of exponential power terms, we define
n r o t = r Re k m ω max k m ω max k m ω min k m ω min
and
n r o t B = r Re k m ω max k m ω min B k m ω max k m ω min B
where B is the bandwidth, ω max and ω min are the minimum and maximum values of the entire angular frequency range, respectively. According to [27], when n r o t > 1 increases, the exponential terms in the summation tend to cancel out for m m , thus F F H is approximately as a diagonal matrix. Coincidentally, when the bandwidth is small enough, the right side of Equation (12) can be replaced by v g m from Equation (5), and we get
n r o t = r B 1 v g m 1 v g m = B τ m τ m
It can be easily found that either the delay difference between adjacent modes is great or the pulse width 1 / B is small, n r o t may be large enough. In other words, if we have visibly separable modes within the bandwidth, F F H = I holds approximately. Since the group velocity increases rapidly as the mode order increases, for low order modes, Ψ should be estimated by a broadband signal, while for higher orders, a narrowband signal can be used following this principle.

3.2. Part 2: Mode Filtering

Mode filtering technology has been widely applied in fields such as underwater acoustic signal detection and parameter inversion, enabling the extraction of a single mode. From Equation (1), if we define
Φ m ω , r = Q S ω Ψ m ω , z s e i k r m r k r m r ,
the received narrowband pressure at a certain range received by a vertical array can be represented as
p z 1 , r p z N , r = Ψ 1 z 1 Ψ M z N Ψ 1 z N Ψ M z 1 Φ 1 r Φ M r + υ 1 z 1 υ N z N
where υ z is the noise at the receiving depth, which is usually assumed to be a zero-mean complex Gaussian distribution. The received noise of each hydrophone is uncorrelated with the others, and its covariance matrix satisfies R n = σ 2 I . Simplifying the above equation, we have
p z , r = Ψ z Φ r + V z
where Ψ , Φ , and V are the N × M , M × 1 , and N × 1 matrix. When analyzing the vertical acoustic field, Φ , it is usually assumed to be a complex vector with zero mean. The purpose of mode filtering is to estimate Φ from a noisy pressure field p . In this case, Equation (16) can be regarded as a classical inverse problem. Assuming we have a linear mode filter H , which satisfies
Φ = Hp ,
we can get the amplitude of each mode at the receive range. Due to the independence of the noise field and acoustic field, when the noise level is not significant, we can use the mode shape function Ψ to filter modes at a certain frequency according to Equation (16). The commonly used methods for constructing a narrowband mode filter H are as follows [14]:
(1) Sampled Mode Shapes (SMS): H = ΨH
This is the simplest and most commonly used method. SMS filter can also be interpreted as a spatial matched filter, which can be regarded as the optimal detector when detecting a single mode in the spatial domain under a white noise acoustic field. However, when the number of spatial samples is limited, the filter will lose its orthogonality, which will cause crosstalk when estimating multiple modes simultaneously.
(2) Pseudo Inverse (PI): H = (ΨHΨ)−1ΨH
The PI filter is derived based on the criterion of minimizing the squared error e = p Ψ H 2 . Intuitively speaking, PI filters can remove the cross-interference between all modes, but at the cost of being more sensitive to noise.
(3) Diagonal Weighting (DW): H = (ΨHΨ + λI)−1ΨH.
The DW filter can compensate for the deterioration when the sampling points is insufficient. Usually, DW filters can be regarded as an enhanced version of PI filters for large apertures, while their performance is similar to SMS filters for small apertures.
(4) Maximum A Posteriori (MAP): H = ( R Φ 1   +   Ψ H R n 1 Ψ ) 1 Ψ H R n 1 , where RΦ and Rn are the correlation matrices of mode amplitudes and noise, respectively.
The MAP filter is based on the maximum criterion under known observed pressure conditions p H P H p , and is suitable for cases where the mode amplitudes are random variables. The performance of the MAP filter is similar to that of the PI filter when the sampling is sufficient, and similar to the SMS filter when it is insufficient.
(5) Minimum Power Distortionless Response (MPDR): H = [ w 1 H ,   w 2 H , , w M H ] 2 , where wm = R p 1 Ψ m Ψ m H R p 1 Ψ m
The MPDR filter is based on the idea of minimizing the impact of other modes and noise under the condition that the desired mode passes through. R p is the covariance matrix of the vertical pressure field, which can be estimated by R p = 1 K Σ K X k ( ω ) X k ( ω ) H , where Xk(ω) is the array snapshot vector. When the number of snapshots is inadequate, a physically constrained, maximum likelihood algorithm can be utilized to obtain an accurate estimate of the Rp [16].
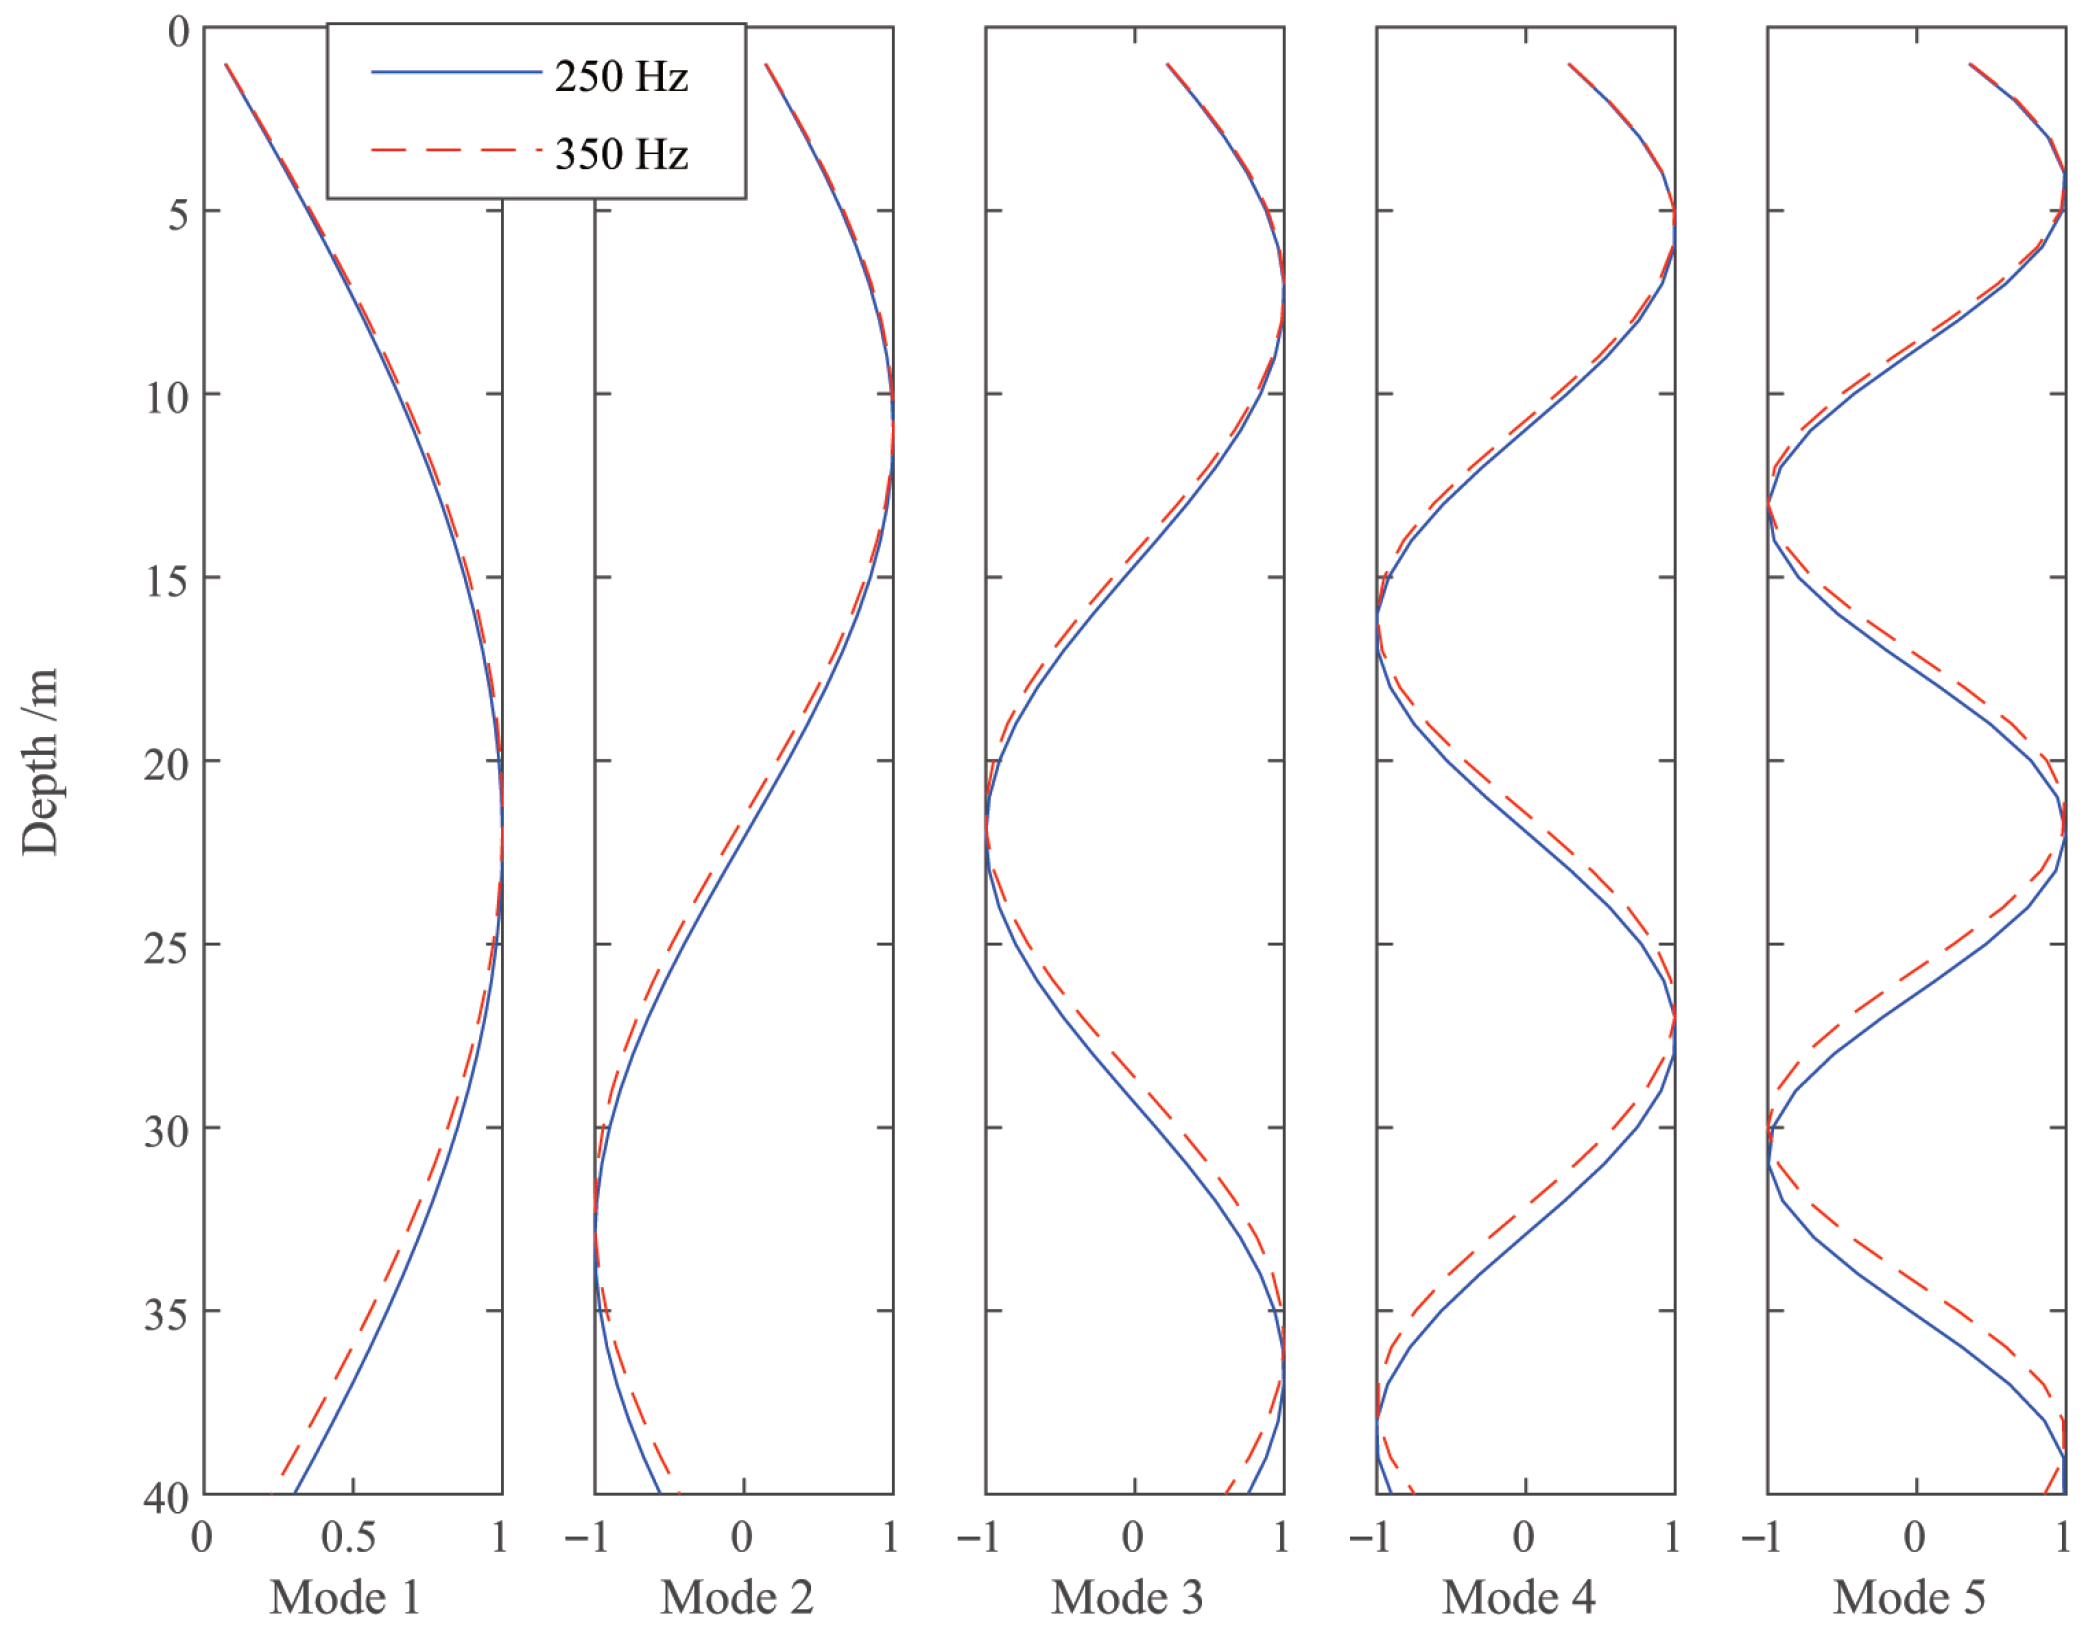
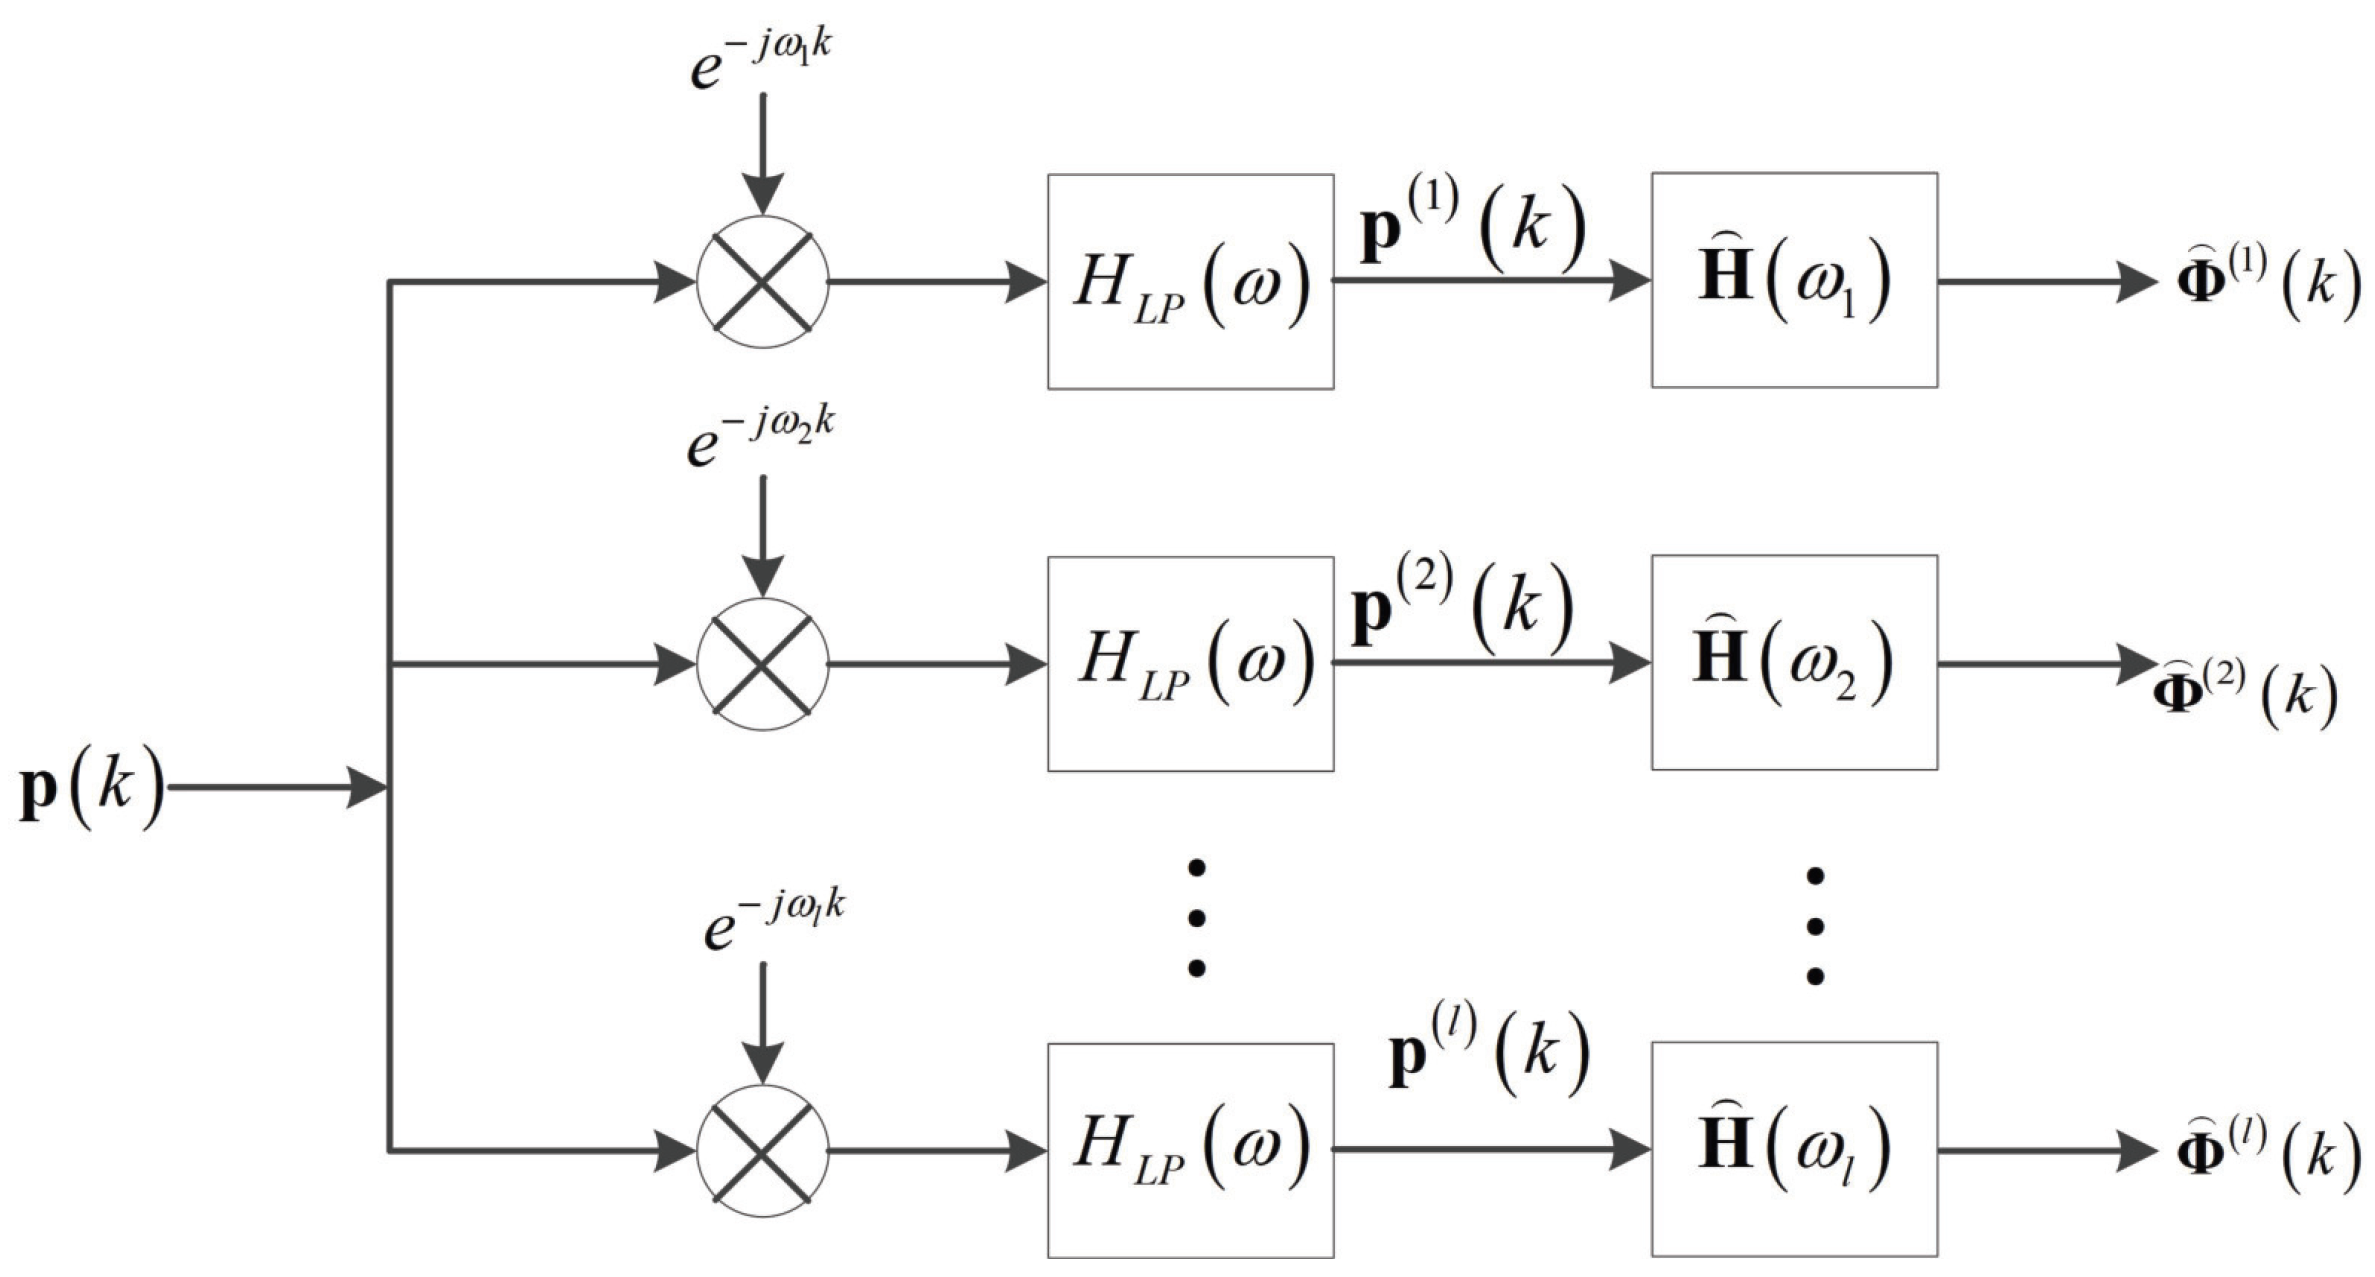
As a result, an appropriate narrowband mode filter can be built based on the input data properties and output accuracy. However, the low frequency communication signal is often modeled as broadband signal. In this case, the variation of k r m ω as well as mode amplitude Φ ! with frequency cannot be ignored. The modal depth function of the first 5 modes at frequencies of 250 Hz and 350 Hz is shown in Figure 3. The results indicate that even in an ideal channel environment, the curves of different frequencies still vary. As the signal bandwidth increases, the difference will become significant. In real environments, due to factors such as wind speed, water flow, internal waves, and others, the frequency dependence of the modal depth function will become more obvious. Therefore, mode filters under the narrowband assumption will lose some effect. One possible solution is to divide the broadband signal into several frequency intervals and apply the narrowband filter [28]. To achieve a compromise on the time-frequency resolution, the STFT idea, together with low-pass filters, is used to separate the input signals in the time and frequency domains, then send them to a mode filter to estimate the mode amplitude of each mode. The output sequence can be regarded as a set of windowed Fourier transform results. The structure of broadband signal mode filtering is explained in Figure 4.
The input p k is the received array signal in the time domain and k is the time index. After removing the sub-carrier frequency and low-pass filtering, we have p l k for frequency bin l. This operation is equivalent to bandpass filtering around each frequency bin to obtain the narrowband signal. Subsequently, apply the mode filter on each band, and the mode amplitude of each frequency bin is obtained. During the whole processing, the design of the low-pass filter depends on the changing speed of k r m .

3.3. Part 3: The Multi-Input Equalization

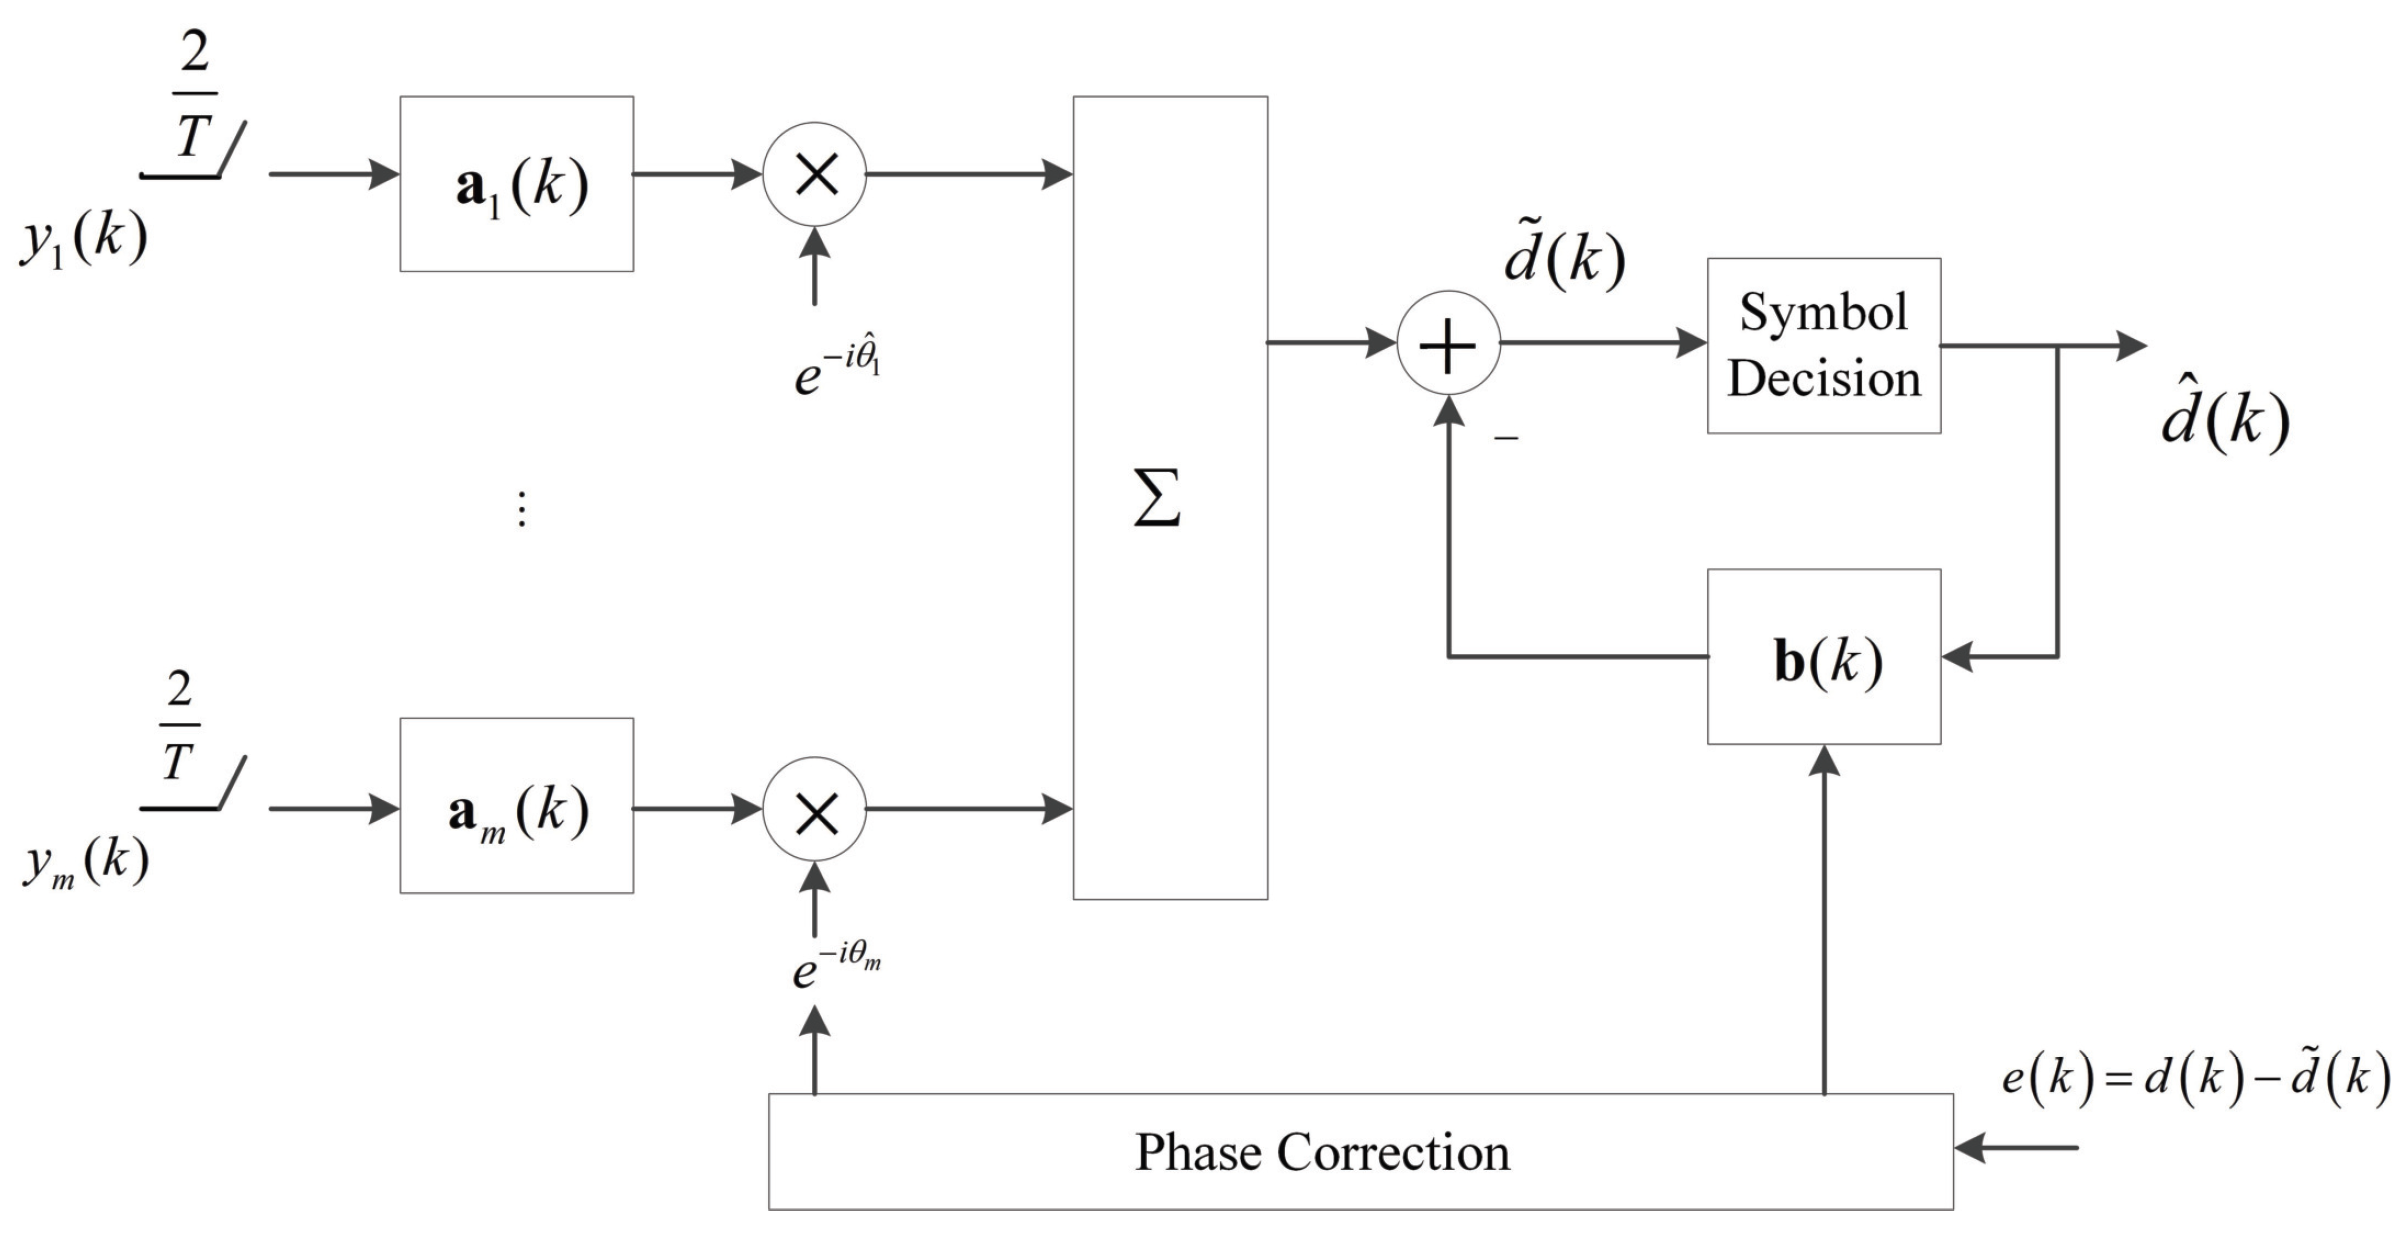
The received signal affected by different modes can be regarded as passing through different channels. For those symbols that are only affected by low order channel modes, due to the insignificant intra-mode dispersion, they can be observed as the signal transmitted in the Additive White Gaussian Noise (AWGN) channel. In cases when intra-mode dispersion cannot be ignored, a less complicated equalizer can also be used to demodulate the signal because of the reduced channel spread. However, although single mode equalization can certainly reduce the difficulty of demodulation, it cannot utilize all the energy carried by the array signal, which may lead to poor performance, especially after long range communication. To avoid this issue, diversity techniques are under consideration to improve the performance. Inspired by this idea, we exploit a multi-input equalizer to detect the data sequence [7]. The proposed equalization structure is shown in Figure 5.
In this structure, the input signal y m k is the filtered mode. Since the waveform distortion for large order modes is significant, accurate synchronization may become difficult. Therefore, a fractionally spaced feed-forward filter is introduced for this mode domain processing. Due to the different phases of each mode, each feed-forward filter is accompanied by a phase compensation factor to compensate for the carrier phase offset. The output signals of all feed-forward filters are combined and sent to the same feedback filter at the symbol sampling rate. Since all receiver parameters are jointly updated based on the same estimation error, this structure can be equivalent to maximal ratio combining, where each mode is proportionally weighted and then coherently combined with others.
The filter coefficients and phase correction factors can be obtained based on the input signal. Defining the coefficient of the m-th feedforward filter as a m k = a N 1 k , , a N 2 k T while N 1 + N 2 + 1 is the length. The corresponding input vector is y m k = y m k T + N 1 T / 2 , , y m k T N 2 T / 2 T . Assuming the channel is time invariant, and the channel phase remains approximately unchanged within each symbol interval, the output of each feed-forward filter after phase correction is
p m k = a m H k y m k e i θ m k
After the combination, we have
p k = m = 1 M p m k
When the length of the feedback filter is N f b , its input signal is the decision vector of the previous output d ^ k = d ^ k 1 , , d ^ k N f b T , then the output of the feedback filter is
q k = b H k d ^ k
As a result, we can get the equalizer output and the error at time k
d ˜ k = p k q k
e k = d k d ˜ k
The filter tap weights a m k , b k , and phase correction factor e i θ m k can be obtained by different criterions, such as Least Mean Square (LMS) [29] and Recursive Least Squares (RLS) [30]. Due to the improved SNR and small channel delay spread after mode filtering, the length of each branch will be shorter, resulting in a less complicated multi-mode equalizer structure. For multi-mode pre-processing by mode filtering, the proposed equalization can be regarded as a modal diversity technique. However, this structure utilizes both spatial diversity and frequency diversity simultaneously from the perspective of the physical channel. Therefore, the proposed equalization can achieve superior performance compared to any of the diversity techniques.
Generally, beamforming is one of the commonly used methods to utilize the spatial diversity in underwater acoustic communications. It can increase the received SNR and suppress the multipath effect to achieve improved communication demodulation performance. The array processing gain is usually obtained by spatial coherence between signals received by different array elements. Therefore, the arrival waves must be modeled by plane waves, while the cross-spectral phase of the two elements is a linear function of the distance between the elements [31]. From Equation (1), it is known that low frequency signals in shallow waters are generally modeled as broadband normal modes, and the amplitude of the pressure is mainly affected by the vertical parameters of the source/receiver, while the phase is affected by the range and water depth. Therefore, there is no significant difference in signal phase received by the vertical array at a certain range. From a theoretical perspective, the cross-spectrum of the received signal between the i-th element and the j-th element is
p r , z i p * r , z j = Q 2 m , l Ψ m z s Ψ m z i Ψ l z s Ψ l z j e i k r m k r l r r k r m k r l
It can be seen that when ignoring the spectrum of the source, the variation of cross-spectral phase is caused by the variation of the eigenfunction, and there is no proportional relationship between the cross-spectral phase and z i z j . Therefore, beamforming under low frequency shallow water will suffer from the mode mismatch problem, causing the gain degradation. The theoretical array processing gain can only be achieved when the ratio of the vertical array aperture to the water depth is much less than 1 [32]. However, for shallow water environments with small water depths, the aperture limitation system is hard to realize. As a result, for long range communication systems with low input SNR, it is difficult to obtain the expected gain only by conventional array processing methods.

4. Simulation Results and Analysis

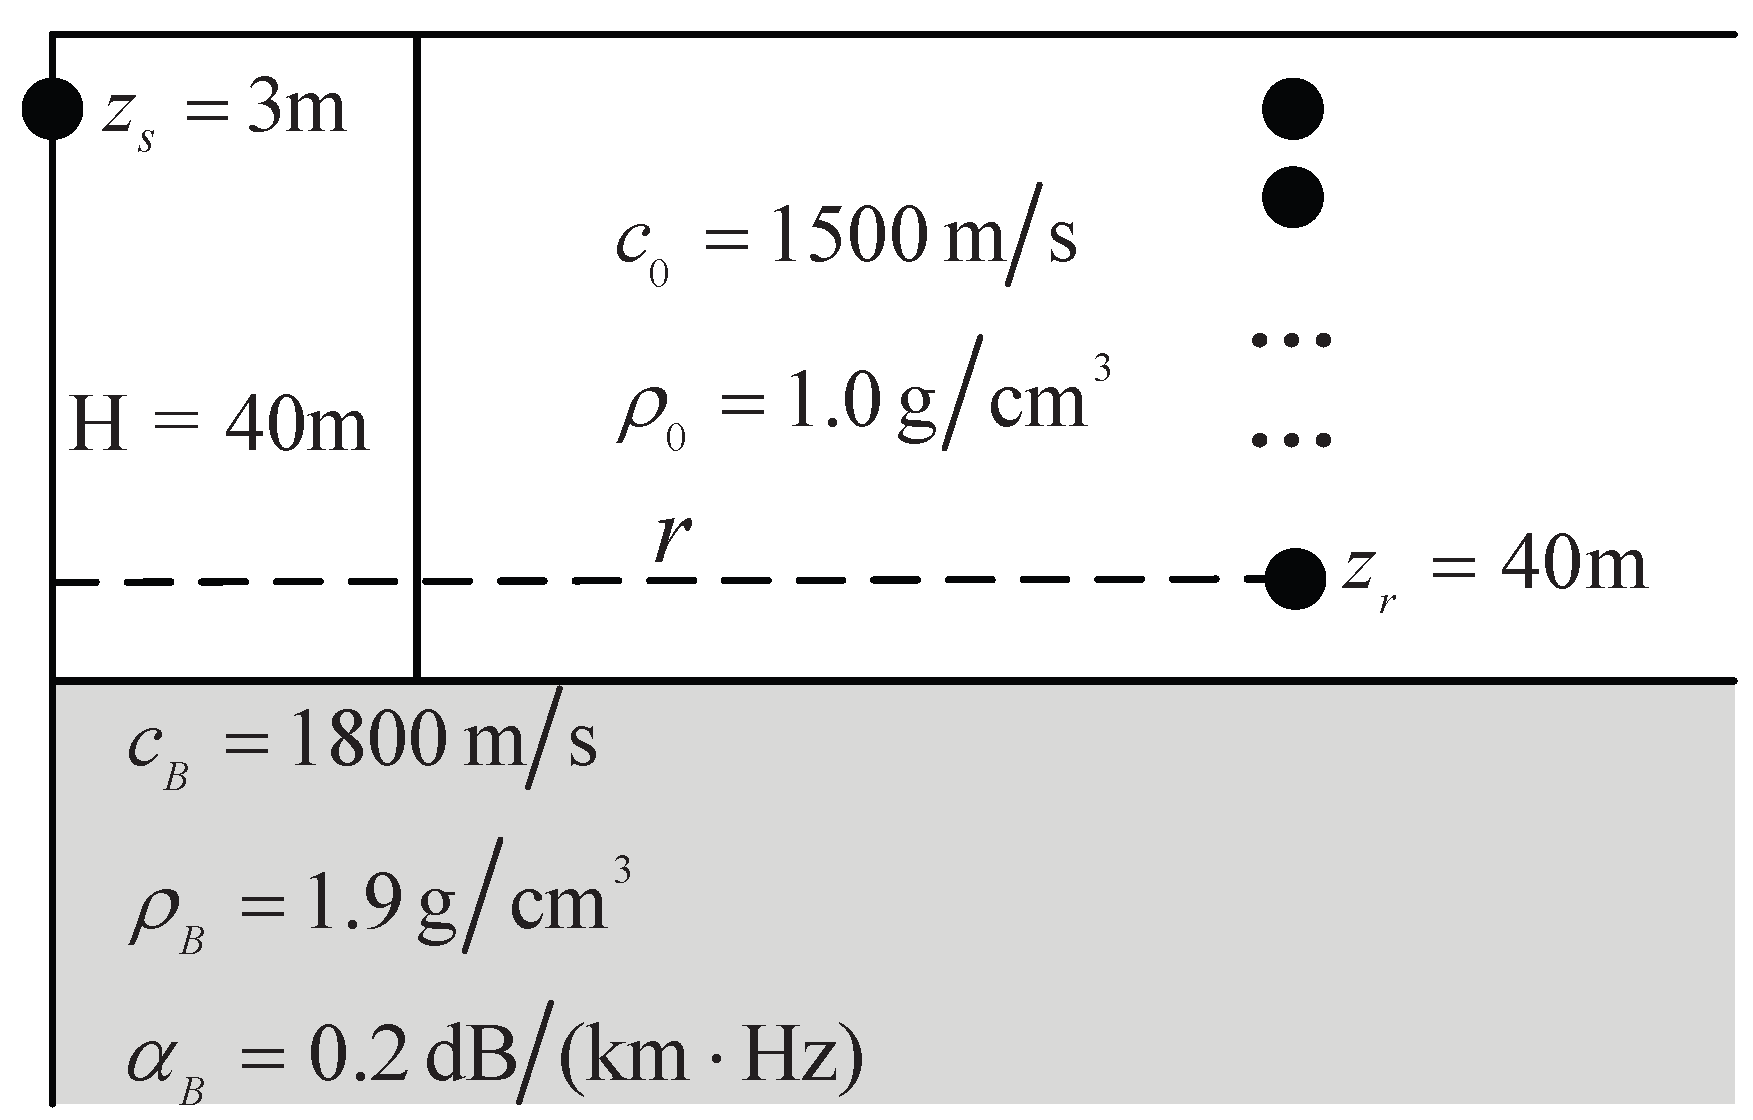
In this section, we will analyze the performance of each part of the proposed scheme individually and then demonstrate the overall demodulation performance. All the simulated channels in this paper are modeled as a Pekeris waveguide generated by the KRAKEN with a pressure release surface and infinite fluid halfspace. This model is commonly used as a realistic channel model in ocean simulations, allows energy to propagate across the water-bottom interface, thereby introducing a loss mechanism into waveguide propagation, as shown in Figure 6. Due to the high transmission loss of higher order modes and their small contribution to the overall channel, only the first 5 normal modes that compose the channel are considered in the simulations. The simulation parameters are depicted in Table 1. The source is located at a depth of 3 m, and the receiving array is a full-aperture equidistant vertical array spanning depths from 3 to 39 m. During the simulations, noise follows the independent and identically distributed additive Gaussian distribution with zero mean. For simplicity, the same level of noise component is added to each receive element.
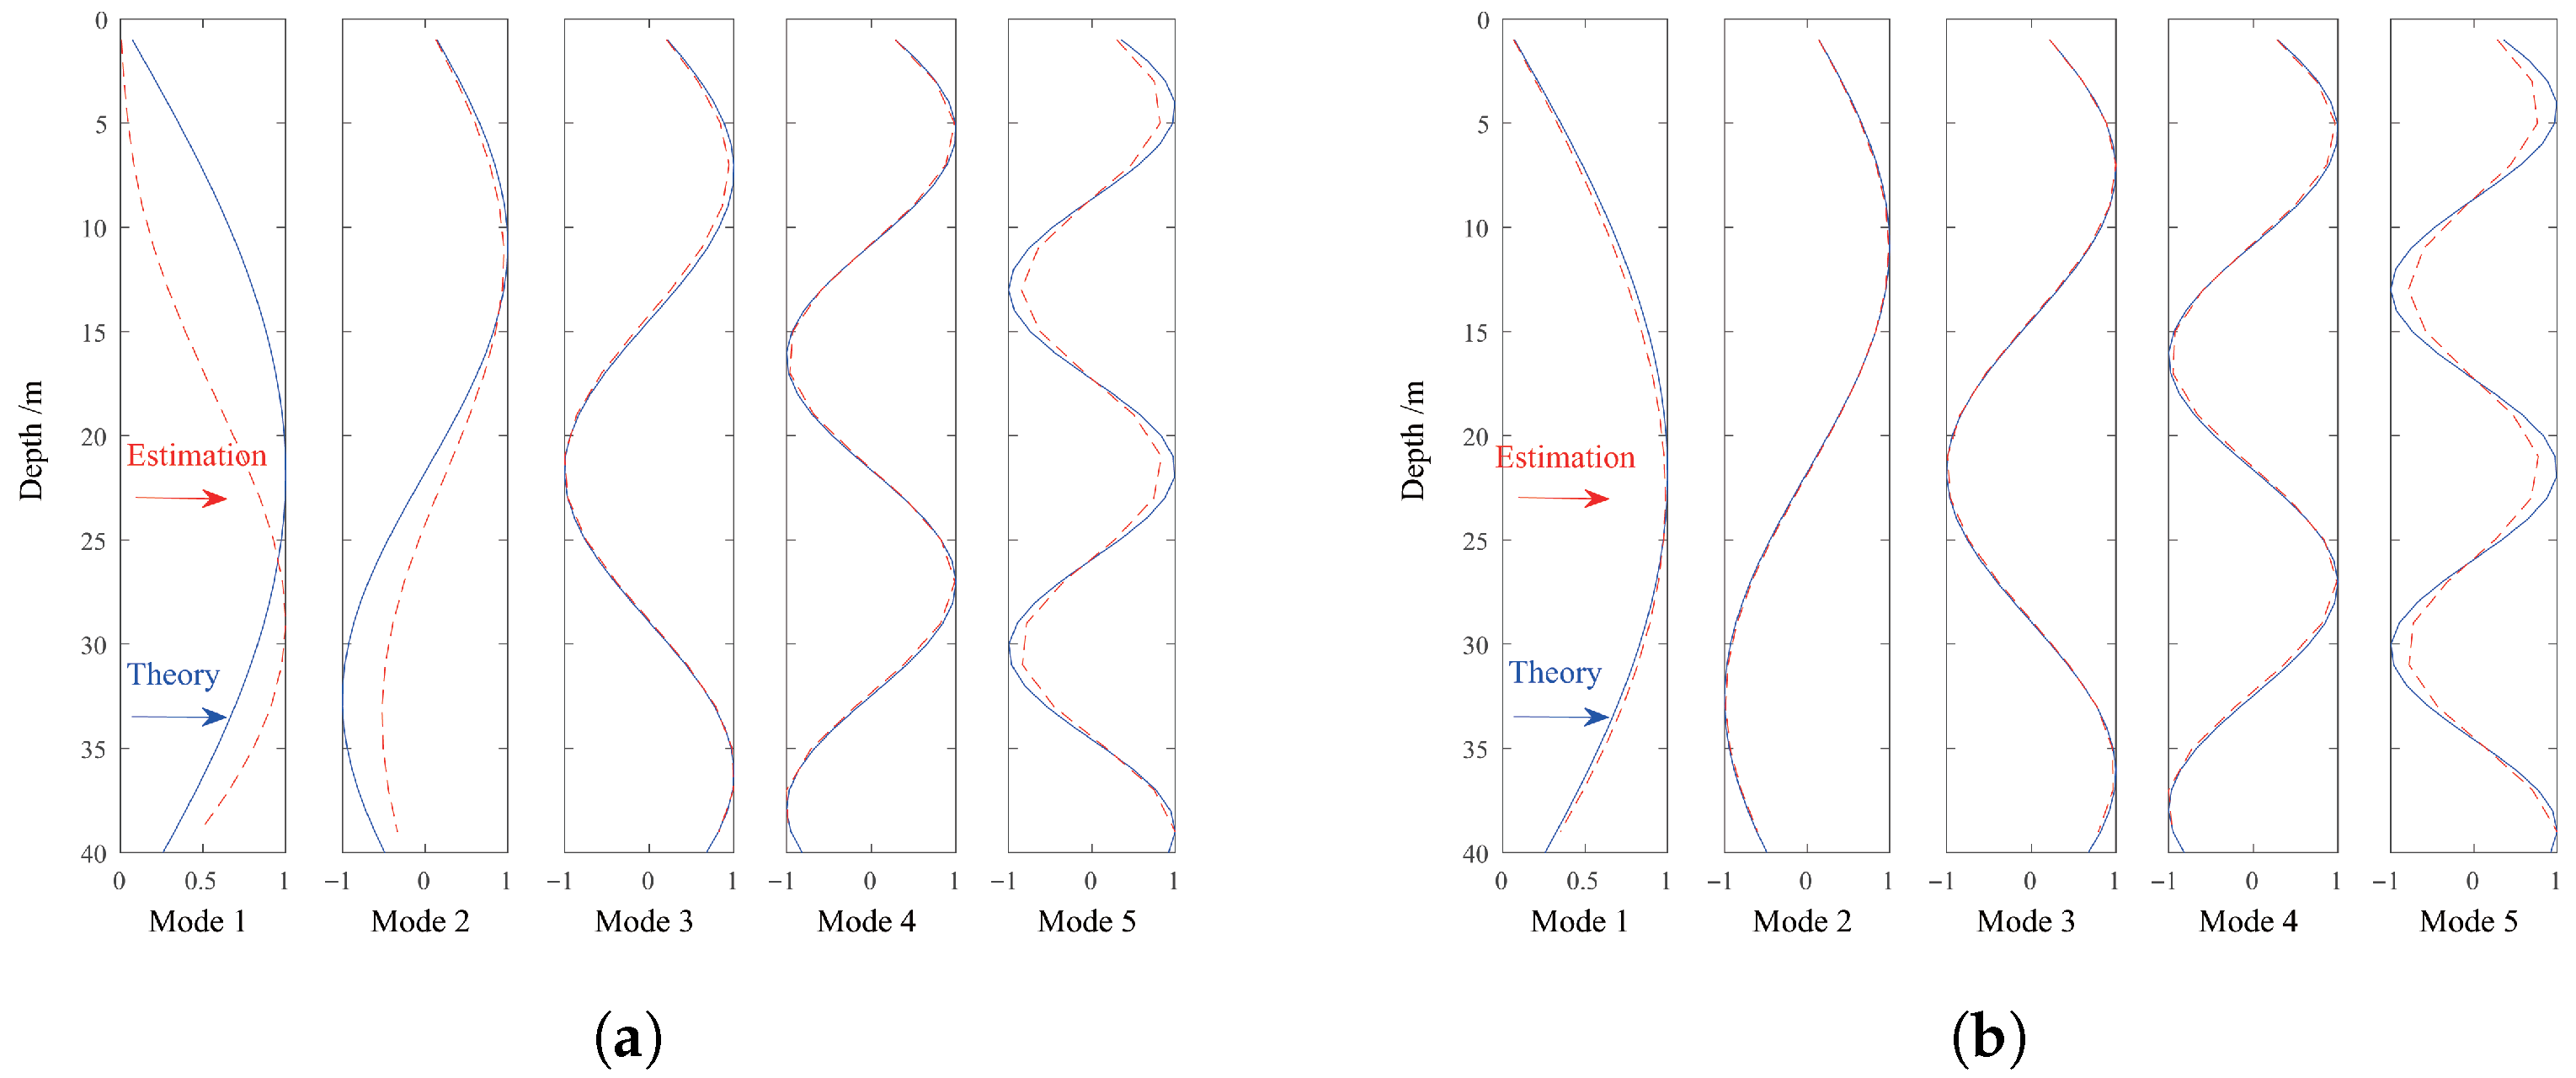
Firstly, we investigate the performance of the modal depth function estimation. In communication systems, probe signals are usually inserted at the front of the transmitting frame for carrier synchronization. In the proposed receiver, probe signals can be also be used to estimate the modal depth function. Thus, our transmitted communication frame includes a probe sequence and transmission signal, while the latter contains training sequences and symbol sequences. To achieve good estimation performance, we use a 1023-digit m-sequence as the probe symbol. Assuming the modal depth function is approximately constant within the estimated bandwidth, the curves for first 5 order modes at the carrier frequency are estimated by both narrowband and broadband signals with bandwidths 10 Hz and 100 Hz, respectively. The estimated results are shown in Figure 7.
It can be seen that the mode shape function can be estimated by continuous signals using the SVD method. Besides, Figure 7a shows that when using a narrowband signal, the estimation errors of the 1st and 2nd modes are relatively high, in contrast to Figure 7b, where the first 4 modes are relatively accurately estimated by broadband. The results indicate that for low order modes, the larger the bandwidth, the more accurate the estimation results, while high order modes have less stringent bandwidth requirements, which is consistent with our theoretical analysis by Equation (13). The estimation error of the 5th order mode is large in both cases, due to the overall small input SNR interfered by other modes and noise.
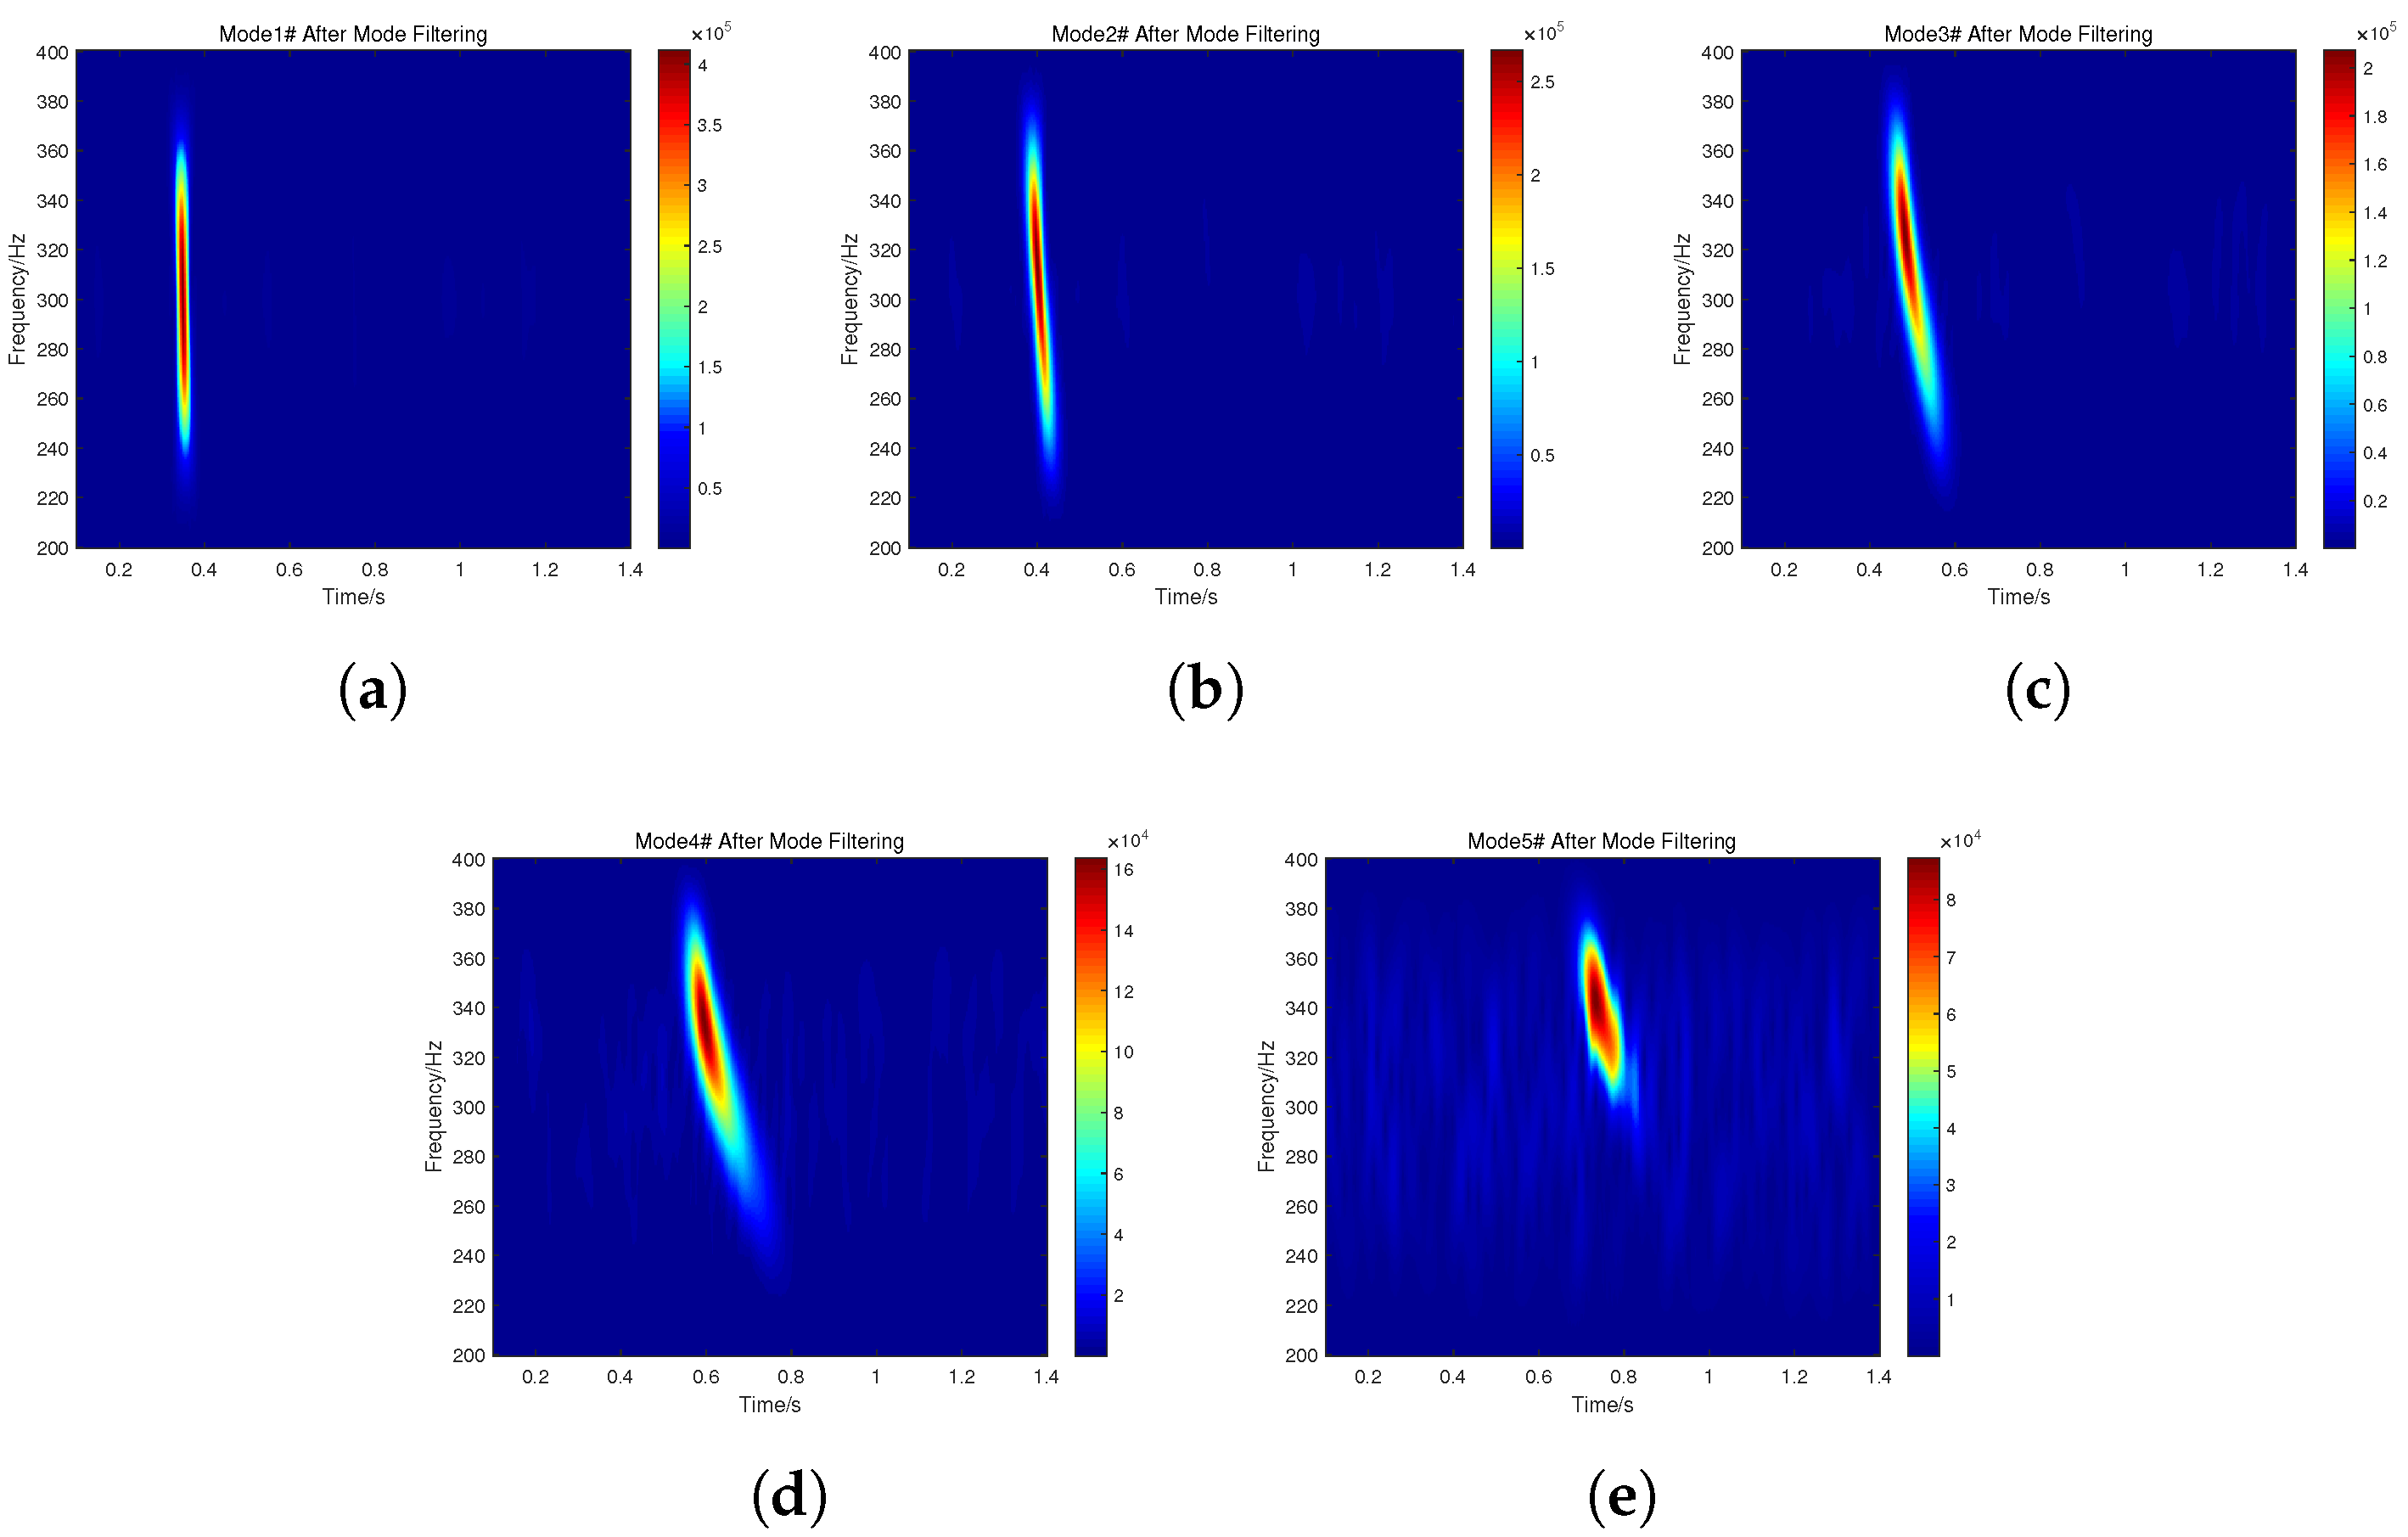
Secondly, we analyze the mode filtering performance based on the estimation results. We choose the MPDR method to construct our filter since it shows sufficient accuracy for the desired mode [16]. Using the broadband model shown in Figure 4, the whole 200 Hz bandwidth is divided into 5 frequency intervals. The modal depth functions corresponding to the central frequencies (220 Hz, 260 Hz, 300 Hz, 340 Hz, and 380 Hz) are estimated first, and then the mode filter H (ωl) is designed. Here, we filter a bit signal as an example and demonstrate the correlation results after processing. The output modes are shown in Figure 8. It can be observed that broadband mode filtering can separate the modes effectively while retaining the intra-mode dispersion. The filtered modes show clear gain and little interference from others, which means the method can suppress multi-mode effects successfully in a shallow water waveguide. It is worth noting that the effectiveness of broadband mode filtering is not only related to element aperture, number of elements and channel conditions, but also influenced by the number of subbands. It is usually selected within the near constant band of the target modal depth function. Excessive filters may introduce extra computational complexity, together with errors from the window function.
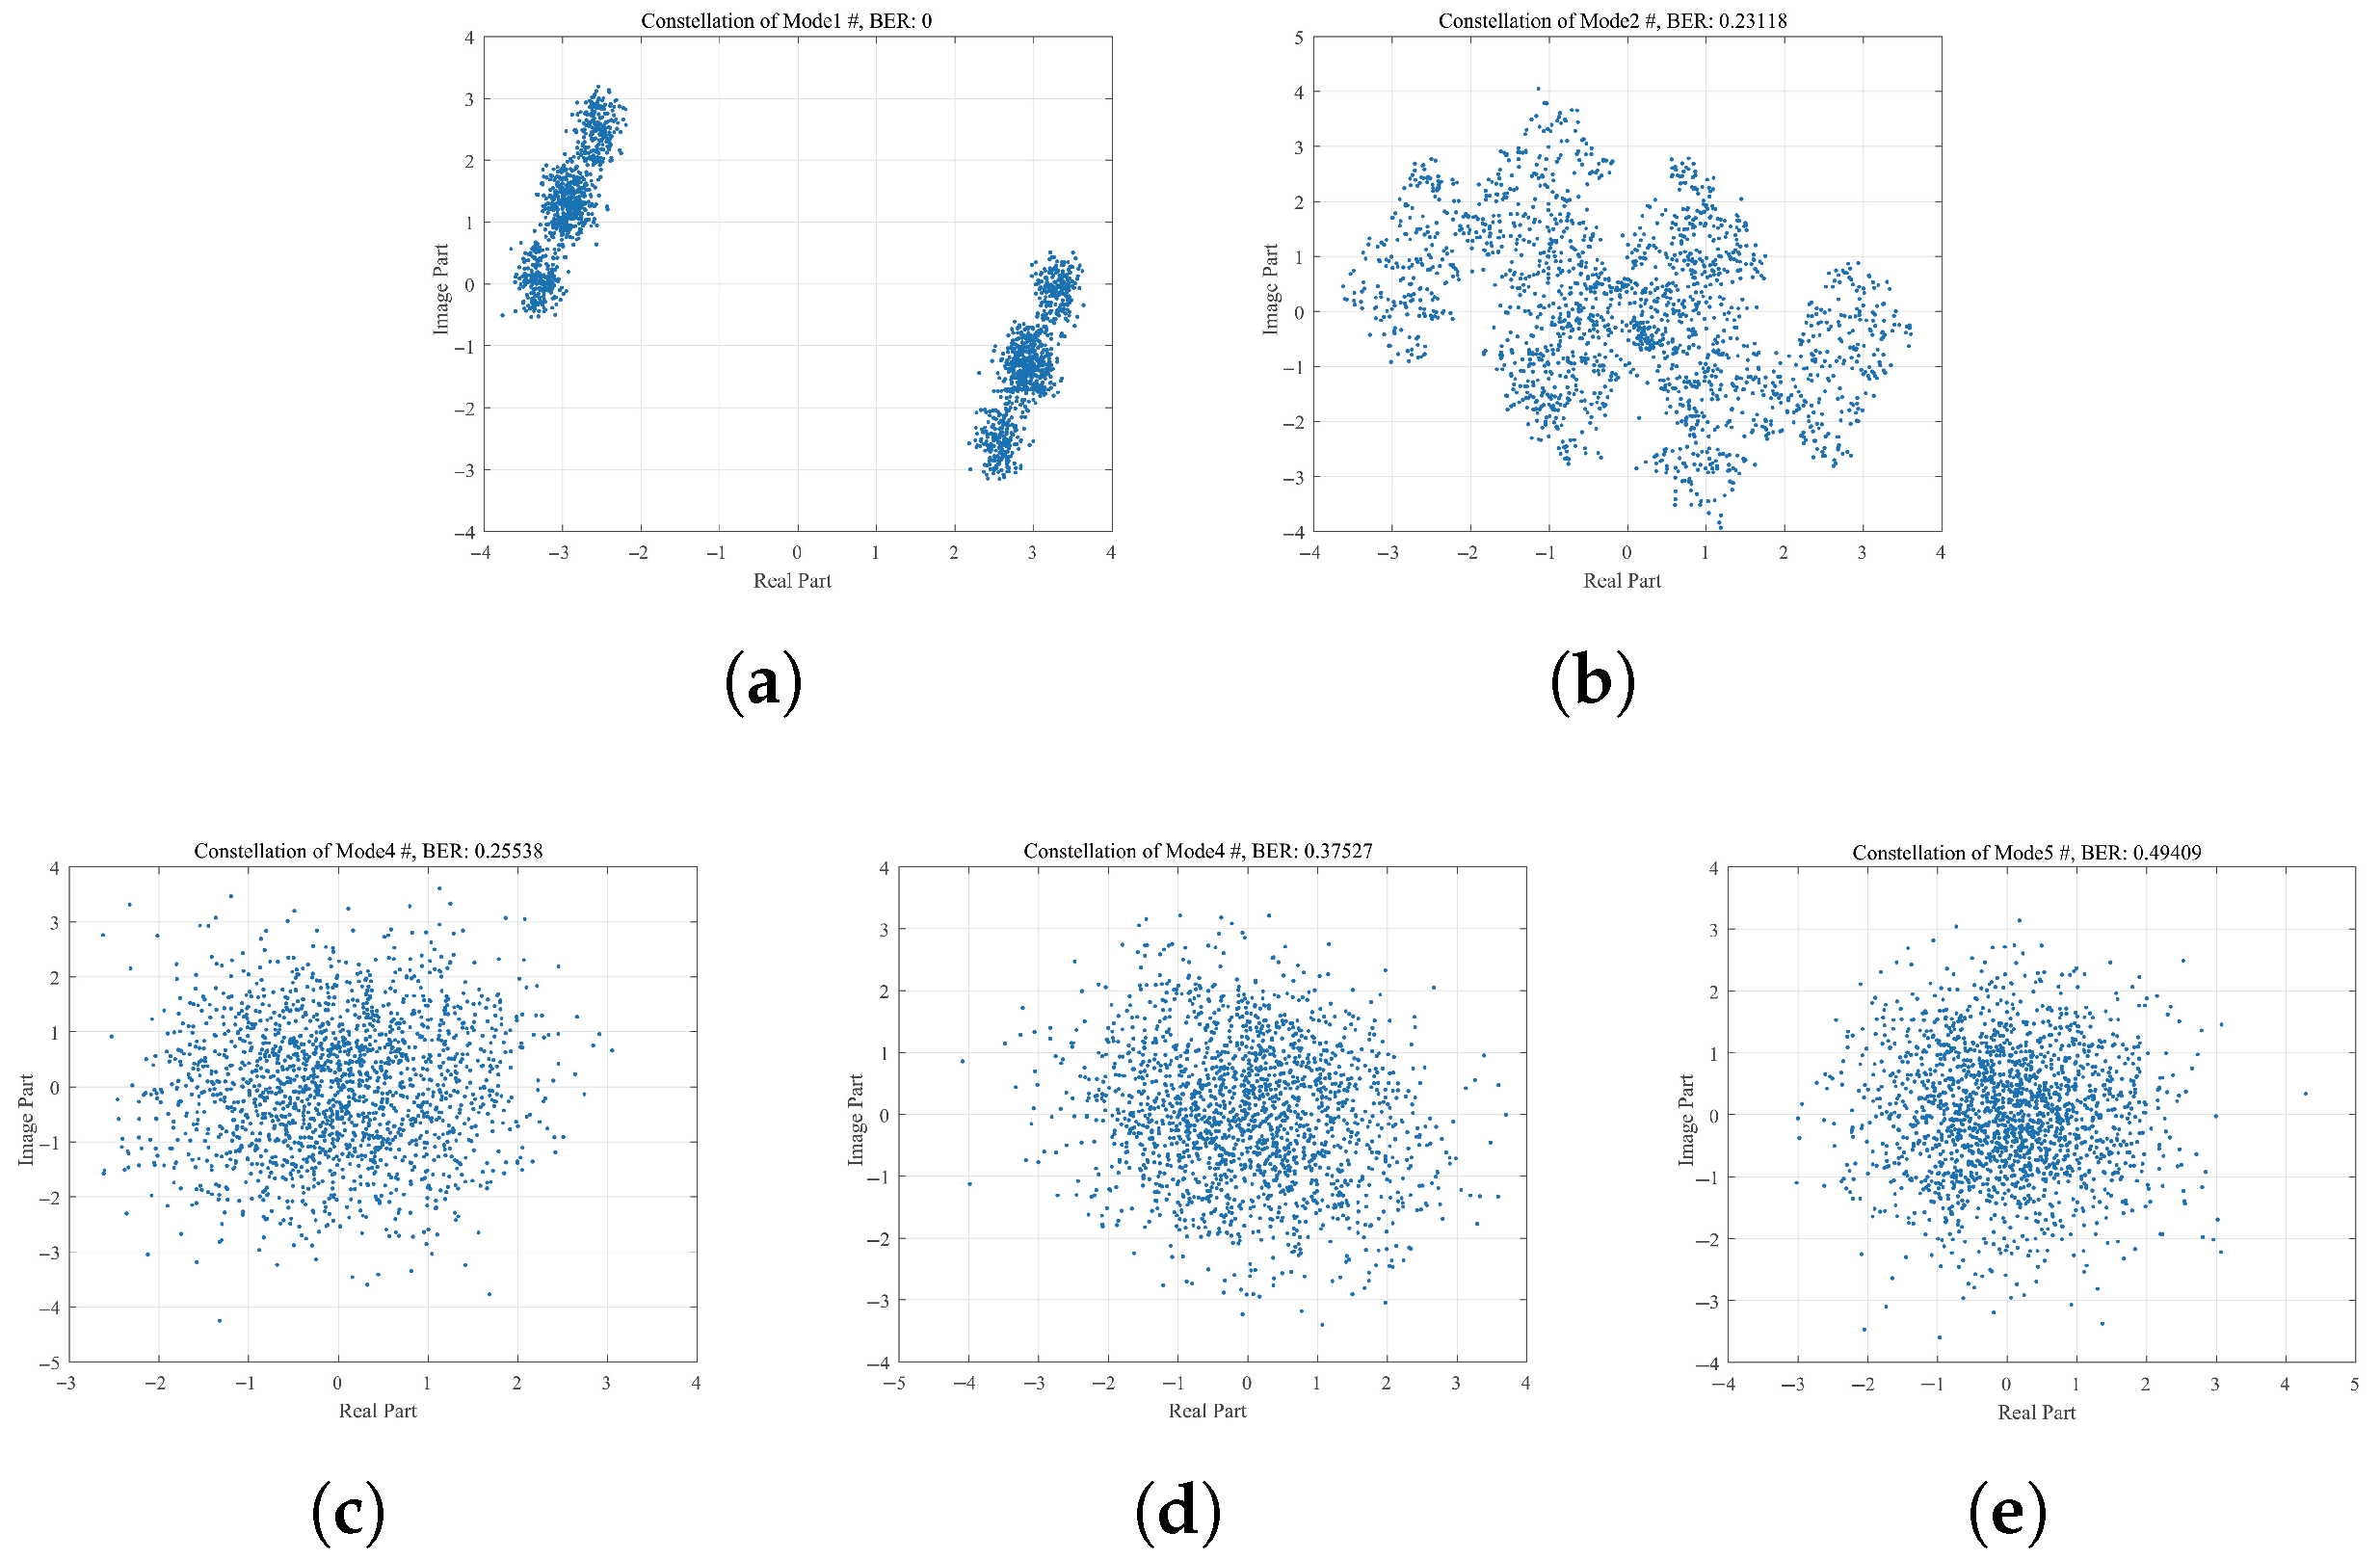
Thirdly, we analyze the demodulation performance after modal processing. In our communication system, a transmit frame consists of a probe signal and 2048 BPSK modulated communication symbols. With the help of the mode filtering utilized in Figure 8, we can remove the inter-mode dispersion of the received communication signal. Then, the produced sequence is only affected by a single channel mode. When the input SNR of each array element is 10 dB, the filtered SNR corresponding to channel modes 1–5 are 23.6 dB, 22.3 dB, 17.0 dB, 6.9 dB, and 3.8 dB, respectively. It means that mode filtering can not only suppress channel delay spread, but also effectively improve the received SNR of low order modes. The constellation of the filtered communication symbol is shown in Figure 9.
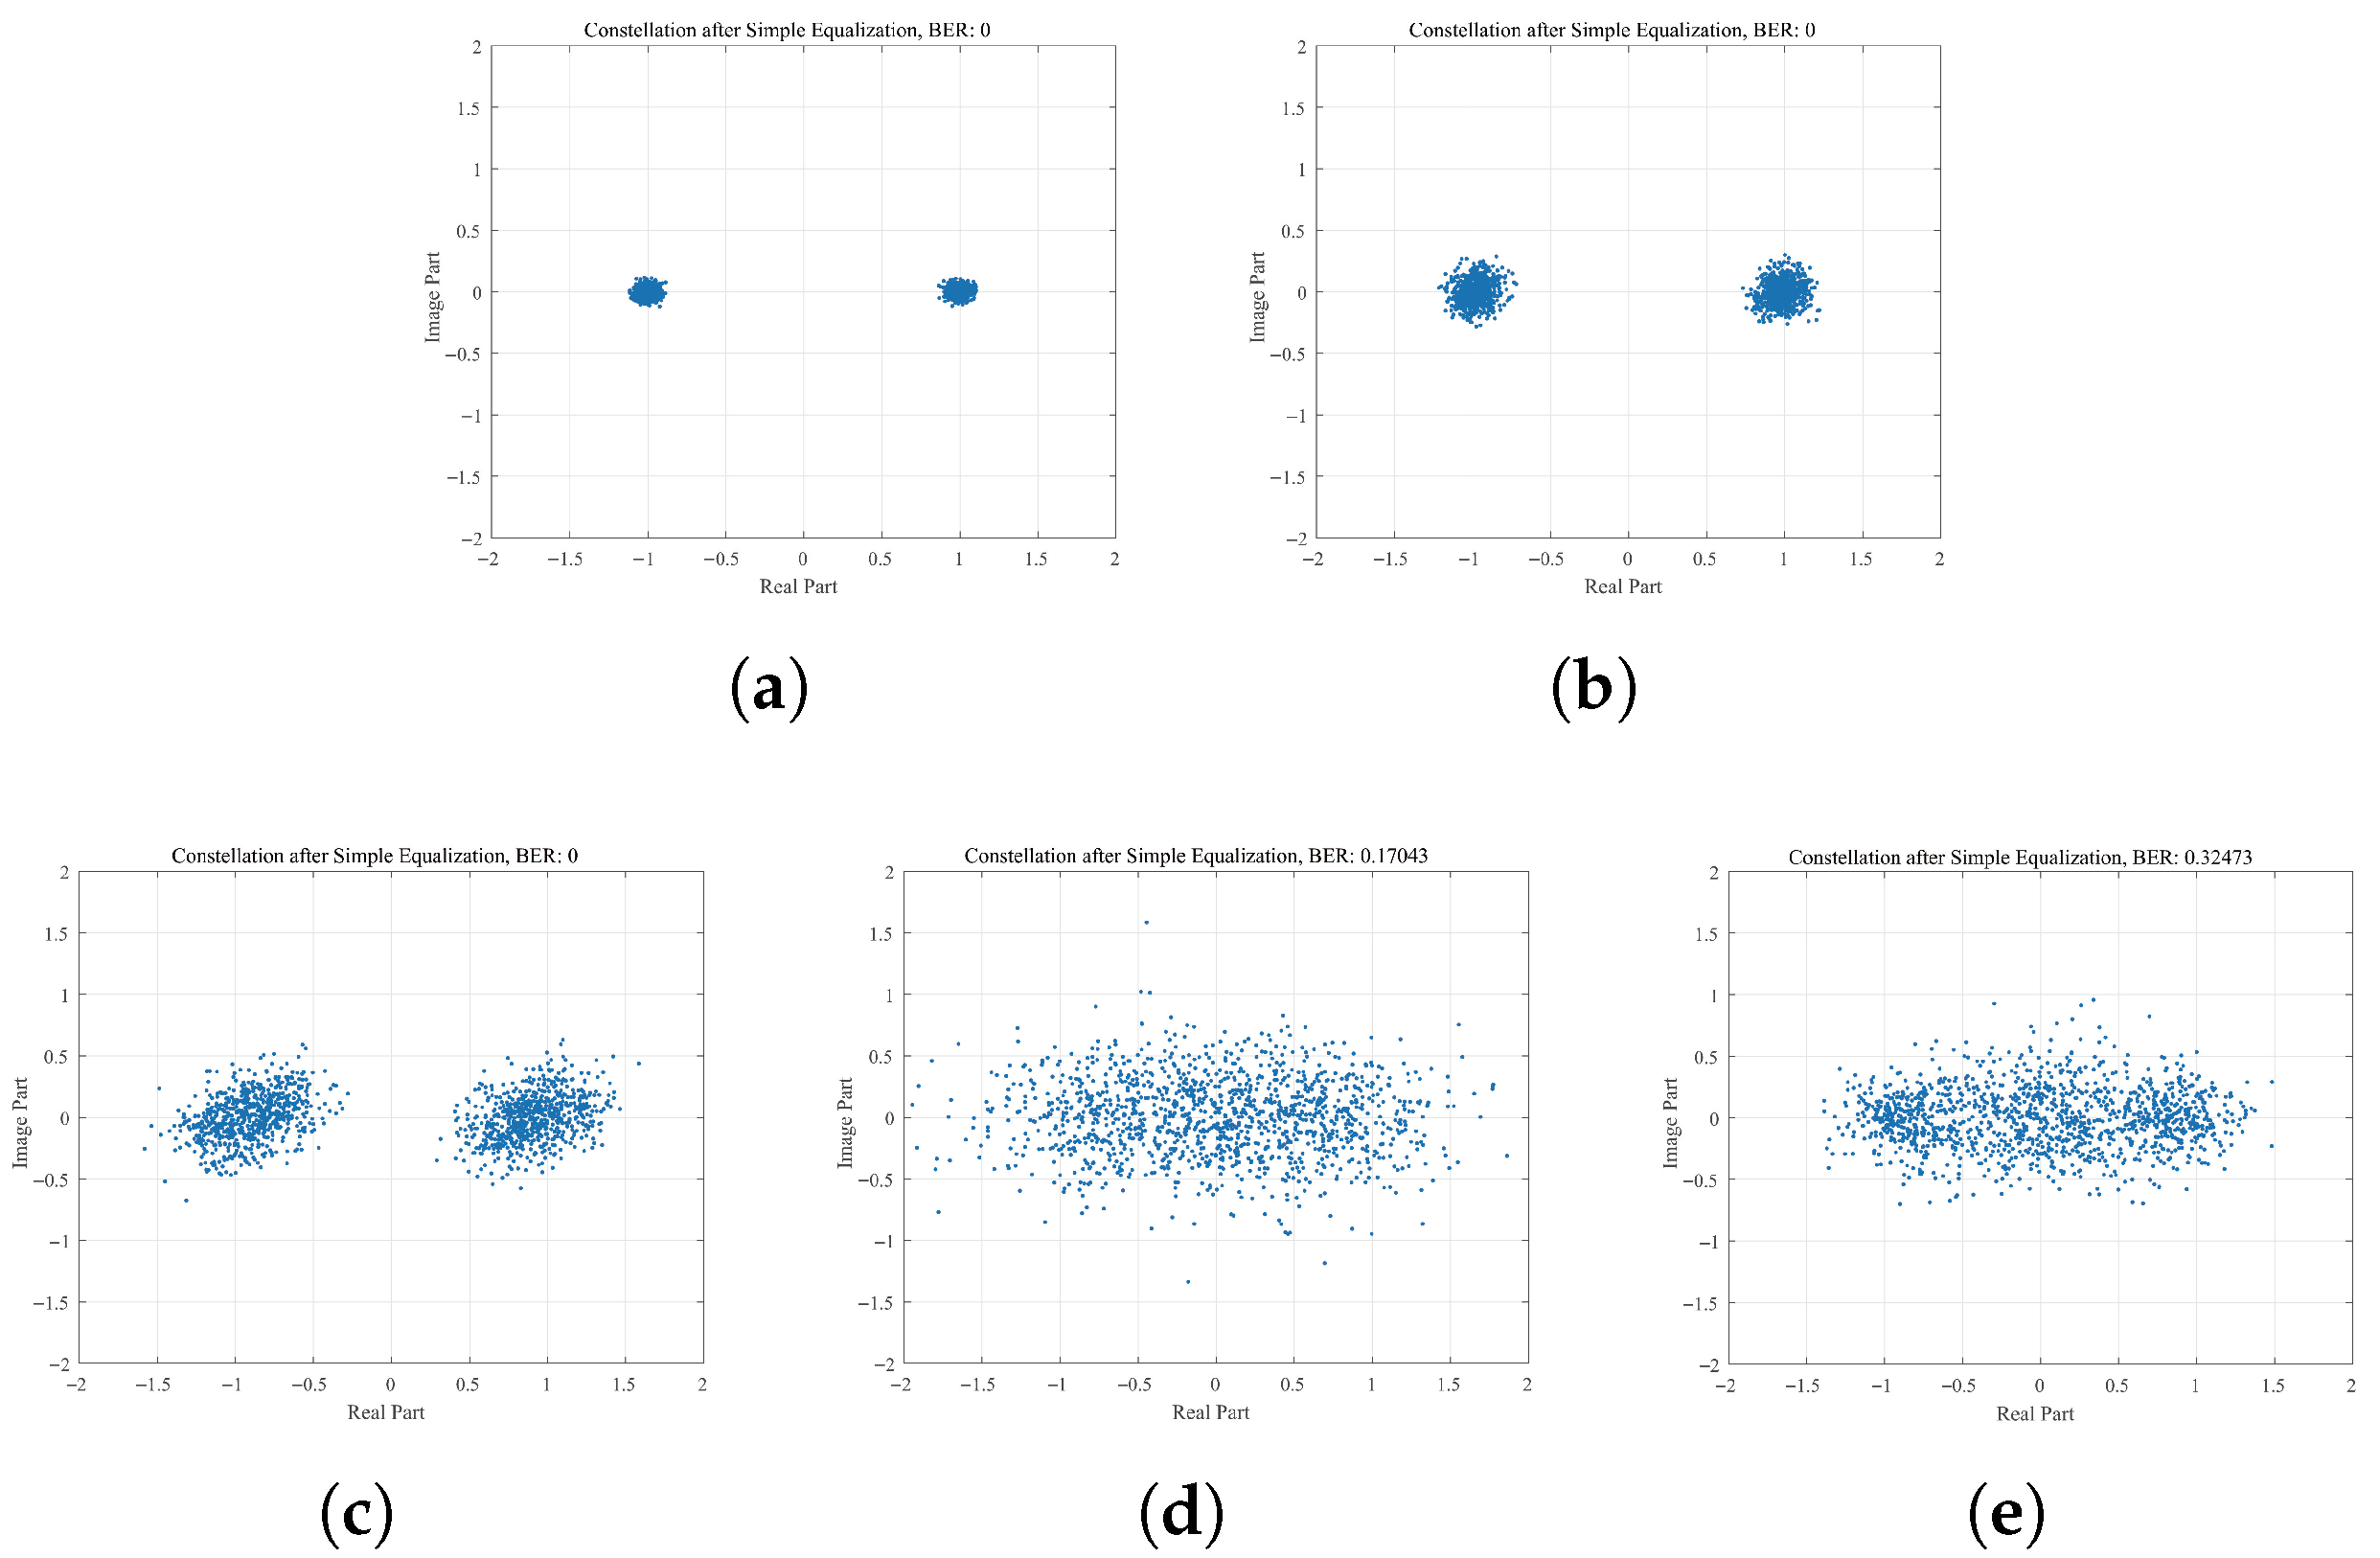
For symbols from the 1st channel mode, the constellation shows a less scattered distribution, which can be directly used to obtain the transmitted phase under high input SNR. For high order modes, the constellation is completely scattered, mostly due to the intra-mode dispersion, and thus the corresponding symbols are distorted, and direct decision cannot recover the transmitted information. Therefore, further equalization maybe required. A fractionally spaced adaptive decision feedback equalizer (DFE) is used to process the filtered data sequence individually. The length of training symbols is 500, while the rest are equalized to calculate the BER. The RLS algorithm obtains the coefficients of the filter. The resulting constellations are shown in Figure 10.
It can be observed that the constellation points are tightly clustered, indicating that symbols after simple equalization can be easily demodulated. The corresponding BERs decrease to zero for the first three cases effectively, and to 0.17 and 0.32 for the last two, respectively. The symbols corresponding to the lower 3 channel modes can achieve error free transmission because their mode effect is not complex. Although the system experiences high channel complexity and low input SNR, and the symbols are affected by the 4th and 5th mode still show significant performance improvement.
Furthermore, to fully utilize the information carried by all modes, we use the multi-mode joint equalizer in Figure 4 to process the filtered sequences. The length of the feed-forward and feedback filters is the same as that in Figure 10, and RLS also obtains the coefficients. The phase is adjusted by a second-order digital phase-locked loop [33]. The constellation is shown in Figure 11. By comparing with the results in Figure 9 and Figure 10, it can be found that the constellation is centralized, which means the output SNR is significantly increased. The corresponding BER is 0. This sufficiently demonstrates the superior advantages of multi-modal joint equalization processing.
Finally, to verity the effectiveness of our proposed multi-mode joint equalization scheme in low frequency shallow water environment, we present the comparisons with single channel equalization based on beamforming and multichannel equalization. The simulation parameters remain unchanged, and the Monte-Carlo times are 500. After modal processing, symbols influenced only by the 1st channel mode are directly decided, those only influenced by the 2nd mode are equalized by a DFE individually, and those influenced by modes 1–4 are jointly equalized. The resulting BER curves are shown in Figure 12.
It can be seen that when the SNR is low, the filtered symbols from the 1st mode are greatly affected by noise and cannot recover the transmitted information through direct decision. After using single mode equalization for the filtered symbols from the 2nd mode, error-free demodulation can be achieved when the SNR is greater than 0 dB. The multi-mode joint equalization shows the best performance. Compared with the single 2nd mode processing, the joint processing by 4 modes can achieve about 5 dB extra gain at high SNR. The two conventional methods in a commonly used communication system show poor performance at very low SNR. Their performance begins to improve when the SNR reaches −15 dB or above. The reason is that these two methods cannot achieve effective SNR gain in low frequency shallow water channels, and thus they lose their effect when the input SNR is very low. However, the modal pre-processing in the proposed scheme can effectively improve the input SNR, which is crucial for current equalizers. When SNR is high, the performance of multi-modal joint equalization is still better than the two comparison methods, achieving an extra 3 dB and 6 dB performance gains, respectively. Besides, the length of the proposed equalizer is much smaller than the two comparing methods because it only deals with a single mode, which is part of the whole channel impulse response. The result demonstrates the superior capability of the proposed receiver scheme for low frequency and long range shallow water communication systems.

5. Analysis with Field Data

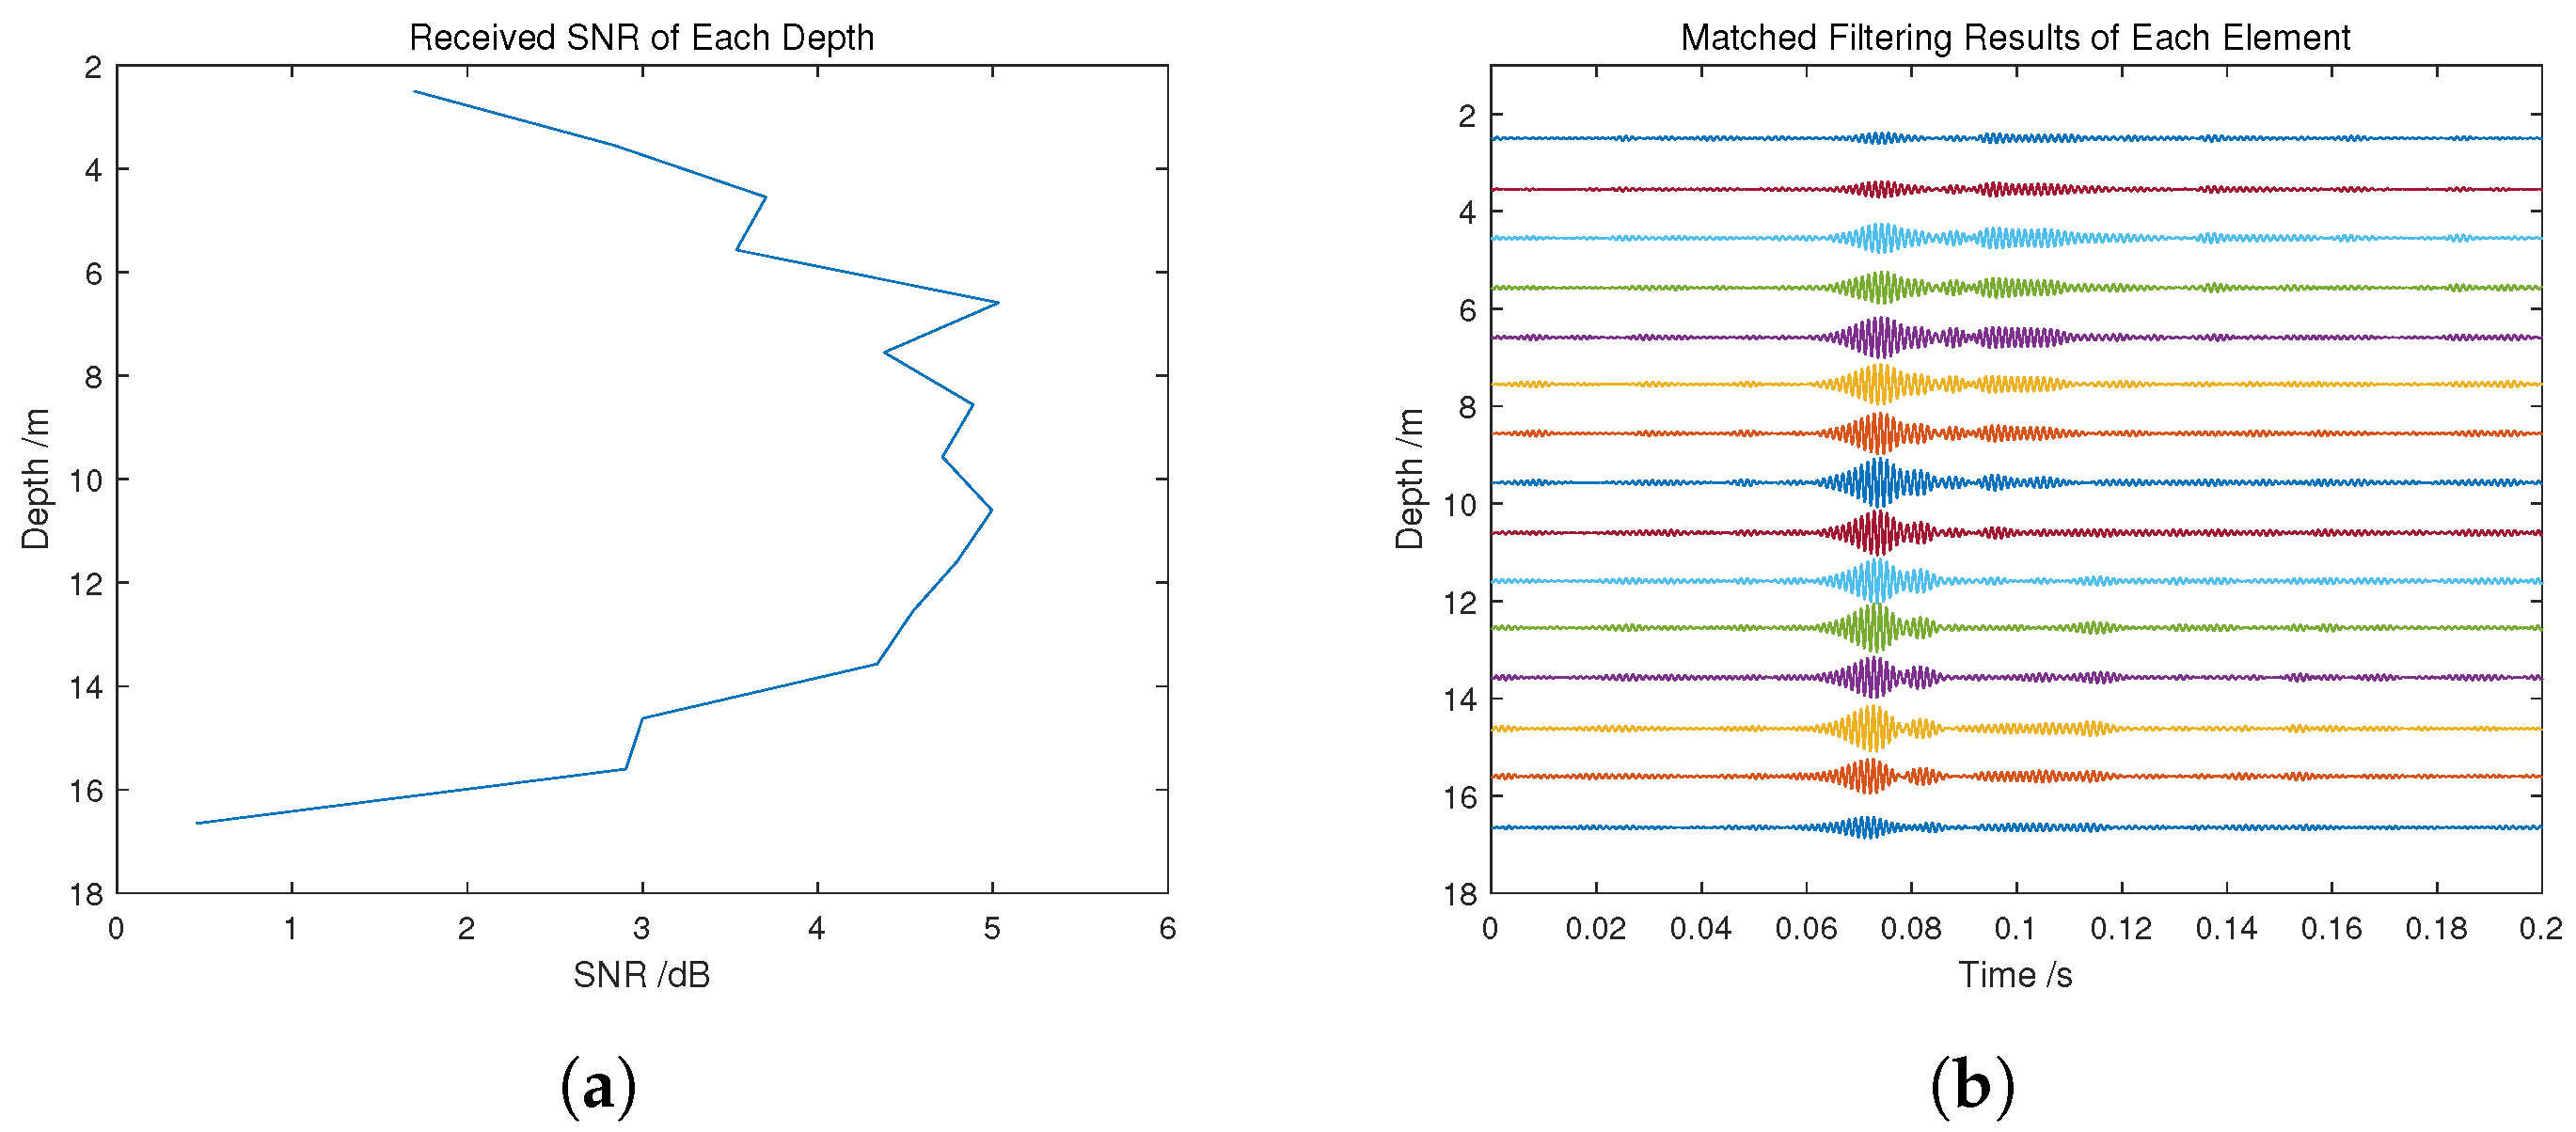
To verify the performance of our proposed scheme, we use it to analyze the experimental data set. The experiment was conducted in the northern Yellow Sea, with a water depth of around 18 m [34]. The waveguide is measured to be a near isovelocity ocean environment. The source is placed 11.5 m below the water surface, while the receiving array is a 15-element vertical array with a spacing of 1 m. The top element is 2.5 m below the surface, and the bottom is close to the seafloor. During the experiment, a 10th-order m-sequence with a center frequency of 820 Hz and a bandwidth of 200 Hz is transmitted every 10 s. Selecting two adjacent sets within 20 s as the transmission frame, with the first as the probe signal and the second as the BPSK communication symbols. At that time, the communication rate is approximately 274 b/s. The received signal is collected at a distance of 6.4 km from the source. The received SNR and estimated impulse response of each array element are shown in Figure 13. Both of them are obtained from the probe sequence.
Due to the mode energy and noise distributions in the vertical direction, the received SNR of each array element varies with depth. From Figure 13a, it can be seen that the highest SNR is received at around the depth of 11 m, which is about 5 dB higher than the bottom array element. The average received SNR is about 3.72 dB. For a single carrier communication system, this value is relatively low, which will bring significant difficulties to recover the transmitted information. From Figure 13b, we can see that at a distance of 6.4 km, the acoustic field contains 2 effective modes, located near 0.07 s and 0.1 s. The amplitude of the 2nd mode varies with depth and reaches a minimum amplitude near a depth of 10.6 m. Therefore, the received signal from the 8th element may only contain the 1st mode, as shown in Figure 14a. From the time-frequency plot, we can find that the 1st mode suffers from obvious intra-mode dispersion. We make a direct decision based on the received symbols, and the constellation plot is shown in Figure 14b. The corresponding BER is 0.49. The result indicates that although the channel seems simple, the communication signal was significantly distorted. Besides, they are also greatly influenced by noise since the received SNR is 4.71 dB. Both of the channel effects make it difficult to recover the transmitted information. Figure 14b shows the constellation plot after equalization by a fractionally spaced adaptive DFE with 300 training symbols. The length of the feed-forward and feedback filter is carefully selected to get a good result while the final BER is 0.12. It seems that the commonly used adaptive equalization method can suppress channel distortion to some degree, but the performance is limited due to the low input SNR.
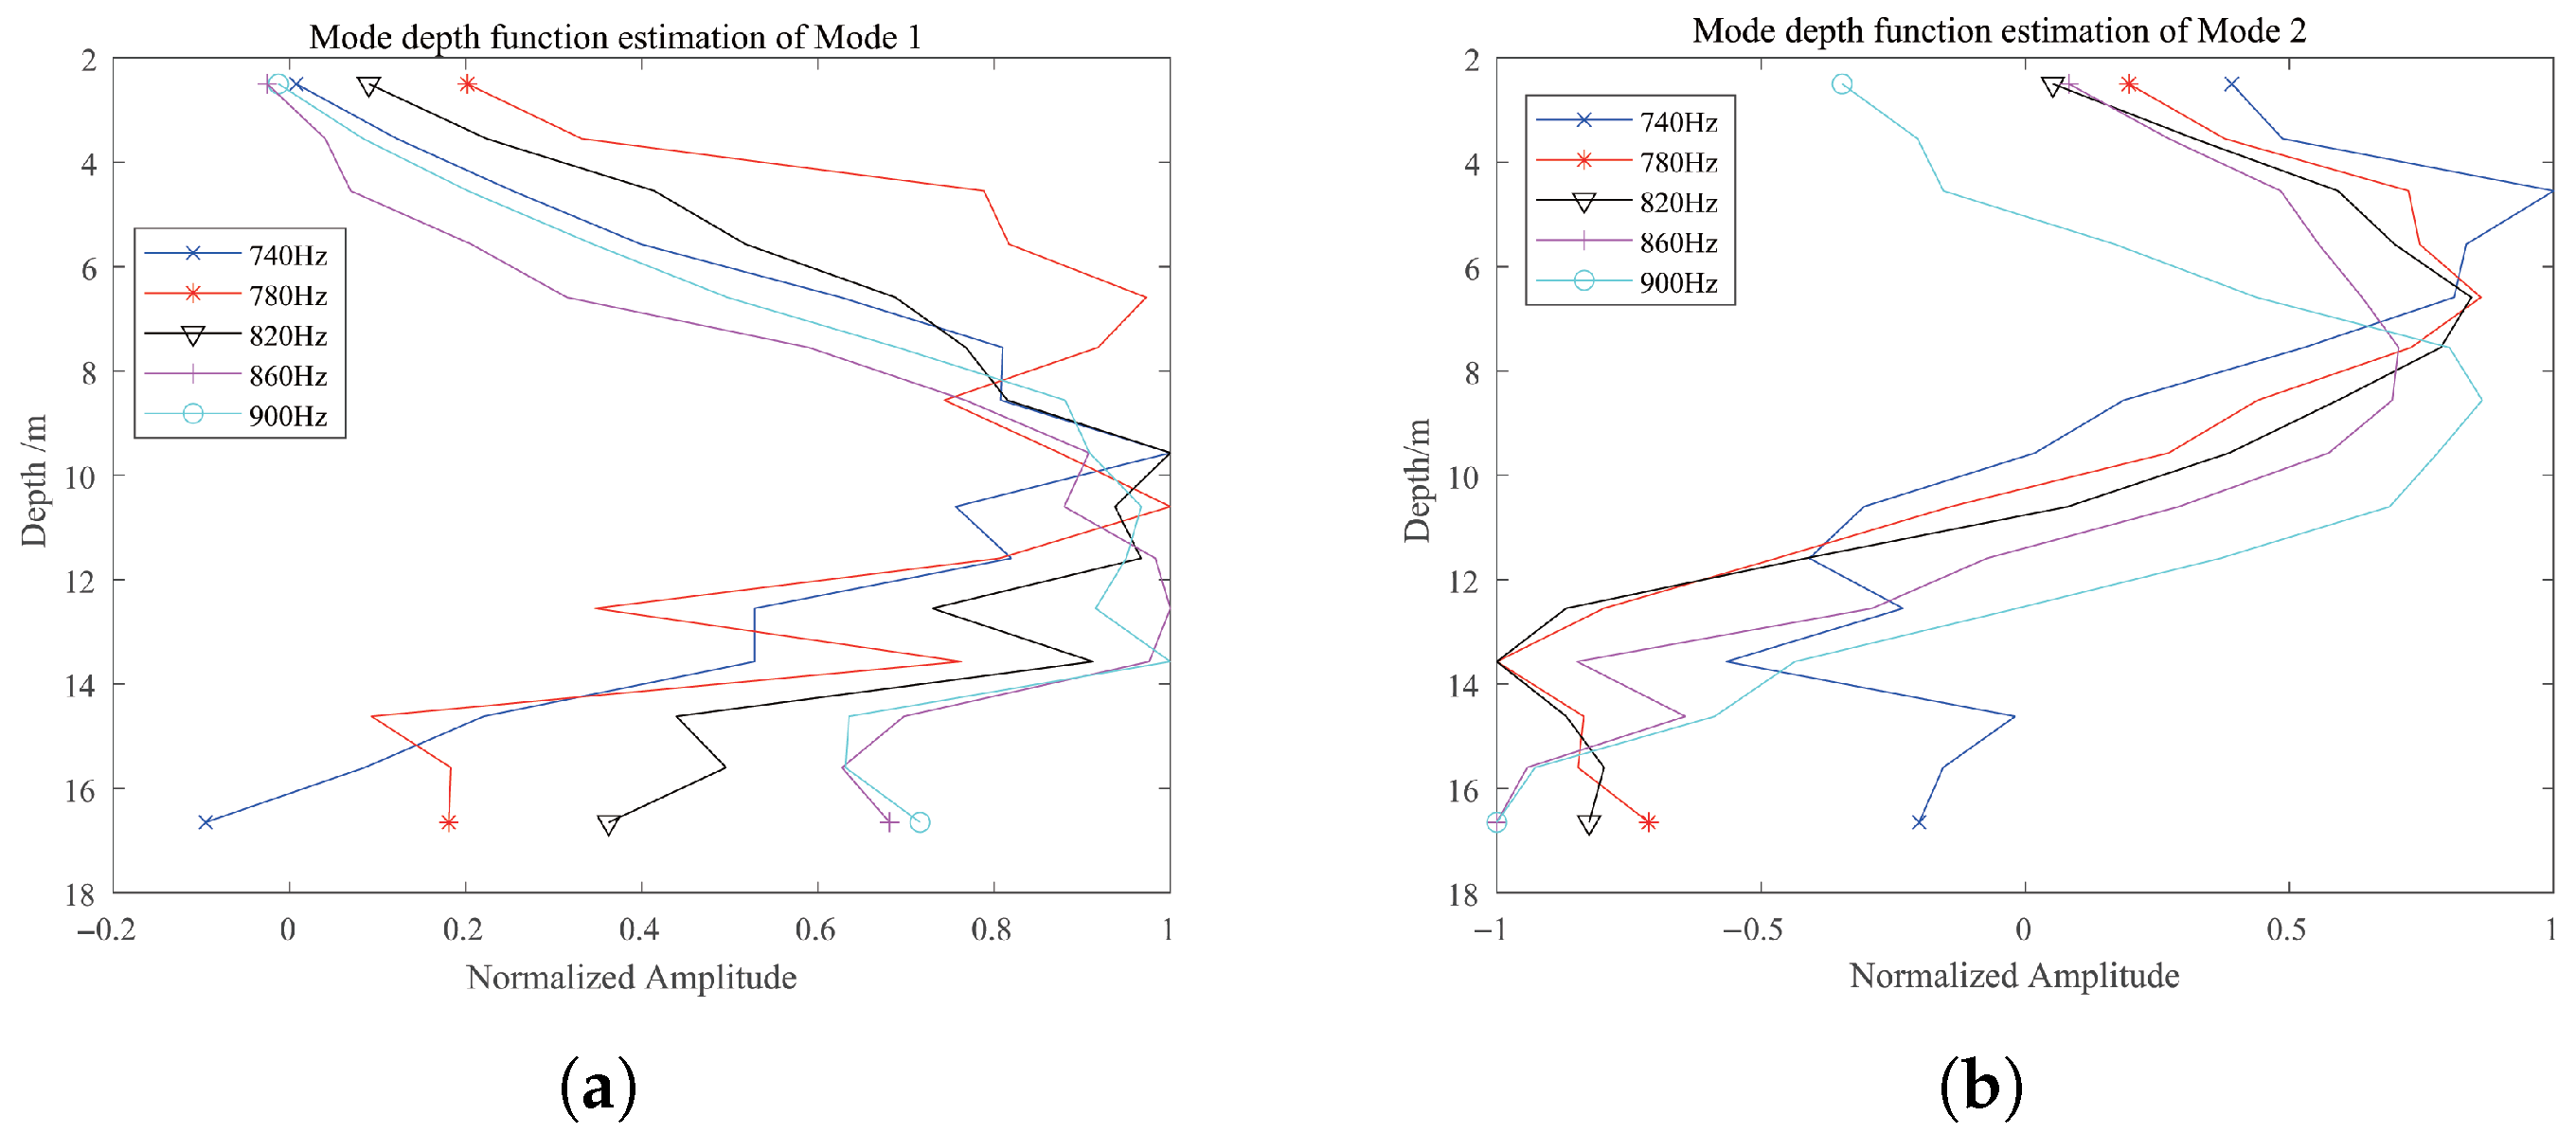
Since the large bandwidth of communication signals, we still adopt the broadband mode filtering here. Therefore, the whole bandwidth is divided into 5 subbands when estimating the modal depth function of the two effective modes. The estimated results at frequencies of 740 Hz, 780 Hz, 820 Hz, 860 Hz, and 900 Hz are shown in Figure 15.
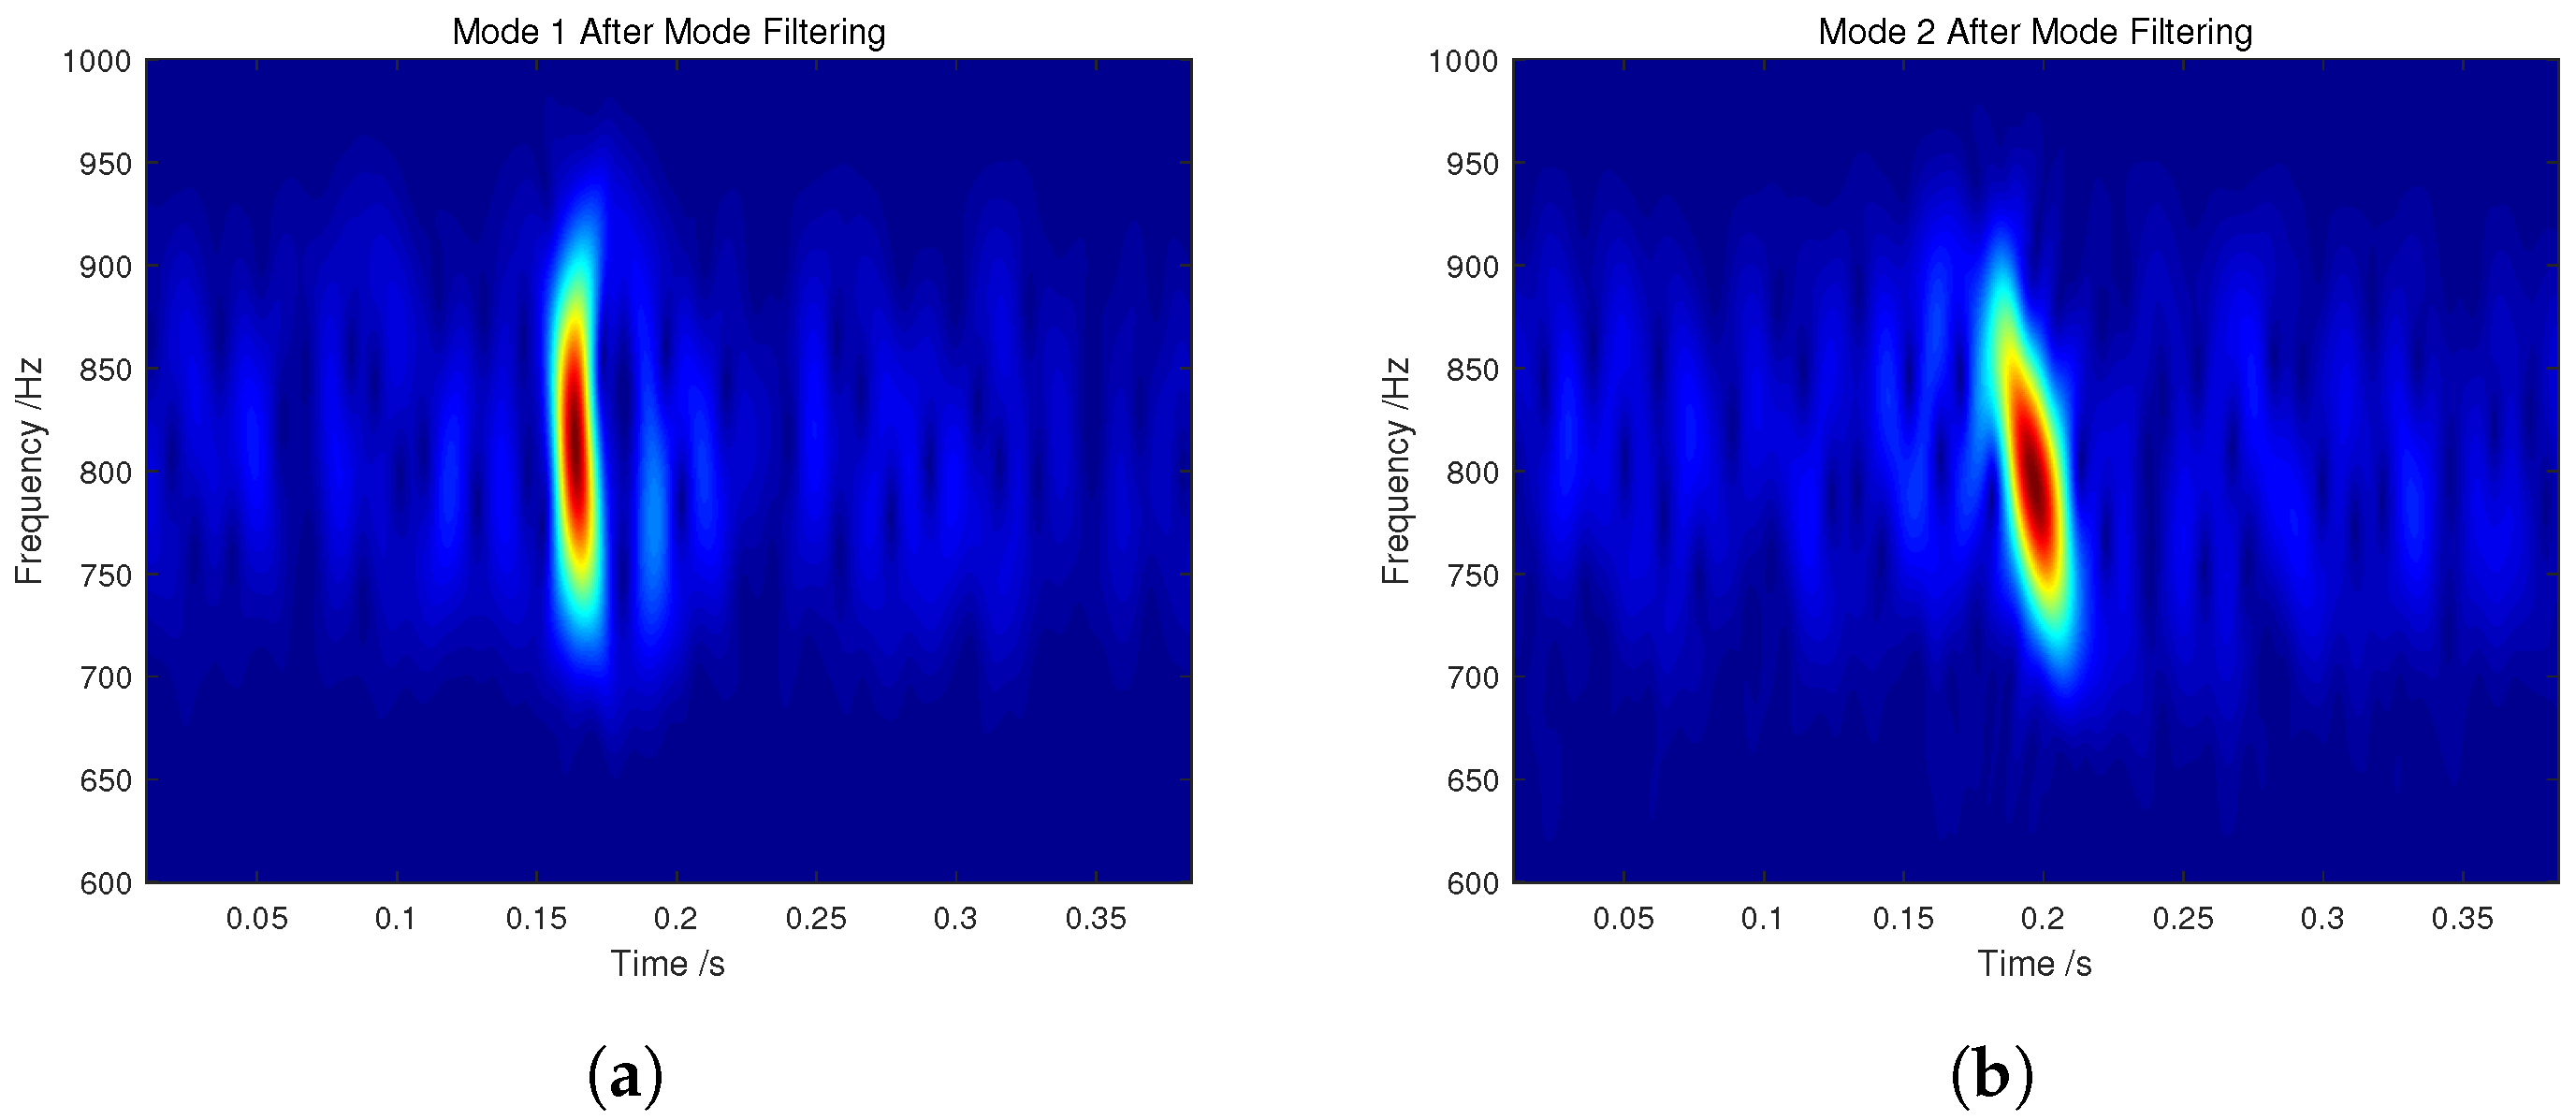
From the figure we can find that the variation trend of the estimated curves in each frequency band is quite similar, but the specific values are different from each other. Since the parameters of the experimental waveguide are unknown, the accuracy of the estimation is hard to determine. So, we continue to construct the mode filters by estimated results, and the filtered modes are shown in Figure 16.
It can be observed that the two effective modes are separated without any interference. This result also proves that the method in Section 4 is applicable in the real ocean environment. After mode filtering, the output SNR of the communication signals is 12.60 dB and 8.51 dB, respectively, which are higher than the received values of all array elements. The constellation plot of the filtered communication symbols is shown in Figure 17.
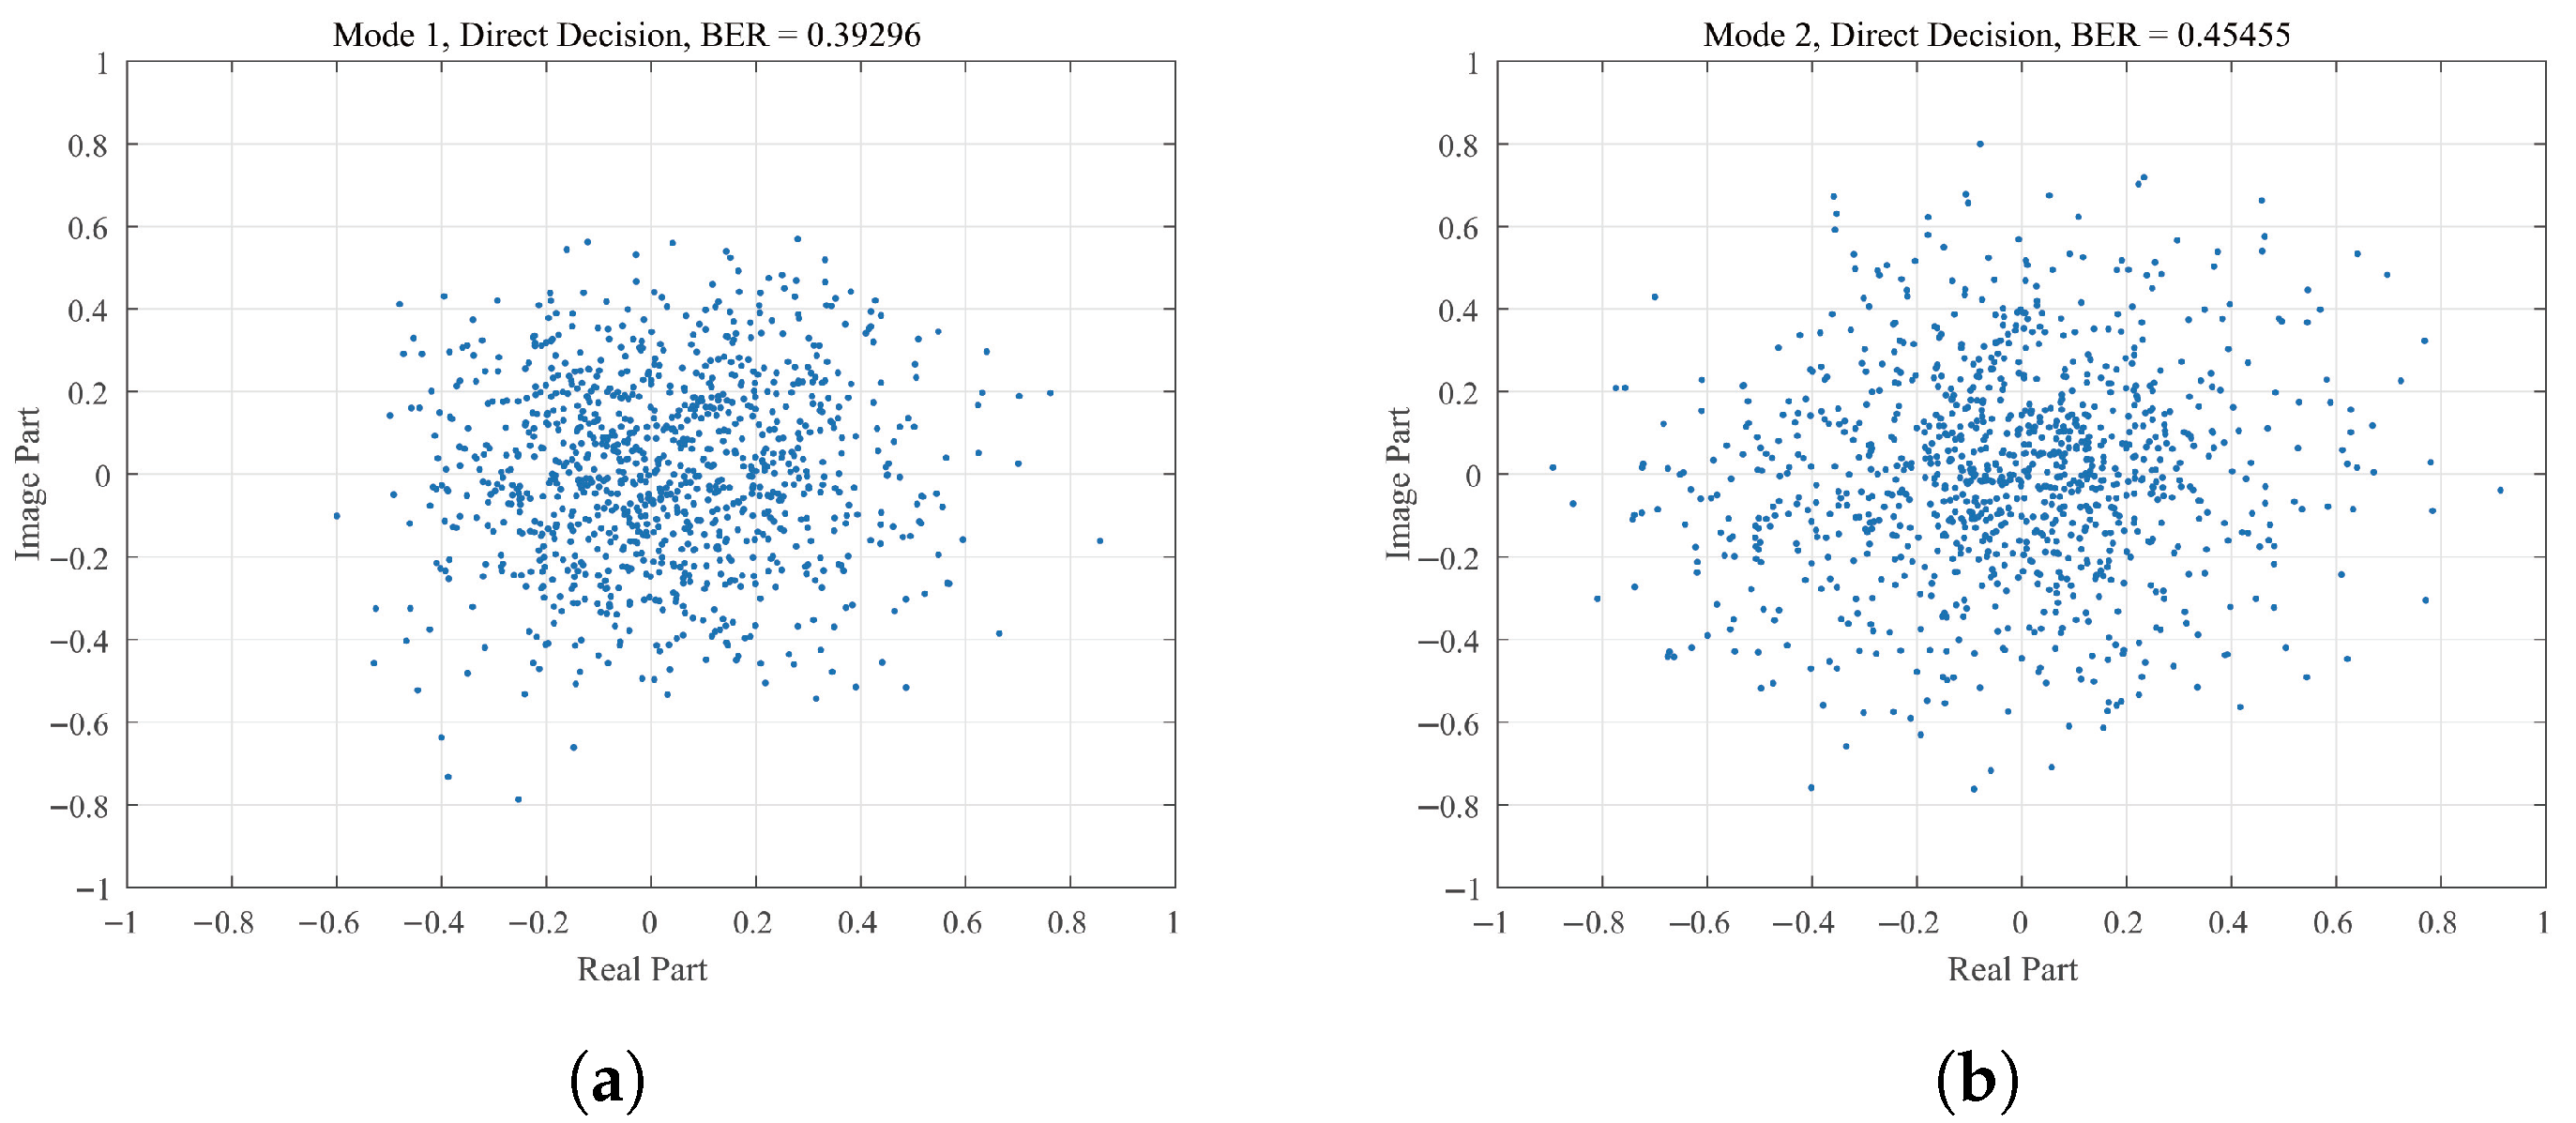
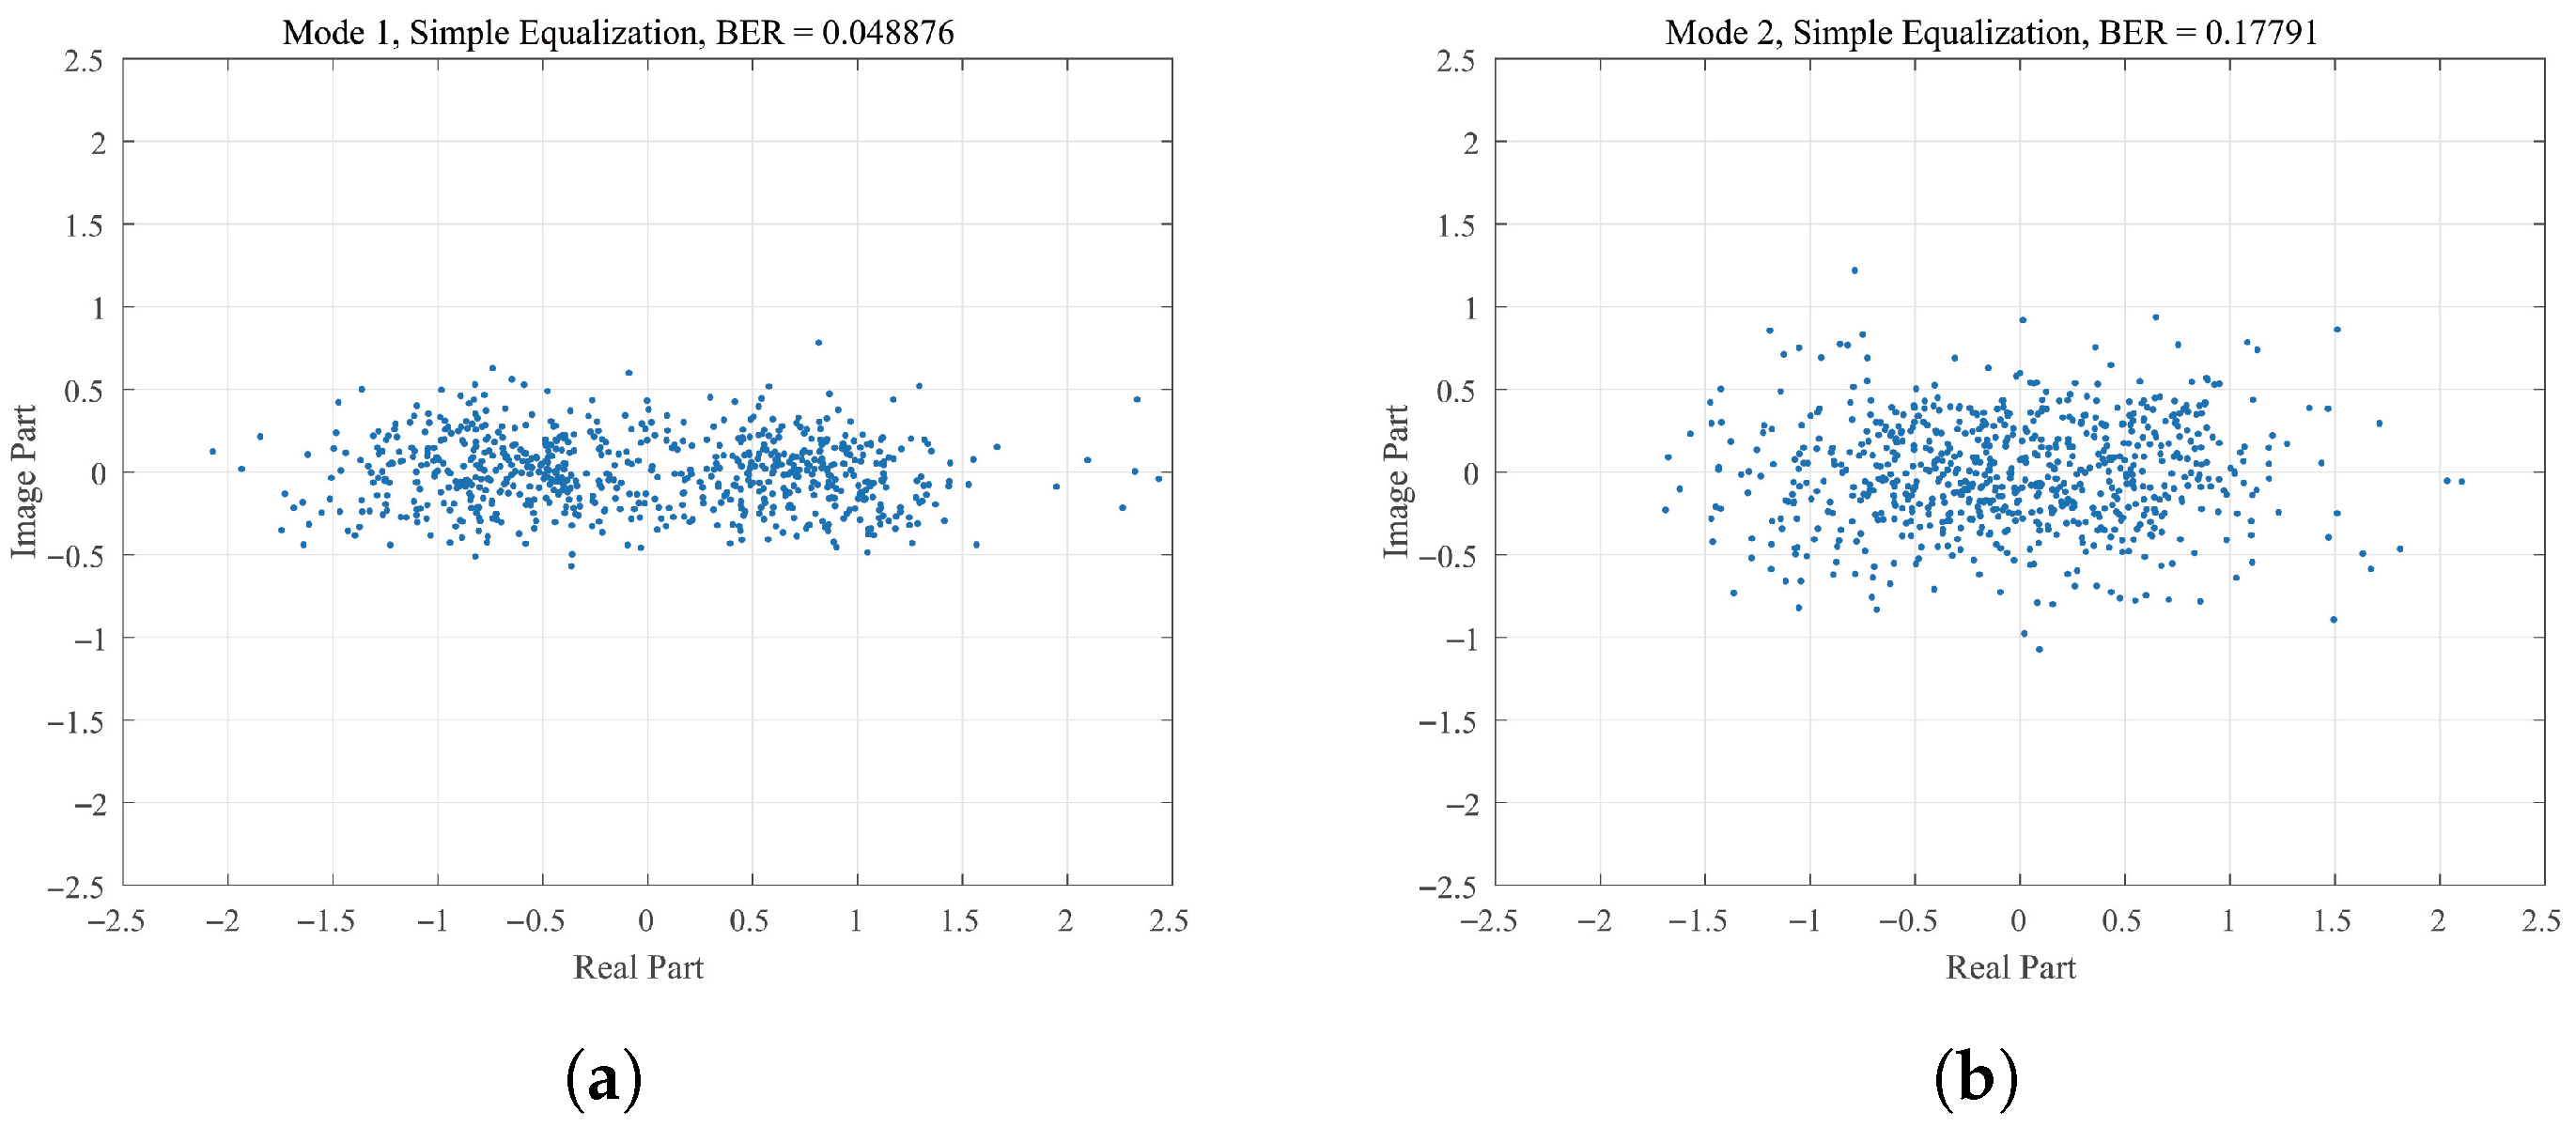
It can be seen that the symbol constellations are scattered seriously, and the BERs are 0.39 and 0.45, respectively, which cannot recover the transmitted information. This result is different from that in Figure 9 where the 1st mode can directly decide the symbol phase. This may be because the channel mode in this case spans several symbol intervals due to intra-mode dispersion and high symbol rate. Besides, the left noise interference is also severe. Utilizing the same adaptive DFE as Figure 14b to process the filtered symbols, the constellation plots are shown in Figure 18.
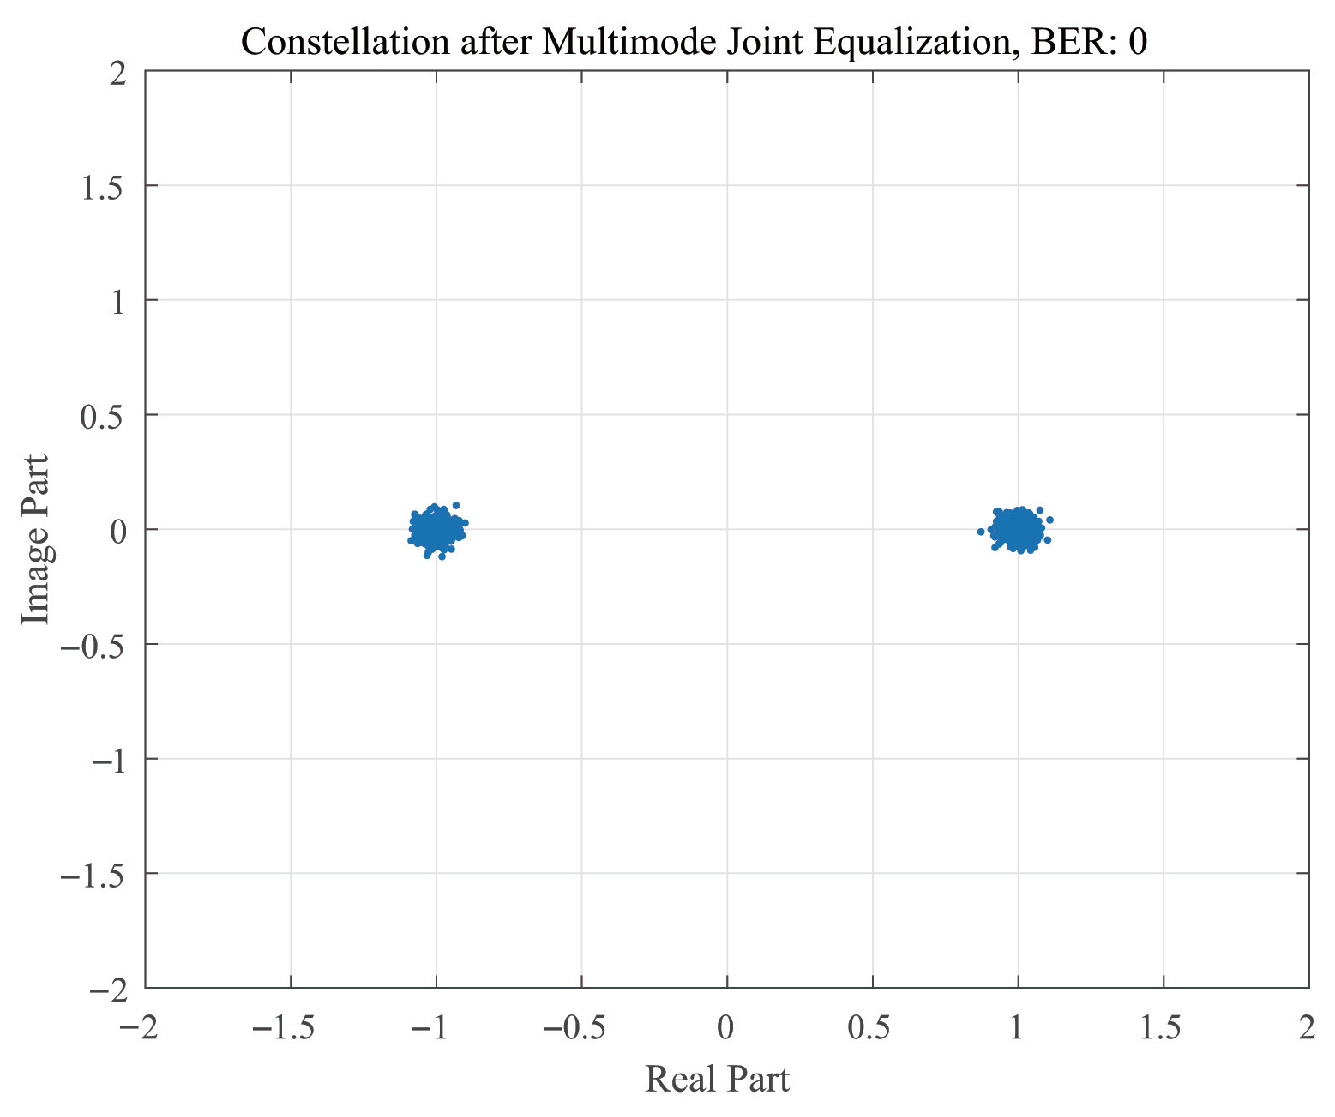
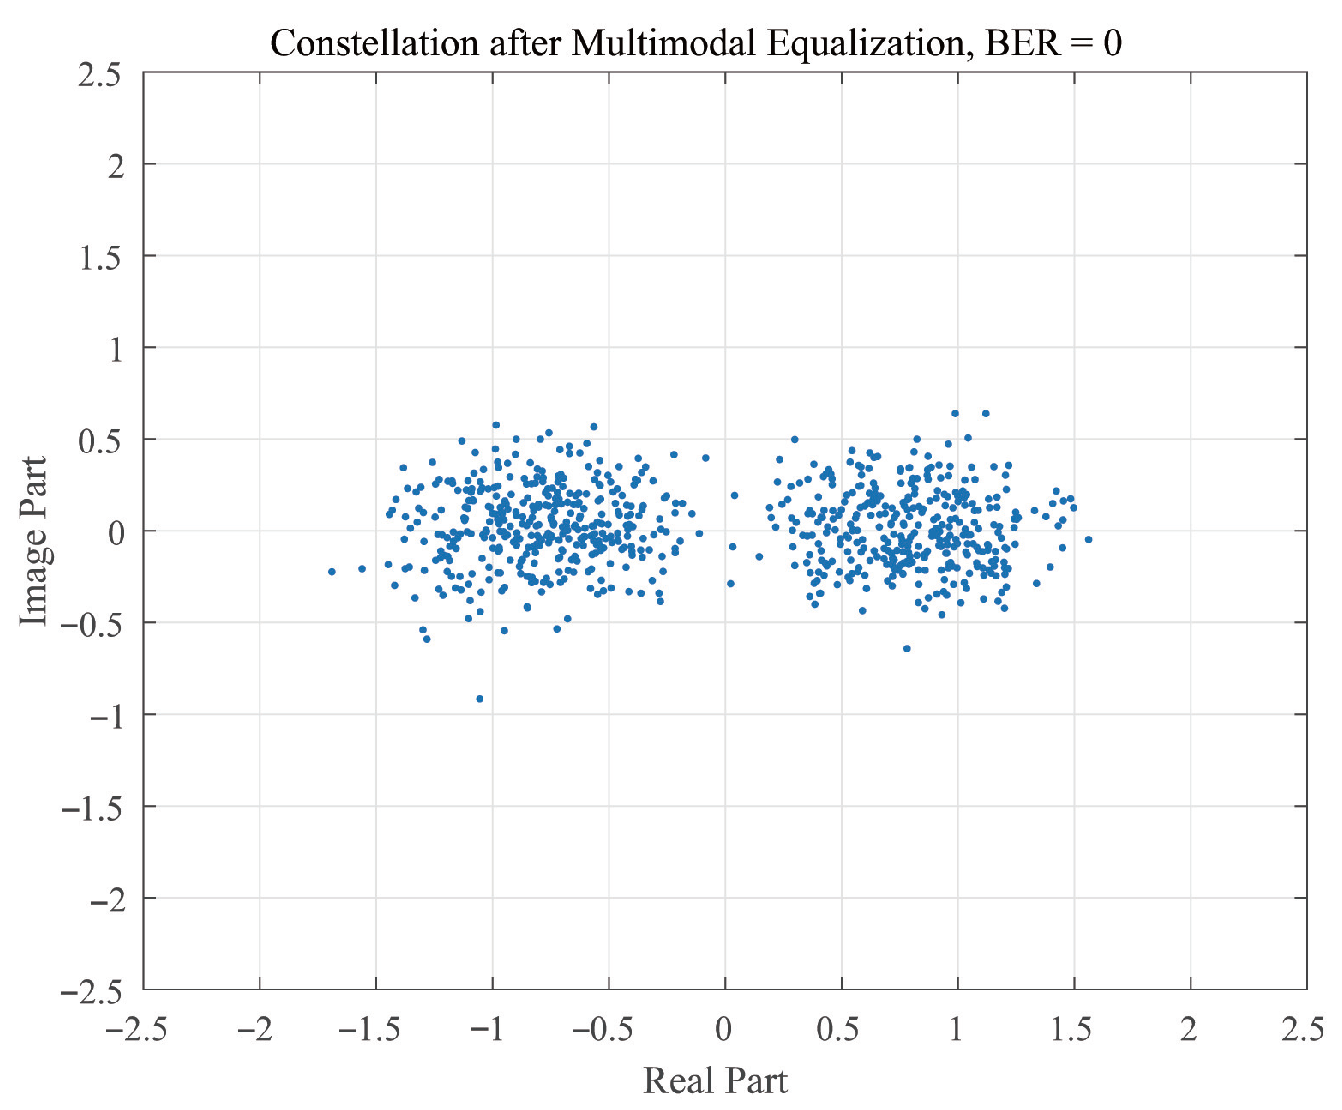
At this time, the performance is a little improved, and the BER was 0.049 and 0.178, respectively. For the symbols that suffer from the 1st channel mode, due to the weak intra-modal dispersion, equalization can achieve lower BER. However, symbols from the 2nd channel mode cannot be successfully demodulated due to severe dispersion and low SNR. The constellation plot by the proposed multi-mode joint equalization is shown in Figure 19. It indicates that the constellation after multi-mode processing becomes more gathered, and all symbols can be correctly determined. Comparing with the results in Figure 18, the gathered pattern shows improved output SNR. This result proves that multi-mode joint equalization has better performance than single mode equalization, and can achieve error-free communication even when the received SNR is not sufficient.

6. Conclusions

Due to the long delay spread and low SNR in low frequency and long range shallow water communications, the applicability of traditional equalization techniques based on array processing will decrease. In this paper, a multi-mode joint equalization scheme is proposed, which exploits modal depth estimation and mode filtering to separate the influence of each channel mode without prior information. Then, the multi-mode joint equalization is applied to coherently exploit multiple components in the acoustic field, while utilizing all their energy rather than leaving out some input information. The proposed scheme can be regarded as using spatial and frequency diversity simultaneously. Simulation results in the Pekeris waveguide indicate that compared with traditional beamforming and multichannel equalization, multi-mode joint equalization can achieve improvement of about 3 dB and 6 dB, respectively. The analysis based on experimental data shows that multi-mode joint processing can obtain fewer errors, which can verify its validity and superior capability in low frequency and long range shallow water communication systems.

Author Contributions

Methodology, S.X.; validation, B.L.; data curation, D.G.; writing—original draft preparation, Y.Z.; writing—review and editing, H.C. All authors have read and agreed to the published version of the manuscript.

Funding

This work is funded by the National Natural Science Foundation of China (Grant No. 62201170), the Natural Science Foundation of Heilongjiang Province of China (Grant No. LH2024D016), and is also supported by the Fundamental Research Funds for the Central Universities (3072024XX0804).

Data Availability Statement

Data available on request due to privacy restrictions. The data presented in this study are available on request from the corresponding author due to privacy restrictions. Data available from b.liu@hrbeu.edu.cn upon reasonable request.

Acknowledgments

The authors would like to thank Dazhi Gao and his team for their support with the sea trial data. We are also deeply grateful to Rahim Khan for his valuable contributions in improving the grammatical accuracy and overall readability of this paper.

Conflicts of Interest

The authors declare no conflicts of interest.

References

  1. Kilfoyle, D.B.; Baggeroer, A.B. The state of the art in underwater acoustic telemetry. IEEE J. Ocean. Eng. 2000, 25, 4–27. [Google Scholar] [CrossRef]
  2. Yang, T.C. A Study of Spatial Processing Gain in Underwater Acoustic Communications. IEEE J. Ocean. Eng. 2007, 32, 689–709. [Google Scholar] [CrossRef]
  3. Stojanovic, M.; Catipovic, J.; Proakis, J.G. Adaptive multichannel combining and equalization for underwater acoustic communications. J. Acoust. Soc. Am. 1998, 94, 1621–1631. [Google Scholar] [CrossRef]
  4. LeBlanc, L.R.; Beaujean, P.J. Spatio-temporal processing of coherent acoustic communication data in shallow water. IEEE J. Ocean. Eng. 2000, 25, 40–51. [Google Scholar] [CrossRef]
  5. Kanga, T.; Song, H.C.; Hodgkiss, W.S.; Soo, K.J. Long-range multi-carrier acoustic communications in shallow water based on iterative sparse channel estimation. J. Acoust. Soc. Am. 2010, 126, EL372–EL377. [Google Scholar] [CrossRef]
  6. Singer, A.C.; Nelson, J.K.; Kozat, S.S. Signal processing for underwater acoustic communications. IEEE Commun. Mag. 2009, 47, 90–96. [Google Scholar] [CrossRef]
  7. Pajovic, M.; Preisig, J.C. Performance Analysis and Optimal Design of Multichannel Equalizer for Underwater Acoustic Communications. IEEE J. Ocean. Eng. 2015, 40, 759–774. [Google Scholar] [CrossRef]
  8. Liu, Z.; Yoo, K.; Yang, T.C.; Cho, S.E.; Song, H.C.; Ensberg, D.E. Long-Range Double-Differentially Coded Spread-Spectrum Acoustic Communications with a Towed Array. IEEE J. Ocean. Eng. 2014, 39, 482–490. [Google Scholar] [CrossRef]
  9. Zhang, D.L.; Xiao, S.; Cui, H.Y.; Gao, D.Z.; Cui, H.Y. Performance analysis of an improved modal dispersion compensation receiver for low-frequency and long-range shallow water communication experiment. Appl. Acoust. 2020, 159, 107–117. [Google Scholar] [CrossRef]
  10. Yang, T.C. Measurements of temporal coherence of sound transmissions through shallow water. J. Acoust. Soc. Am. 2006, 120, 2595–2614. [Google Scholar] [CrossRef]
  11. Rouseff, D.; Turgut, A.; Wolf, S.N.; Finette, S.; Orr, M.H.; Pasewark, B.H.; Apel, J.R.; Badiey, M.; Chiu, C.S.; Headrick, R.H.; et al. Coherence of acoustic modes propagating through shallow water internal waves. J. Acoust. Soc. Am. 2002, 111, 1655–1666. [Google Scholar] [CrossRef]
  12. Baggeroer, A.B.; Kuperman, W.A. An overview of matched field methods in ocean acoustics. IEEE J. Ocean. Eng. 1993, 18, 401–424. [Google Scholar] [CrossRef]
  13. Yang, T.C. A method of range and depth estimation by modal decomposition. J. Acoust. Soc. Am. 1987, 82, 1736–1745. [Google Scholar] [CrossRef]
  14. Bucka, J.R.; Preisig, J.C.; Wage, K.E. A unified framework for mode filtering and the maximum a posteriori mode filter. J. Acoust. Soc. Am. 1998, 103, 1813–1824. [Google Scholar] [CrossRef]
  15. Collison, N.; Dosso, S. A comparison of modal decomposition algorithms for matched-mode processing. Can. Acoust. 2000, 28, 15–26. Available online: https://api.semanticscholar.org/CorpusID:54729552 (accessed on 14 August 2025).
  16. Papp, J.C.; Preisig, J.C.; Morozov, A.K. Physically constrained maximum likelihood mode filtering. J. Acoust. Soc. Am. 2010, 127, 2385–2391. [Google Scholar] [CrossRef] [PubMed]
  17. Morozov, A.K.; Preisig, J.C.; Papp, J. Modal processing for acoustic communications in shallow water experiment. J. Acoust. Soc. Am. 2008, 124, 177–181. [Google Scholar] [CrossRef]
  18. Morozov, A.K.; Preisig, J.C.; Papp, J.C. Investigation of Mode Filtering as a Preprocessing Method for Shallow-Water Acoustic Communications. IEEE J. Ocean. Eng. 2010, 35, 744–755. [Google Scholar] [CrossRef]
  19. Udovydchenkov, I.A.; Rypina, I.I.; Brown, M.G. Mode filters and energy conservation. J. Acoust. Soc. Am. 2010, 127, 185–191. [Google Scholar] [CrossRef]
  20. Brown, M.G.; Udovydchenkov, I.A. Underwater communication using weakly dispersive modal pulses. Acoust. Phys. 2013, 59, 533–538. [Google Scholar] [CrossRef]
  21. Udovydchenkov, I.A. Array design considerations for exploitation of stable weakly dispersive modal pulses in the deep ocean. J. Sound Vib. 2017, 400, 402–416. [Google Scholar] [CrossRef]
  22. Udovydchenkov, I.A.; Brown, M.G.; Duda, T.F.; Worcester, P.F.; Dzieciuch, M.A.; Mercer, J.A.; Andrew, R.K.; Howe, N.M.; Colosi, J.A. Weakly dispersive modal pulse propagation in the North Pacific Ocean. J. Acoust. Soc. Am. 2013, 134, 3386–3394. [Google Scholar] [CrossRef] [PubMed]
  23. Jensen, F.B.; Kuperman, W.A. Computational Ocean Acoustics; Springer: New York, NY, USA, 2000. [Google Scholar]
  24. Zhang, D.L.; Xiao, S.; Cui, H.Y.; Gao, D.Z.; Sun, D.J. Modal dispersion compensation receiver for the long range shallow water acoustic communications. J. Acoust. Soc. Am. 2019, 145, EL483–EL487. [Google Scholar] [CrossRef]
  25. Porter, M. Acoustic Toolbox—A Matlab Version of KRAKEN. 2018. Available online: https://oalib-acoustics.org/ (accessed on 14 August 2025).
  26. Neilsen, T.B.; Westwood, E.K.; Udagawa, T. Mode function extraction from a VLA using singular value decomposition. J. Acoust. Soc. Am. 1997, 101, 3025–3032. [Google Scholar] [CrossRef]
  27. Neilsen, T.B.; Westwood, E.K. Extraction of acoustic normal mode depth functions using vertical line array data. J. Acoust. Soc. Am. 2002, 111, 748–756. [Google Scholar] [CrossRef]
  28. Wage, K.E.; Baggeroer, A.B.; Preisig, J.C. Modal analysis of broadband acoustic receptions at 3515-km range in the North Pacific using short-time Fourier techniques. J. Acoust. Soc. Am. 2003, 113, 801–817. [Google Scholar] [CrossRef]
  29. Zhu, Z.L.; Tong, F.; Zhou, Y.H.; Wu, F.Y. Dual parameters optimization lp-LMS for estimating underwater acoustic channel with uncertain sparsity. Appl. Acoust. 2023, 202, 109150. [Google Scholar] [CrossRef]
  30. Gong, G.Y.; Yao, W.B. Adaptive estimation of sparse channel based on modified RLS for coherent underwater acoustics communications. Appl. Acoust. 2022, 192, 108745. [Google Scholar] [CrossRef]
  31. Jin, Y.W.; Friedlander, B. Reduced-Rank Adaptive Detection of Distributed Sources Using Subarrays. IEEE Trans. Sig. Process. 2005, 53, 13–25. [Google Scholar] [CrossRef]
  32. Sheng, X.L.; Dong, C.P.; Guo, L.X.; Wang, X. High-resolution frequency-difference beamforming for a short linear array. J. Acoust. Soc. Am. 2023, 154, 1191–1201. [Google Scholar] [CrossRef]
  33. Liu, C.X.; Tao, J.; Huang, W.M. A Recursive Gaussian Newton Based Variable Parameter Adaptive Receiver for Single-Carrier Underwater Acoustic Communications. IEEE Trans. Veh. Technol. 2025, 73, 19275–19286. [Google Scholar] [CrossRef]
  34. Gao, D.Z.; Wang, N.; Wang, H.Z. A Dedispersion Transform for Sound Propagation in Shallow Water Waveguide. J. Comp. Acoust. 2010, 18, 245–257. [Google Scholar] [CrossRef]
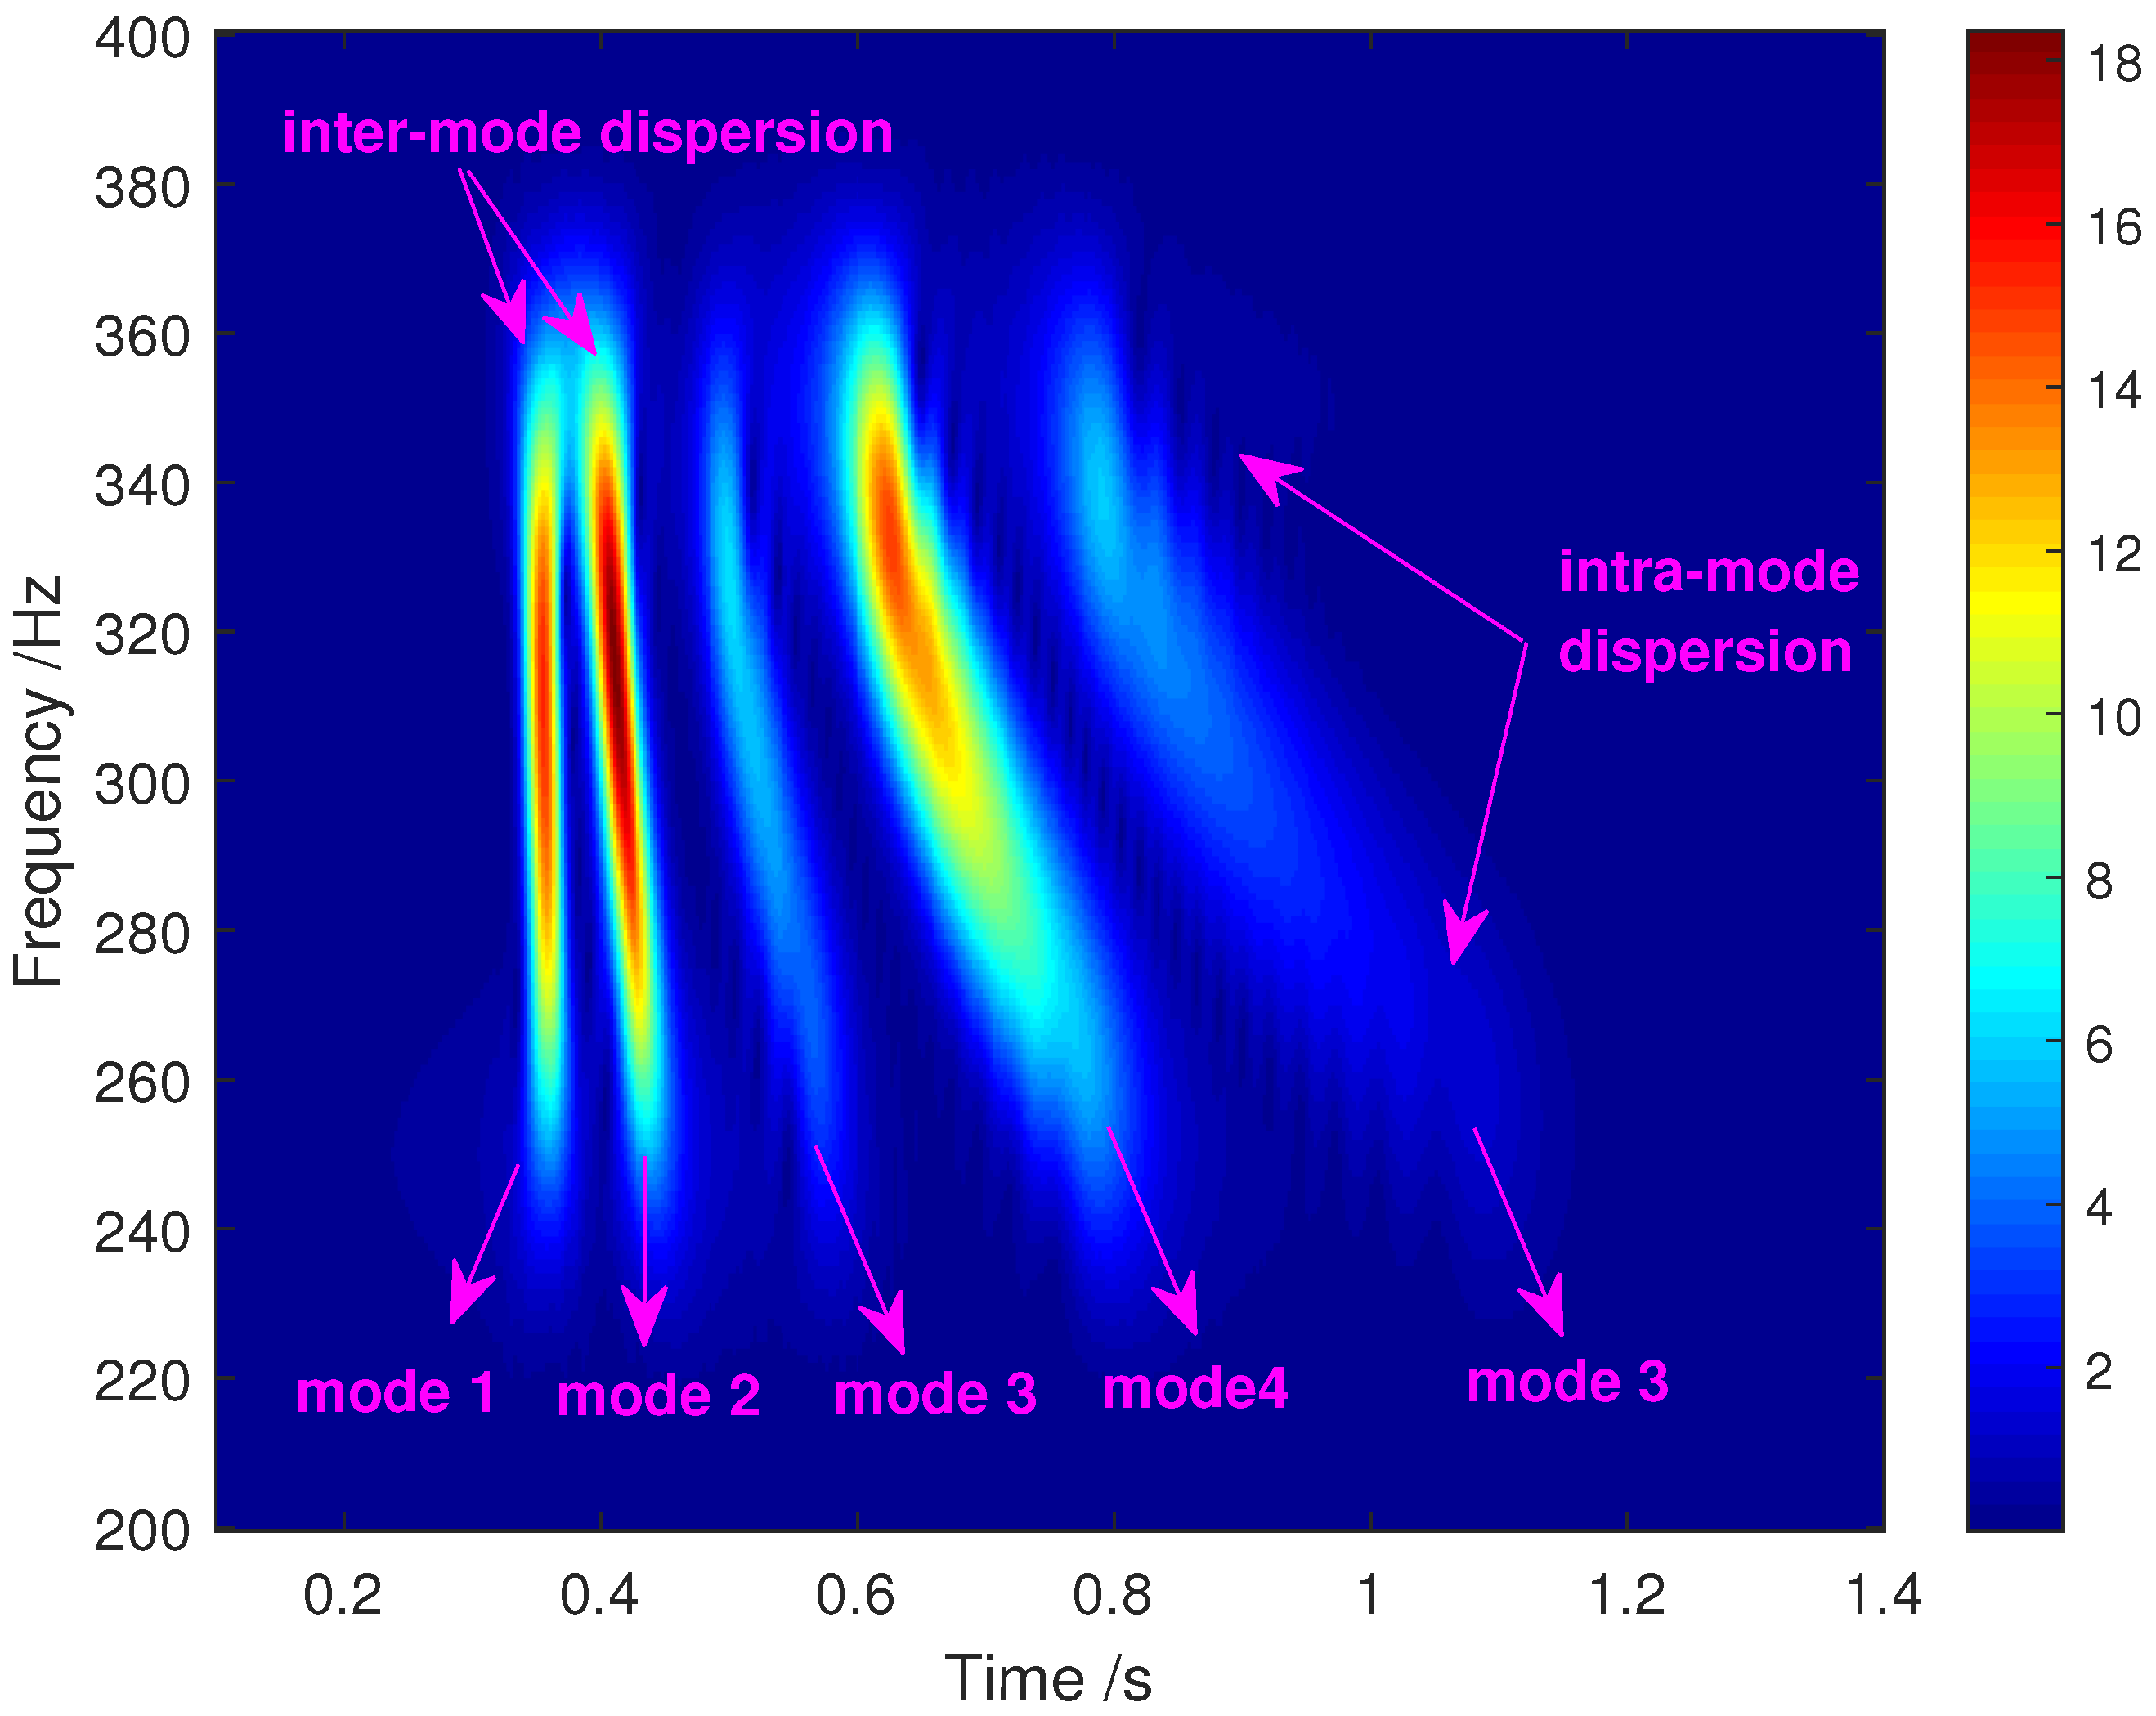
Figure 1. The time-frequency analysis of received CW signal in an ideal waveguide.
Jmse 13 01587 g001
Figure 2. The receiver structure of multi-mode joint equalization scheme.
Jmse 13 01587 g002
Figure 3. The modal depth function difference between frequencies.
Jmse 13 01587 g003
Figure 4. Structure of the mode filtering for broadband communication signal.
Jmse 13 01587 g004
Figure 5. Structure of the multi-input equalizer.
Jmse 13 01587 g005
Figure 6. The simulated shallow water waveguide.
Jmse 13 01587 g006
Figure 7. Estimation performance by probe signal with different bandwidths. (a) Estimation by narrowband signal. (b) Estimation by broadband signal.
Jmse 13 01587 g007
Figure 8. Results of the broadband mode filtering. (a) Mode 1. (b) Mode 2. (c) Mode 3. (d) Mode 4. (e) Mode 5.
Jmse 13 01587 g008
Figure 9. Constellation plots after mode filtering. (a) Mode 1. (b) Mode 2. (c) Mode 3. (d) Mode 4. (e) Mode 5.
Jmse 13 01587 g009
Figure 10. Constellation plots after single input equalization. (a) Mode 1. (b) Mode 2. (c) Mode 3. (d) Mode 4. (e) Mode 5.
Jmse 13 01587 g010
Figure 11. Constellation after multi-input equalization.
Jmse 13 01587 g011
Figure 12. BER curves of the comparing receiver structures.
Jmse 13 01587 g012
Figure 13. Received signal distribution versus depth. (a) SNR. (b) Matched filtering results (A rough estimation of channel impulse response).
Jmse 13 01587 g013
Figure 14. Received signal of the 8th element and its constellation plot. (a) The time-frequency analysis. (b) Constellation plots of the received symbols. (c) Constellation plots after simple equalization.
Jmse 13 01587 g014
Figure 15. Modal depth function estimation results. (a) Mode 1. (b) Mode 2.
Jmse 13 01587 g015
Figure 16. Mode filtering results of the experimental data. (a) Mode 1. (b) Mode 2.
Jmse 13 01587 g016
Figure 17. Constellation plots after mode filtering. (a) Mode 1. (b) Mode 2.
Jmse 13 01587 g017
Figure 18. Constellation plots after single mode equalization. (a) Mode 1. (b) Mode 2.
Jmse 13 01587 g018
Figure 19. Constellation plot after multi-mode joint equalization of the experimental data.
Jmse 13 01587 g019
Table 1. Simulation Parameters.
Water Depth40 mRange20 km
Water Density1 g / c m 3 Number of Efficient modes5
Sound Velocity of Water1500 m / s Number of array elements20
Sound Velocity of Bottom 1800 m / s SNR10 dB
Density of Bottom 1.5 g / c m 3 Carrier Frequency300 Hz
Attenuation of Bottom 0.2 dB / km · Hz Bandwidth200 Hz
Disclaimer/Publisher’s Note: The statements, opinions and data contained in all publications are solely those of the individual author(s) and contributor(s) and not of MDPI and/or the editor(s). MDPI and/or the editor(s) disclaim responsibility for any injury to people or property resulting from any ideas, methods, instructions or products referred to in the content.