Abstract
Tidal turbines represent a promising renewable energy source, generating power from ocean currents. However, due to tidal range variations, they sometimes become partially exposed to the free surface. When this occurs, the turbine experiences reduced power generation and unsteady torque caused by the asymmetric flow. Such conditions can lead to long-term degradation of turbine performance and reliability. From this perspective, a key question arises regarding how significantly power generation differs when turbines are exposed to the free surface. This study was conducted with the objective of quantitatively evaluating the differences in power generation and torque acting on the turbine due to free-surface exposure, in order to address this question. Numerical simulations considering free-surface exposure effects were developed to quantitatively assess these phenomena through Computational Fluid Dynamics (CFD). Additionally, this numerical model was validated by comparison against experimental data and verified by convergence tests. The results revealed that the tidal turbine exhibited power generation differences ranging from a maximum of 45% to a minimum of 0.44%, depending on the degree of free-surface exposure. These findings are expected to serve as valuable indicators for power generation when operating tidal turbines.
1. Introduction
Global warming has been occurring due to carbon emissions from fossil fuel consumption. These carbon emissions lead to climate change, which is considered a critical global challenge. As a result, the development of renewable energy technologies is essential to replace fossil fuels. In this context, tidal energy is one of the most promising renewable energy sources for fossil fuel replacement. Tidal energy offers several advantages over other renewable sources: it is highly predictable and follows regular periodic patterns, providing a reliable energy source compared to intermittent sources like wind and solar energy. Additionally, the higher density of water enables more efficient energy extraction than air-based systems.
Tidal turbines are separated into two types according to the direction of tidal currents. First, the horizontal axis tidal turbine (HATT) is a tidal power generation system that has a rotational axis parallel to the direction of the current. This type is the most widely used type of tidal turbine, and there are various types of this turbine worldwide, such as the SeaGen in the UK, Torcado in the Netherlands, AR1000 turbine in Singapore, and Open Centre turbine in Ireland [1,2]. The other type is the vertical axis tidal turbine (VATT), which has a rotational axis perpendicular to the direction of the current. This type is also used in various countries, such as the Blue Energy turbine in Canada and Gorlov Helical turbine in the USA [1]. In this way, various countries are developing and utilizing tidal turbines.
Moreover, the research on tidal turbines has been conducted in various ways. One way of estimating turbine performance is through experiments. Various experiments have been carried out in tanks by manufacturing model turbines. B. Gaurier et al. [3] estimated the interaction effects between three horizontal axis turbines through experiments in an IFREMER flume tank. Similarly, Y. Zhang et al. [4] performed experiments to evaluate the yaw effect on the wake and functioning of a floating turbine under wave-induced motion. Additionally, several studies have utilized cavitation tunnels to investigate turbine performance. A. S. Bahaj et al. [5] conducted experiments in a cavitation tunnel, varying pitch angles and flow velocities to investigate turbine performance. Furthermore, Wang et al. [6] estimated the effect of cavitation on tidal turbine noise through experiments in the Emerson Cavitation Tunnel (ECT) at Newcastle University.
The other way to assess turbine performance is through Computational Fluid Dynamics (CFD). The research on the blockage effect of tidal turbines in restricted channels has estimated turbine performance by varying channel depth and width through CFD simulations [7]. Moreover, considering that actual tidal turbines are typically deployed in arrays, studies have investigated their performance characteristics and wake interaction effects [8,9,10,11].
In this context, tidal energy is an important energy generation source at present. However, when operating tidal turbines, we sometimes face the problem that turbines are exposed above the free surface due to tidal variations. As shown in Figure 1, which illustrates the SeaGen tidal turbine in the UK being exposed above the free surface, this type of exposure can lead to the power degradation of tidal turbines because of the density difference between air and water. Moreover, this exposure can cause structural damage due to the significant torque imbalance created when portions of a blade operate in air while other sections remain submerged in water, thereby resulting in uneven loading conditions across the blade span.
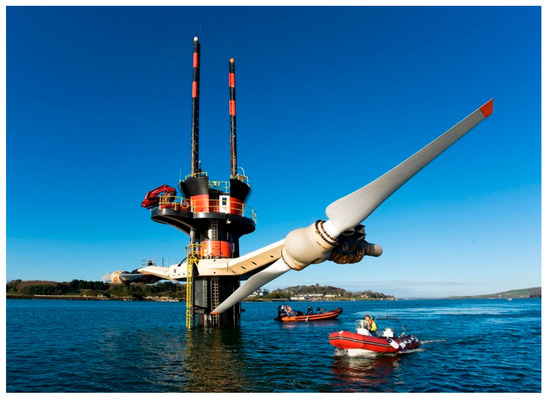
Figure 1.
SeaGen tidal turbine showing exposure above the free surface.
Previous studies examining situations where tidal turbines operate close to the free surface have primarily focused on investigating the effects of varying submergence depths of tidal turbines. The effects of the submergence depth of tidal turbines and the position of the support strut were evaluated through experimental tests [12]. In another approach, J. Yan et al. [13] proposed a novel CFD simulation framework for tidal turbines operating near the free surface, and conducted simulations investigating the effects of varying tip submergence depths on turbine performance. However, there is insufficient research on performance evaluation for conditions where tidal turbines operate with portions exposed above the free surface, indicating a significant research gap. Therefore, the aim of this study is to quantitatively evaluate the performance variations when the turbine operates with exposure above the free surface. In this paper, CFD simulations considering conditions where the tidal turbine is exposed above the free surface were developed to assess the effect of free-surface exposure. This quantitative prediction of tidal turbine performance variations due to free-surface exposure has not been found in existing research, which represents the distinctive contribution of this study.
This paper is organised as follows: Section 2 presents the mathematical formulation, geometry, simulation scenarios, boundary conditions, and specific mesh information for the CFD simulations. Section 3 provides validation studies through comparison between CFD results and model-scale experiments, as well as verification studies conducted through grid convergence tests, prior to evaluating the free-surface effects on tidal turbines. Finally, a quantitative assessment of the free-surface exposure effects on tidal turbines is presented in Section 4.
2. Methodology
2.1. Mathematical Formulation
A CFD model for estimating the effect of free-surface exposure on tidal turbines was established using the commercial CFD software package, STAR-CCM+ (version 19.04.009). This software employs the unsteady Reynolds-averaged Navier–Stokes (URANS) approach, which handles the averaged continuity and momentum equations for incompressible flow through the following two equations, which were expressed in tensor notation using Cartesian coordinates [14]. For the full-scale simulations, the Volume of Fluid (VOF) method was employed to track the free surface, while the governing equations were presented in their general form to maintain generality.
where , , , , and represent density, averaged velocity, Reynolds stress, averaged pressure, and mean viscous tensor components, respectively. Moreover, in the case of Newtonian fluid, this viscous stress can be expressed as follows:
where represents the dynamic viscosity of fluid.
The computational domain was discretised using the finite volume method within the CFD solver. The momentum equations were resolved through second-order upwind convection schemes, while second-order temporal discretisation was implemented throughout this calculation. The overall solution algorithm utilized a Semi-Implicit Method for Pressure-Linked Equations (SIMPLE) approach. For the turbulence modelling approach, the shear stress transport (SST) turbulence model was employed in this study. The SST model was selected based on comparative validation studies with different turbulence models, as it showed the smallest discrepancy with experimental results. This model represents a hybrid turbulence formulation that combines the benefits of both and turbulence models. This integration enables enhanced accuracy in near-wall treatment while reducing dependence on inlet turbulence characteristics. These attributes contribute to enhanced predictive capability in adverse pressure gradient conditions and separated flow regions. Additionally, the Volume of Fluid method was used with High-Resolution Interface Capturing (HRIC) to capture changes in the free surface. The free surface was represented by tracking the water–air interface using the iso-surface function provided in STAR-CCM+, which identifies the region where water and air are equally mixed.
2.2. Geometry and Simulation Scenarios
A full-scale HATT, as shown in Figure 2, was used to assess the free-surface exposure effect in this study. This model was selected because it has been experimentally validated in previous studies [6,15], enabling validation through comparison between experimental and CFD results. Moreover, the main dimensions and principal particulars of HATT are presented in Table 1 and Table 2.
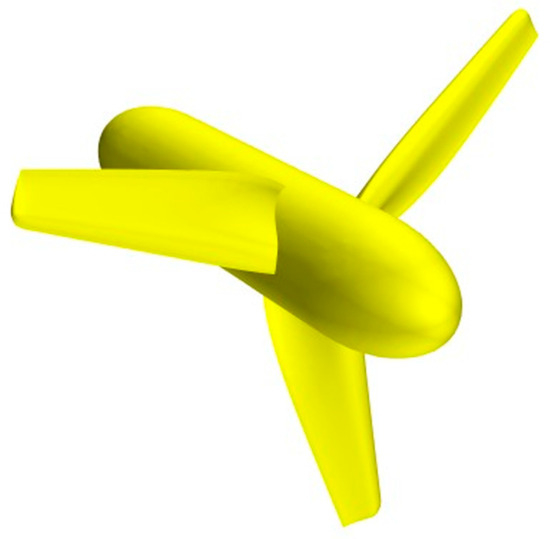
Figure 2.
Geometry of horizontal axis tidal turbine used in this study.

Table 1.
Main dimensions of full-scale HATT.

Table 2.
Chord length and pitch angle of HATT.
In this paper, to estimate the free-surface exposure effect on tidal turbines, simulations were conducted with varying blade submergence depths, as shown in Figure 3. Furthermore, as shown in Figure 3, the time step was set to 0.005 s to capture the changes in the free surface without deformation, and the study was conducted with flow-field visualization. The simulations employed full-scale tidal turbine geometry and were performed across tip speed ratios (TSR) ranging from 3 to 6, which encompasses the range near the optimal TSR for maximum power generation efficiency. The tip speed ratio is defined as
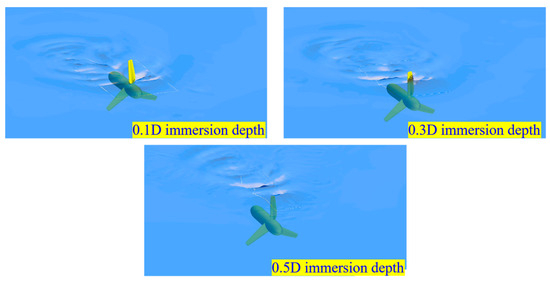
Figure 3.
Tidal turbine configurations at different blade immersion depths.
In this equation, , , and denote the rotational speed of the turbine (rad/s), the blade radius of the turbine, and the current velocity, respectively. Additionally, simulations involving varying degrees of free-surface exposure were conducted to evaluate the power and thrust coefficients, both of which are key indicators of tidal turbine efficiency. These coefficients are defined as follows:
In the above two equations, denotes the swept area of the turbine. Even when exposed to the free surface, the swept area refers to the total area of the turbine blades.
2.3. Computational Domain and Boundary Conditions
The computational domain and boundary conditions used in full-scale simulations are illustrated in Figure 4. As shown in Figure 4, all surfaces of the computational domain except one were set as velocity inlets to simulate the actual operating conditions of tidal turbines. These inlet conditions were maintained at constant velocities without variation over time and space. Furthermore, a rotating region, which is highlighted in yellow in Figure 4, was established around the tidal turbine, and turbine performance was measured by rotating the actual tidal turbine through rigid-body motion (e.g., the Sliding Mesh) at rotational speeds corresponding to each TSR. The reason for using rigid-body motion to describe the rotating motion of the tidal turbine is that the presence of the free surface necessitated accurate implementation through unsteady motion. Additionally, to evaluate the free-surface exposure effect on tidal turbine performance, simulation cases were performed by varying the free-surface height.
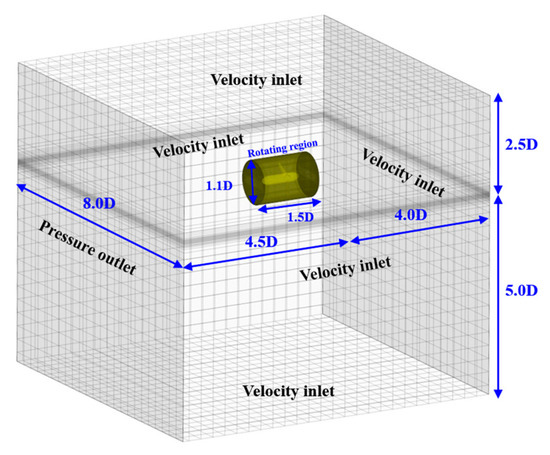
Figure 4.
Computational domain and boundary conditions used in full-scale simulations.
However, simulations without a free surface can be performed using the MRF approach, known as the ‘Multiple Reference Frame’ approach, which is a steady-state approximation method rather than unsteady motion. This method can be used without actual mesh motion, where the position of the moving object relative to the neighbouring region remains constant, and this approach has been validated through previous studies [16,17]. For the aforementioned reasons, the simulation used in the validation study, which involved comparison with model-scale experiments, was performed using the MRF method. Figure 5 illustrates the computational domain and boundary conditions of these model-scale simulations. Additionally, the dimensions of the computational domain for the model-scale simulations were identical to those of the cavitation tunnel used in the model-scale experiments conducted in the previous study [6]. The difference from the full-scale simulation is that all surfaces except the inlet and outlet were set as slip walls, based on the assumption that the wall-boundary-layer effect had minimal impact on turbine performance prediction.
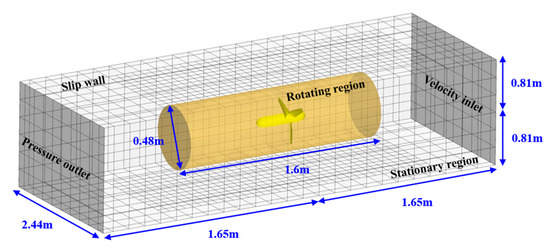
Figure 5.
Computational domain and boundary conditions of model-scale simulations for validation study.
2.4. Mesh Generation
The grid system for the full-scale tidal turbine simulations is illustrated in Figure 6. The computational grid was generated using trimmed cell meshes with prism layers through the built-in meshing tool of STAR-CCM+ (version 19.04.009). As depicted in Figure 6, local mesh refinements were implemented to accurately capture the free surface and waves generated by the rotating turbine. Additionally, mesh refinements in the rotating region near the blade surfaces were applied to enhance numerical accuracy by adjusting the first layer cell thickness to maintain wall values greater than 30.
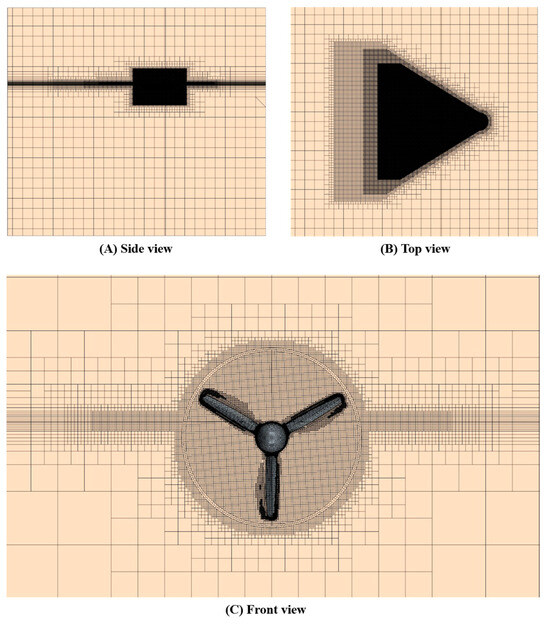
Figure 6.
Grid system of full-scale simulation.
Similar to the full-scale tidal turbine simulations, the grid system for the model simulations used in the validation study was generated using the same method as the full-scale simulations. Similarly, mesh refinements were added around the rotating region, and local mesh refinements were implemented in the swept area around the blades. However, the wall values of the blade were set to be less than 1, which differs from the full-scale simulations. The grid system for the model-scale simulations is represented in Figure 7. Moreover, in full-scale simulations, the mesh refinement of the free surface was set to a size that could encompass all dynamic pressures generated during turbine rotation in still water to adequately represent these phenomena.
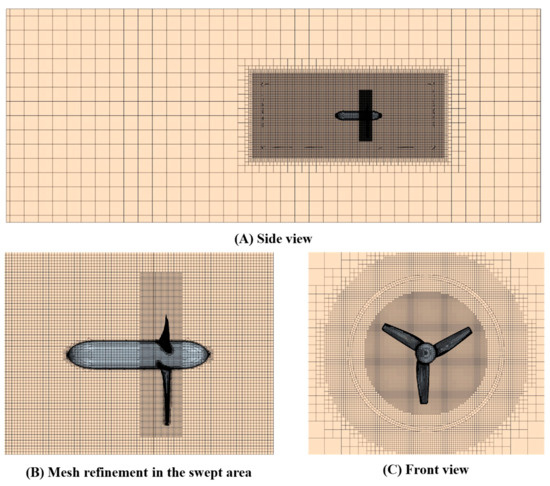
Figure 7.
Grid system of model-scale simulations for validation study.
3. Validation and Verification Studies
3.1. Validation Study
In Section 3, validation and verification studies for the simulations were conducted. First, the validation study was performed through comparison between CFD results and experimental data obtained by Shi et al. [15] at a 1:50 model scale. As shown in Figure 8, both the power and thrust coefficients demonstrate good agreement between the CFD results and EFD data at model scale. Furthermore, the model-scale simulation was carried out across a TSR range of 1 to 8. The corresponding Reynolds numbers for this simulation, based on the chord length at 0.7R and relative velocity (), fell within the range of . For the full-scale simulation results in deep water without exposure above the free surface, as depicted in Figure 8, results for TSR ranging from 3 to 6 can be observed. These results also showed only minor differences compared to the model-scale results, and such differences can be attributed to the scale effects of the tidal turbine.
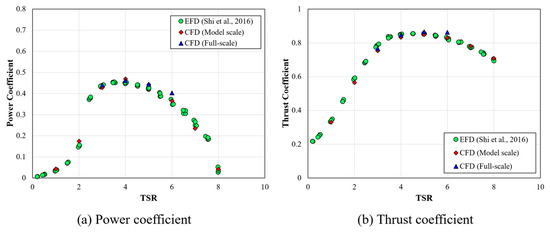
Figure 8.
CFD validation through comparison of power and thrust coefficients with experimental data [15].
3.2. Verification Study
The verification study was divided into two parts. The first part presented uncertainty estimation tests for model-scale simulations, which were validated through comparison with experimental data. The second part examined uncertainty estimation results for full-scale simulations where the blade was immersed to a depth of 10% of the turbine diameter. Both analyses were conducted using the Grid Convergence Index method developed by Celik [18]. Furthermore, both parts were carried out at TSR 4, which was near the optimal TSR condition.
As presented in Table 3, the uncertainty estimation results for the model-scale simulation indicated that both the power and thrust coefficients had fine grid uncertainties below 1%. On the other hand, the uncertainty estimation results for the full-scale simulation with free-surface exposure are presented in Table 4. Due to the absence of experimental data for conditions where the turbine was exposed above the free surface, the reliability of the full-scale simulations was established through grid and temporal convergence tests, as indicated in Table 4. Similar to the results of model-scale simulations, the uncertainty test results for full-scale simulations with free-surface exposure also showed reliable results below 1%. Subsequently, for the full-scale simulations with free-surface exposure, a time step of 0.005s and fine mesh, verified through the Grid Convergence Index method, were selected and used. This time step was set by considering the requirement that it be smaller than the time required for the tidal turbine to rotate 1 degree. Furthermore, the convergence test results for both the model-scale and full-scale simulations can be visually confirmed through Figure A1 and Figure A2.

Table 3.
Uncertainty estimation from spatial convergence tests for model-scale simulations at TSR 4.

Table 4.
Uncertainty estimation for full-scale simulation at 0.1D immersion depth at TSR 4.
4. Result
4.1. Quantitative Evaluation of Free-Surface Exposure Effect
In this study, as shown in Figure 3, the performance of tidal turbines with different portions exposed above the free surface was evaluated. The turbines were categorized into four scenarios based on different immersion depths relative to the turbine radius. Compared to the baseline deep-water performance evaluation, the cases were classified based on their immersion depth and corresponding free-surface exposure. The 0.1D immersion depth case exhibited the greatest free-surface exposure, followed by the 0.3D immersion depth case with moderate exposure, and finally the 0.5D immersion depth case, where the turbine tip touches the free surface.
Figure 9 shows the results of performance evaluation for tidal turbines with different immersion depths. As presented in Figure 9, it was observed that as the area exposed to the free surface increased, the power coefficient decreased, resulting in reduced power generation. Similarly, the thrust coefficient also showed a decreasing tendency as the area exposed to the free surface increased. Specifically, since the thrust coefficient is a factor that affects structural loads in tidal turbines, it was observed that as the tidal turbine was more exposed to air, power generation decreased but axial directional force also decreased. Furthermore, both power and thrust coefficients showed that higher exposure levels to the free surface led to smaller differences between each TSR. Additionally, the quantitative evaluation of tidal turbine performance variation due to changes in free-surface exposure area is presented in Table 5. As shown in Table 5, the reduction in power and thrust coefficients was compared between different immersion depth cases at each TSR and the baseline deep-water case. These quantitative estimations of free-surface exposure effects on turbine performance can be expected to serve as important indicators for predicting power generation. This is particularly relevant when tidal turbines are exposed above the free surface due to tidal range variations after actual installation. Furthermore, the quantitative evaluation shown in Table 5 can be examined in more detail through Figure A3. Figure 10 shows the free surface when the tidal turbine is exposed to the free surface, which represents the 0.1D immersion depth case with the largest exposure area.
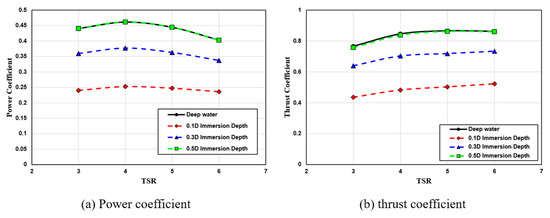
Figure 9.
Performance estimation of tidal turbines with different free-surface exposure levels.

Table 5.
Performance variation according to free-surface exposure area at each TSR.
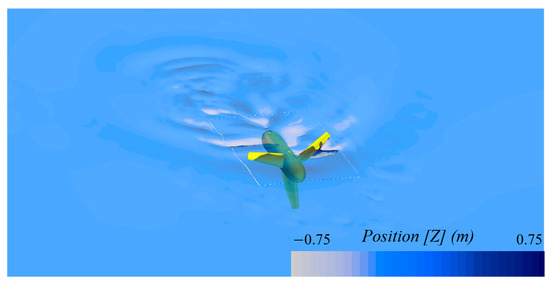
Figure 10.
Free-surface visualization at 0.1D immersion depth.
4.2. Comparison in Terms of Torque Components
The reason for power generation differences caused by free-surface exposure variation can be explained by torque components. As depicted in Figure 11, torque due to pressure and shear stress exhibited different behaviours according to the free-surface-exposed area of the tidal turbine. First, regarding the torque induced by pressure on the tidal turbine, greater area exposed to air on the turbine led to a decrease in torque by pressure, as shown in Figure 11a. This phenomenon is attributed to the significant density difference between water and air, which is approximately 1000:1. However, similar trends in response to TSR variations were identified regardless of the different immersion depths. Next, the variation in torque induced by shear stress on the turbine is presented in Figure 11b. Similar to pressure torque, shear-stress torque showed the same trends with TSR variations across all immersion depths. Furthermore, the magnitude of shear-stress torque also showed a decrease with an increase in the free-surface exposure area. However, as shown in Figure 11b, shear-stress torque appears as negative values, indicating that it acts as a force opposing rotation. This means that as the exposure area above the free surface increases, the rotational resistance decreases. Nevertheless, the overall torque reduction observed in Figure 9 can be attributed to the fact that torque from pressure is significantly larger than torque from shear stress, as evident in Figure 11, making the pressure component the dominant factor in the total torque variation.
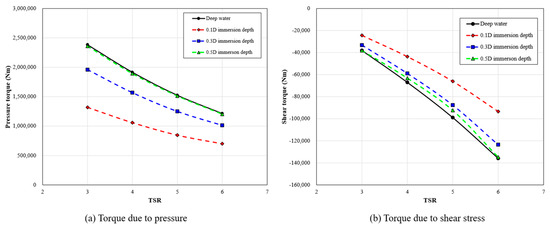
Figure 11.
Comparison of torque components according to free-surface exposure area.
Furthermore, the difference in pressure distribution on the tidal turbine between the 0.1D and 0.5 immersion depth scenarios at the same TSR of 4 is shown in Figure 12. As depicted in Figure 12, the dynamic pressure on the tidal turbine surface exposed above the free surface was noticeably reduced in magnitude, and the pressure difference between the face side and back side of the tidal turbine was significantly diminished. These results were consistent with the previously mentioned results from Figure 11, where the pressure torque decreased, leading to reduced power generation. A more detailed examination of the dynamic pressure distribution on both the suction side and pressure side is provided in Figure A4.
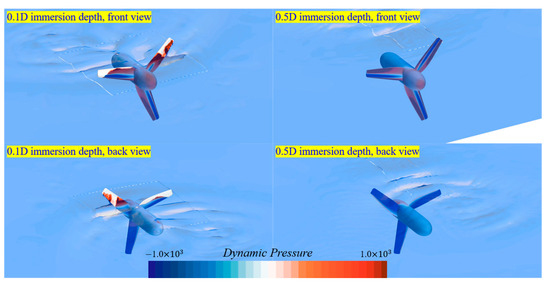
Figure 12.
Pressure distribution on the tidal turbines at different immersion depths.
4.3. Torque Variations Acting on a Single Blade
From the torque variation analysis presented earlier, it was confirmed that when an exposure area above the free surface occurred in tidal turbines, the torque generated by the blade portions exposed above the free surface differed significantly. To examine this phenomenon in detail, Figure 13 illustrates the torque variations during a single blade rotation under different immersion depth scenarios. These measurements were all taken at TSR 4 and the time was normalised by dividing by T, which represents the period required for one complete rotation of a single blade. As illustrated in Figure 13, the torque acting on a single blade showed an increasing trend with greater immersion depth. Specifically, among the four scenarios, the 0.1D immersion depth case with the greatest exposure above the free surface showed that instantaneous torque acting on a single blade became zero or even negative. However, the 0.5D immersion depth case where the blade tip was in contact with the free surface showed a slight decrease compared to the deep-water case, though the difference was not significant.
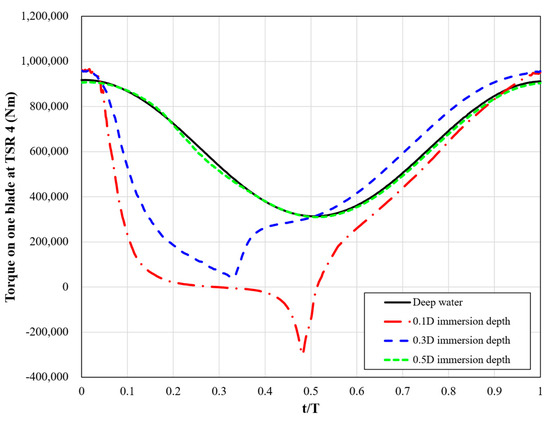
Figure 13.
Comparison of torque on single blade at different immersion depth.
Such instantaneous torque imbalances when tidal turbine blades are exposed above the free surface can cause maintenance and operational problems in actual tidal turbine operation. As mentioned in Section 4.1, the decrease in the thrust coefficient under free-surface exposure conditions could reduce the axial load on the tidal turbine. However, the structural stability of the blades can still be compromised because blades exposed above the free surface experience torque differences between the portions in contact with air and those in contact with water. In this context, Figure 14 presents the shear stress and dynamic pressure variation on a single blade with exposure above the free surface. As depicted in Figure 14, significant differences in both shear stress and dynamic pressure could be observed between the portions of the blade exposed to air and those that remained submerged. These results indicated that even though the axial load may be reduced, the imbalance in torque and force acting on individual blades can pose significant challenges for tidal turbine maintenance.

Figure 14.
Shear stress and dynamic pressure variation on single blade with exposure above free surface.
5. Conclusions
In this paper, a prediction model for tidal turbine performance under conditions where the turbine is exposed above the free surface was developed using CFD. This CFD model was validated through comparison with experimental data and verified through convergence tests of the CFD simulations. The reliability of the CFD simulations was ensured by these processes. The aim of this research was to quantitatively estimate the performance of tidal turbines under free-surface exposure conditions. Therefore, various scenarios were established according to different exposure areas and their performance was evaluated. Four scenarios were specifically investigated for tidal turbine exposure above the free surface, classified according to immersion depth: deep water, 0.5D immersion depth, 0.3D immersion depth, and 0.1D immersion depth. In the 0.5D immersion depth scenario, the blade tips of the tidal turbine are in contact with the free surface. In the 0.3D and 0.1D immersion depth scenarios, the exposure area of the tidal turbine above the free surface progressively increases as the immersion depth decreases. For all scenarios, quantitative performance comparisons of power and thrust coefficients were conducted against the baseline deep-water condition.
As a result, increasing the immersion depth of the tidal turbine reduced the exposure area to the free surface, and both power and thrust coefficients showed increasing trends as immersion depth increased. Furthermore, quantitative performance evaluation is presented in Table 6. For the power coefficient, the 0.1D immersion depth scenario, which had the greatest exposure, showed a maximum power efficiency reduction of 45.5% compared to deep-water conditions, while the smallest difference was observed in the 0.5D immersion depth scenario with only a 0.44% reduction. The thrust coefficient exhibited a similar pattern to the power coefficient, showing a maximum difference of 43.13% in the 0.1D immersion depth scenario and the smallest difference of 0.22% in the 0.5D immersion depth scenario. The reason for this variation in performance efficiency was demonstrated by the variation in torque components. The torque components were divided into two components: those due to pressure and those due to shear stress. Regarding the variation in torque induced by pressure, pressure torque showed a decreasing trend as the exposure area of the tidal turbine increased. Similar to pressure torque, torque due to shear stress also showed a decrease in magnitude. However, since pressure torque had a more dominant influence on the total torque, an overall decreasing effect was observed. Furthermore, reduction in the thrust coefficient can be explained by the reduction in axial force experienced on the tidal turbine. However, this reduction in dynamic load may not necessarily be interpreted as structural stabilization of the tidal turbine. In terms of torque acting on individual blades, when blades emerged above the free surface, torque and force imbalances developed between the submerged and exposed portions of the blade. This phenomenon can have detrimental effects on the blade’s structural integrity and presents a significant concern for maintenance operations.

Table 6.
Comprehensive performance evaluation of all scenarios based on free-surface exposure.
These quantitative estimations of free-surface exposure effects on tidal turbines can be expected to contribute to the prediction of power generation and evaluation of dynamic loads on tidal turbines from the perspective of tidal turbine operation and maintenance. However, in this research, waves generated by a single tidal turbine and the resulting pressure distribution were observed. In actual tidal turbine operations, multiple tidal turbines operate in arrays, and the interference effects between turbines were not considered in this study. This limitation will be addressed through future research.
Author Contributions
G.M.: Writing—Original Draft, Investigation, Formal Analysis, and Data Curation. W.C.: Writing—Review and Editing and Software. H.Y.: Writing—Review and Editing. Y.D.: Writing—Review and Editing. K.K.: Writing—Review and Editing. W.S.: Writing—Review and Editing. S.D.: Writing—Review and Editing. D.K.: Writing—Review and Editing. S.S.: Writing—Review and Editing, Supervision, Investigation, Funding Acquisition, and Conceptualisation. All authors have read and agreed to the published version of the manuscript.
Funding
The research presented in this study was supported by the KAIA Research program on the Development of Marine Bridges Operation using Green Energy, funded by the Ministry of Land, Infrastructure and Transport [Grant number: RS-2024-00401101].
Data Availability Statement
The original contributions presented in this study are included in the article. Further inquiries can be directed to the corresponding author.
Acknowledgments
Authors appreciate the support of the Inha University Research Grant.
Conflicts of Interest
The authors declare no conflict of interest.
Appendix A
Appendix A contains materials that can help readers understand the content presented in the main text.

Table A1.
Nomenclature.
Table A1.
Nomenclature.
| Symbols | Description | Unit |
|---|---|---|
| Swept area of the turbine | ||
| Power coefficient | ||
| Thrust coefficient | ||
| Turbine diameter | ||
| Blade radius of the turbine | ||
| r/R | Non-dimensional radius | |
| Rotational speed of the turbine | ||
| Density of fluid | ||
| Reynolds stress | ||
| Mean viscous tensor components | ||
| T | Period for one complete rotation | |
| TSR | Tip speed ratio | |
| Current velocity (inlet velocity) | ||
| Grid Convergence Index for fine mesh | % | |
| VOF | Volume of Fluid | |
| HRIC | High-Resolution Interface Capturing | |
| SIMPLE | Semi-Implicit Method for Pressure-Linked Equations | |
| MRF | Moving Reference Frame | |
| URANS | Unsteady Reynolds-Averaged Navier–Stokes |
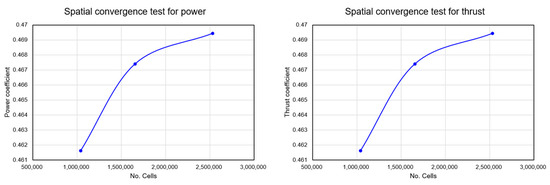
Figure A1.
Results of the grid convergence tests for model-scale simulations.
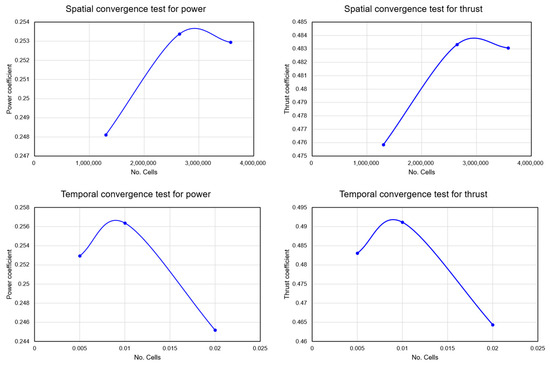
Figure A2.
Results of the grid convergence tests for full-scale simulations.
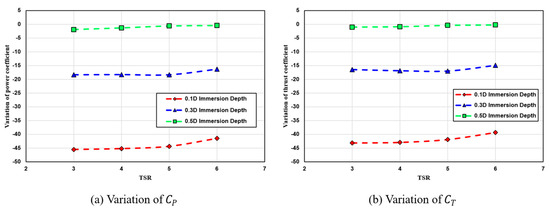
Figure A3.
Variation in power and thrust coefficient.
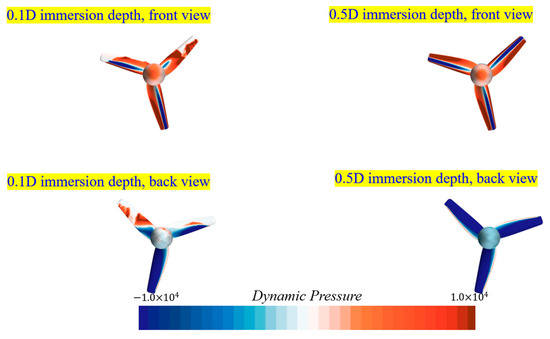
Figure A4.
Dynamic pressure distribution on different immersion depths.
References
- Zhang, J.; Moreau, L.; Machmoum, M.; Guillerm, P.E. State of the art in tidal current energy extracting technologies. In Proceedings of the 2014 First International Conference on Green Energy ICGE 2014, Sfax, Tunisia, 25–27 March 2014. [Google Scholar]
- Lewis, M.; Murray, R.O.; Fredriksson, S.; Maskell, J.; de Fockert, A.; Neill, S.P.; Robins, P.E. A standardised tidal-stream power curve, optimised for the global resource. Renew. Energy 2021, 170, 1308–1323. [Google Scholar] [CrossRef]
- Gaurier, B.; Carlier, C.; Germain, G.; Pinon, G.; Rivoalen, E. Three tidal turbines in interaction: An experimental study of turbulence intensity effects on wakes and turbine performance. Renew. Energy 2020, 148, 1150–1164. [Google Scholar] [CrossRef]
- Zhang, Y.; Peng, B.; Zheng, J.; Zheng, Y.; Tang, Q.; Liu, Z.; Xu, J.; Wang, Y.; Fernandez-Rodriguez, E. The impact of yaw motion on the wake interaction of adjacent floating tidal stream turbines under free surface condition. Energy 2023, 283, 129071. [Google Scholar] [CrossRef]
- Bahaj, A.S.; Molland, A.F.; Chaplin, J.R.; Batten, W.M.J. Power and thrust measurements of marine current turbines under various hydrodynamic flow conditions in a cavitation tunnel and a towing tank. Renew. Energy 2007, 32, 407–426. [Google Scholar] [CrossRef]
- Wang, D.; Atlar, M.; Sampson, R. An experimental investigation on cavitation, noise, and slipstream characteristics of ocean stream turbines. Proc. Inst. Mech. Eng. Part A J. Power Energy 2007, 221, 219–231. [Google Scholar] [CrossRef]
- Koh, W.; Ng, E. A CFD study on the performance of a tidal turbine under various flow and blockage conditions. Renew. Energy 2017, 107, 124–137. [Google Scholar] [CrossRef]
- Apsley, D.D. CFD simulation of tidal-stream turbines in a compact array. Renew. Energy 2024, 224, 120133. [Google Scholar] [CrossRef]
- Nuernberg, M.; Tao, L. Three dimensional tidal turbine array simulations using OpenFOAM with dynamic mesh. Ocean. Eng. 2018, 147, 629–646. [Google Scholar] [CrossRef]
- Harrison, M.; Batten, W.; Myers, L.; Bahaj, A. Comparison between CFD simulations and experiments for predicting the far wake of horizontal axis tidal turbines. IET Renew. Power Gener. 2010, 4, 613–627. [Google Scholar] [CrossRef]
- Gebreslassie, M.G.; Tabor, G.R.; Belmont, M.R. Investigation of the performance of a staggered configuration of tidal turbines using CFD. Renew. Energy 2015, 80, 690–698. [Google Scholar] [CrossRef]
- Jeffcoate, P.; Salvatore, F.; Boake, C.; Elsaesser, B.; Vallerano, V. Effect of submergence on tidal turbine performance. In Proceedings of the 11th European Wave and Tidal Energy Conference, Nantes, France, 6–11 September 2015. [Google Scholar]
- Yan, J.; Deng, X.; Korobenko, A.; Bazilevs, Y. Free-surface flow modeling and simulation of horizontal-axis tidal-stream turbines. Comput. Fluids 2017, 158, 157–166. [Google Scholar] [CrossRef]
- Ferziger, J.H.; Perić, M.; Street, R.L. Computational Methods for Fluid Dynamics; Springer: Berlin/Heidelberg, Germany, 2019. [Google Scholar]
- Shi, W.; Rosli, R.; Atlar, M.; Norman, R.; Wang, D.; Yang, W. Hydrodynamic performance evaluation of a tidal turbine with leading-edge tubercles. Ocean. Eng. 2016, 117, 246–253. [Google Scholar] [CrossRef]
- Song, S.; Demirel, Y.K.; Atlar, M.; Shi, W. Prediction of the fouling penalty on the tidal turbine performance and development of its mitigation measures. Appl. Energy 2020, 276, 115498. [Google Scholar] [CrossRef]
- Machado, L.d.V.; Fernandes, A.C. Proposals to Improve Load and Cavitation Computational Fluid Dynamics Analysis with Moving Reference Frame of a Conventional Propeller. J. Offshore Mech. Arct. Eng. 2021, 143, 021901. [Google Scholar] [CrossRef]
- Celik, I.B.; Ghia, U.; Roache, P.J.; Freitas, C.J.; Coleman, H.; Raad, P.E. Procedure for estimation and reporting of uncertainty due to discretization in CFD applications. J. Fluids Eng.-Trans. ASME 2008, 130, 078001. [Google Scholar]
Disclaimer/Publisher’s Note: The statements, opinions and data contained in all publications are solely those of the individual author(s) and contributor(s) and not of MDPI and/or the editor(s). MDPI and/or the editor(s) disclaim responsibility for any injury to people or property resulting from any ideas, methods, instructions or products referred to in the content. |
© 2025 by the authors. Licensee MDPI, Basel, Switzerland. This article is an open access article distributed under the terms and conditions of the Creative Commons Attribution (CC BY) license (https://creativecommons.org/licenses/by/4.0/).