Article

Coarse and Fine-Grained Sediment Magnetic Properties from Upstream to Downstream in Jiulong River, Southeastern China and Their Environmental Implications

1
Fujian Provincial Key Laboratory of Marine Physical and Geological Processes, Xiamen 361005, China
2
School of Geography, South China Normal University, 55 Zhongshan Road West, Tianhe District, Guangzhou 510631, China
3
School of Geography, Lingnan Normal University, 29 Cunjin Road, Chikan Area, Zhanjiang 524048, China
4
Centro de Investigaciones en Física e Ingeniería del Centro de la Provincia de Buenos Aires (CIFICEN, CONICET-UNCPBA), Pinto 399, Tandil 7000, Argentina
*
Authors to whom correspondence should be addressed.
J. Mar. Sci. Eng. 2025, 13(8), 1502; https://doi.org/10.3390/jmse13081502
Submission received: 23 May 2025 / Revised: 29 July 2025 / Accepted: 30 July 2025 / Published: 5 August 2025
(This article belongs to the Section Marine Environmental Science)

Abstract

Magnetic parameters of river sediments are commonly used as end-members for source tracing in the coasts and shelves. The eastern continental shelf area of China, with multiple sources of input, is a key region for discussing sediment sources. However, magnetic parameters are influenced by grain size, and the nature of this influence remains unclear. In this study, the Jiulong River was selected as a case to analyze the magnetic parameters and mineral characteristics for both the coarse (>63 μm) and fine-grained (<63 μm) fractions. Results show that the magnetic minerals mainly contain detrital-sourced magnetite and hematite. In the North River, a tributary of the Jiulong River, the content of coarse-grained magnetic minerals increases from upstream to downstream, contrary to fine-grained magnetic minerals, suggesting the influence of hydrodynamic forces. Some samples with abnormally high magnetic susceptibility may result from the combined influence of the parent rock and human activities. In the scatter diagrams of magnetic parameters for provenance tracing, samples of the <63 μm fractions have a more concentrated distribution than that of the >63 μm fractions. Hence, magnetic parameters for the <63 μm fraction are more useful in provenance identification.

1. Introduction

Rivers play a crucial role in shaping surface morphology and are essential for transporting weathered material from the land to the sea [1,2]. In recent decades, the global systems of river sediment generation, transportation, and deposition have undergone significant changes, largely influenced by human activities [3]. Therefore, efficient and timely monitoring and a comprehensive understanding of river sediment characteristics are crucial for effective river management and ecological conservation. River sediment feature is the basis for understanding the evolution of the surface environment. Commonly used sediment features include mineral compositions, grain size, and geochemical compositions. Among those sediment features, magnetic minerals are widely distributed and can be rapidly and sensitively detected by magnetic parameters, e.g., magnetic susceptibility [4]. Hence, the environmental magnetic methods have been widely used in river sediment source-to-sink process studies [5,6,7,8,9,10].
In southeastern China, which has dense river networks and wide continental shelves, sediment magnetism was widely used in environmental changes, especially provenance studies in coasts and shelves. First, due to the differences in sediment magnetic parameters, provenances in the material-mixed estuaries and continental shelves were discriminated by comparing magnetic features [11,12,13,14]. Second, the correlations between magnetic parameters and heavy metal contents were found, making magnetic tests a rapid approach to heavy metal monitoring [15,16,17,18,19]. Thirdly, magnetic parameters served to categorize the sedimentary sub-environment in the Jiulong River estuary [20]. Nevertheless, an increasing number of studies have revealed that the sediment properties of this river region demonstrate seasonal heterogeneity [21] as well as spatial variability [22]. However, it is unclear whether more detailed magnetic properties should be investigated in the southeastern China rivers.
A large difference was found in mineral composition between coarse-grained and fine-grained components in the southeastern China river sediments [23]. From upstream down to the river mouth, the proportion of ferrimagnetic minerals increases consistently, and the magnetite becomes finer-grained due to hydrological sorting [22,24]. However, whether the different grain-size related minerals affect magnetic properties is less understood in southeastern China rivers, though particle size-fractionated magnetism studies were widely conducted in other regions [14,25,26,27,28]. It is urgent to compare the sediment magnetism between the fine-grained and coarse-grained fractions from upstream to downstream, thereby revealing the magnetic properties in response to the river environment.
In the present study, the Jiulong River was selected as an example to reveal the sediment magnetism in the regional rivers. A total of 15 samples were sieved into <63 μm and >63 μm components for magnetic parameter and rock magnetism determinations. The study objectives include: (a) determine detailed properties of magnetic minerals of the two fractions; (b) determine the spatial distribution of magnetic minerals; and (c) analyze the magnetic properties in response to the river environment. As the Jiulong River is a typical subtropical mountain river, the research will enhance the understanding of the grain-size-driven magnetic characteristics in estuaries supplied by similar rivers. In addition, this study will promote the application of magnetic methods in provenance studies.

2. Materials and Methods

2.1. Regional Settings

The Jiulong River is the second-largest in Fujian Province, southeastern China (Figure 1). The main channel of the Jiulong River has a length of 285 km and a total basin area of 14,241 km2, and the annual average river discharge is 1.47 × 10¹⁰ m3/yr. The river consists of three main branches of the North, West, and South Rivers, flowing into Xiamen Bay and further into the Taiwan Strait. The North River is the mainstream, with a length of 272 km and a basin area of 9640 km2 [29]. Regarding geological background, the Jiulong River is located in the Mesozoic metamorphic belt of the southeast coast. The Mesozoic volcanic rocks in eastern Fujian, especially the granular porphyroblastic lava, the Yanshanian granite and the geological structure characteristics in this area have attracted the attention of the domestic and foreign geological circles [30,31,32].
The basin is situated within the subtropical monsoon climate zone, which is known for its distinct seasonal patterns, with hot, humid summers and mild, drier winters. The basin benefits from the rich heat resources, with average annual temperatures between 13 and 20 °C and annual precipitation typically exceeding 800 mm, peaking in the summer months. In the city at Jiulong River estuary, the average annual temperature was 23 °C in 2021, with the annual precipitation reaching approximately 1400 mm. The flow rate of the upper reaches of the North River is relatively fast; the river valley in the middle and lower reaches gradually opens up, the river bank gradually becomes lower, and the accumulation of the river gradually strengthens, then the estuary section flows through the Zhangzhou Plain. The average annual runoff into the sea of the North River is 8.27 × 10⁹ m3, and the average annual sediment content is 0.206 kg/m3. The average annual runoff into the sea of the West River is 3.70 × 10⁹ m3, and the average annual sediment content is 0.210 kg/m3 [33]. The South River has a total length of about 88 km and a total basin area of about 660 km2; the upper reaches (Zhangpu Section) are about 34.2 km, and the lower reaches (Longhai Section) are about 53.8 km [34].

2.2. Sample Acquisition

Fifteen sediment samples were collected from the riverbed by a stainless steel grab from the Jiulong River in July 2023. The river is segmented into 5 parts [35], and the samples FJ-01, FJ-02, FJ-03, FJ-04 and FJ-05 are located in the upper reaches of the North River, FJ-06, FJ-07 and FJ-08 are located in the middle reaches of the North River, FJ-09 is located in the lower reaches of the North River, FJ-15, FJ-14, FJ-13 and FJ-10 are located in the West River. FJ-12 and FJ-11 are located in the South River (Figure 1). Notably, the sampling targeted a snapshot of spatial trends under baseflow conditions, and thus does not resolve temporal (seasonal) dynamics.

2.3. Magnetic Tests

Based on the previous experience of particle size classification [36], the samples were separated into two parts by sieving, that is, the >63 μm and <63 μm components. Each sample was dried and packed into a 2 × 2 × 2 cm3 plastic cube for magnetic parameter tests (Table 1). The volume of low-frequency (κlf, lf = 976 Hz) and high-frequency (κhf, hf = 15,616 Hz) magnetic susceptibility was determined using the AGICO Kappabridge MFK1-FA, a device known for its precision in measuring magnetic properties of rock and sediment samples. Mass magnetic susceptibilities (χlf and χhf) were then obtained as κlf and κhf divided by the sample density. Frequency-dependent magnetic susceptibility (χfd%) was calculated from χfd% = [(χlf − χhf)/χlf] × 100. Anhysteretic remanent magnetization (ARM), saturation isothermal remanent magnetization (SIRM = IRM2000mT), and isothermal remanent magnetizations at −100 and −300mT (IRM−100mT, IRM−300mT) were continuously measured by a JR-6 Spinner Magnetometer (AGICO). “Hard” isothermal remanent magnetization (HIRM) and L-ratio were computed using the formulas HIRM = (SIRM + IRM−300mT)/2 and L-ratio = (SIRM + IRM−300mT)/(SIRM + IRM−100mT).
Rock magnetic tests were performed for representative samples. The temperature dependence of the magnetic susceptibility (κ-T) curve for 3 samples was measured using a Kappabridge MFK1-FA with a high-temperature module (CS4) to explore the magnetic mineral characteristics during heating and cooling runs. To understand the magnetic hysteresis characteristics of samples and determine the source of magnetic minerals, the magnetic hysteresis loop, IRM acquisition curve, reverse demagnetization curve, and first-order reversed curve (FORC) for some sediment samples were measured with the LakeShore 8604 vibrating sample magnetometer (VSM). Then, parameters, including the coercive force (Bc), the remanent coercivity (Bcr), the remanent saturation magnetization (Mrs), and the saturation magnetization (Ms), were calculated.
All magnetic measurements were performed at the Laboratory of Environmental Magnetism, South China Normal University.

3. Results and Discussion

3.1. Species and Features of Magnetic Minerals

3.1.1. κ-T Curve

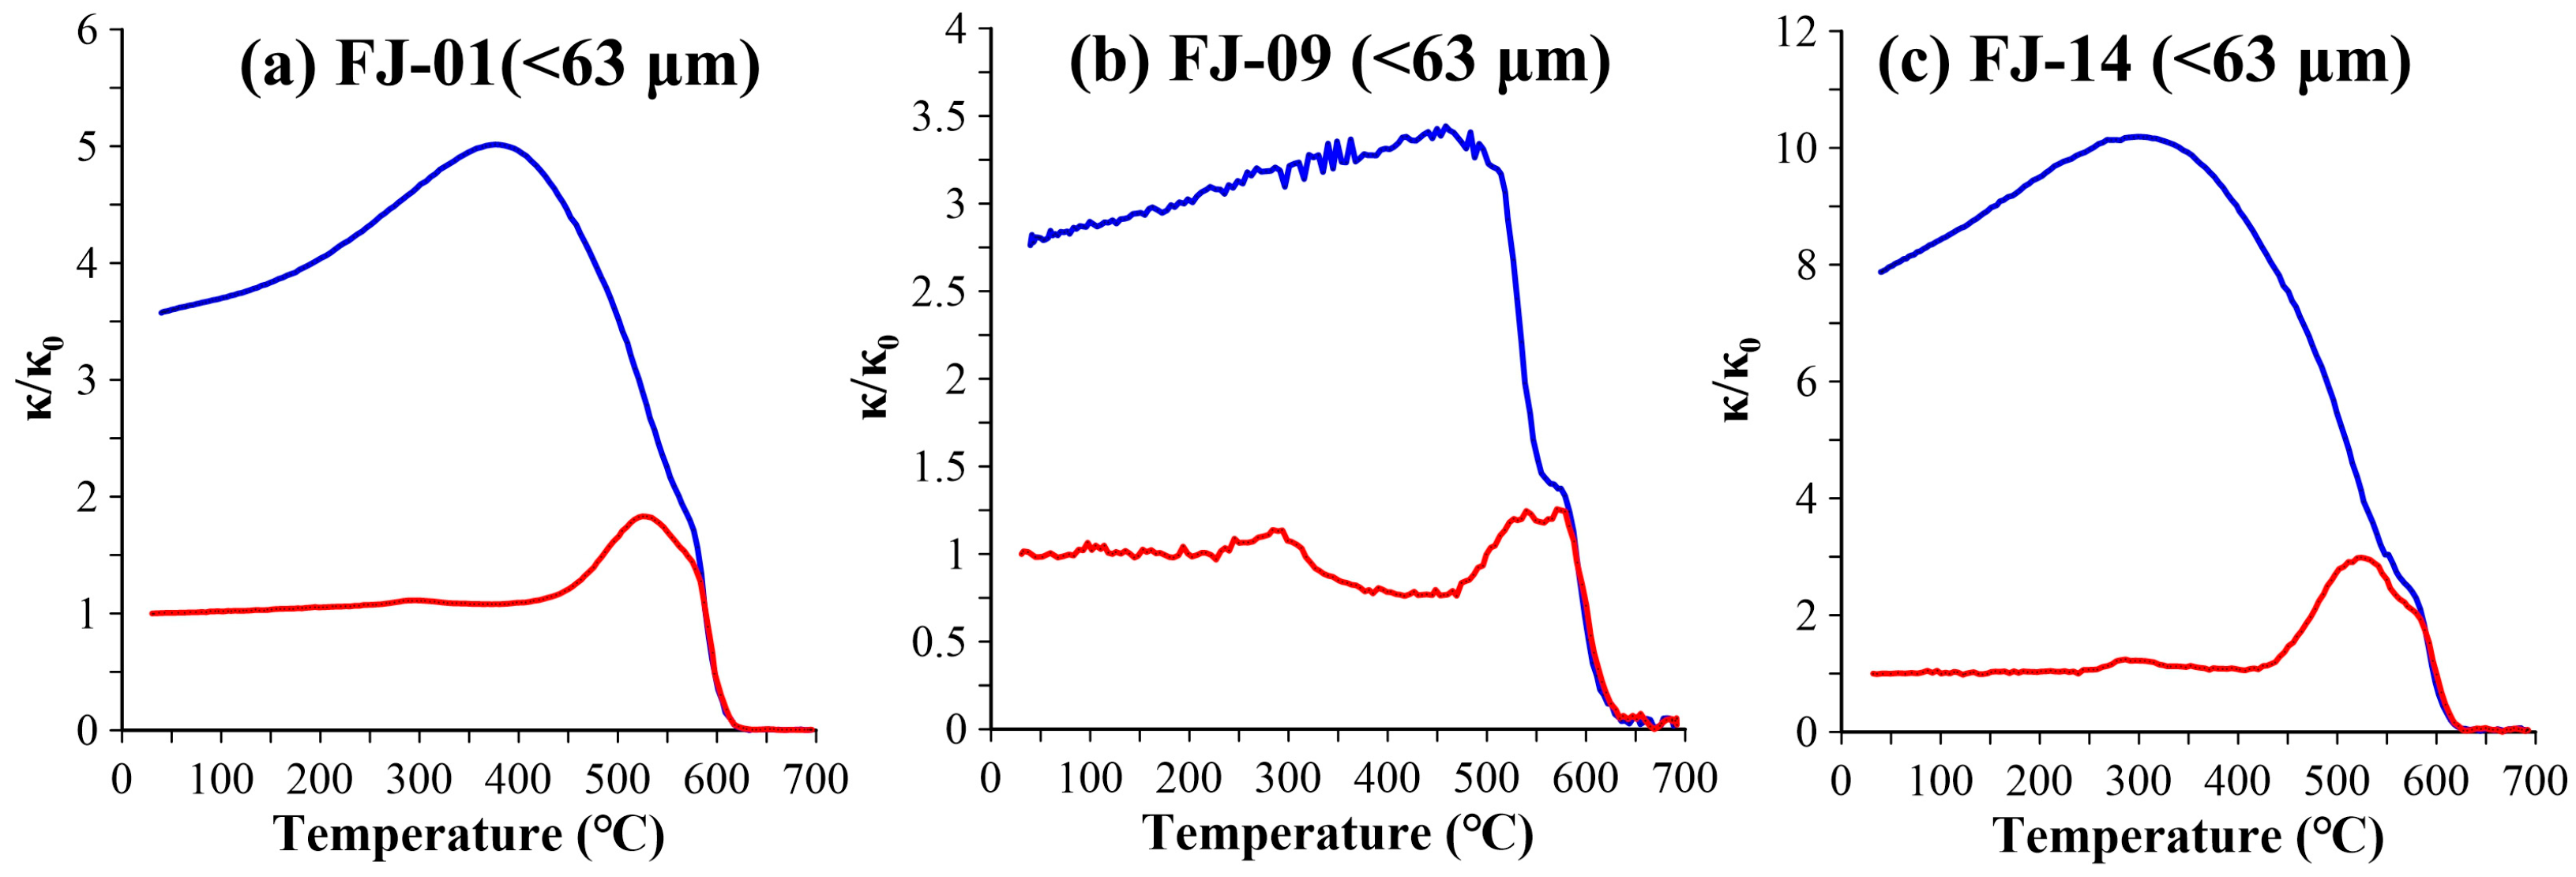
Generally, the κ of different magnetic minerals has different characteristics with temperature changes. These features were used to identify magnetic minerals. As the temperature approaches the Curie temperature (Tc), ferrimagnetic minerals often exhibit an increase in κ and then a decrease to 0 at the Tc, a phenomenon called the Hopkinson effect. The Curie temperature of magnetite is high (580 °C) [37], the mineral composition does not change during the heating process, and its κ-T curve is reversible. A more pronounced Hopkinson peak is usually observed below its Tc [38].
The κ-T heating runs of all magnetic samples exhibit a significant κ decrease near 580 °C, with the κ approaching zero at 600 °C (Figure 2). This behavior is consistent with the magnetic phase transition observed in ferrimagnetic materials, where the magnetic properties are known to change with temperature, as evidenced by similar patterns in κ-T curves used to identify magnetic mineral types. Sample FJ-09 (<63 μm) exhibited another leveling temperature of around 675 °C, corresponding to a high-coercivity mineral such as hematite, while other samples stabilized at 600 °C, suggesting the thermal stability characteristics of magnetite within these samples (Figure 2b). The cooling runs of the samples were located above the heating runs, indicating that the heating process resulted in the conversion of some weak magnetic minerals into strong magnetic minerals. Sample FJ-09 (<63 μm) was heated to 400 °C to reach a trough value, and then the κ increased rapidly and peaked after 500 °C, probably because the decomposition of paramagnetic minerals produced new ferromagnetic minerals (Figure 2b).
For FJ-14 (<63 μm), there is a small peak after heating to about 300 °C, then it falls back again. This small increase in κ may be from transforming certain iron sulfide minerals into greigite [39]. As heating persists, the κ diminishes as they decompose, forming pyrrohotite and sulfur vapor [40]. Another possibility is that the sample may contain lepidocrocite (γ-FeOOH), noted for its low thermal stability. Upon reaching temperatures of 250–350 °C, it undergoes dehydration and transforms into maghemite, and thus, the κ gradually increases [41]. After the continued heating, substable and ferromagnetic maghemite can be converted into hematite with weak magnetic properties when heated [42] (Figure 2c).
Based on the observed κ-T curve characteristics, which are indicative of magnetic phase transitions at temperatures around 580 °C, it is suggested that magnetite is the predominant magnetic mineral. Some samples may have a small amount of iron sulfide mineral, lepidocrocite and hematite, so further judgment should be made by mineralogical analysis.

3.1.2. Magnetic Hysteresis Loops

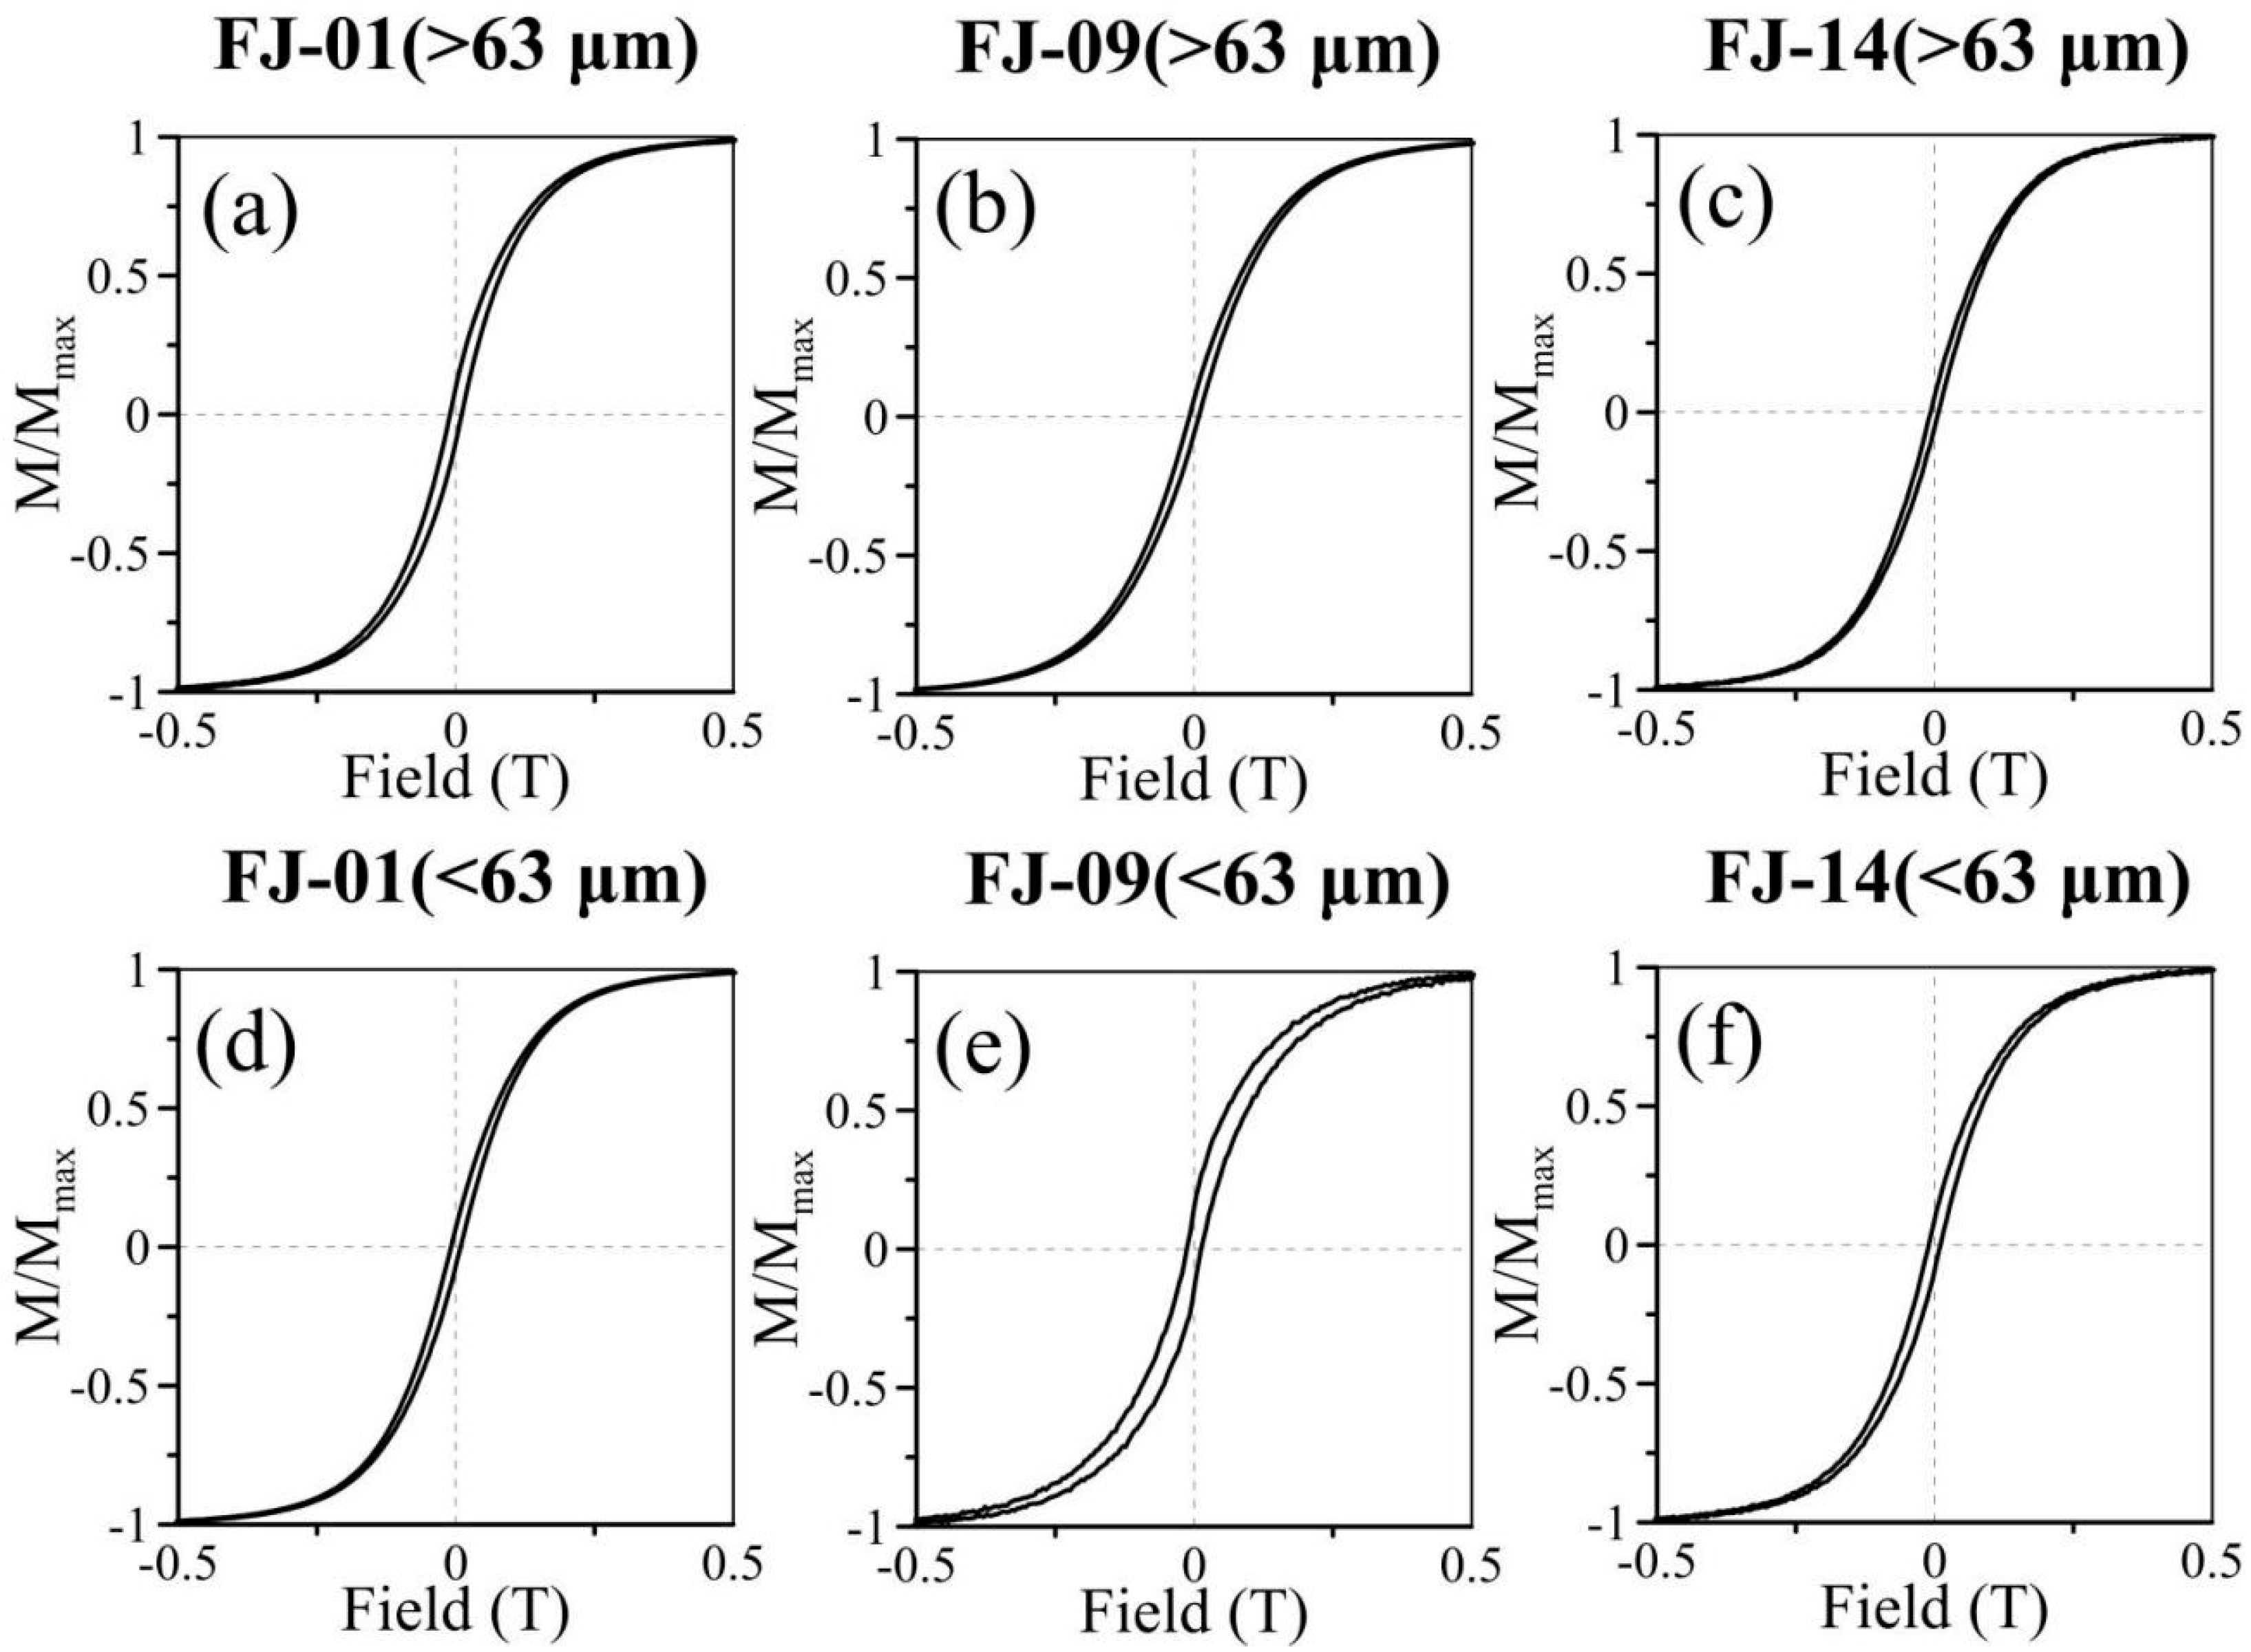
The magnetic hysteresis loops of all samples exhibit a high, narrow, and steep profile (Figure 3), suggesting that the magnetic minerals predominantly consist of pseudo-single domain (PSD) magnetite. This fact is consistent with the characteristics of high-coercivity minerals, which typically have hysteresis loops that are wide and fat with high coercivity, as described in Reference 1. The Mrs/Ms ratio of the three >63 μm fraction samples was approximately 0.06–0.10, with Bc values ranging from 7.0 to 10.5 mT and Bcr values from 36 to 41 mT. The Mrs/Ms of the three <63 μm fraction samples were about 0.07–0.15, Bc about 8.6–13.0 mT and Bcr about 38.5–60.4 mT. The hysteresis parameters of the <63 μm fraction samples are higher than those of the >63 μm fraction samples. The hysteresis loop of the coarse sample of FJ-01 had a thicker “waist” than the fine one, with a larger Bc (about 10.5 mT) and a smaller Bcr (about 36.3 mT). The hysteresis loop of the coarse samples of FJ-09 and FJ-14 had a thinner “waist” than the fine samples, with a smaller Bc (about 8.5 and 7.0 mT, respectively) and a smaller Bcr (about 41.0 and 39.1 mT, respectively).

3.1.3. FORC Diagrams

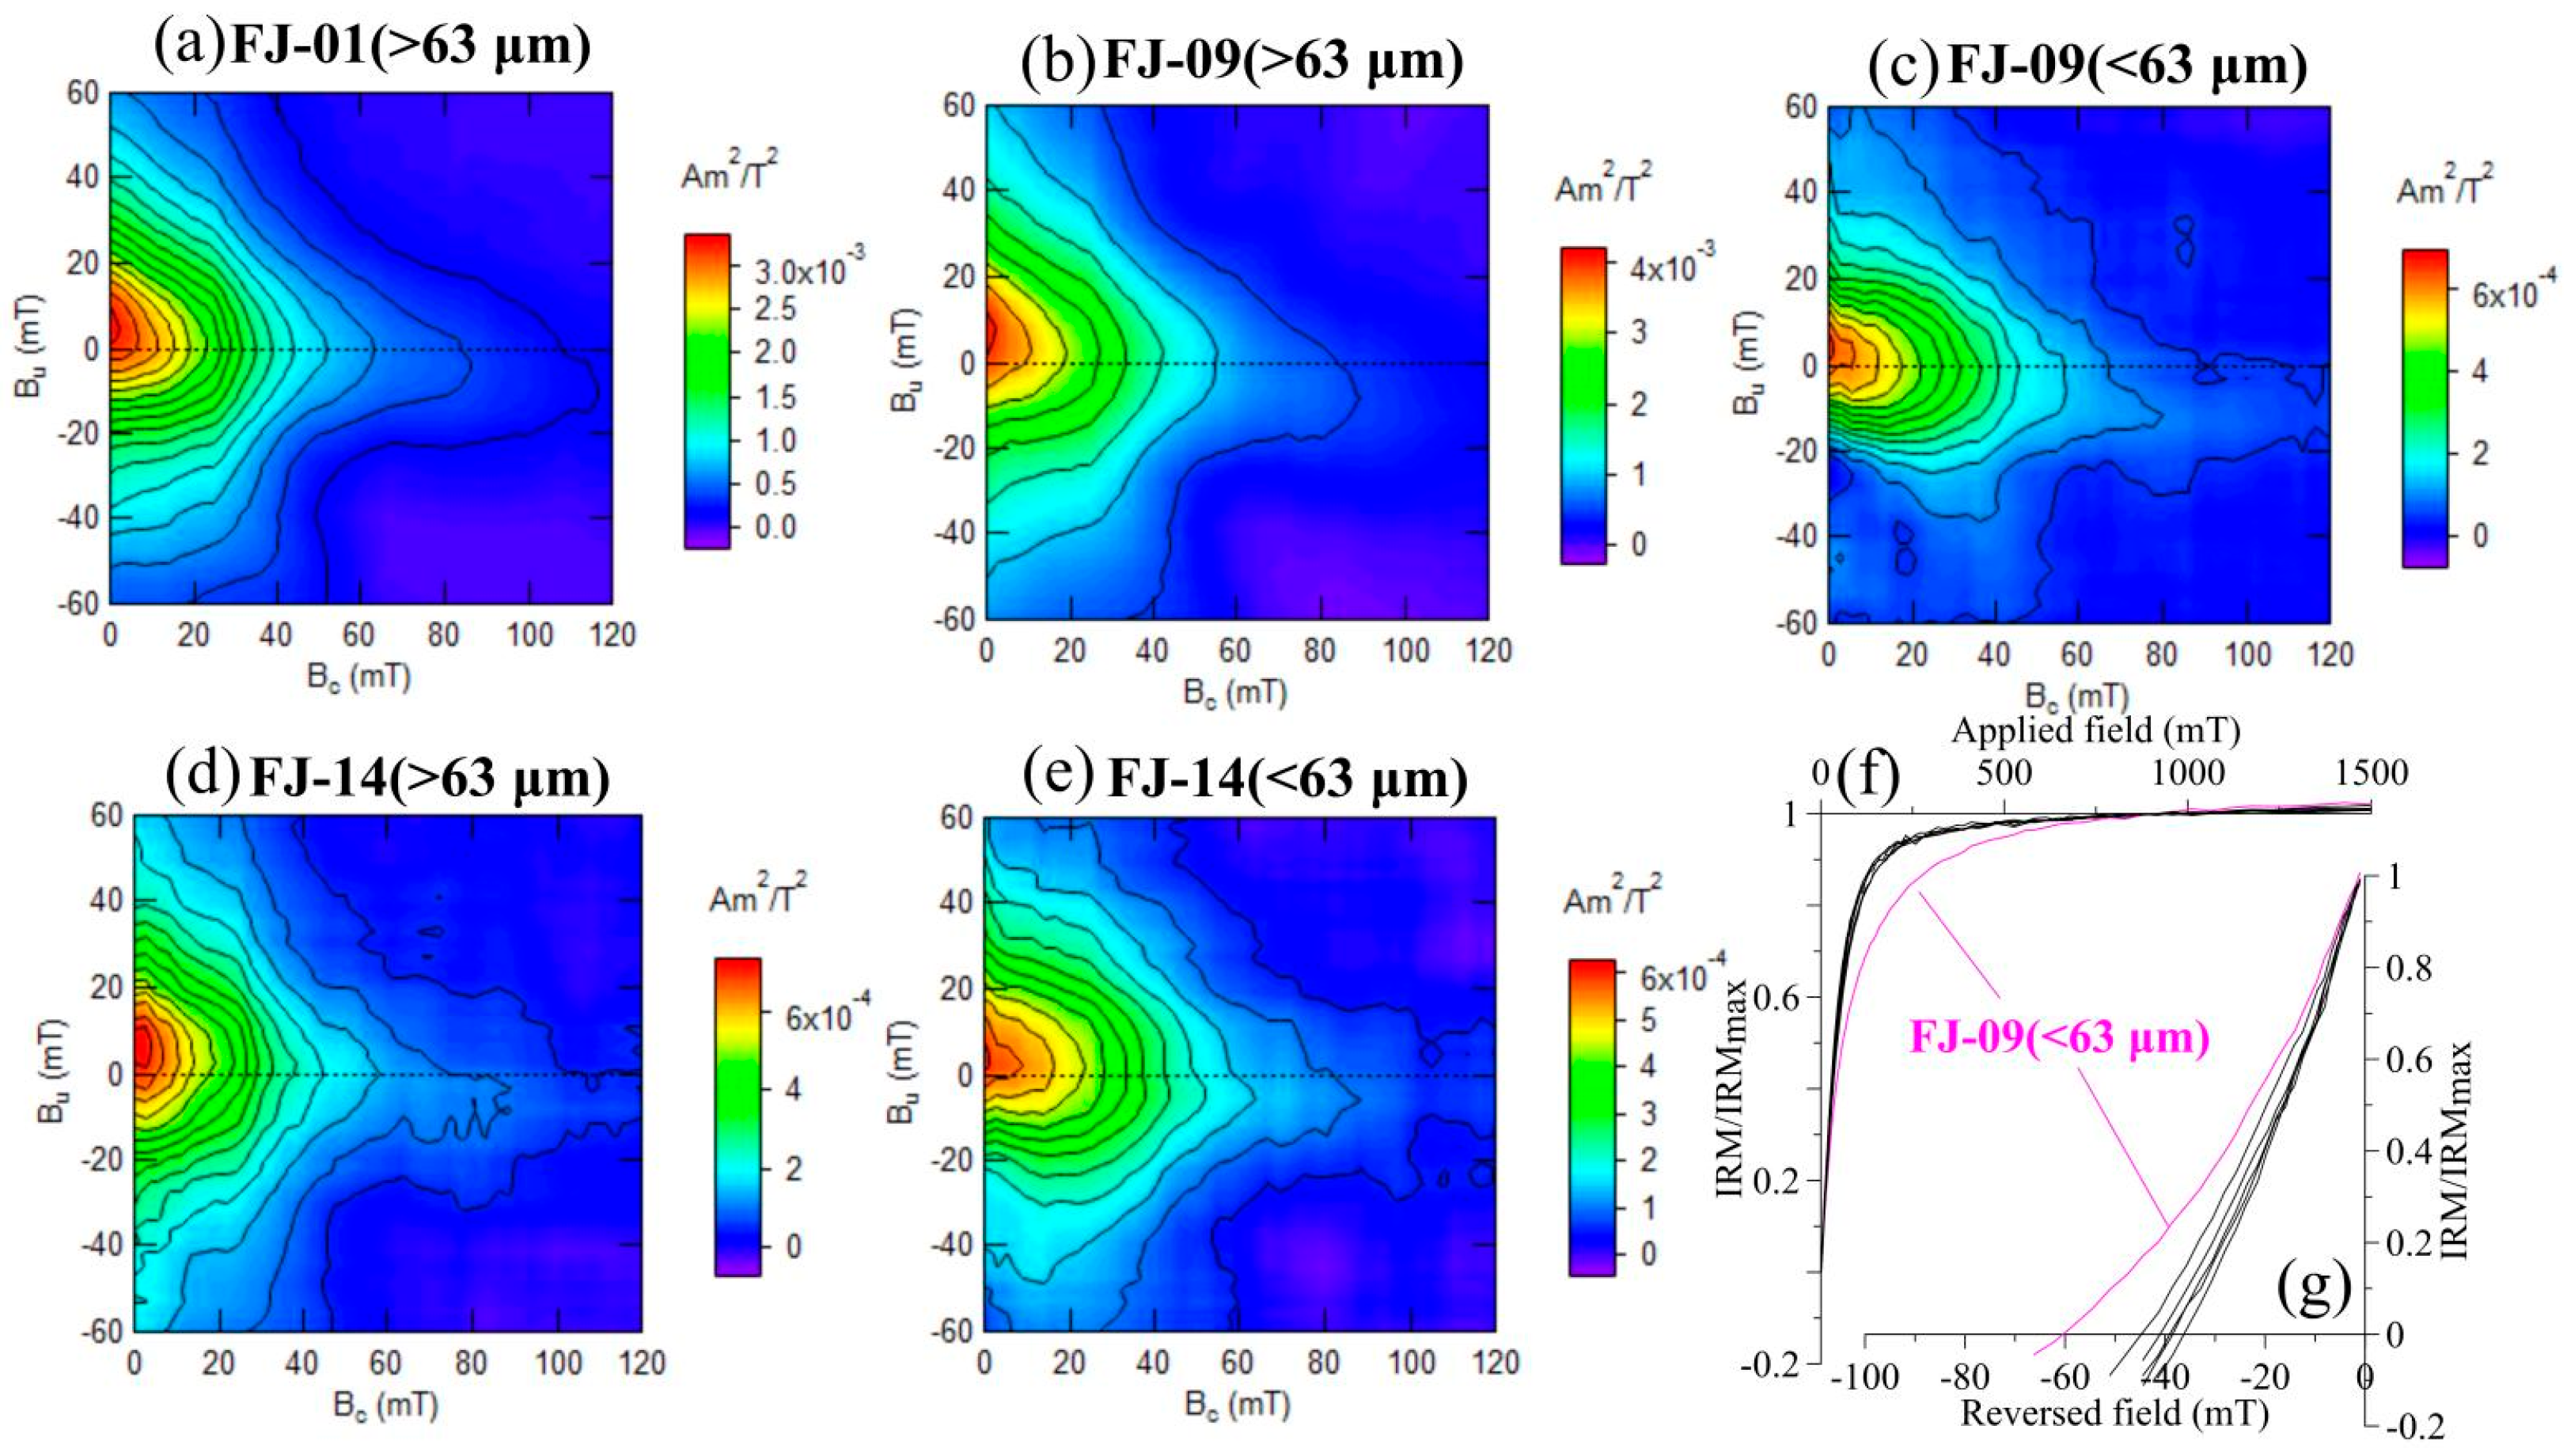
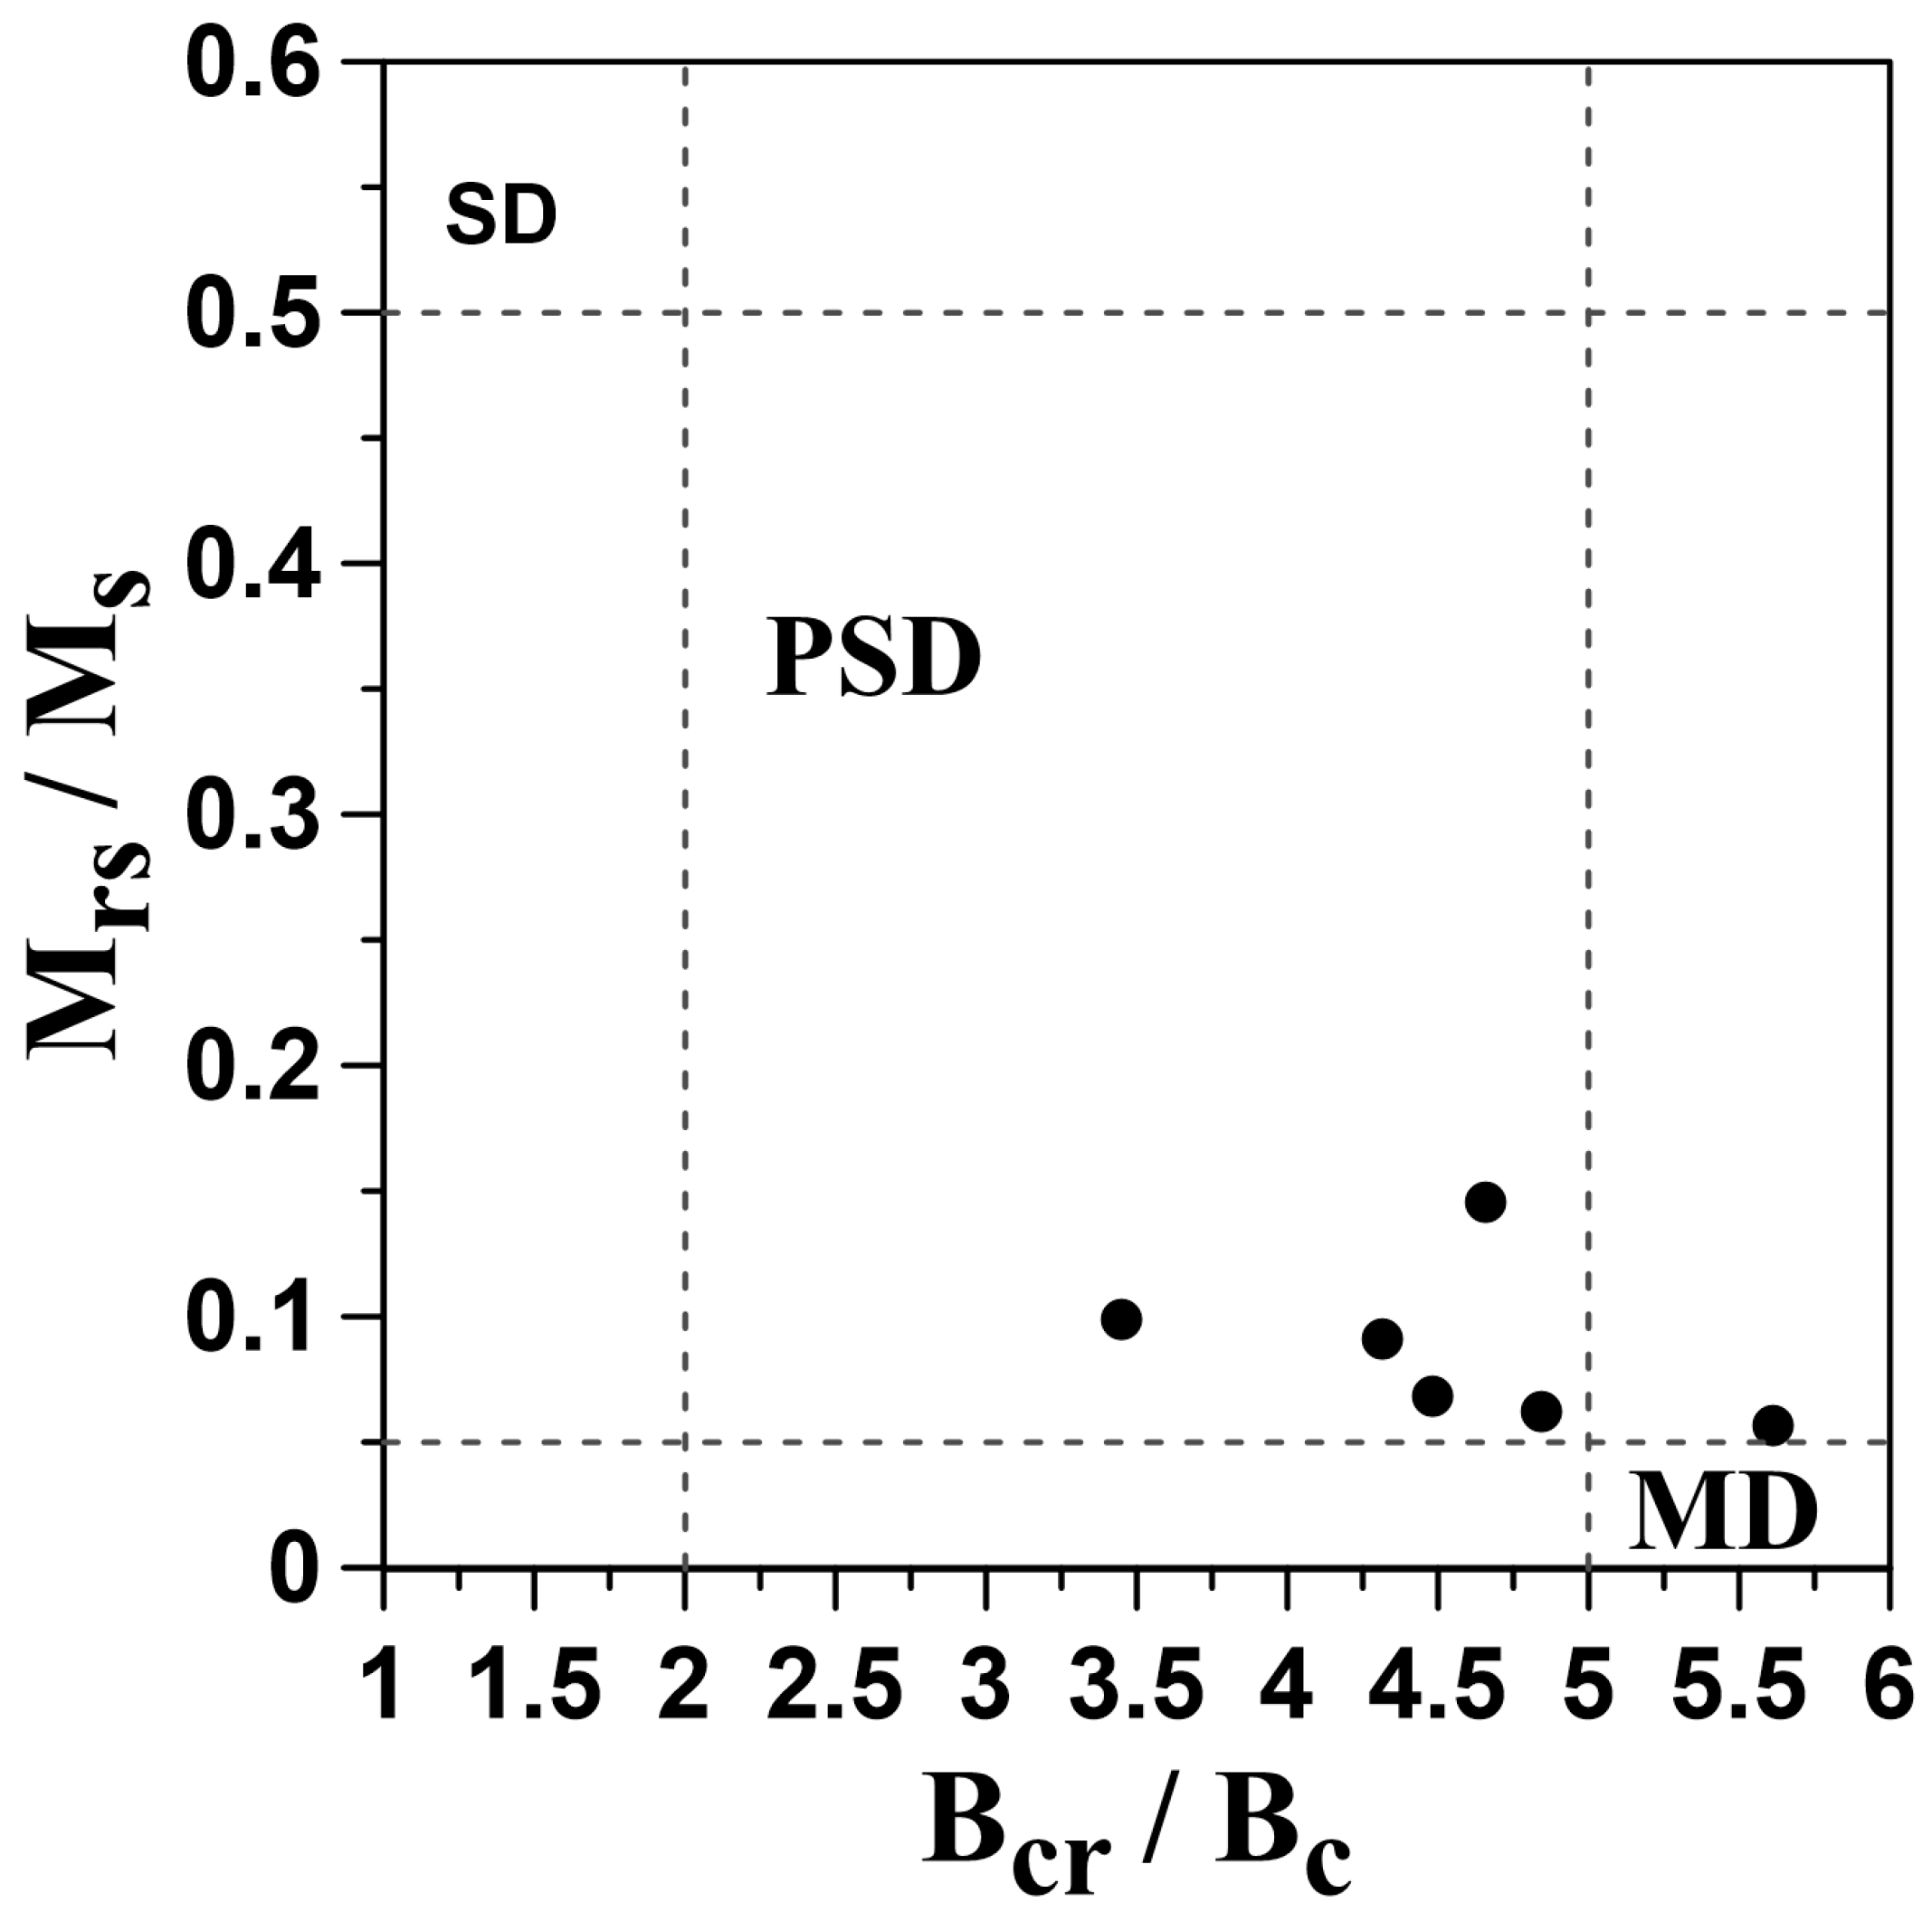
The FORC diagrams of all samples reflect a certain degree of magnetic interaction (Figure 4a–e), exhibiting a coercive force that is neither high nor zero, consistent with the characteristics of the PSD particles and consistent with the results of the Day diagram (Figure 5). The FORC diagram for sample FJ-09 (<63 μm) appears relatively ‘flat’ (Figure 4c), that is, extending more along the horizontal axis, reflecting weak magnetic interaction, indicating that it may contain hematite or goethite. The FORC characteristics are consistent with detrital magnetic minerals [43].

3.1.4. IRM Acquisition Curve

The IRM of sample FJ-09 (<63 μm) reaches 80% of the saturation value at about 200 mT, while the Bcr ≈ 60 mT (Figure 4f). In contrast, the other samples reached 80% of the IRM saturation value at about 90–108 mT, and Bcr values were 36–45 mT (Figure 4f). Therefore, most samples exhibit low coercivity, while the FJ-09 sample (<63 μm) possesses a higher content of high-coercivity magnetic minerals.
In summary, the Jiulong River samples show that PSD magnetite is the primary magnetic carrier, characterized by typical debris magnetic particles. Compared to the other samples, in sample FJ-09 (<63 μm), the presence of magnetic minerals with elevated coercivity and minimal magnetic interaction suggests a relatively high hematite content, as these characteristics indicate materials with higher coercivity.

3.2. Spatial Variations in Magnetic Parameters

3.2.1. HIRM Usability

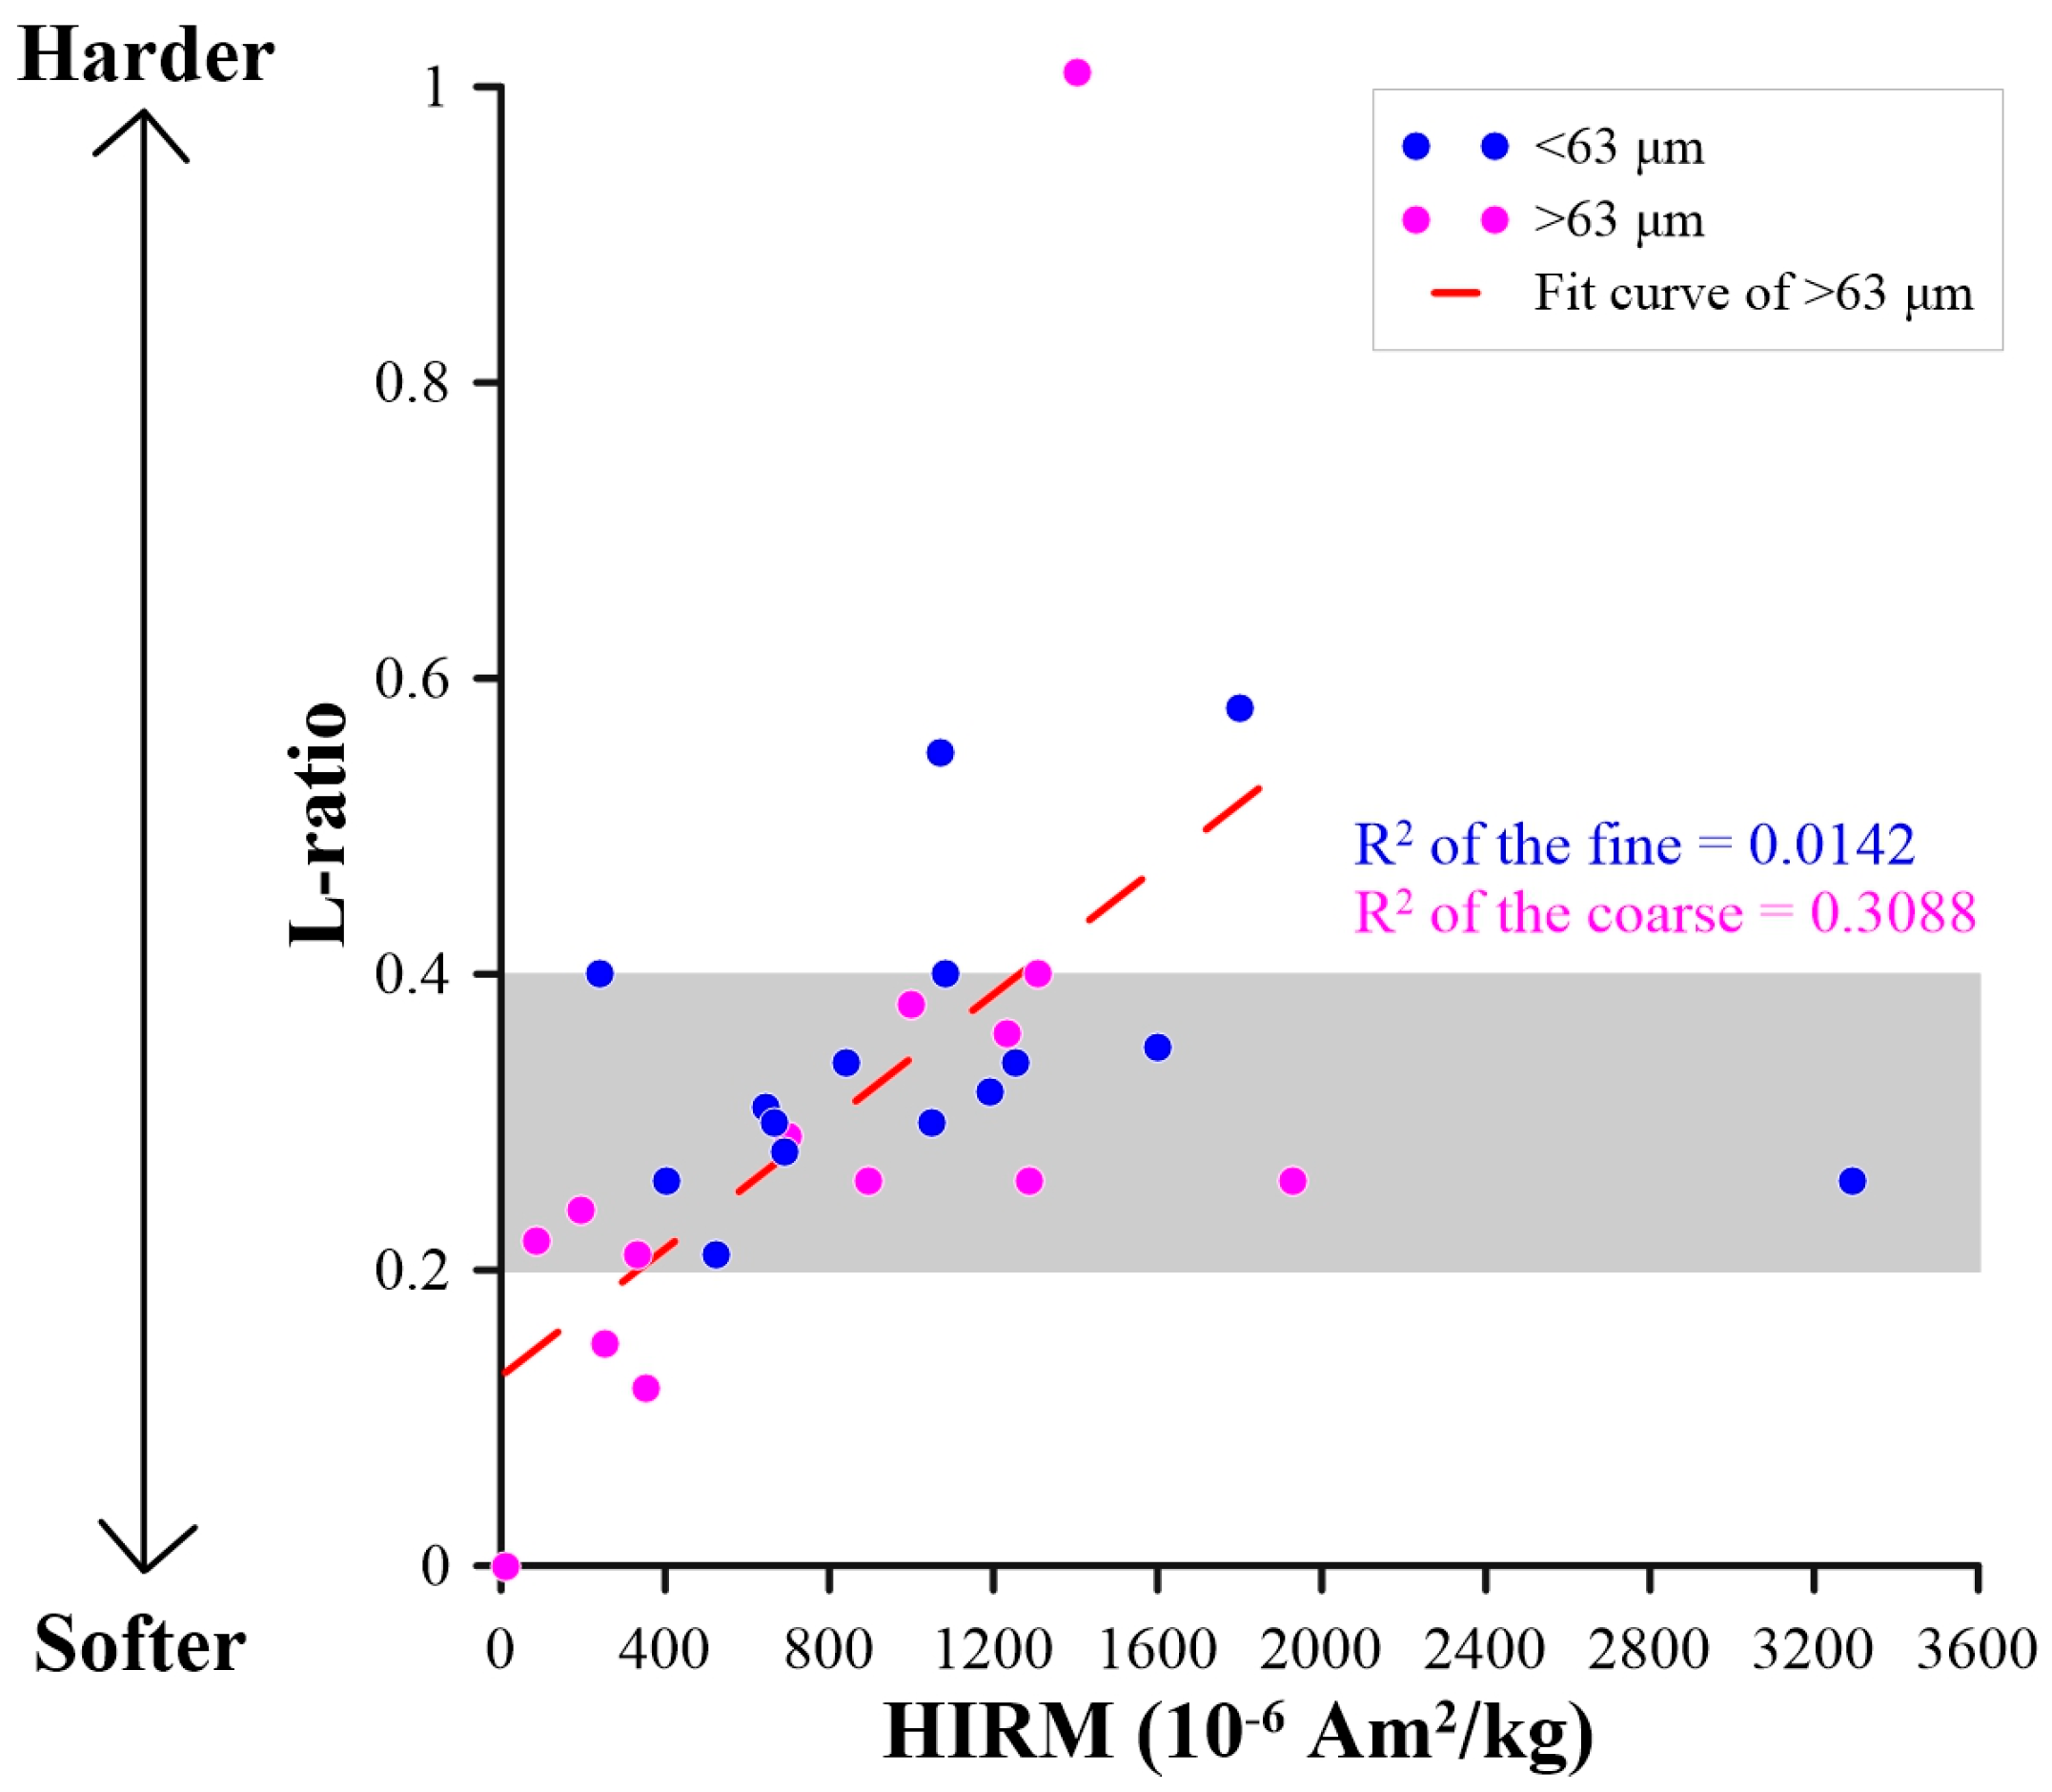
In order to determine whether HIRM is affected by the source of magnetic minerals or can accurately indicate the content of high-coercivity magnetic minerals, the L-ratio was proposed (Liu et al., 2007). No significant correlation is observed between L-ratio and HIRM in the <63 μm fractions with the correlation coefficient r = 0.12, p = 0.67 (Figure 6). However, for fractions >63 μm, significant correlation is observed at the 0.05 level, with the correlation coefficient r = 0.56, p = 0.03–0.04 (Figure 6). Therefore, the S−300 of the <63 μm samples represents the relative content of high-coercivity magnetic minerals (Figure 6), and the HIRM represents the content of high-coercivity magnetic minerals (e.g., hematite) [45,46].

3.2.2. Overall Features

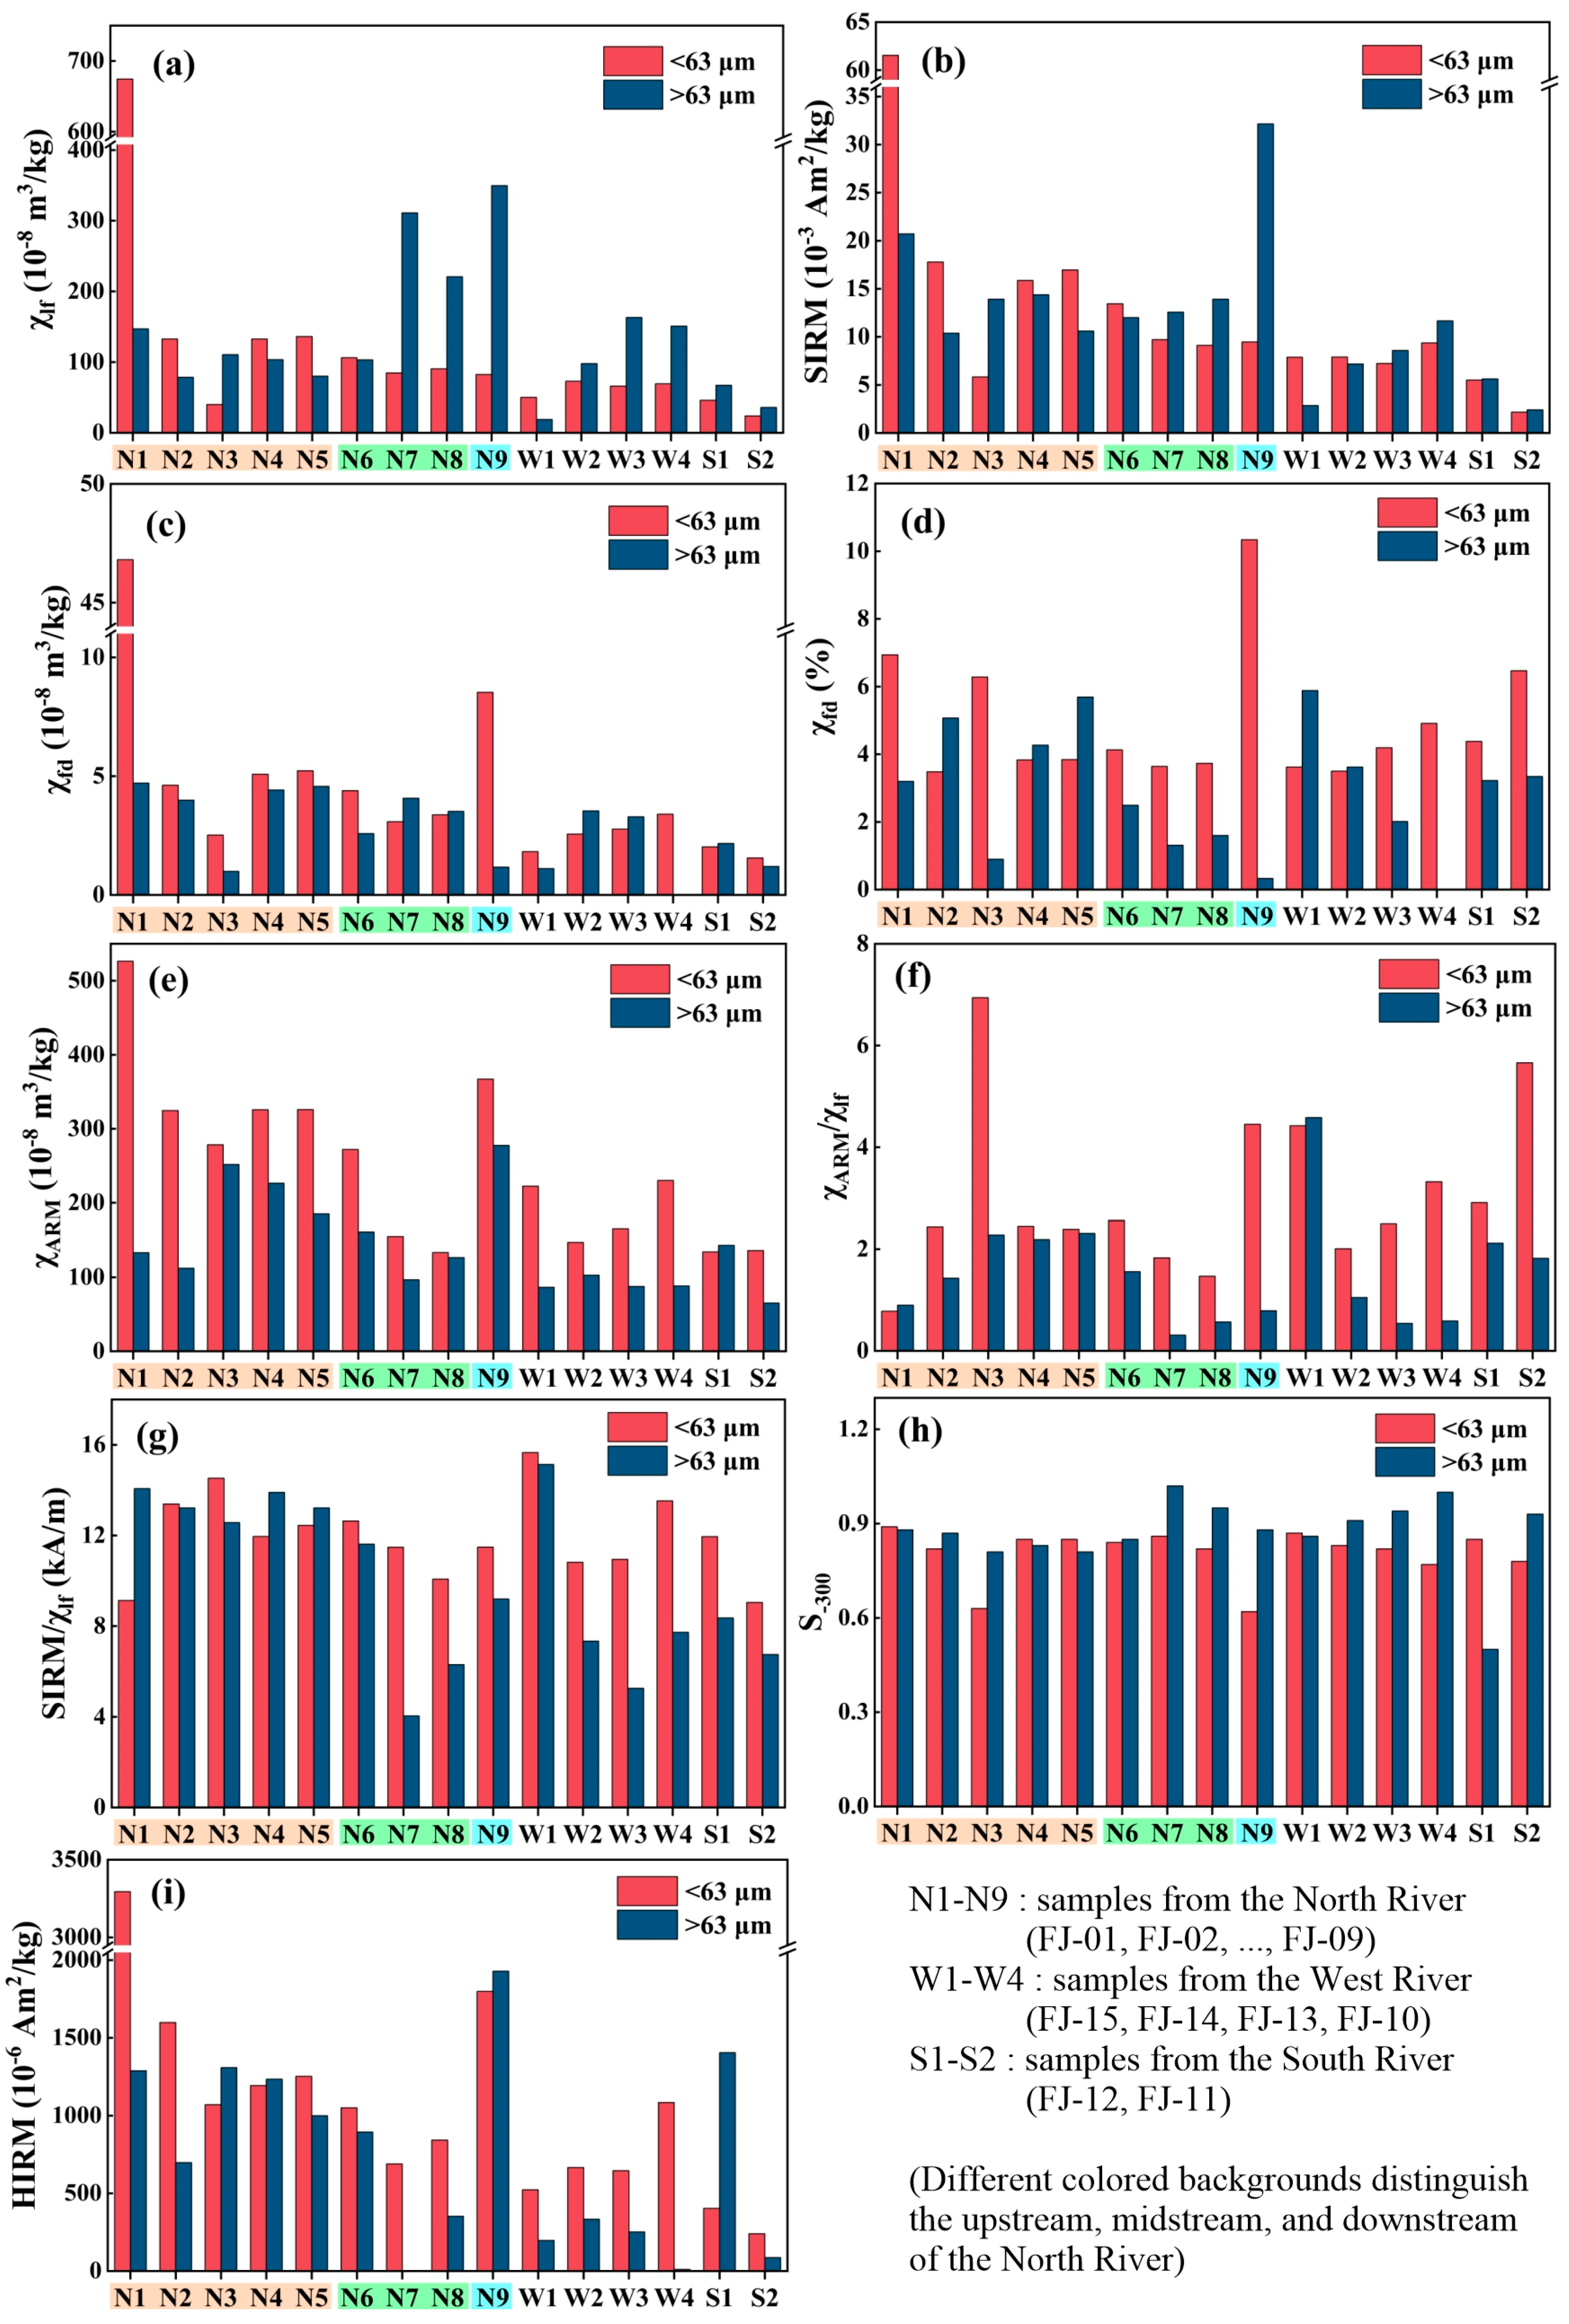
As shown in Table 2, the χlf value of Jiulong River sediment is between 18.88 and 674.45 × 10⁻⁸ m3/kg, high outliers are FJ-01 (<63 μm), FJ-09 (>63 μm) and FJ-07 (>63 μm), and the mean value is 128.29 ± 127.41 × 10⁻⁸ m3/kg. The χfd% value is between 0.33 and 10.34%, the high outlier is FJ-09 (<63 μm), and the mean value is 4.01 ± 2.02%. The χfd value is between 0.99 and 46.81 × 10⁻⁸ m3/kg, high outliers are FJ-01 (<63 μm) and FJ-09 (<63 μm), and the mean value is about 4.80 ± 8.24 × 10⁻⁸ m3/kg. The χARM value is between 65.25 and 526.56 × 10⁻⁸ m3/kg, the high outlier is FJ-01 (<63 μm), and the mean value is about 196.27 ± 105.25 × 10⁻⁸ m3/kg. The χARMlf value is between 0.31 and 6.94; high outliers are FJ-03 (<63 μm) and FJ-11 (<63 μm), and the mean value is about 2.31 ± 1.58. The SIRM value is between 2.18 and 61.55 × 10⁻³ Am2/kg, high outliers are FJ-01 (<63 μm) and FJ-09 (>63 μm), and the mean value is about 12.63 ± 11.03 × 10⁻³ Am2/kg. The SIRM/χlf value is between 4.04 and 15.66 kA/m, and the mean value is about 10.93 ± 3.02 kA/m. The S−300 value is between 0.5 and 1.02; high outliers are FJ-07 (>63 μm) and FJ-10 (>63 μm), low outliers are FJ-12 (>63 μm), FJ-09 (<63 μm) and FJ-03 (<63 μm), and the mean value is about 0.84 ± 0.10. The HIRM value is between 10.63 and 3294.25 × 10−6 Am2/kg, the high outlier is FJ-01 (<63 μm), and the mean value is about 942.99 ± 682.50 × 10⁻⁶ Am2/kg.

3.2.3. Magnetic Variation Patterns in North River

From the upper to lower reaches, magnetic mineral contents of the >63 μm fractions decreased first and increased thereafter, as reflected by the χlf and SIRM values, while those of <63 μm fractions decreased (Figure 7a,b). This behavior indicates that magnetic minerals in the coarse-grained fractions show a complex spatial variation trend, while magnetic mineral contents in the fine-grained fractions decrease downstream. A magnetic decreasing trend from highland to lowland regions was observed in an Indian river, which aligns with the temporal trends of surface water area changes documented in the GEE dataset [47] and a Chinese river [24], probably due to the intense agricultural activities in the lower reaches. This study indicates that similar changes were only present in magnetic minerals of the fine-grained fractions, except FJ-01 and FJ-03, probably indicating that these fine-grained magnetic minerals control the overall magnetic properties. Meanwhile, according to previous statistics [35], there are six medium-sized reservoirs (with a storage capacity of 0.01–0.1 km3) in the middle reaches of the North River, and the sampling sites in this section are scattered between the reservoirs. Reservoirs and their dams may have a certain interception effect on suspending fine particles, causing the number of fine-grained fractions to gradually decrease with the river section, resulting in a decrease in the content of magnetic minerals.
As the magnetic mineral concentration-related parameters for the >63 μm fraction were higher at NR-II and NR-III than the <63 μm fraction for most samples, except FJ-07, FJ-08, and FJ-09, we inferred that the main contributor to magnetism was instead the >63 μm fraction in the downstream. The χARM of the two groups in the upper and middle North reaches showed a decreasing trend, indicating that the content of SSD magnetic minerals decreased. The χARM value of most <63 μm samples was higher than that of >63 μm samples, indicating the <63 μm fractions contained a higher content of fine ferrimagnetic particles (Figure 7e). Thus, the magnetic particle size followed the sediment grain size. The χfd% of the samples >63 μm in the North River increased first and then decreased, indicating the SP particles were higher in the middle reaches. χfd% and χfd of samples <63 μm in the middle reaches of the North River were smaller, indicating less content of SP particles (Figure 7b,c).
Notably, the >63 μm fraction has higher values of concentration-dependent magnetic parameters downstream. Although some studies propose that magnetic enhancement results from urbanization and intensive agricultural activities, our findings indicate that the samples with the highest magnetic values were found at FJ-07, FJ-08, and FJ-09, all situated remote from agricultural and industrial areas. Instead, the three points are in the acidic rock region (Figure 1). It was found that the magnetic susceptibility value for igneous rocks (granite, diorite containing magnetite) in this area is dozens of times that of sedimentary rocks [48]. Therefore, the high values of χlf and SIRM related to magnetic mineral contents in the riverine sediments might be caused by the original rocks (Figure 7a,b). This fact is supported by low values of magnetic size-dependent parameters χARMlf, χfd and SIRM/χlf of these leucocratic minerals in this acidic rock region (Figure 7d,f,g). Because the fine-grained components have undergone relatively thorough weathering, they retain less magnetism than the original rocks. In contrast, coarse-grained magnetic minerals may preserve the magnetic characteristics of the original rocks.

3.2.4. Magnetic Variation Patterns in West River

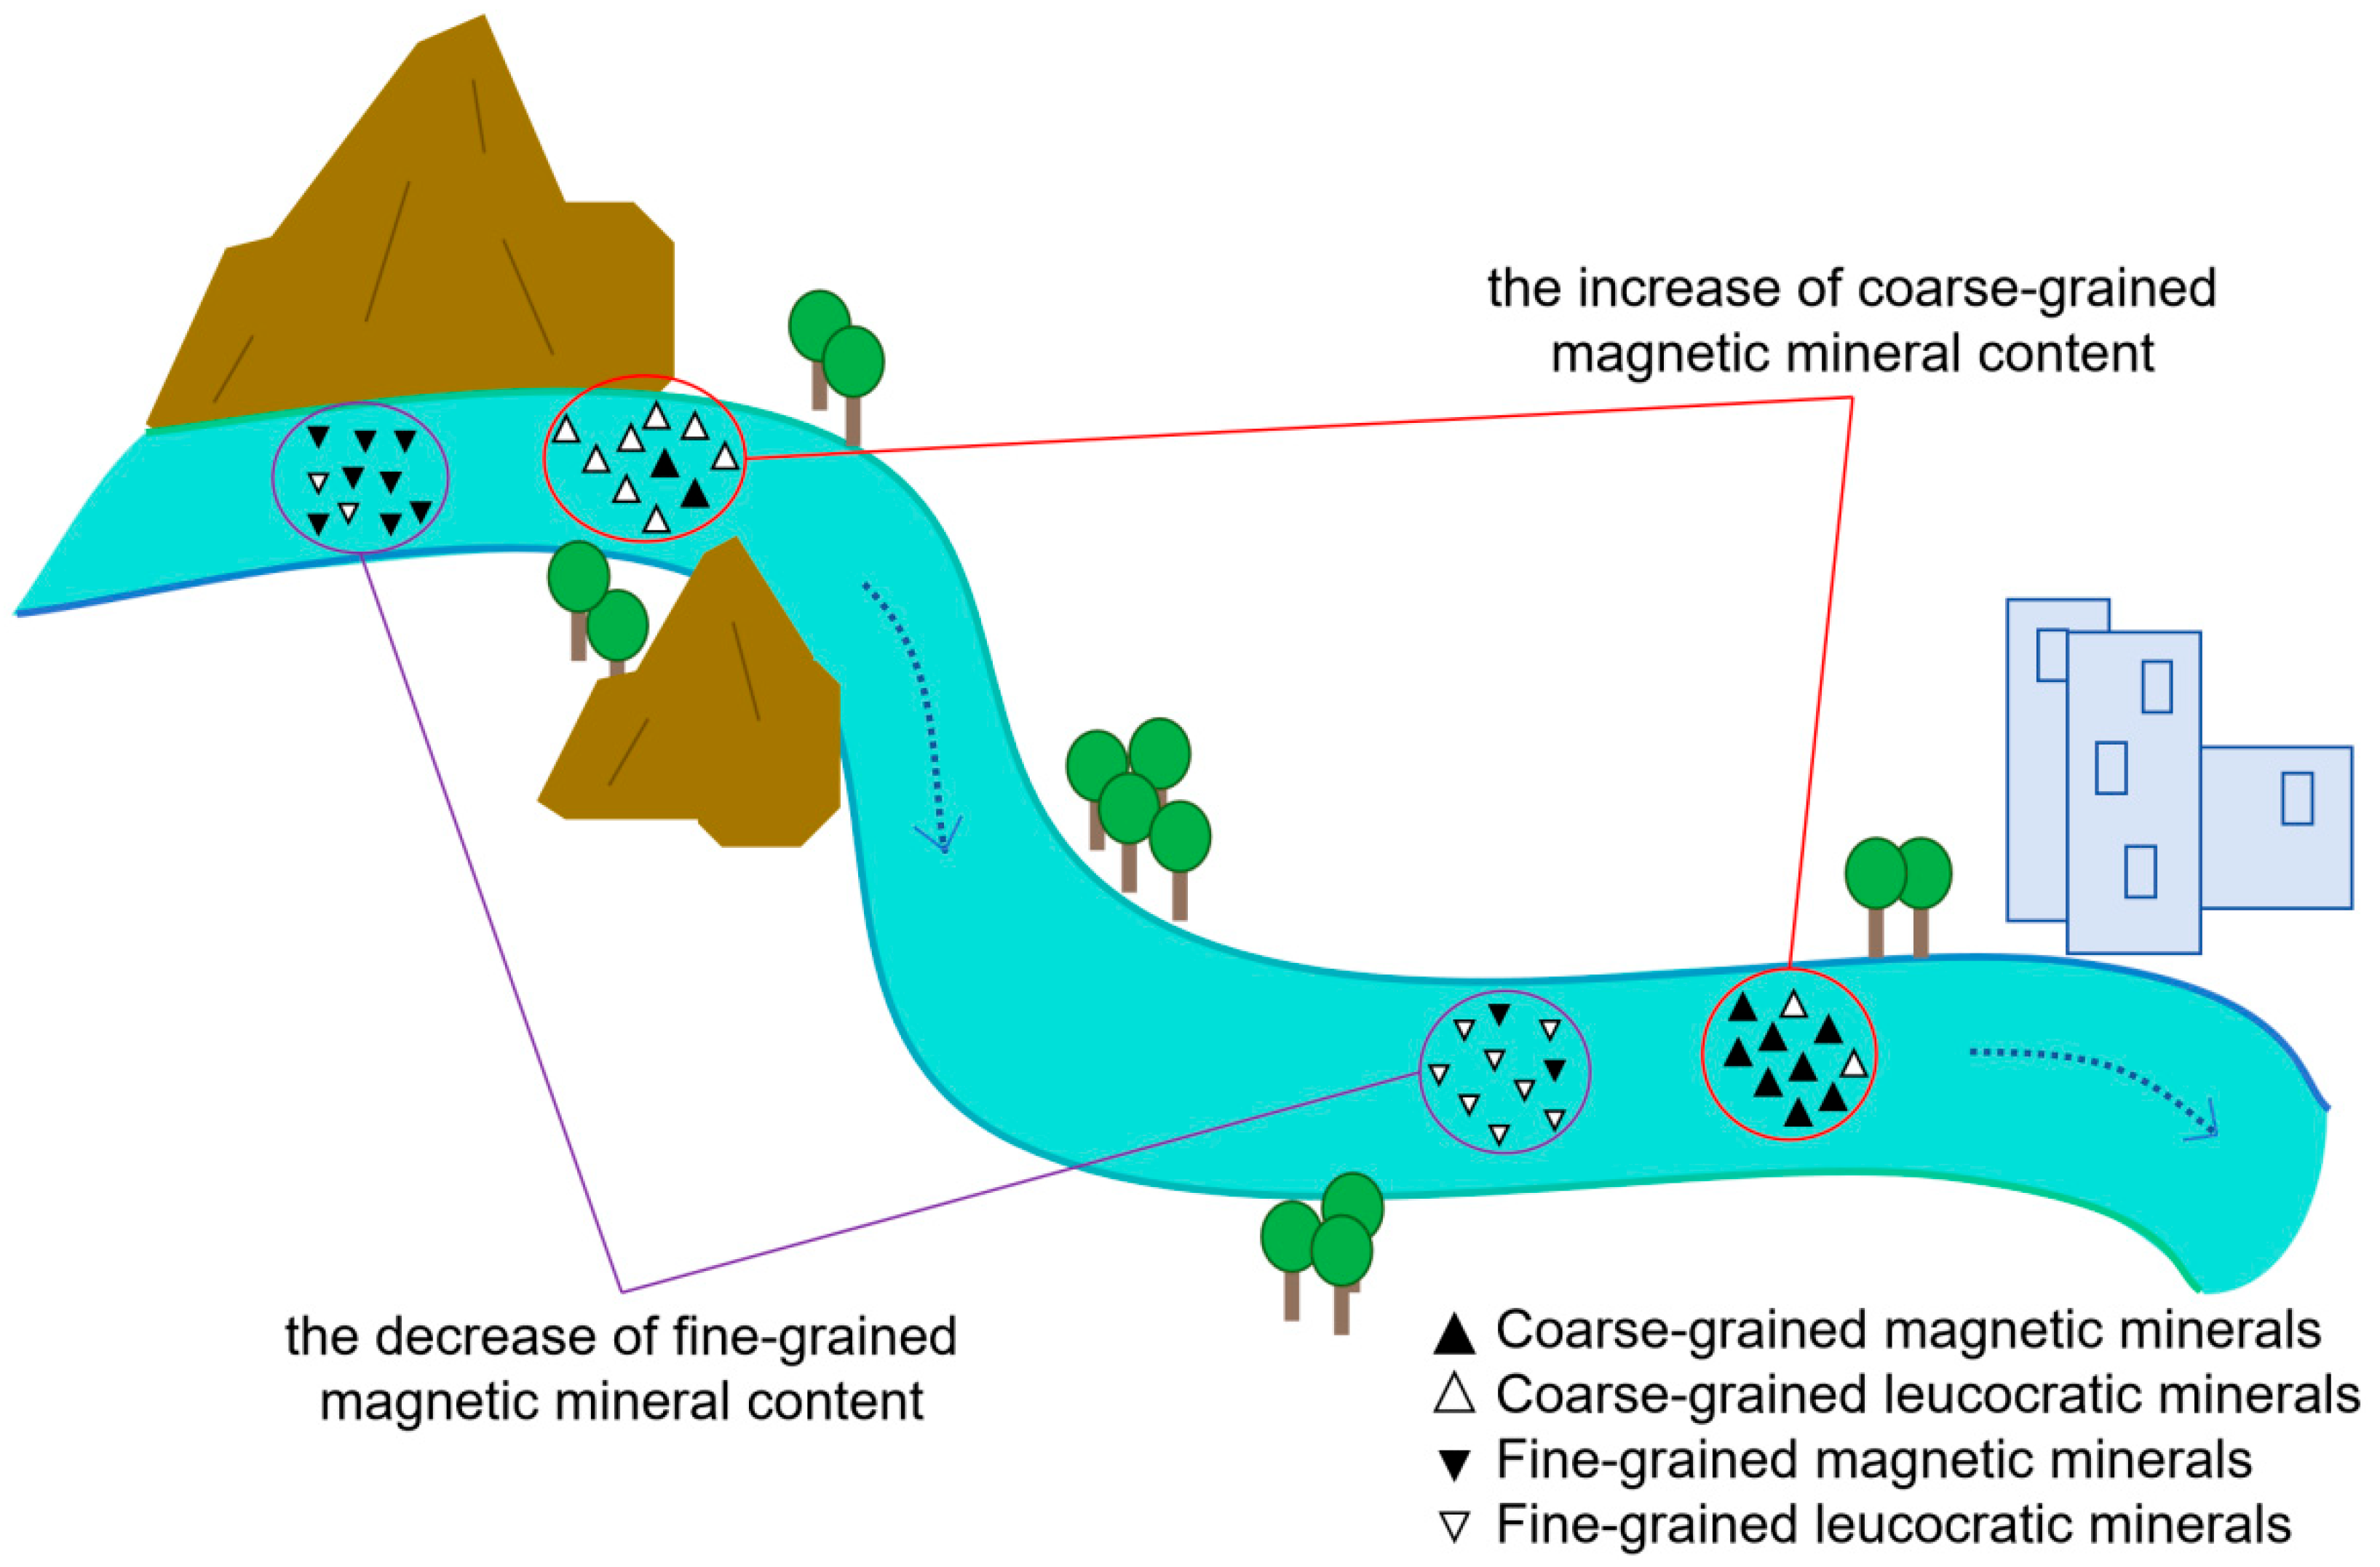
From upstream to downstream, the χlf and SIRM values of samples >63 μm in the West River gradually increased. The magnetic mineral content of >63 μm samples increased gradually (Figure 7a,b). The χfd% of West River samples >63 μm showed a significant downward trend, that is, fewer SP particles (Figure 7d). The SIRM/χlf of >63 μm samples in the middle reaches of North River and the middle and upper reaches of West River were lower than that in the lower reaches, indicating that the magnetic mineral particles in the samples were coarser (Figure 7g). The S−300 of each sample is basically above 0.8, indicating that ferromagnetic minerals dominate these river sediments. The S−300 of >63 μm samples in the North and West rivers increased along the river section (Figure 7h). Overall, magnetic mineral spatial variation is similar to that of the North River, as shown in the model of Figure 8.
The χlf and SIRM values of samples <63 μm in the downstream of West River are higher than those in the upstream, which indicates a higher content of magnetic mineral in the downstream (Figure 7a,b). The χfd, χfd%, χARM, χARMlf, and SIRM/χlf of three finer samples in the north part of West River, from FJ-14 to FJ-10, gradually increased (Figure 7c–g). The <63 μm sample in the downstream of the West River shows the lowest value of S−300 and the highest value of HIRM, indicating that the proportion of low-coercivity magnetic minerals is relatively small and the content of high-coercivity magnetic minerals is higher (Figure 7h,i).

3.2.5. Magnetic Variation Patterns in South River

Values of χlf and SIRM in the South River decreased downstream (Figure 7a,b). The χARMlf values of West and South >63 μm samples showed a decreasing trend, indicating a magnetic particle size increase in West and South rivers (Figure 7f). The S−300 of South River samples decreased along the river section, and the trend of <63 μm samples was opposite to that of >63 μm samples (Figure 7i).

3.3. Human Activities on Magnetic Minerals

Generally, the extremely high magnetic mineral content (“magnetic enhancement”) in river sediments could be deduced from anthropogenic sources [19,24,49]. There are two sampled regions with remarkably enhanced magnetic susceptibility.
First, “magnetic enhancement” occurred in the sample of the <63 μm fraction at the site FJ-01, which is located downstream of Longyan City, an industrial city. This extremely high χlf value is very close to the reported χlf values (>200 × 10−8 m3/kg) downstream of the smelting plant in Loudi, a typical industrial city [19]. In Zhang et al., the high magnetic mineral content resulted from the input of industrial spherical magnetic minerals with a diameter <63 μm. It is inferred in this study that the magnetic enhancement could be attributed to the emissions from the industrial zone. However, it must be acknowledged that there is only one sample collected in this area. In future research, more samples and magnetic mineralogy analysis should be carried out.
Second, the apparent magnetic enhancement occurs in >63 μm fractions of FJ-07, FJ-08, and FJ-09. Notably, this area is located in the middle reaches of the river basin, with a significant water drop, and densely distributed dams (Figure 1). Generally, rapid denudation is more likely to occur in such river basins with large differences in elevation, especially during the rainy season. This fact might be one of the reasons for the enrichment of coarse-grained magnetic minerals. In addition, the three sites are at the downstream of Panluo Iron Mining Area. Previous studies on the sediment of the Liuxi River in southern China have shown that the coarse particle debris resulting from iron ore mining is responsible for the enrichment of magnetic minerals [24].
We inferred that the influence of the reservoir and water dynamics on magnetic minerals might be greater than that of the mining activity. This is because the χlf of FJ-6, downstream of the mining area, is not higher than that of the upstream sample FJ-5. However, in the areas with many dams/reservoirs, the magnetic minerals in the downstream region are significantly more abundant than those in the upstream region. Especially in the coarse-grained components of samples FJ-07, FJ-08, and FJ-09, the content of magnetic minerals is significantly higher than that of samples FJ-05 and FJ-06 (Figure 7). In addition, the χARM/χlf values decreased in samples from FJ-06 to FJ-07, FJ-08 and FJ-09 (Figure 7f), indicating that more coarse-grained magnetic minerals were added downstream. Generally, once a dam is constructed, the drop in water level caused by the water flowing down will enhance the water flow dynamics in the downstream section, thereby eroding the riverbed and carrying away finer particles, leaving behind coarser particles.

3.4. Provenance Significance of the Magnetic Parameters of the Fine and Coarse-Grained Fractions

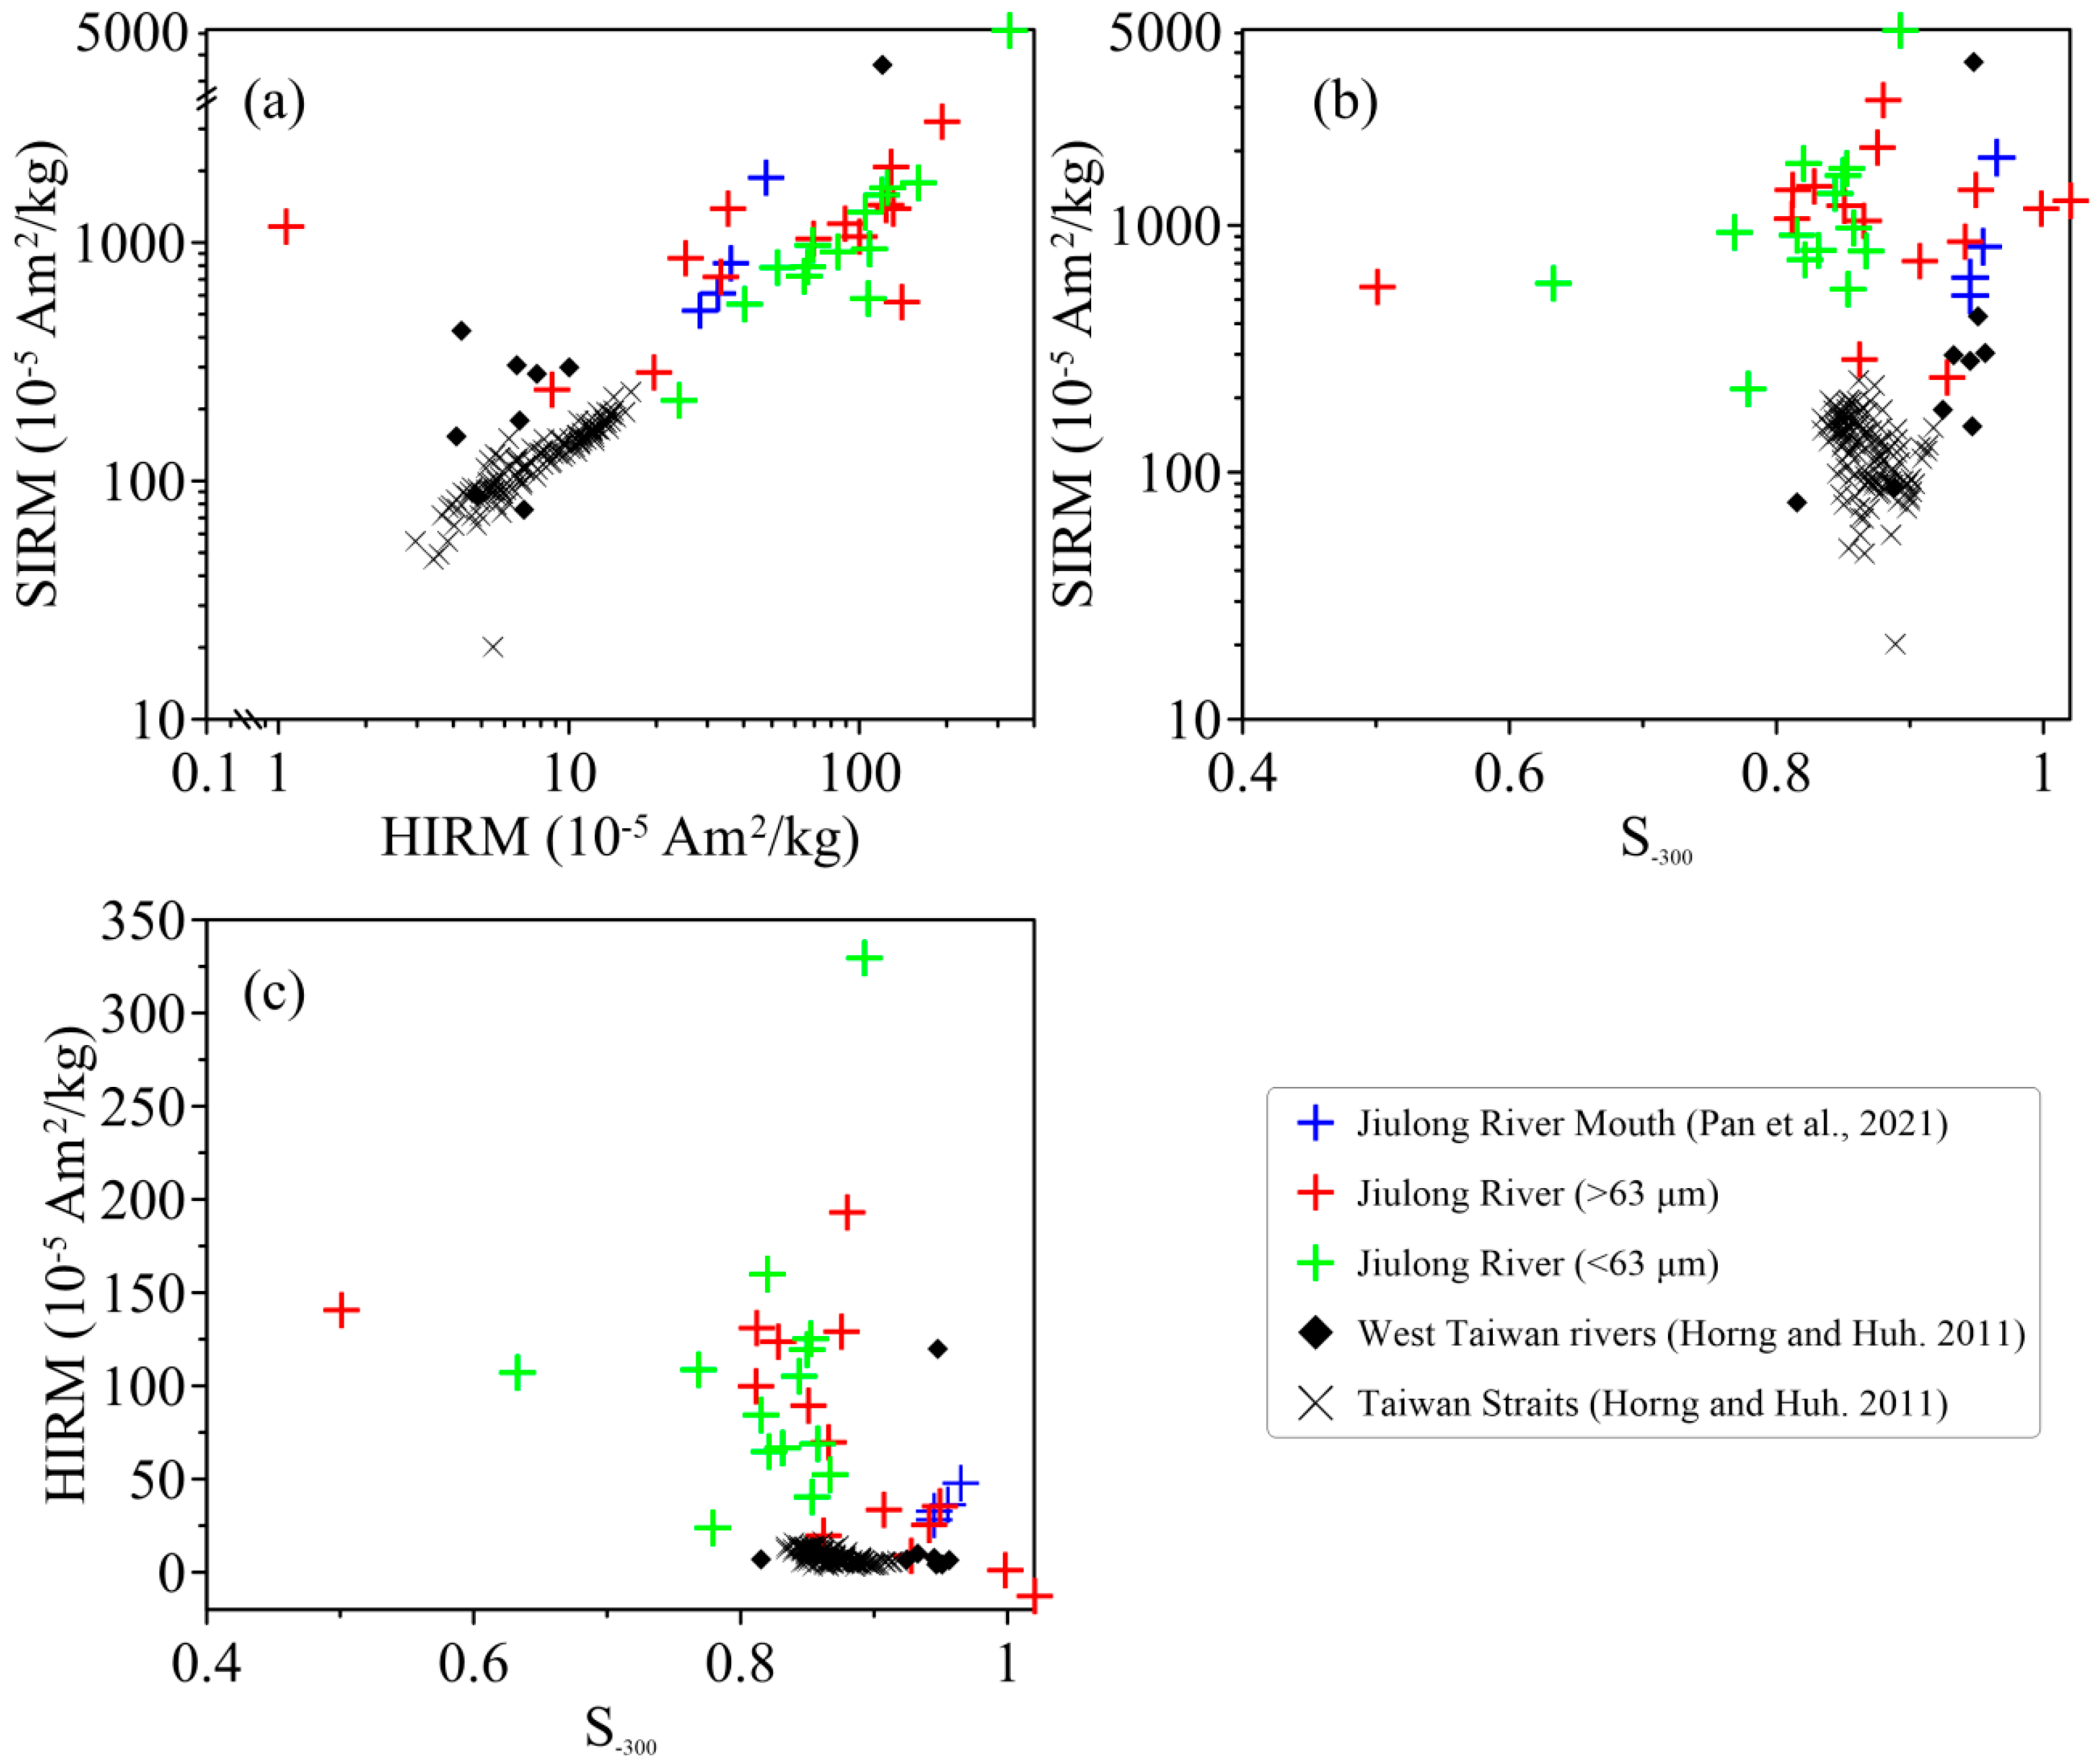
Generally, for the sediment provenance analysis, it is required that the values of the end-member parameters be relatively concentrated and significantly different from those of other source areas [50]. Although the scatter plots of magnetic parameters have been utilized to trace sediment provenance in the Taiwan Strait, leveraging the distinct magnetic properties of sediments from Taiwan Island and the southeastern China mainland, including the Jiulong River Basin [11], it is still unclear how reliable the magnetic parameters driven by the particle size of the Jiulong River are as end-member sources.
Figure 9 shows that magnetic parameters are scattered in the >63 μm fractions than in the <63 μm fractions in the Jiulong River (Figure 9). Notably, some samples of the >63 μm fractions overlapped the Taiwan-sourced samples, probably leading to a misjudgment of the sediment provenance in the Taiwan Strait. As discussed earlier, the magnetic parameters of the coarse particles in the middle section of the river basin represent the local bedrock variations. Samples from the Jiulong River Mouth are more similar to the >63 μm fraction [20] (Figure 9), indicating that the hydrodynamic forces at the estuary have promoted the enrichment of coarse-grained magnetic minerals. The heterogeneous magnetic characteristics of coarse particles could result from some unexpected inputs from intense rainfall and human construction. However, in this study, without samples collected over multiple periods, it was impossible to discuss the influence of these factors.
Magnetic parameter values of the components <63 μm are more concentrated (Figure 9). This indicates that the magnetic parameters of the fine-grained fractions of several tributaries do not show such significant differences as those of the coarse-grained particles. Commonly, whether during the rainy season or the dry season, the fine-grained particles all come from the well-weathered soils, and are carried by the erosion and suspension of surface runoff. Therefore, there are no significant differences among the tributaries, which may be caused by the relatively small differences in rock composition, climate, and well mixture. In summary, the magnetic parameters of fine-grained fractions are more suitable for provenance identification.

4. Conclusions

The following understandings are obtained through the magnetic analysis of >63 μm and <63 μm sediment fractions in the Jiulong River. Magnetic minerals were dominated by terrigenous magnetite and hematite. Opposite spatial distribution models for coarse- and fine-grained magnetic minerals were found in the North River. The parent rock, mining, and dam construction are responsible for the coarse-grained fraction “magnetic enhancement” in the middle section of the river. Hydrodynamics amplify lithologic signals in coarse fractions through selective transport. The decrease of fine-grained magnetic minerals towards the downstream may indicate that the input of fine-grained substances is unfavourable, due to factors such as dam interception and the reduced transportation capacity of magnetic minerals. Overall, magnetic parameters for fine-grained fractions are more suitable for provenance tracing in the southeastern China coasts due to their concentrated distribution in the scatter plots.
In this study, only one set of basin samples collected was used for analysis and discussion. However, the specific control mechanisms of hydrodynamic forces, regional environment, and human activities on sediment magnetism are still difficult to elucidate. Although the research results can be applied to the sediment provenance analysis in the adjacent shelf, more specific studies, such as seasonal sampling and soil-river cross-section studies, are expected to be carried out.

Author Contributions

Conceptualization, M.L.; methodology, R.W. and S.L.; validation, M.L.; investigation, M.L.; data curation, R.W.; writing—original draft preparation, R.W.; writing—review and editing, S.L., M.L., M.A.E.C. and Y.Y.; supervision, M.L. and Y.Y.; funding acquisition, M.L. All authors have read and agreed to the published version of the manuscript.

Funding

The study was supported by the Fujian Provincial Key Laboratory of Marine Physical and Geological Processes (KLMPG-22-07), Guangdong Basic and Applied Basic Research Foundation, China (Grant No. 2023A1515010675) and Key Laboratory of Marine Environmental Survey Technology and Application, Ministry of Natural Resources (Grant No. MESTA-2023-A004).

Data Availability Statement

The data presented in this study are available on request from the corresponding authors.

Conflicts of Interest

The authors declare no conflict of interest.

References

  1. Milliman, J.D.; Farnsworth, K.L. River Discharge to the Coastal Ocean: A Global Synthesis; Cambridge University Press: Cambridge, UK, 2011. [Google Scholar]
  2. Steffen, W.; Sanderson, R.A.; Tyson, P.D.; Jäger, J.; Matson, P.A.; Moore III, B.; Oldfield, F.; Richardson, K.; Schellnhuber, H.-J.; Turner, B.L.; et al. Global Change and the Earth System: A Planet Under Pressure; Springer Science & Business Media: Berlin/Heidelberg, Germany, 2005. [Google Scholar]
  3. Syvitski, J.; Ángel, J.R.; Saito, Y.; Overeem, I.; Vörösmarty, C.J.; Wang, H.; Olago, D. Earth’s sediment cycle during the Anthropocene. Nat. Rev. Earth Environ. 2022, 3, 179–196. [Google Scholar] [CrossRef]
  4. Maher, B. Ubiquitous magnetite. Nat. Geosci. 2024, 17, 7. [Google Scholar] [CrossRef]
  5. Chaparro, M.A.E.; Chaparro, M.A.E.; Rajkumar, P.; Ramasamy, V.; Sinito, A.M. Magnetic parameters, trace elements, and multivariate statistical studies of river sediments from southeastern India: A case study from the Vellar River. Environ. Earth Sci. 2011, 63, 297–310. [Google Scholar] [CrossRef]
  6. Chaparro, M.A.E.; Suresh, G.; Chaparro, M.A.E.; Ramasamy, V.; Sinito, A.M. Magnetic studies and elemental analysis of river sediments: A case study from the Ponnaiyar River (Southeastern India). Environ. Earth Sci. 2013, 70, 201–213. [Google Scholar] [CrossRef]
  7. Kissel, C.; Liu, Z.; Li, J.; Wandres, C. Magnetic minerals in three Asian rivers draining into the South China Sea: Pearl, Red, and Mekong Rivers. Geochem. Geophys. Geosystems 2016, 17, 1678–1693. [Google Scholar] [CrossRef]
  8. Kissel, C.; Liu, Z.; Li, J.; Wandres, C. Magnetic signature of river sediments drained into the southern and eastern part of the South China Sea (Malay Peninsula, Sumatra, Borneo, Luzon and Taiwan). Sediment. Geol. 2017, 347, 10–20. [Google Scholar] [CrossRef]
  9. Nguyen, H.T.T.; Zhang, W.; Li, Z.; Li, J.; Ge, C.; Liu, J.; Bai, X.; Feng, H.; Yu, L. Magnetic properties of sediments of the Red River, Vietnam: Effect of sorting on the source-to-sink pathway and its implications for environmental reconstruction. Geochem. Geophys. Geosystems 2016, 17, 270–281. [Google Scholar] [CrossRef]
  10. Panwar, S.; Yang, S.; Srivastava, P.; Khan, M.; Sangode, S.; Chakrapani, G. Environmental magnetic characterization of the Alaknanda and Ramganga river sediments, Ganga basin, India. Catena 2020, 190, 104529. [Google Scholar] [CrossRef]
  11. Horng, C.S.; Huh, C.A. Magnetic properties as tracers for source-to-sink dispersal of sediments: A case study in the Taiwan Strait. Earth Planet. Sci. Lett. 2011, 309, 141–152. [Google Scholar] [CrossRef]
  12. Jia, J.; Zhang, X.; Zhou, R.; Meadows, M.; Sengupta, D.; Zhu, L. Sources of sediment in tidal flats off Zhejiang coast, southeast China. J. Oceanol. Limnol. 2021, 39, 1245–1255. [Google Scholar] [CrossRef]
  13. Li, M.; Zhu, S.; Ouyang, T.; Tang, J.; He, C. Magnetic fingerprints of surface sediment in the Bohai Sea, China. Mar. Geol. 2020, 427, 106226. [Google Scholar] [CrossRef]
  14. Zhang, W.; Xing, Y.; Yu, L.; Feng, H.; Lu, M. Distinguishing sediments from the Yangtze and Yellow Rivers, China: A mineral magnetic approach. Holocene 2008, 18, 1139–1145. [Google Scholar] [CrossRef]
  15. Chen, T.; Liu, Q.; Zheng, Y.; Zhou, L. Correlation patterns between magnetic parameters and heavy metals of core sediments in the Yellow River Estuary and their environmental implications. Mar. Pollut. Bull. 2020, 160, 111590. [Google Scholar] [CrossRef] [PubMed]
  16. Li, M.; Zhu, S.; Ouyang, T.; Tang, J.; Tang, Z. Magnetic properties of the surface sediments in the Yellow River Estuary and Laizhou Bay, Bohai Sea, China: Implications for monitoring heavy metals. J. Hazard. Mater. 2021, 410, 124579. [Google Scholar] [CrossRef]
  17. Wang, S.; Li, W.; Ye, C.; Gao, Y.; Zhou, Y. Responses of magnetic properties to heavy metals pollution recorded by sediments of Nanchang City reach of Ganjiang River, East China. Environ. Geochem. Health 2024, 47, 17. [Google Scholar] [CrossRef]
  18. Wang, S.; Liu, J.; Li, J.; Xu, G.; Qiu, J.; Chen, B. Environmental magnetic parameter characteristics as indicators of heavy metal pollution in the surface sediments of the Zhoushan Islands in the East China Sea. Mar. Pollut. Bull. 2020, 218, 108–117. [Google Scholar] [CrossRef] [PubMed]
  19. Zhang, C.; Qiao, Q.; Piper, J.D.A.; Huang, B. Assessment of heavy metal pollution from a Fe-smelting plant in urban river sediments using environmental magnetic and geochemical methods. Environ. Pollut. 2011, 159, 3057–3070. [Google Scholar] [CrossRef] [PubMed]
  20. Pan, D.; Liao, Z.; Liang, W.; Liu, Y.; XIao, Y.; Zhu, C. Mineral magnetic characteristics of tidal flat surficial sediments and their implications for sedimentary environment identification in the Jiulong Estuary. Mar. Sci. 2021, 45, 30–41. [Google Scholar]
  21. Jian, X.; Yang, S.; Hong, D.; Liang, H.; Zhang, S.; Fu, H.; Zhang, W. Seasonal geochemical heterogeneity of sediments from a subtropical mountainous river in SE China. Mar. Geol. 2020, 422, 106120. [Google Scholar] [CrossRef]
  22. Li, W.; Hu, Z.; Zhang, W.; Ji, R.; Nguyen, T.T.H. Influence of provenance and hydrodynamic sorting on the magnetic properties and geochemistry of sediments of the Oujiang River, China. Mar. Geol. 2017, 387, 1–11. [Google Scholar] [CrossRef]
  23. Jian, X.; Zhang, W.; Yang, S.; Kao, S.J. Climate-dependent Sediment Composition and Transport of Mountainous Rivers in Tectonically Stable, Subtropical East Asia. Geophys. Res. Lett. 2020, 47, e2019GL086150. [Google Scholar] [CrossRef]
  24. Zheng, E.; Bai, Y.; Li, M.; Ouyang, T.; Zhang, F.; Yu, M.; Lei, G.; Zhiyi, P.; Long, G. Magnetic properties of surface sediments from Liuxi River, southern China and their environmental significance. J. Soils Sediments 2022, 22, 1286–1301. [Google Scholar] [CrossRef]
  25. Hatfield, R.G.; Stoner, J.S.; Reilly, B.T.; Tepley, F.J.; Wheeler, B.H.; Housen, B.A. Grain size dependent magnetic discrimination of lceland and South Greenland terrestrial sediments in the northern North Atlantic sediment record. Earth Planet. Sci. Lett. 2017, 474, 474–489. [Google Scholar] [CrossRef]
  26. Hatfield, R.G.; Wheeler, B.H.; Reilly, B.T.; Stoner, J.S.; Housen, B.A. Particle Size Specific Magnetic Properties Across the Norwegian-Greenland Seas: Insights Into the Influence of Sediment Source and Texture on Bulk Magnetic Records. Geochem. Geophys. Geosystems 2019, 20, 1004–1025. [Google Scholar] [CrossRef]
  27. Leone, S.; Palcu, D.V.; Srivastava, P.; Hassan, M.B.; Muraszko, J.R.; Jovane, L. Changing sediment supply during glacial-interglacial intervals in the North Atlantic revealed by particle size characterization and environmental magnetism. Glob. Planet. Change 2023, 220, 104022. [Google Scholar] [CrossRef]
  28. Wang, F.; Zhang, W.; Huang, T.; Xu, Y.; Lai, Z. Particle-size dependent magnetic property variations in the Yangtze delta sediments of late Holocene: Effects of pedogenesis and diagenesis. Catena 2022, 209, 105832. [Google Scholar] [CrossRef]
  29. Ma, S.; Han, G. Distribution, provenance, contamination, and probabilistic ecological risk of rare earth elements in surface sediments of Jiulong River estuary and adjacent watershed. Ocean Coast. Manag. 2024, 254, 107205. [Google Scholar] [CrossRef]
  30. Anonymous. New progress in the study of metamorphic belt along the southeast coast of Fujian. Geol. Fujian 1988, 4, 288–292. [Google Scholar]
  31. Chen, D.; Wei, D. A comparative study of late Mesozoic volcanic stratigraphy and volcanism characteristics in western Fujian and Eastern Fujian. Geol. Fujian 2005, 04, 207–216. [Google Scholar]
  32. Fujian Provincial Bureau of Geology and Mineral Resources. Regional Geology of Fujian Province; Geological Publishing House: Beijing, China, 1985. [Google Scholar]
  33. Lin, G.; Pan, D.; Lin, Y.; Ren, X.; Zhang, L.; Liang, J.; Huang, C. Temporal and spatial distribution of salinity and suspended sediment concentration in surficial water from the Jiulong estuary. J. Minnan Norm. Univ. (Nat. Sci.) 2020, 33, 67–73. [Google Scholar]
  34. Chen, A. Analysis of Water Environment Quality and Research on Pollution Prevention and Control Strategies in the Basin of South River of Jiulong River. Staits Sci. 2022, 10, 46–50. [Google Scholar]
  35. Li, S.; Yu, J.; Wang, L.; Wang, H.; Zheng, X.; Wang, L.; Ding, H.; Zhang, Y. Distribution patterns of reduced inorganic sulfur in surface sediments and its reservoir driving mechanism during the flooding season in Jiulong River,China. Acta Sci. Circumstantiae 2023, 43, 125–133. [Google Scholar]
  36. Hatfield, R.G.; Stoner, J.S.; Carlson, A.E.; Reyes, A.V.; Housen, B.A. Source as a controlling factor on the quality and interpretation ofsediment magnetic records from the northern North Atlantic. Earth Planet. Sci. Lett. 2013, 368, 69–77. [Google Scholar] [CrossRef]
  37. Gubbins, D.; Herrero-Bervera, E. Encyclopedia of Geomagnetism and Paleomagnetism; Springer: Berlin/Heidelberg, Germany; New York, NY, USA, 2007. [Google Scholar]
  38. Hopkinson, J. XIV. Magnetic and other physical properties of iron at a high temperature. Philos. Trans. R. Soc. Lond. 1889, 180, 443–465. [Google Scholar]
  39. Roberts, A.P.; Chang, L.; Rowan, C.J.; Horng, C.-S.; Florindo, F. Magnetic properties of sedimentary greigite (Fe3S4): An update. Rev. Geophys. 2011, 49, RG1002. [Google Scholar] [CrossRef]
  40. Roberts, A.P. Magnetic properties of sedimentary greigite (Fe3S4). Earth Planet Sci Lett. 1995, 134, 227–236. [Google Scholar] [CrossRef]
  41. Thompson, R.; Oldfield, F. Environmental Magnetism; Allen and Unwin: London, UK, 1986. [Google Scholar]
  42. Dunlop, D.J.; Özdemir, O. Rock Magnetism: Fundamentals and Frontiers; Cambridge University Press: Cambridge, UK, 1997. [Google Scholar]
  43. Roberts, A.P.; Zhao, X.; Harrison, R.J.; Heslop, D.; Muxworthy, A.R.; Rowan, C.J.; Larrasoana, J.C.; Florindo, F. Signatures of reductive magnetic mineral diagenesis from unmixing of first-order reversal curves. J. Geophys. Res. Solid Earth 2018, 123, 4500–4522. [Google Scholar] [CrossRef]
  44. Day, R.; Fuller, M.; Schmidt, V. Hysteresis properties of titanomagnetites: Grain-size and compositional dependence. Phys. Earth Planet. Inter. 1977, 13, 260–267. [Google Scholar] [CrossRef]
  45. Chaparro, M.A.E.; Moralejo, M.D.P.; Böhnel, H.; Acebal, S.G. Iron oxide mineralogy in Mollisols, Aridisols and Entisols from southwestern Pampean region (Argentina) by environmental magnetism approach. Catena 2020, 190, 104534. [Google Scholar] [CrossRef]
  46. Liu, Q.; Roberts, A.P.; Torrent, J.; Horng, C.-S.; Larrasoaña, J.C. What do the HIRM and S-ratio really measure in environmental magnetism? Geochem. Geophys. Geosystems 2007, 80, Q09011. [Google Scholar] [CrossRef]
  47. Chaparro, M.A.E.; Krishnamoorthy, N.; Chaparro, M.A.E.; Lecomte, K.L.; Mullainathan, S.; Mehra, R.; Sinito, A.M. Magnetic, chemical and radionuclide studies of river sediments and their variation with different physiographic regions of Bharathapuzha River, southwestern India. Stud. Geophys. Geod. 2015, 59, 438. [Google Scholar] [CrossRef]
  48. Lang, Y.; Hu, D.; Liu, C.; Zhang, B.; Lu, B.; Wang, P. Mineralogy study of magnetic susceptibility of rocks along the coast of the northern South China Sea. Chin. J. Geophys 2011, 54, 573–587. [Google Scholar]
  49. Chaparro, M.A.E.; Sinito, A.M.; Ramasamy, V.; Marinelli, C.; Chaparro, M.A.E.; Mullainathan, S.; Murugesan, S. Magnetic measurements and pollutants of sediments from Cauvery and Palaru River, India. Environ. Geol. 2008, 56, 425–437. [Google Scholar] [CrossRef]
  50. Duan, Z.; Li, C.; Guo, Y.; Ng, N.C.W.; Yang, S.; Bui, V.V.; Nguyen, D.C.; Duan, X.; Yin, P.; Tran, T.T.T.; et al. Sr-Nd isotope fingerprints of Red River sediments and its implication for provenance discrimination in the South China Sea. Mar. Geol. 2023, 457, 106997. [Google Scholar] [CrossRef]
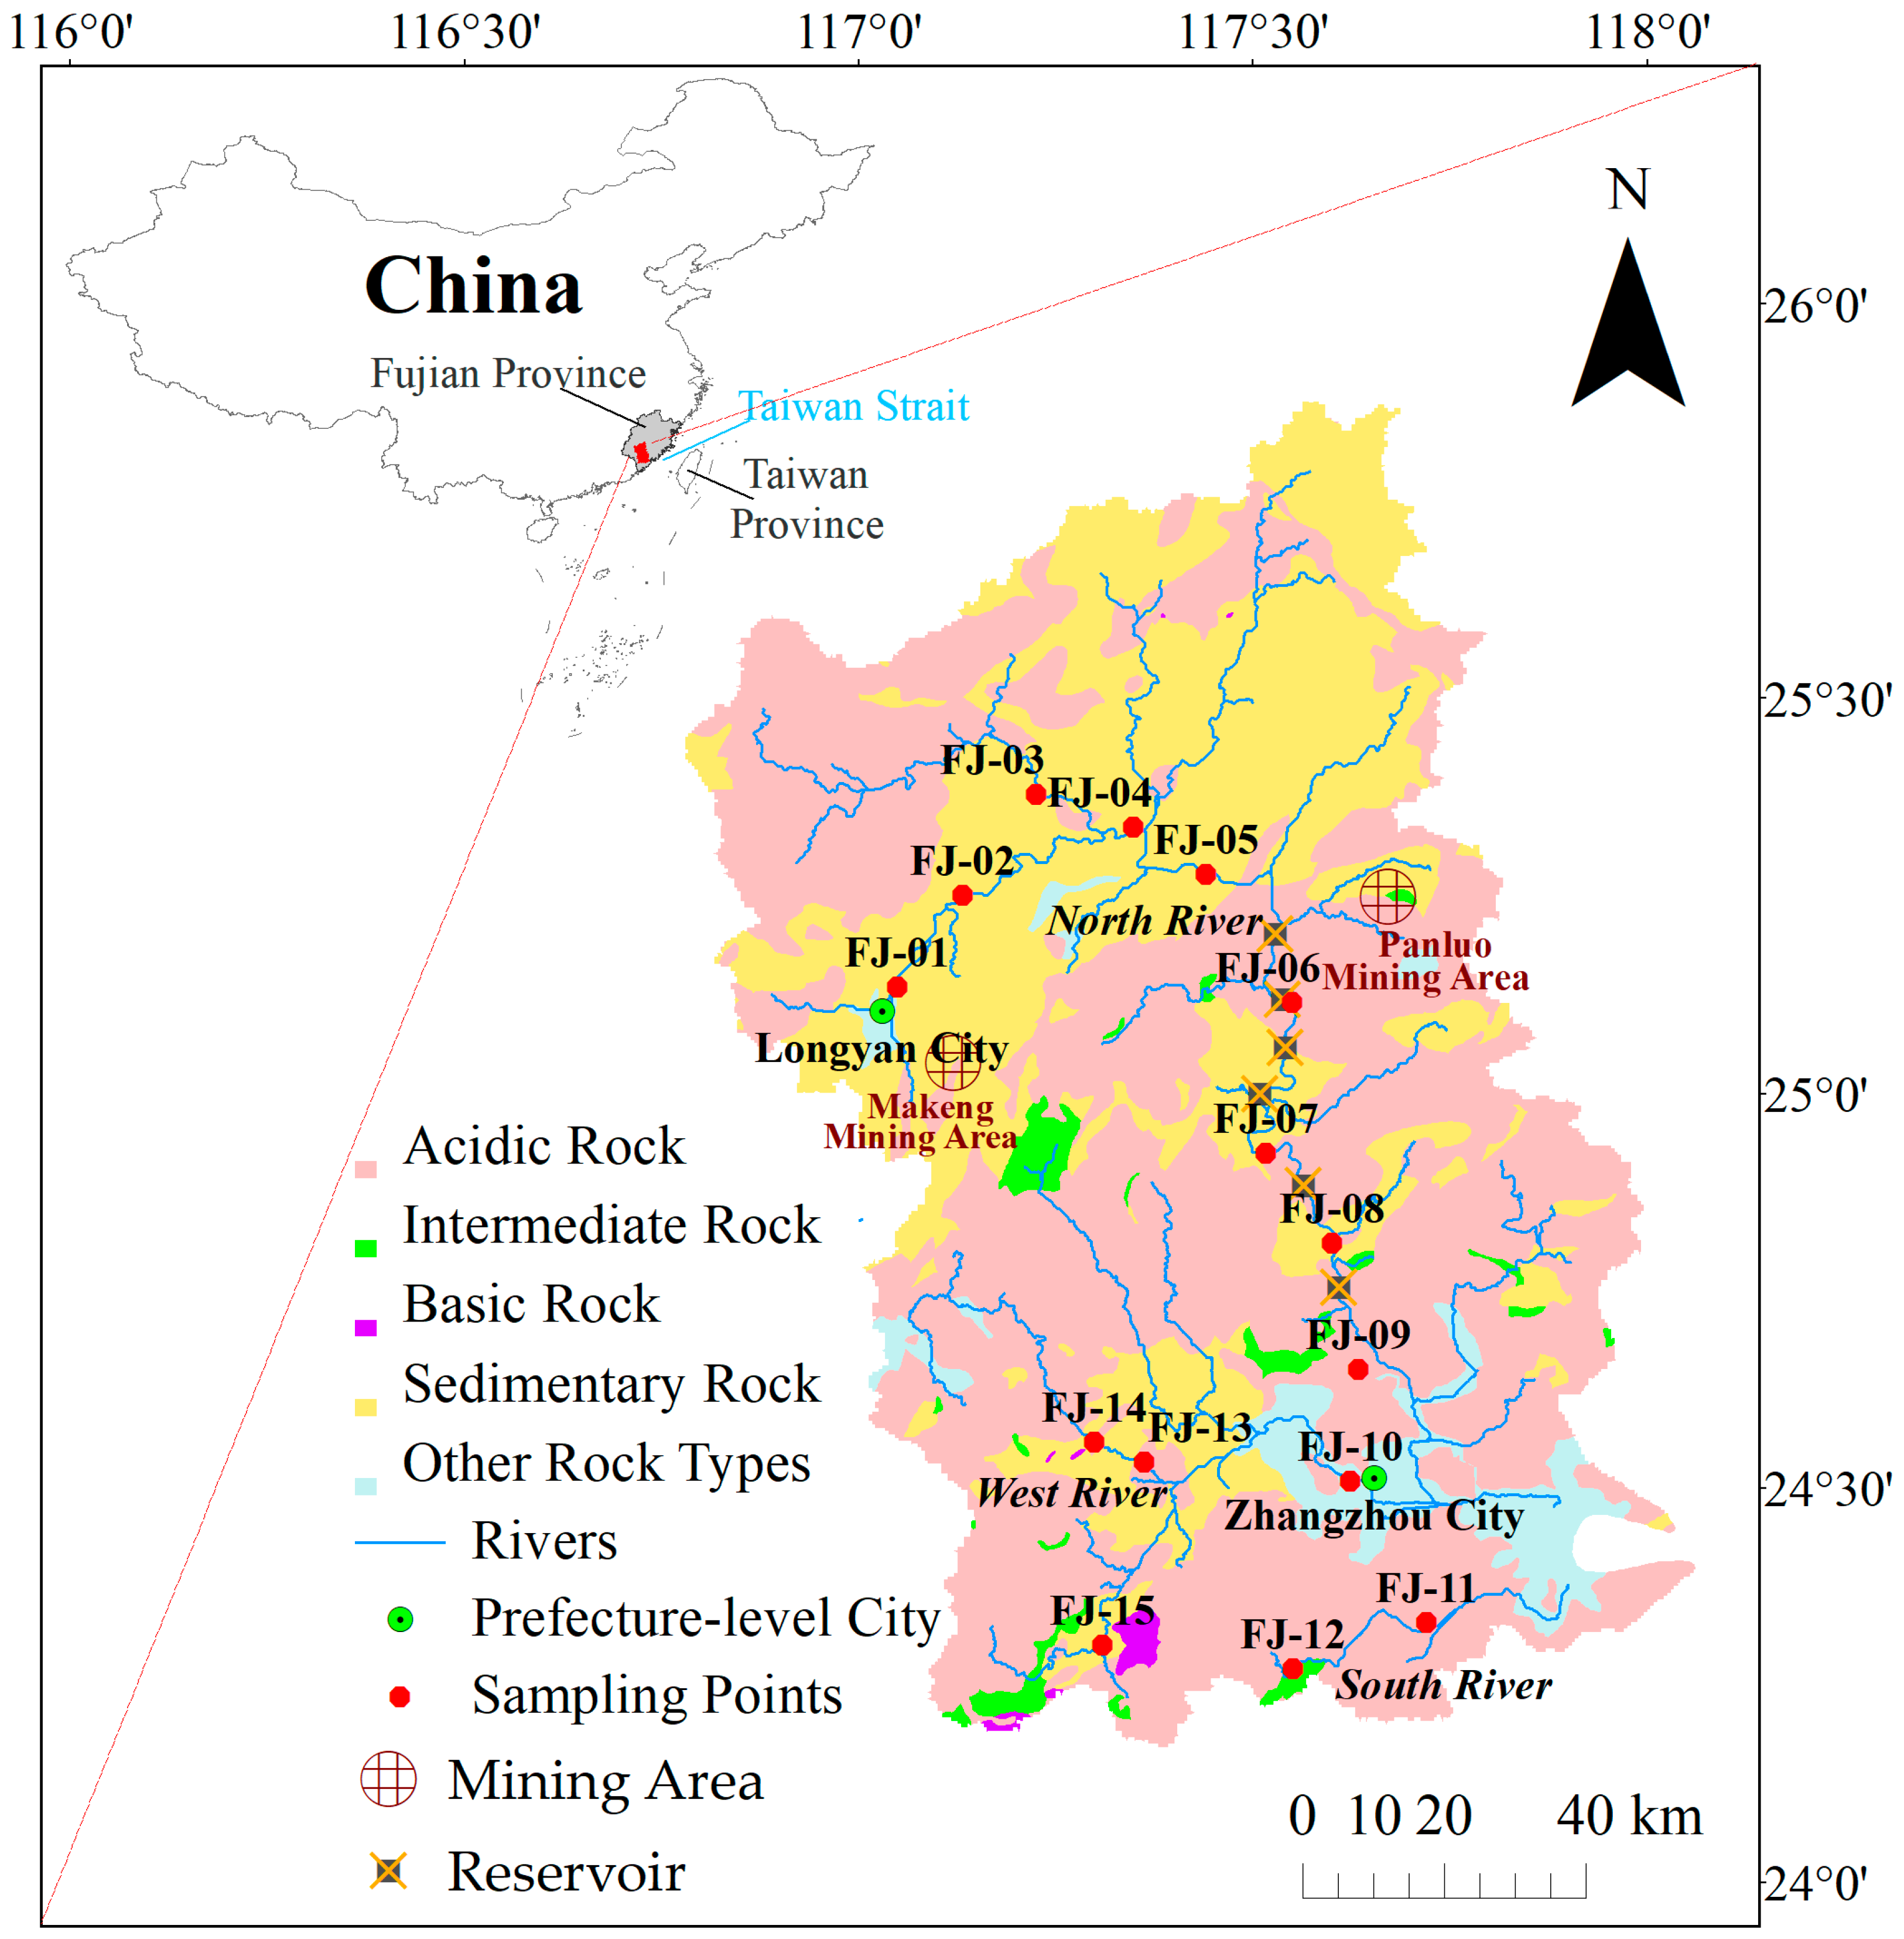
Figure 1. Location and surface lithology of the Jiulong River basin.
Jmse 13 01502 g001
Figure 2. High-temperature magnetic susceptibility (κ-T) curves of (a) FJ-01 (<63 μm), (b) FJ-09 (<63 μm), and (c) FJ-14 (<63 μm). Red and blue lines represent heating and cooling curves, respectively.
Jmse 13 01502 g002
Figure 3. Hysteresis loops of (a) FJ-01 (>63 μm), (b) FJ-09 (>63 μm), (c) FJ-14 (>63 μm), (d) FJ-01 (<63 μm), (e) FJ-09 (<63 μm), and (f) FJ-14 (<63 μm). These curves were corrected by subtracting 70% of the paramagnetic contribution.
Jmse 13 01502 g003
Figure 4. FORC diagrams of (a) FJ-01 (>63 μm), (b) FJ-09 (>63 μm), (c) FJ-09 (<63 μm), (d) FJ-14 (>63 μm), (e) FJ-14(<63 μm), (f) IRM acquisition curves and (g) back-field IRM curves for all samples.
Jmse 13 01502 g004
Figure 5. Day plot (modified from Day et al. [44]).
Jmse 13 01502 g005
Figure 6. Representation of L-ratio and HIRM for the Jiulong River sediments. The gray shaded area indicates a subset of data for which HIRM and L-ratio are not correlated. The arrow beside the figures indicates that a higher L-ratio value corresponds to harder magnetic minerals.
Jmse 13 01502 g006
Figure 7. Magnetic parameters for <63 μm and >63 μm fractions. (a) χlf, (b) SIRM, (c) χfd, (d) χfd(%), (e) χARM, (f) χARM/χlf, (g) SIRM/χlf, (h) S−300, (i) HIRM.
Jmse 13 01502 g007
Figure 8. The migration model of fine and coarse-grained magnetic minerals in the Jiulong River from the upstream to the downstream is potentially influenced by variations in grain size and content.
Jmse 13 01502 g008
Figure 9. Scatter plots of (a) SIRM vs. HIRM, (b) SIRM vs. S−300, and (c) HIRM vs. S−300 of the Jiulong River in this study, Jiulong River Mouth [20] and Taiwan rivers and straits [11].
Jmse 13 01502 g009
Table 1. Implications of magnetic parameters.
ParameterFormulaImplications
χlfConcentration of the total magnetic minerals
χfd%100×(χlf − χhf)/χlfSemi-quantitative contribution of superparamagnetic (SP) particles
χfdχlf − χhfParticle size of the minerals
χARMContent of fine-grained ferrimagnetic component
(such as the stable single domain (SSD))
χARMlfGrain size of the ferrimagnetic particles
SIRMConcentration of the ferromagnetic (sensu lato) minerals
SIRM/χlf Grain size or mineralogy of magnetic minerals
S−300−IRM−300mT/SIRMRelative content of low and high coercive magnetic minerals
L-ratio(SIRM + IRM−300mT)/
(SIRM + IRM−100mT)
Control the S−300 and HIRM to enable
a more rigorous interpretation of these parameters
HIRMHIRM = (IRM−300mT + SIRM)/2Content of high-coercive magnetic minerals
Table 2. Magnetic parameters for the Jiulong River sediments.
SampleχlfSIRMχfdχfdχARMχARMlfSIRM/χlfS−300HIRM
10−8 m3/kg10−3 Am2/kg%10−8 m3/kg10−8 m3/kg kA/m 10−6 Am2/kg
FJ-01 (<63 μm)674.4561.556.9446.81526.560.789.130.893294.25
FJ-02 (<63 μm)132.8817.793.484.62324.602.4413.390.821598.42
FJ-03 (<63 μm)40.125.836.282.52278.406.9414.530.631070.48
FJ-04 (<63 μm)132.6915.883.835.08325.662.4511.960.851193.17
FJ-05 (<63 μm)136.2816.963.845.23326.042.3912.450.851252.84
FJ-06 (<63 μm)106.3713.444.134.39272.002.5612.640.841050.32
FJ-07 (<63 μm)84.719.723.643.08154.911.8311.480.86689.73
FJ-08 (<63 μm)90.549.123.733.37133.341.4710.080.82843.25
FJ-09 (<63 μm)82.489.4710.348.53367.214.4511.490.621798.56
FJ-10 (<63 μm)69.349.384.913.40230.283.3213.530.771084.73
FJ-11 (<63 μm)24.042.186.471.56136.015.669.050.78240.44
FJ-12 (<63 μm)46.075.514.382.02134.172.9111.950.85403.81
FJ-13 (<63 μm)66.087.244.192.77165.542.5010.950.82646.07
FJ-14 (<63 μm)73.057.903.502.56147.062.0110.820.83665.63
FJ-15 (<63 μm)50.307.883.621.82222.414.4215.660.87523.49
FJ-01 (>63 μm)147.1520.713.204.71133.070.9014.070.881289.05
FJ-02 (>63 μm)78.5510.395.073.99112.211.4313.220.87697.61
FJ-03 (>63 μm)110.6913.920.900.99251.822.2812.570.811309.03
FJ-04 (>63 μm)103.5414.394.274.42226.382.1913.900.831235.13
FJ-05 (>63 μm)80.2910.615.694.57185.082.3113.220.81999.70
FJ-06 (>63 μm)103.2712.002.492.58161.081.5611.620.85894.91
FJ-07 (>63 μm)311.2812.571.314.0796.590.314.041.02-
FJ-08 (>63 μm)220.8513.921.603.52126.590.576.300.95352.42
FJ-09 (>63 μm)349.5732.150.331.17277.540.799.200.881929.09
FJ-10 (>63 μm)150.8811.67--88.350.597.731.0010.63
FJ-11 (>63 μm)35.912.423.341.2065.251.826.750.9387.31
FJ-12 (>63 μm)67.375.633.222.17143.112.128.360.501404.74
FJ-13 (>63 μm)163.318.592.013.2987.550.545.260.94252.09
FJ-14 (>63 μm)97.897.193.623.54102.751.057.340.91333.24
FJ-15 (>63 μm)18.882.865.881.1186.474.5815.130.86196.70
Disclaimer/Publisher’s Note: The statements, opinions and data contained in all publications are solely those of the individual author(s) and contributor(s) and not of MDPI and/or the editor(s). MDPI and/or the editor(s) disclaim responsibility for any injury to people or property resulting from any ideas, methods, instructions or products referred to in the content.