Abstract
Oil spills represent a serious threat to marine ecosystems. Remote sensing monitoring, especially based on synthetic aperture radar (SAR), have been extensively employed in marine environments due to its unique advantages. However, SAR images of marine oil spills exhibit challenges of weak boundaries, confusion with look-alike phenomena, and the difficulty of detecting small-scale targets. To address these issues, we propose LRA-UNet, a Lightweight Residual Attention UNet for semantic segmentation in SAR images. Our model integrates depthwise separable convolutions to reduce feature redundancy and computational cost, while adopting a residual encoder enhanced with the Simple Attention Module (SimAM) to improve the precise extraction of target features. Additionally, we design a joint loss function that incorporates Sobel-based edge information, emphasizing boundary features during training to enhance edge sharpness. Experimental results show that LRA-UNet achieves superior segmentation results, with a mIoU of 67.36%, surpassing the original UNet by 4.41%, and a 5.17% improvement in IoU for the oil spill category. These results confirm the effectiveness of our approach in accurately extracting oil spill regions from complex SAR imagery.
1. Introduction
The ocean is the cradle of life and plays a crucial role in global climate and environmental change. The effects of marine pollution, especially from oil spills, are among the most important issues in the maritime industry [1]. Causes of oil spills include oil rig explosions, pipeline breaks and ship accidents [2]. The factors contributing to maritime accidents are multifaceted, with human factors playing a predominant role. This underscores that the management of maritime safety cannot be ignored [3]. Oil spills can cause pollution of the marine environment, resulting in the decline of marine ecosystem services. The Penglai 19-3 oil spill event resulted in a reduction of biomass among trout, fish larvae, and shellfish populations [4]. Therefore, it is essential to monitor oil spills promptly and accurately.
Traditional on-site oil spill monitoring methods are expensive, limited in coverage, time-consuming and labour-intensive. Remote sensing technology, characterized by extensive coverage, real-time accessibility and cost-efficiency, has emerged as a critical tool for monitoring marine oil spills across various scales. Over the past several decades, remote sensing data have been extensively utilized for oil spill detection. Active microwave sensors are widely used due to their broad coverage and ability to acquire data around the clock. Among them, SAR is the most commonly used for monitoring marine elements [5,6,7], owing to its all-weather capability, broad spatial coverage, and cost-effectiveness [8]. Oil films suppress capillary waves on the ocean surface [9], reducing backscatter and appearing as dark spots on SAR images relative to the surrounding clean sea surface. The reduction or absence of radar backscatter is not unique to oil spills; other meteorological and oceanographic phenomena—such as biogenic oil films, low wind conditions, oceanic eddies, and algal blooms—can also alter surface roughness and suppress backscatter from short surface waves [10]. These low-backscatter regions, known as look-alikes, also appear dark in SAR images. Due to their visual similarity to actual oil spills, they pose a significant challenge for accurate oil spill detection. Oil spill detection methods can be categorized into threshold methods, edge information methods and machine learning methods. Thresholding methods [11] segment image pixels by setting a fixed threshold. Edge detection methods [12] extract region contours by linking discrete grayscale pixels. Both approaches rely heavily on the grayscale distribution of the image. However, the complexity of the marine environment and the distinctive characteristics of SAR imaging introduce substantial scattering noise, significantly limiting the effectiveness of these traditional methods. With advances in artificial intelligence, machine learning-based image segmentation methods have emerged as effective solutions to overcome the limitations of traditional techniques. Specifically, machine learning algorithms have made significant contributions to the accurate detection and monitoring of oil spills and slicks in remote sensing imagery [13,14]. These methods can be divided into conventional machine learning algorithms and deep learning models.
In recent decades, researchers have explored a range of machine learning algorithms for oil spill detection, including Artificial Neural Networks (ANN) [15,16], Support Vector Machines (SVMs) [17,18], Decision Trees (DTs) [19,20], and Random Forests (RFs) [21].
In recent years, deep learning has demonstrated significant advantages in remote sensing image processing tasks such as object detection [22,23] and semantic segmentation [24,25,26]. Under comparable parameter settings and limited training data, deep convolutional neural networks (CNNs) have outperformed traditional machine learning methods in oil spill classification, exhibiting greater robustness and generalization capabilities in SAR image analysis [27,28]. As demonstrated by Long et al. [29], fully convolutional networks (FCNs), which replace the fully connected layers of traditional CNNs with convolutional layers and restores the spatial resolution through upsampling, are effective for pixel-level segmentation tasks. This achieves the transition from image-level classification to pixel-level semantic segmentation.
IonCodec is an improved model based on FCN, designed to effectively capture complex mapping relationships between inputs and outputs while thoroughly considering global contextual information. Ronneberger et al. [30] introduced the UNet architecture, characterized by a symmetric U-shaped structure and skip connections that enable the integration of multilevel feature information. This design enables end-to-end training with limited sample sizes, thereby improving image segmentation accuracy. Although initially developed for medical image analysis, the UNet has been widely adopted for remote sensing image segmentation due to its superior performance. Krestenitis et al. [31] used various semantic segmentation models, including UNet, LinkNet, and DeepLabV3+, on a provided dataset, with DeepLabV3+ achieving the best performance. To further enhance recognition accuracy, Mahmoud et al. [32] integrated a Dual Attention Mechanism (DAM) into the UNet framework, demonstrating the potential of attention modules in deep learning applications. Combining the advantages of the UNet model coder-solver and the skip connection layer, Zhu et al. [33] proposed the Contextual and Boundary-Supervised Detection Network (CBD-Net), which combines multi-scale feature fusion and the spatial and channel squeeze excitation (SCSE) blocks to enhance the internal consistency of segmented oil spill regions. In addition to semantic segmentation, instance segmentation models have also been utilized for the identification of offshore oil spill regions. Yekeen et al. [34] developed a deep learning detection model based on Mask R-CNN, which significantly improved the segmentation accuracy of oil spills and similar regions.
Although deep learning has performed well in many oil spill detection tasks, several limitations remain. First, the number of samples in the public dataset is limited, and the target area often exhibit high visual similarity to interference regions such as look-alikes and ship wakes, leading to frequent misdetections and omissions. Effectively leveraging data characteristics to enhance the model’s ability to discriminate similar categories is a key consideration. Second, oil spill regions typically exhibit irregular morphologies, with indistinct transitions between the target and the background, making accurate boundary segmentation difficult. Furthermore, relying solely on convolutional methods to extract features from local regions is insufficient for effectively capturing the contextual information within the image.
To solve the above issues, we propose an improved UNet-based method for oil spill region detection with the following structure and functions:
- Residual blocks integrated with the SimAM attention mechanism are introduced into the encoder to enhance the network’s feature extraction capability;
- Replacing common 2D convolution with depthwise separable convolution reduces redundant spatial and channel features, significantly reduces the number of parameters and computation, and achieves a lightweight semantic segmentation model;
- A joint loss function is constructed by introducing an edge detection term based on the Sobel operator, enhancing the model’s segmentation accuracy along object boundaries.
2. Dataset Preparation
Due to the absence of standardized benchmark datasets, early studies on oil spill detection and classification [35,36,37] used specific methods on customized datasets, presenting incomparable results. To address this issue, Krestenitis created multiple annotated datasets for oil spill events and made them publicly available through a dedicated website (https://mklab.iti.gr/, accessed on 23 September 2020). The remote sensing data comprise C-band SAR images acquired by the Sentinel-1 satellite and distributed by the European Space Agency (ESA) via the Copernicus Open Access Hub. This data covers oil spill events from 28 September 2015, to 31 October 2017. The raw data, collected in the V-vertical (VV) polarization mode, were preprocessed using the Sentinel Application Platform (SNAP, https://step.esa.int/main/toolboxes/snap/, accessed on 28 September 2024), including region cropping, radiometric calibration, speckle filtering, median filtering, and a linear transformation to convert decibel (dB) values into real-valued luminosity to generate standardized visual representations. The developed dataset contains 1002 training images and 110 test images depicting five types of instances: sea surface, oil spill, look-alike, ship, and land. The size of the original images is 1250 × 650, which makes the training step both lengthy and time-consuming.
Through cropping, the dataset was divided into 1742 training images and 129 test images, with representative examples shown in Figure 1. To enhance the model’s generalization ability and reduce overfitting, data augmentation was applied to the training set. Given the robustness of object detection tasks to affine transformations, we applied augmentation strategies such as rotation and flipping. The training set was augmented to 5888 images. During testing, the original test images were preserved to ensure the accuracy of model evaluation. Meanwhile, to enhance model stability, standard normalization was applied to the input images by normalizing each channel using the mean and standard deviation calculated from the training set. Detailed information about datasets is presented in Table 1. This dataset is used as a benchmark to train the model and compare our results with the optimal results published by other researchers [31,38].
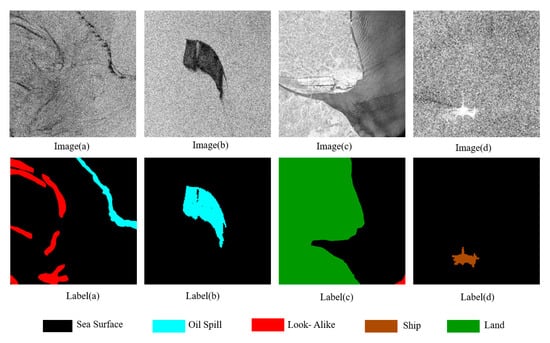
Figure 1.
Example image data and label data.

Table 1.
The details of dataset.
3. Methodology
The deep learning model used in this study integrates a lightweight UNet architecture with residual attention modules. The network architecture of the LRA-UNet is shown in Figure 2.
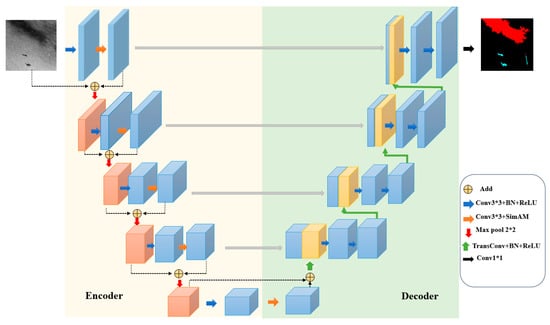
Figure 2.
Architecture of the LRA-UNet.
The encoder incorporates a ResNet-based residual structure, enhanced with the parameter-free SimAM attention mechanism to improve the extraction of fine-grained features from oil spill regions. Initially, the input image is processed through the residual attention module to extract shallow features, followed by a max-pooling operation.
The encoded feature maps are then passed to the decoder, where upsampling is performed using transposed convolutions. Skip connections are employed to fuse low-level features from the encoder with high-level semantic features in the decoder to restore the feature mapping to the original mapping resolution. Finally, a Softmax activation function is used to predict the oil spill area.
3.1. Encoders
3.1.1. Residual Attention Module
The oil spill regions typically exhibit characteristics such as small scale, irregular shape and low contrast with the background. Traditional convolutional architectures are susceptible to interference during feature extraction, making it difficult to accurately identify target regions within complex marine backgrounds, as shown in Figure 3. For this reason, we integrate residual blocks and an attention mechanism into the encoder to enhance the network’s ability to capture key regional features.
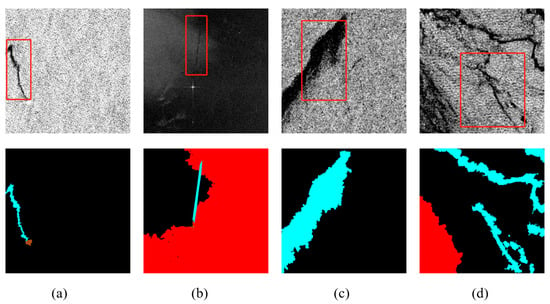
Figure 3.
Four different examples of SAR oil spill images. (a) Oil spill region against a bright background; (b) Oil spill region against a dark background; (c) Oil spill region with blurred boundary; (d) Fragmented oil film region. The red boxes highlight the oil spill areas of interest.
The encoder adopts ResNet residual block as its foundational architecture, as illustrated in Figure 4a. Traditional convolutional and fully connected layers often suffer from information loss during forward propagation. ResNet achieves the direct transfer of information through residual connection and avoids the problem of feature disappearance across deep layers. Furthermore, the use of depthwise separable convolution in place of the standard 3 × 3 convolution in the residual block reduces parameter count, reduces the data dependency and lowers overfitting risk, as depicted in Figure 4b.
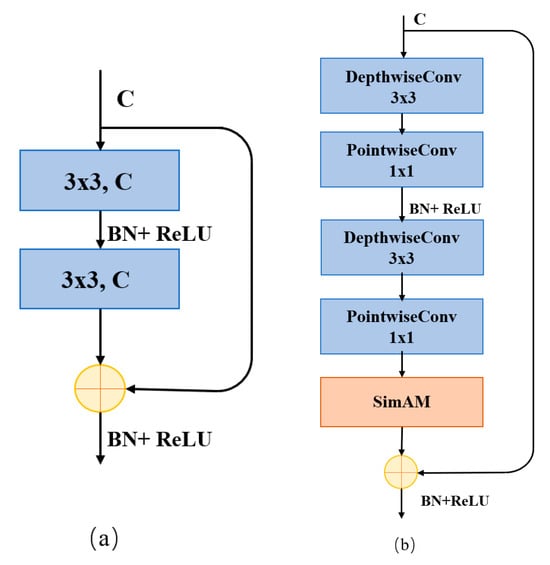
Figure 4.
(a) Ordinary residual structure; (b) SimAM-enhanced residual structure. The arrows indicate the direction of feature propagation, and the yellow circle represents residual addition.
For an input feature map , the residual connection is formulated as:
where is the transformation output of the residual block.
To achieve parameter-free spatial attention enhancement, we adopt the SimAM mechanism. In contrast to existing channel-wise and spatial-wise attention modules, such as SE and CBAM, the SimAM infers 3-D attention weights for the feature map in a layer introduces no additional trainable parameters to the original network. Quantitative evaluations conducted by Yang et al. [39] have demonstrated that their proposed SimAM module performs comparably to other attention mechanisms across various vision tasks.
It involves only a single hyperparameter , which serves as a regularization term to stabilize the variance-based energy computation. In our implementation, is empirically set to , following the original design guidelines. The core idea is to estimate the importance of each neuron by computing an energy function. Specifically, the energy function is defined as follows:
where t is the target neuron, is the regularization coefficient, is the average value of all neurons and is the variance of all neurons. They are calculated as follows:
where M denotes the total number of neurons in a channel, represents other neurons in the input feature channel.
The importance of each neuron can be calculated using . Finally, the attention map is generated and applied to the original feature map through the sigmoid activation of the energy values.
where E groups all e across the channel and spatial dimensions.
This approach effectively suppresses background regions with high energy and emphases salient regions with high expressive power without introducing any additional trainable parameters.
The final encoder of LRA-UNet architecture comprises SimAM-based residual blocks and max-pooling layers.
3.1.2. Depthwise Separable Convolution
The UNet architecture replaces traditional convolution with depthwise separable convolution to build a lightweight semantic segmentation model. This approach consists of depthwise convolution and pointwise convolution, as illustrated in Figure 5.

Figure 5.
Depthwise separable convolutional structure. The green arrows indicate data flow. Orange, red, blue, and green blocks represent the input, depthwise convolutions, pointwise convolutions, and output, respectively.
During the depthwise convolution stage, the input feature map with dimensions is processed by applying a separate convolution kernel to each channel independently, producing an output feature map of the same spatial dimensions as the input. Following this, N pointwise convolutions with kernel size are applied across the channel dimension, generating a new set of feature maps with updated channel representations.
In Figure 5, are the input feature map dimensions; are the output feature map dimensions; is the number of input channels; is the number of output channels; and is the convolution kernel size.
The computational cost of standard convolution is given by:
The computational cost of depthwise separable convolutional is given by:
According to Equation (8), it can be observed that a deeper network leads to a higher compression ratio, thereby significantly reducing the computational cost.
3.2. Decoder
The output from the feature extraction part of the LRA-UNet is sent to the decoder, where transposed convolutions are employed to progressively restore the spatial resolution of the feature maps. Specifically, a 2 × 2 transposed convolution layer is applied, reducing the number of output channels by half and simultaneously upsampling the feature map to twice its original spatial dimensions.
In semantic segmentation tasks, using downsampling to compress feature information often results in information loss and low resolution. To restore this information, shallow features are fused with deeper features through skip connections. As shown in Figure 2, the encoder output is fused with the corresponding feature map through skip connections to enhance the model’s ability to capture fine-grained details during upsampling.
The spatial resolution of the compressed feature map is progressively reconstructed through five layers of decoding blocks. Finally, a softmax function is used to distinguish between oil spill and non-oil spill regions, generating a prediction with dimensions matching those of the original SAR image.
3.3. Joint Loss Function
In this study, the joint loss function consists of three components: the cross-entropy loss , which ensures overall pixel-wise classification accuracy; the Dice loss , which addresses class imbalance and enhances oil spill segmentation performance; and the edge perception loss , which improves the delineation accuracy of oil spill boundaries. The total loss is defined as:
3.3.1. Cross-Entropy Loss
The cross-entropy loss serves as the basic loss function, measuring the discrepancy between the predicted outputs and the ground truth. It is defined as:
where is the number of classes; is the true label; and is the predicted probability of the model.
3.3.2. Loss Dice Loss
The Dice coefficient is a set similarity measure that evaluates the overlap between predicted results and ground truth labels in segmentation tasks. The Dice loss function is particularly robust to class imbalance. It is defined as:
where and denote the predicted segmentation mask and the ground truth mask, respectively.
3.3.3. Edge Perception Loss
The Sobel operator is a classical algorithm that computes the gradient components at each pixel. The Marr-Hildreth operator detects edges by combining Gaussian filtering with the Laplacian operator. While both operators achieved comparable segmentation accuracy, Sobel was ultimately selected for its lower computational complexity. To better capture the boundaries of oil spill regions, an edge-aware loss based on the Sobel operator is proposed in this study. The Sobel operator kernels for detecting horizontal and vertical gradients are defined in Equations (12) and (13), respectively. The Sobel kernels used are of size , and all gradient computations are implemented using standard convolutional operations with fixed weights. By convolving and with the predicted and ground truth mask images, respectively, the horizontal and vertical gradient maps—, , and —are obtained, representing the intensity gradients along the horizontal and vertical directions. Finally, the L1-norm difference between the predicted and ground truth gradient maps is computed as a structural loss term to measure the consistency between the predicted and actual boundaries. is defined as:
where , ; , ; denotes the L1 norm.
4. Results
4.1. Implementation Details
In this study, PyTorch version 2.1.1 is adopted as the deep learning framework, and all models are trained on an NVIDIA RTX 4060 GPU for 50 epochs. Stochastic Gradient Descent (SGD) is used as the optimizer, with an initial learning rate of , a momentum of 0.9, and a weight decay of 0.0001 to facilitate training. A polynomial decay learning rate scheduler (PolyLR) is employed, and training is terminated when the learning rate decreases to 1 × 10⁻⁶. Experimental results show that setting the batch size to 4 or 16 achieves an optimal trade-off between training efficiency and memory utilization.
4.2. Evaluation Metrics
In this experiment, Intersection over Union (), mean Intersection over Union () and Dice coefficient () are adopted as evaluation metrics to assess the performance of the segmentation models. The calculation formulas are given as follows.
where: is the number of target classes; denotes the number of correctly predicted target pixels; denotes the number of incorrectly predicted target pixels; and denotes the number of target pixels missed by the model; and denote the predicted segmentation mask and the ground truth mask, respectively.
4.3. Algorithm Comparison
This study conducts a comprehensive qualitative and quantitative analysis of the oil spill regions segmented by different models. The segmentation performance is compared across five aspects: leakage detection, false detection, boundary delineation, small target detection, and fragmented oil film reconstruction.
In Figure 6, the first row illustrates the false detection of oil films. Due to strong scattering interferences in the background, UNet and several DeepLabV3+ models erroneously classify non-target regions as oil spills. In contrast, the proposed method effectively suppresses responses to look-alike patterns, significantly reducing the false detection rate. The second row shows an image with low contrast and weak texture features, making it difficult to distinguish oil film regions. UNet and several DeepLabV3+ models fail to detect oil films in certain regions, or only generate scattered and incomplete responses, resulting in obvious missed detections. In contrast, the proposed method can accurately detect the target region even under low signal-to-noise ratio conditions. The third row presents samples with complex oil film-like edge structures. In this scenario, the prediction from UNet and several DeepLabV3+ models exhibit blurred target contours, inaccurate edge localization, and noticeable boundary discontinuities or expansions. In contrast, the proposed method produces clearer and more accurate segmented boundaries that closely match the ground truth, effectively preserving the integrity and accuracy of the target contours. These results demonstrate that the introduced edge-aware loss function significantly enhances the model’s segmentation performance in complex edge scenarios. The fourth row contains samples with multiple small targets. The proposed method accurately detects the main oil film regions while also capturing fine-grained targets such as nearby ships. The fifth row presents samples with typical broken oil film structures, where the oil film distribution appears fragmented and discontinuous. UNet and DeepLabV3+ exhibit segmentation discontinuities or erroneous region merging, leading to more misclassified regions. The proposed method can accurately locate each segment of the oil film and effectively restore the true morphology of the oil spill in this scenario.
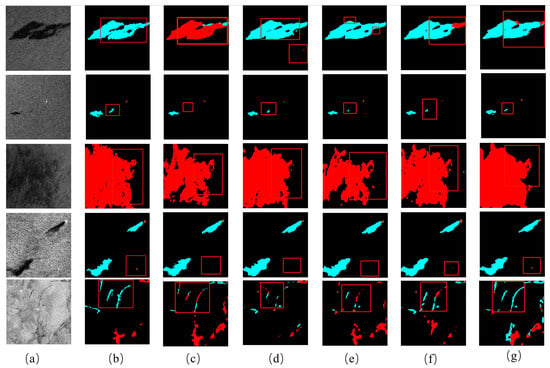
Figure 6.
(a) SAR image; (b) Ground truth mask; (c) UNet; (d) DeepLabV3+ (MobileNetV2); (e) DeepLabV3+ (ResNet50); (f) DeepLabV3+ (ResNet101); (g) Ours. The red boxes highlight the oil spill areas of interest.
This paper conducts a quantitative evaluation of the test images. As shown in Table 2, the best results are highlighted in bold. In terms of overall performance, UNet achieves a relatively low mIoU of 62.95% and a Dice coefficient of 0.7005, whereas the DeepLabV3+ series shows a significant improvement with the introduction of ResNet50 as the backbone, achieving an mIoU of 63.59% and a Dice score of 0.7068. The proposed method improves the mIoU by 4.41% and the Dice coefficient by 0.0448 through the introduction of the joint loss function, outperforming all other compared methods. From the IoU analysis across different categories, the proposed method achieves an IoU of 65.29% in the “Oil Spill” category, which is 5.17% higher than that of UNet, indicating stronger feature representation capabilities for oil film detection. In the “Ship” category, the improvement is particularly significant, with the IoU reaching 42.97% after applying the joint loss function, demonstrating enhanced recognition ability for small targets. For the “Look-Alike” category, although UNet and several DeepLabV3+ models exhibit false detections, the proposed method incorporates the SimAM attention mechanism into the encoder’s residual blocks, improving the IoU in this category to 41.41% and significantly reducing the false detection rate.

Table 2.
Comparison of LRA-UNet with other oil spill segmentation methods.
4.4. Ablation Study
To independently verify the effect of each module, ablation studies were conducted using UNet as the baseline. Depthwise separable convolution (DSConv), the residual attention module (Residual + SimAM), and the joint loss function (Joint Loss) were progressively introduced on this baseline. The experimental results are shown in Table 3.

Table 3.
Results of the ablation study. ✓ indicates the inclusion of the corresponding module. The best results are highlighted in bold.
With the introduction of DSConv, the model maintains strong feature extraction capabilities while significantly reducing the number of parameters and computational complexity, resulting in a 1.05% improvement in mIoU and a 0.0105 increase in Dice. Further incorporating the residual attention module enhances the model’s ability to capture features from key regions, leading to an additional 1.59% increase in mIoU and 0.0139 increase in Dice. Finally, the introduction of the Joint loss function for boundary perception during training further strengthens the model’s ability to discriminate edge structures, resulting in another 1.77% improvement in mIoU and 0.0204 increase in Dice, achieving the best overall performance.
4.5. Effect of the Joint Loss Function on Model Performance
To further validate the effectiveness of the proposed joint loss function in the model training process, this study compares the performance of the original UNet, the proposed model (Ours), and the proposed model augmented with Joint Loss (Ours (Joint Loss)) on the validation set. As illustrated in Figure 7, the IoU curves of the three models indicate that Ours (Joint Loss) achieves a significantly faster convergence rate in the early stages of training and consistently maintains a higher IoU throughout the entire training process, clearly outperforming the other models. This demonstrates the superior segmentation accuracy achieved through the use of the joint loss. In contrast, both the original UNet and the improved model without the joint loss exhibit slower convergence and greater performance fluctuations during training. Figure 8 presents the accuracy curves of the three models on the validation set. It can be observed that although the accuracy of all models tends to stabilize in the later stages, Ours (Joint Loss) consistently achieves higher accuracy with the least fluctuation. This indicates enhanced robustness and generalization capability during training. In summary, the joint loss function significantly enhances segmentation performance, particularly in handling intricate edge features in SAR imagery.
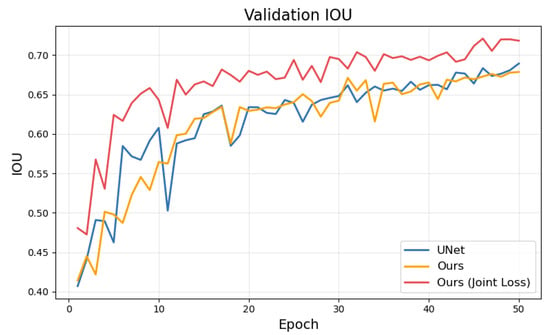
Figure 7.
Comparison of IoU values for different models on the validation set.
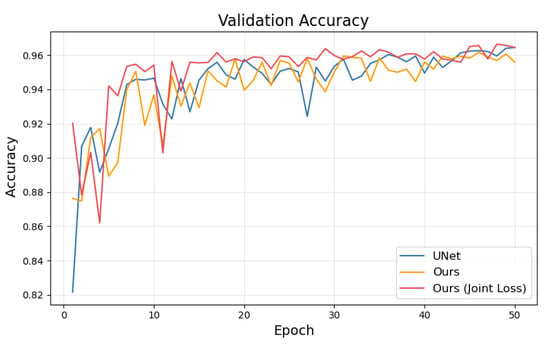
Figure 8.
Comparison of Accuracy values for different models on the validation set.
In addition to quantitative metrics, a visual comparison was performed to further validate the joint loss function’s impact on boundary segmentation. As shown in Figure 9, a visual comparison on three SAR image samples—representing oil spill, look-alike, and land boundaries—demonstrates the differences in boundary delineation between the ground truth, the baseline UNet, and the proposed model with joint loss. The red boxes highlight regions where precise boundary delineation is critical. The joint loss enhances boundary sharpness and continuity, confirming its effectiveness in edge segmentation.
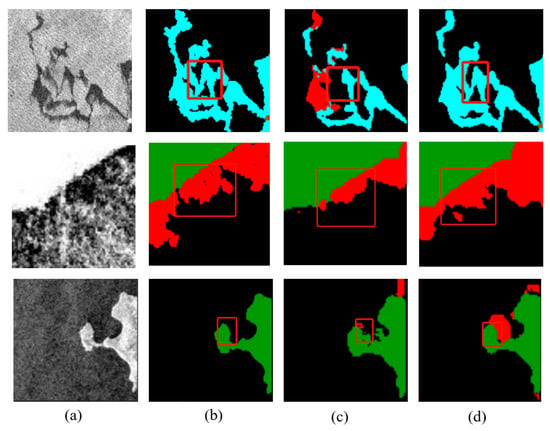
Figure 9.
Visual comparison of segmentation results on SAR images. (a) SAR image; (b) Ground truth mask; (c) UNet; (d) Ours. The red boxes highlight the oil spill areas of interest.
5. Discussion
LRA-UNet, like CBD-Net [33], DAM-UNet [32], and DeepLabV3, follows an encoder-decoder architecture, but differs in several key components. DeepLabV3 employs a backbone combined with dilated convolutions in the encoder to capture multi-scale features and uses bilinear upsampling to restore spatial resolution. UNet adopts a symmetric encoder-decoder structure with skip connections that integrate low-level details during upsampling, enabling finer spatial restoration. Our proposed model builds upon the UNet framework. Similar to CBD-Net, it adopts residual blocks in the encoder for feature extraction, while retaining a complete downsampling and upsampling path to ensure the effective transmission of multi-scale information. Unlike DAM-UNet, which introduces dual attention modules in skip connections, LRA-UNet incorporates the parameter-free SimAM attention module after each residual block to enhance the response to salient regions. Furthermore, depthwise separable convolutions are employed in place of standard convolutions to reduce computational cost and achieve a lightweight architecture.
The proposed model achieves improved segmentation accuracy on SAR oil spill imagery. Compared to the baseline UNet, it increases the mean IoU by 4.41% and enhances the IoU for the “oil spill” class by 5.17%, demonstrating stronger recognition capabilities in complex backgrounds.
Although the proposed model demonstrates better performance in segmenting large-scale oil spill regions, it still suffers from missed detections in small and low-contrast spill patches. Future work will explore multi-scale feature fusion mechanisms to enhance the model’s sensitivity to small-scale oil spill areas. Given the presence of speckle noise in low-contrast oil spill regions, superpixel methods [40], with their strong spatial consistency and boundary-preserving properties, have shown effectiveness in suppressing such noise. Future research will focus on improving superpixel segmentation techniques and incorporating them as an image processing process.
6. Conclusions
This paper proposes a SAR image oil spill detection method to tackle blurred target boundaries, strong look-alike interference, and small target detection challenges in maritime remote sensing images. The LRA-UNet integrates residual attention modules, depthwise separable convolutions, and a Sobel-based boundary-aware loss function to reduce false detections and missed detections while improving boundary segmentation accuracy and overall detection performance. Compared with the baseline UNet and other competing models, LRA-UNet achieves superior recognition accuracy under complex marine backgrounds, with a mIoU of 67.36%, representing a 4.41% improvement over the baseline. Specifically, the IoU for the “oil spill” class increased by 5.17%. Future work will focus on incorporating multi-scale feature fusion strategies and superpixel segmentation techniques to improve the model’s sensitivity to small-scale oil spills and enhance robustness against speckle noise in SAR imagery.
Author Contributions
Writing—original draft, Y.C.; methodology, J.S. (Jingjing Su); software, D.X.; validation, G.S. and L.Z.; funding acquisition, J.S. (Jun Song). All authors have read and agreed to the published version of the manuscript.
Funding
Science and Technology Plan of Liaoning Province (2024JH2/102400061); Dalian Science and Technology Innovation Fund (2024JJ11PT007); Dalian Science and Technology Program for Innovation Talents of Dalian (2022RJ06); Liaoning Province Education Department Scientific research platform construction project (LJ232410158056); Basic scientific research funds of Dalian Ocean University (2024JBPTZ001).
Data Availability Statement
The Oil Spill Detection Dataset we processed is from the European. Space Agency (ESA) and is available online at https://m4d.iti.gr/oil-spill-detection-dataset/ (accessed on 1 May 2020).
Acknowledgments
We thank the Data Support from National Marine Scientific Data Center (Dalian), National Science & Technology Infrastructure of China (http://odc.dlou.edu.cn/, accessed on 28 September 2024), Liaoning Marine Scientific Data Center, Dalian Marine Scientific Data Center for providing valuable data and information. We also thank the reviewers for carefully reviewing the manuscript and providing valuable comments to help improve this paper.
Conflicts of Interest
The authors declare no conflicts of interest.
Abbreviations
The following abbreviations are used in this manuscript:
| SAR | Synthetic aperture radar |
| SimAM | Simple Attention Module |
| CNN | Convolutional neural network |
| FCN | Full convolutional network |
| LRA-UNet | Lightweight Residual Attention U-Net |
| ANN | Artificial Neural Networks |
| DTs | Decision Trees |
| RFs | Random Forests (RFs) |
References
- Cakir, E.; Sevgili, C.; Fiskin, R. An analysis of severity of oil spill caused by vessel accidents. Transp. Res. Part D Transp. Environ. 2021, 90, 102662. [Google Scholar] [CrossRef]
- Solberg, A.H.S. Remote sensing of ocean oil-spill pollution. Proc. IEEE 2012, 100, 2931–2945. [Google Scholar] [CrossRef]
- Chen, J.; Di, Z.; Shi, J.; Shu, Y.; Wan, Z.; Song, L.; Zhang, W. Marine oil spill pollution causes and governance: A case study of Sanchi tanker collision and explosion. J. Clean. Prod. 2020, 273, 122978. [Google Scholar] [CrossRef]
- Han, H.; Huang, S.; Liu, S.; Sha, J.; Lv, X. An assessment of marine ecosystem damage from the penglai 19-3 oil spill accident. J. Mar. Sci. Eng. 2021, 9, 732. [Google Scholar] [CrossRef]
- Ouchi, K.; Yoshida, T. On the interpretation of synthetic aperture radar images of oceanic phenomena: Past and present. Remote Sens. 2023, 15, 1329. [Google Scholar] [CrossRef]
- Khaleghian, S.; Ullah, H.; Kræmer, T.; Hughes, N.; Eltoft, T.; Marinoni, A. Sea ice classification of SAR imagery based on convolution neural networks. Remote Sens. 2021, 13, 1734. [Google Scholar] [CrossRef]
- Zhang, S.; Li, X.; Zhang, X. Internal wave signature extraction from SAR and optical satellite imagery based on deep learning. IEEE Trans. Geosci. Remote Sens. 2023, 61, 4203216. [Google Scholar] [CrossRef]
- Fingas, M.; Brown, C.E. A review of oil spill remote sensing. Sensors 2017, 18, 91. [Google Scholar] [CrossRef] [PubMed]
- Alpers, W.; Holt, B.; Zeng, K. Oil spill detection by imaging radars: Challenges and pitfalls. Remote Sens. Environ. 2017, 201, 133–147. [Google Scholar] [CrossRef]
- Zeng, K.; Wang, Y. A deep convolutional neural network for oil spill detection from spaceborne SAR images. Remote Sens. 2020, 12, 1015. [Google Scholar] [CrossRef]
- Xu, J.; Wang, H.; Cui, C.; Zhao, B.; Li, B. Oil spill monitoring of shipborne radar image features using SVM and local adaptive threshold. Algorithms 2020, 13, 69. [Google Scholar] [CrossRef]
- Yu, F.; Sun, W.; Li, J.; Zhao, Y.; Zhang, Y.; Chen, G. An improved Otsu method for oil spill detection from SAR images. Oceanologia 2017, 59, 311–317. [Google Scholar] [CrossRef]
- Al-Ruzouq, R.; Gibril, M.B.A.; Shanableh, A.; Kais, A.; Hamed, O.; Al-Mansoori, S.; Khalil, M.A. Sensors, features, and machine learning for oil spill detection and monitoring: A review. Remote Sens. 2020, 12, 3338. [Google Scholar] [CrossRef]
- Temitope Yekeen, S.; Balogun, A.-L. Advances in remote sensing technology, machine learning and deep learning for marine oil spill detection, prediction and vulnerability assessment. Remote Sens. 2020, 12, 3416. [Google Scholar] [CrossRef]
- Singha, S.; Bellerby, T.J.; Trieschmann, O. Satellite oil spill detection using artificial neural networks. IEEE J. Sel. Top. Appl. Earth Obs. Remote Sens. 2013, 6, 2355–2363. [Google Scholar] [CrossRef]
- Topouzelis, K.; Karathanassi, V.; Pavlakis, P.; Rokos, D. Detection and discrimination between oil spills and look-alike phenomena through neural networks. Remote Sens. 2007, 62, 264–270. [Google Scholar] [CrossRef]
- Cheng, L.; Li, Y.; Qin, M.; Liu, B. A marine oil spill detection framework considering special disturbances using Sentinel-1 data in the Suez Canal. Mar. Pollut. Bull. 2024, 208, 117012. [Google Scholar] [CrossRef]
- Singha, S.; Ressel, R.; Velotto, D.; Lehner, S. A combination of traditional and polarimetric features for oil spill detection using TerraSAR-X. IEEE J. Sel. Top. Appl. Earth Obs. Remote Sens. 2016, 9, 4979–4990. [Google Scholar] [CrossRef]
- Sun, Z.; Sun, S.; Zhao, J.; Ai, B.; Yang, Q. Detection of massive oil spills in sun glint optical imagery through super-pixel segmentation. J. Mar. Sci. Eng. 2022, 10, 1630. [Google Scholar] [CrossRef]
- Topouzelis, K.; Psyllos, A. Oil spill feature selection and classification using decision tree forest on SAR image data. ISPRS J. Photogramm. Remote Sens. 2012, 68, 135–143. [Google Scholar] [CrossRef]
- Tong, S.; Liu, X.; Chen, Q.; Zhang, Z.; Xie, G. Multi-feature based ocean oil spill detection for polarimetric SAR data using random forest and the self-similarity parameter. Remote Sens. 2019, 11, 451. [Google Scholar] [CrossRef]
- Lang, P.; Fu, X.; Dong, J.; Yang, H.; Yin, J.; Yang, J.; Martorella, M. Recent Advances in Deep Learning Based SAR Image Targets Detection and Recognition. IEEE J. Sel. Top. Appl. Earth Obs. Remote Sens. 2025, 18, 6884–6915. [Google Scholar] [CrossRef]
- Xiao, Y.; Tian, Z.; Yu, J.; Zhang, Y.; Liu, S.; Du, S.; Lan, X. A review of object detection based on deep learning. Multimedia Tools Appl. 2020, 79, 23729–23791. [Google Scholar] [CrossRef]
- Sehar, U.; Naseem, M.L. How deep learning is empowering semantic segmentation: Traditional and deep learning techniques for semantic segmentation: A comparison. Multimed. Tools Appl. 2022, 81, 30519–30544. [Google Scholar] [CrossRef]
- Alokasi, H.; Ahmad, M.B. Deep learning-based frameworks for semantic segmentation of road scenes. Electronics 2022, 11, 1884. [Google Scholar] [CrossRef]
- Zhang, J.; Zhao, X.; Chen, Z.; Lu, Z. A review of deep learning-based semantic segmentation for point cloud. IEEE Access 2019, 7, 179118–179133. [Google Scholar] [CrossRef]
- Najafizadegan, S.; Danesh-Yazdi, M. Variable-complexity machine learning models for large-scale oil spill detection: The case of Persian Gulf. Mar. Pollut. Bull. 2023, 195, 115459. [Google Scholar] [CrossRef]
- Baek, W.-K.; Jung, H.-S. Performance comparison of oil spill and ship classification from x-band dual-and single-polarized sar image using support vector machine, random forest, and deep neural network. Remote Sens. 2021, 13, 3203. [Google Scholar] [CrossRef]
- Long, J.; Shelhamer, E.; Darrell, T. Fully convolutional networks for semantic segmentation. In Proceedings of the IEEE Conference on Computer Vision and Pattern Recognition, Boston, MA, USA, 7–12 June 2015; pp. 3431–3440. [Google Scholar]
- Ronneberger, O.; Fischer, P.; Brox, T. U-net: Convolutional networks for biomedical image segmentation. In Proceedings of the Medical Image Computing and Computer-Assisted Intervention–MICCAI 2015: 18th International Conference, Munich, Germany, 5–9 October 2015; pp. 234–241. [Google Scholar]
- Krestenitis, M.; Orfanidis, G.; Ioannidis, K.; Avgerinakis, K.; Vrochidis, S.; Kompatsiaris, I. Oil spill identification from satellite images using deep neural networks. Remote Sens. 2019, 11, 1762. [Google Scholar] [CrossRef]
- Mahmoud, A.S.; Mohamed, S.A.; El-Khoriby, R.A.; AbdelSalam, H.M.; El-Khodary, I.A. Oil spill identification based on dual attention UNet model using Synthetic Aperture Radar images. J. Indian Soc. Remote Sens. 2023, 51, 121–133. [Google Scholar] [CrossRef]
- Zhu, Q.; Zhang, Y.; Li, Z.; Yan, X.; Guan, Q.; Zhong, Y.; Zhang, L.; Li, D. Oil spill contextual and boundary-supervised detection network based on marine SAR images. IEEE Trans. Geosci. Remote Sens. 2021, 60, 5213910. [Google Scholar] [CrossRef]
- Yekeen, S.T.; Balogun, A.L.; Yusof, K.B.W. A novel deep learning instance segmentation model for automated marine oil spill detection. ISPRS J. Photogramm. Remote Sens. 2020, 167, 190–200. [Google Scholar] [CrossRef]
- Chen, G.; Li, Y.; Sun, G.; Zhang, Y. Application of deep networks to oil spill detection using polarimetric synthetic aperture radar images. Appl. Sci. 2017, 7, 968. [Google Scholar] [CrossRef]
- Guo, H.; Wei, G.; An, J. Dark spot detection in SAR images of oil spill using segnet. Appl. Sci. 2018, 8, 2670. [Google Scholar] [CrossRef]
- Cantorna, D.; Dafonte, C.; Iglesias, A.; Arcay, B. Oil spill segmentation in SAR images using convolutional neural networks. A comparative analysis with clustering and logistic regression algorithms. Appl. Soft Comput. 2019, 84, 105716. [Google Scholar] [CrossRef]
- Satyanarayana, A.R.; Dhali, M.A. Oil Spill Segmentation using Deep Encoder-Decoder models. arXiv 2023, arXiv:2305.01386. [Google Scholar]
- Yang, L.; Zhang, R.-Y.; Li, L.; Xie, X. Simam: A simple, parameter-free attention module for convolutional neural networks. In Proceedings of the International Conference on Machine Learning, Virtual, 18–24 July 2021; pp. 11863–11874. [Google Scholar]
- Cheng, L.; Li, Y.; Zhao, K.; Liu, B.; Sun, Y. A Two-Stage Oil Spill Detection Method Based on an Improved Superpixel Module and DeepLab V3+ Using SAR Images. IEEE Geosci. Remote Sens. Lett. 2024, 22, 4000505. [Google Scholar] [CrossRef]
Disclaimer/Publisher’s Note: The statements, opinions and data contained in all publications are solely those of the individual author(s) and contributor(s) and not of MDPI and/or the editor(s). MDPI and/or the editor(s) disclaim responsibility for any injury to people or property resulting from any ideas, methods, instructions or products referred to in the content. |
© 2025 by the authors. Licensee MDPI, Basel, Switzerland. This article is an open access article distributed under the terms and conditions of the Creative Commons Attribution (CC BY) license (https://creativecommons.org/licenses/by/4.0/).