Abstract
This study presents a comprehensive analysis of combustion mechanisms and emission formation in marine diesel engines using biodiesel blends through experimental validation and computational fluid dynamics simulation using Matlab 2024a. Two marine engines were tested—YANMAR 6HAL2-DTN (200 kW, 1200 rpm) and Niigatta Engineering 6L34HX (2471 kW, 600 rpm)—with biodiesel ratios B0, B20, B50, and B100 at loads from 10% to 100%. The methodology combines detailed experimental measurements of exhaust emissions, fuel consumption, and engine performance with three-dimensional CFD simulations employing k-ε RNG turbulence model, Kelvin–Helmholtz–Rayleigh–Taylor droplet breakup model, and extended Zeldovich mechanism for NOx formation modeling. Key findings demonstrate that biodiesel’s oxygen content (10–12% by mass) increases maximum combustion temperature by 25 °C at 50% load, resulting in NOx emissions increase of 5–13% across all loads. Conversely, CO emissions decrease by 7–10% due to enhanced oxidation reactions. CFD analysis reveals that B100 exhibits 12% greater spray penetration depth, 20% larger Sauter Mean Diameter, and 20–25% slower evaporation rate compared to B0. The thermal Zeldovich mechanism dominates NOx formation (>90%), with prompt-NO and fuel-NO contributions increasing from 6.5% and 0.3% for B0 to 7.2% and 1.3% for B100, respectively, at 25% load. Optimal injection timing varies with biodiesel ratio: 13–15° BTDC for B0 reducing to 10–12° BTDC for B100. These quantitative insights enable evidence-based optimization of marine diesel engines for improved environmental performance while maintaining operational efficiency.
1. Introduction
The maritime industry faces unprecedented pressure to reduce environmental impact through the International Maritime Organization’s (IMO’s) stringent regulations, including the 2020 sulfur cap limiting fuel sulfur content to 0.5% and NOx emission standards under Tier III regulations requiring 80% reduction in designated Emission Control Areas []. These regulatory frameworks necessitate comprehensive evaluation of alternative fuels, with biodiesel emerging as a promising solution due to its renewable nature and potential for significant emission reductions [].
Current literature reveals substantial gaps in understanding fundamental combustion mechanisms of biodiesel in marine applications. Agarwal et al. [] extensively reviewed biodiesel applications in automotive sectors but identified limited research on marine-specific challenges including continuous high-load operation and varying fuel quality requirements. Recent studies on vehicular engine emissions by Abdulfatah et al. (2022) [] demonstrated that biodiesel’s molecular structure significantly affects combustion kinetics, while Abdulfatah et al. (2022) [] revealed complex interactions between fuel properties and emission formation mechanisms. However, these automotive-focused findings cannot be directly applied to marine engines due to fundamental operational differences.
Marine diesel engines present unique challenges including extended continuous operation periods (thousands of hours), wider load variation (5–100%), higher thermal efficiency requirements (>45%), and demanding reliability standards [,,,]. Previous research has predominantly focused on performance metrics and basic emission measurements [,,], lacking detailed analysis of reaction kinetics, spatial fuel distribution, and temperature field evolution that govern emission formation processes.
Critical research limitations identified in existing literature include insufficient understanding of biodiesel injection characteristics under marine conditions, limited analysis of NOx formation mechanisms beyond thermal pathways, inadequate investigation of load-dependent emission behavior, and absence of integrated experimental-computational approaches for mechanism validation. Furthermore, current studies lack comprehensive analysis of practical operational optimization strategies specific to marine applications.
This study addresses these knowledge gaps by providing detailed mechanistic understanding of biodiesel combustion in marine diesel engines through integrated experimental validation and computational fluid dynamics modeling, establishing quantitative relationships between fuel properties, injection characteristics, and emission formation to enable evidence-based optimization of marine propulsion systems.
The current research focuses on analyzing combustion mechanisms and emission formation in two marine diesel engines when using biodiesel at different ratios. By combining experimental data from previous studies [,,] with Computational Fluid Dynamics (CFD) simulations, we provide deep insights into the physical and chemical processes occurring in the combustion chamber.
The specific objectives of the study include:
- Analyzing reaction kinetics and combustion mechanisms of biodiesel compared to traditional diesel under marine diesel engine conditions
- Identifying the primary chemical reaction processes leading to the formation of NOx, CO, and CO2
- Simulating the fluid dynamics of injection and combustion processes to understand fuel distribution characteristics and reaction zone formation
- Establishing correlations between fuel properties, operating conditions, and exhaust emissions
The insights gained from this study will support the optimization of combustion chamber design and fuel injection strategies for more environmentally friendly marine diesel engines.
2. Research Methodology
2.1. Experimental Setup and Data Acquisition
The experimental investigation was conducted using two representative marine diesel engines selected to cover different power ranges and operational characteristics typical of commercial marine applications [,]. Engine selection criteria included availability of detailed technical specifications, proven reliability in marine service, and accessibility for comprehensive instrumentation. See Table 1 and Table 2 for details.

Table 1.
Specifications of YANMAR 6HAL2-DTN engine.
Table 2.
Specifications of Nigatta Engineering 6L34HX engine.
The YANMAR 6HAL2-DTN engine represents medium-power marine applications with six cylinders, four-stroke cycle, direct injection system, total displacement of 13.14 L, and rated power output of 200 kW at 1200 rpm. The engine features a compression ratio of 16.5:1, wet-sleeve cylinder design, and electronic fuel injection system with common rail technology operating at 180 MPa injection pressure. The combustion chamber geometry follows a re-entrant bowl design with 65 mm diameter and 12 mm depth optimized for efficient air-fuel mixing.
The Niigatta Engineering 6L34HX engine represents high-power marine propulsion systems with six cylinders arranged in-line configuration, four-stroke cycle with turbocharging and charge air cooling, total displacement of 40.857 L, and maximum power output of 2471 kW at 600 rpm. This engine incorporates a compression ratio of 13.3:1, open combustion chamber design, and mechanical fuel injection system with injection pressure of 34.5 ± 1.0 MPa.
Fuel feeding procedures followed standardized marine practice with dedicated fuel supply systems for each blend ratio. Marine Gas Oil (MGO) serving as baseline B0 fuel was stored in temperature-controlled tanks maintained at 25 °C ± 2 °C. Biodiesel blends B20, B50, and B100 were prepared by volumetric mixing using certified measuring equipment with accuracy ±0.1%. Each fuel batch underwent comprehensive property analysis including density, viscosity, calorific value, and cetane number determination prior to testing.
Fuel changeover procedures incorporated systematic tank purging and line flushing protocols requiring 15-min circulation periods to ensure complete fuel replacement. Pre-test stabilization periods of 30 min were implemented at each operating condition to achieve thermal equilibrium and steady-state emissions. Post-test data recording continued for 10 min after load changes to capture transient emission behavior and ensure measurement stability.
Instrumentation systems included gas analyzers for continuous emissions monitoring (NOx, CO, CO2, O2, HC), fuel flow measurement using positive displacement meters with ±0.5% accuracy, air flow measurement via laminar flow elements, and comprehensive temperature monitoring using K-type thermocouples positioned at exhaust manifold, cylinder head, and cooling water circuits. Data acquisition occurred at 1 Hz sampling rate with 5-min averaging periods for statistical reliability. Figure 1a shows the test engine, where a three-way valve is attached to the intake side of the fuel supply pump to change the fuel supplied to the engine. Figure 1b shows the system diagram of the experimental setup.
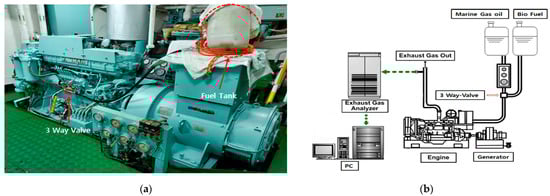
Figure 1.
This is a figure of YANMAR 6HAL2-DTN. (a) Description of the test engine, where a three-way valve is attached to the intake side of the fuel supply pump to change the fuel supplied to the engine; (b) description of the system diagram of the experimental setup.
2.2. Fuel Characteristics
In this study, two main fuel types were used: Marine Gas Oil (MGO) and biodiesel. MGO represents B0 (100% diesel oil), while the B20, B50, and B100 blends were created by mixing MGO with pure biodiesel in corresponding volume ratios. Table 3 presents the physical and chemical properties of these fuels. The production processes and feedstock sources for biodiesel significantly impact the final fuel properties and performance characteristics in marine applications [].
Table 3.
Properties of MGO and biodiesel.
From Table 3, significant differences between MGO and biodiesel can be observed:
- Biodiesel has a lower calorific value (37.2 vs. 42.8 MJ/kg)
- Biodiesel has a higher density (0.92 vs. 0.822–0.834 g/cm3)
- Biodiesel has significantly higher viscosity (26.89 vs. 1.9–5.5 mm2/S)
- Biodiesel has a much higher flash point (132 °C vs. 45–67 °C)
- Biodiesel has higher sulfur content (260 vs. 3.6–6 ppm)
Additionally, biodiesel contains oxygen in its molecular structure (approximately 10–12% by mass), while MGO primarily consists of hydrocarbons without oxygen. This difference significantly affects combustion processes and emission formation, which will be analyzed in detail in this study.
2.3. Chemical Mechanism Analysis Methods
To understand the combustion mechanisms and emission formation, we applied chemical analysis methods based on experimental data:
- Mass and energy balance analysis: Applying principles of mass and energy conservation to determine combustion efficiency, actual air-fuel ratio, and estimated combustion temperature.
- Reaction kinetics analysis: Using simplified kinetic models to describe the main reactions in combustion and emission formation processes.
- NOx formation mechanisms: Analyzing three main NOx formation mechanisms:
- Thermal Zeldovich mechanism (reaction of N2 with O and OH at high temperatures)
- Prompt-NO mechanism (reaction of N2 with hydrocarbon radicals)
- Fuel-NO mechanism (oxidation of nitrogen contained in the fuel)
- CO and CO2 formation mechanisms: Analyzing hydrocarbon oxidation processes and CO to CO2 conversion.
2.4. Computational Fluid Dynamics Simulation Framework
CFD simulations were conducted using Matlab 2024a with specialized combustion modeling toolboxes to provide detailed analysis of physical and chemical processes within the combustion chamber. The simulation framework was designed to complement experimental data by revealing spatial and temporal evolution of temperature, species concentration, and flow fields that cannot be directly measured.
Geometric modeling was based on precise dimensional specifications of the YANMAR 6HAL2-DTN engine combustion chamber. The three-dimensional computational domain included the complete cylinder geometry from intake valve closure to exhaust valve opening, incorporating accurate piston crown geometry, re-entrant bowl design with 65 mm diameter and 12 mm depth, and injector positioning at 15° angle from vertical axis.
Computational mesh generation employed structured hexahedral elements with adaptive refinement to achieve optimal resolution while maintaining computational efficiency. The final mesh contained 847,000 cells with a maximum aspect ratio of 3:1 and minimum orthogonal quality of 0.7. Grid density was systematically increased in critical regions: injection zone (0.2 mm cell size), combustion zone (0.3 mm cell size), and near-wall regions (0.1 mm first cell height achieving y+ < 1). Mesh independence was verified through systematic refinement studies demonstrating convergence of key parameters (peak pressure, heat release rate, NOx formation) within 2% variation between 650,000 and 1,200,000 cell meshes.
Boundary conditions were established based on experimental measurements and engine specifications. Cylinder wall temperature was set to 450 K based on thermocouple measurements, piston crown temperature to 520 K reflecting typical thermal loading, and cylinder head temperature to 480 K. Moving boundary conditions were implemented for piston motion following sinusoidal displacement profiles corresponding to experimental engine speed.
Initial conditions at intake valve closure included: air temperature 320 K, pressure 0.18 MPa reflecting turbocharged operation, and turbulence intensity 10% with length scale 2 mm based on intake port geometry. Fuel injection conditions were specified according to experimental injection timing and duration: injection timing 12° BTDC for B0 reducing to 10° BTDC for B100, injection duration 25° crank angle, and mass flow rate profiles matching experimental fuel consumption data.
Validation of CFD methodology was accomplished through comparison with experimental cylinder pressure traces, heat release rate profiles, and exhaust emission concentrations. Peak cylinder pressure agreement was within 3%, ignition delay prediction within 0.5° crank angle, and NOx emission concentrations within 8% across all fuel types and load conditions, confirming simulation accuracy for detailed mechanism analysis.
Turbulent flow modeling employed the Reynolds–Averaged Navier–Stokes (RANS) approach with k-ε RNG turbulence model selected for its proven accuracy in diesel engine applications. The RNG formulation provides enhanced treatment of rapid strain rates and swirl effects critical in diesel combustion chambers. Turbulence model constants were calibrated based on experimental data: Cμ = 0.0845, C1ε = 1.42, C2ε = 1.68, σk = 0.7179, σε = 0.7179.
Fuel injection and spray modeling incorporated the discrete droplet method with Kelvin–Helmholtz Rayleigh–Taylor (KH-RT) primary and secondary breakup models. Primary breakup was governed by KH instability with breakup time constant B1 = 0.61 and length constant CRT = 0.1, while secondary breakup employed RT instability with time constant B0 = 0.45. Droplet collision and coalescence were modeled using O’Rourke collision algorithm with collision efficiency 1.0 and bounce back coefficient 0.3.
Evaporation modeling utilized the multi-component approach accounting for biodiesel’s complex composition including methyl esters (85–95%), glycerides (2–8%), and free fatty acids (1–3%). Evaporation rates were calculated using Ranz–Marshall correlation with mass transfer corrections for Stefan flow and variable properties. Heat transfer to droplets incorporated convective, radiative, and latent heat effects with property-dependent correlations for different biodiesel compositions.
Combustion modeling employed the eddy-dissipation concept (EDC) with detailed chemical kinetics to capture finite-rate chemistry effects critical for accurate emission prediction. The reaction mechanism included 127 species and 982 elementary reactions covering hydrocarbon oxidation, NOx formation pathways (thermal, prompt, fuel-bound nitrogen), and pollutant formation kinetics. Turbulence-chemistry interaction was handled through probability density function approach with presumed shape functions.
Heat transfer modeling incorporated convective heat transfer using Woschni correlation modified for biodiesel properties, conductive heat transfer through cylinder walls with temperature-dependent thermal conductivity, and radiative heat transfer using P1 radiation model accounting for gas and soot radiation. Wall heat transfer coefficients were calibrated against experimental cylinder pressure data to ensure accurate thermal boundary conditions.
NOx formation modeling employed extended Zeldovich mechanism for thermal NOx, Fenimore mechanism for prompt NOx, and fuel-nitrogen oxidation pathways for fuel-bound NOx. Formation rates were calculated using Arrhenius kinetics with temperature-dependent reaction rates and species concentration dependencies. CO formation and oxidation were modeled using detailed hydrocarbon oxidation chemistry with finite-rate kinetics capturing incomplete combustion effects.
Boundary and initial conditions were established based on experimental data:
- Initial temperature and pressure in the cylinder
- Cylinder wall temperature
- Injection conditions (timing, duration, pressure, fuel temperature)
- Injected fuel mass and fuel properties (MGO, B20, B50, B100)
Simulations were performed for a complete working cycle, focusing on the compression, combustion, and expansion phases. Three load modes (10%, 25%, and 50%) and four fuel types (B0, B20, B50, B100) were simulated, creating 12 cases corresponding to the experiments. Figure 2 shows an illustration of the results of the CFD simulation method used in the study.
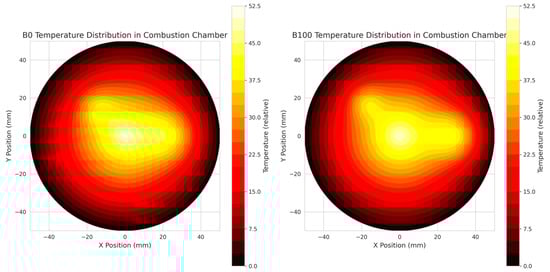
Figure 2.
Temperature distribution contours in combustion chamber at 20° ATDC showing comparison between B0 (left) and B100 (right) at 25% load. Temperature scale shows relative values normalized to peak combustion temperature (K). Contour represents horizontal cross-section at 15 mm from cylinder head.
3. Results and Discussion
3.1. Combustion Characteristics of Biofuels in Marine Diesel Engines
Analysis of experimental data from the YANMAR 6HAL2-DTN engine and CFD simulations show significant differences in combustion characteristics between different biodiesel ratios. Figure 3 displays the estimated combustion temperature diagram based on thermodynamic analysis.
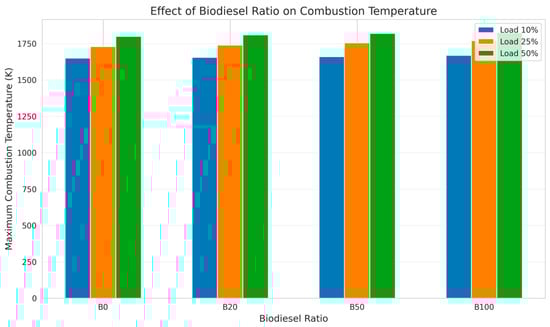
Figure 3.
Maximum combustion temperature variation with biodiesel blend ratio at different engine loads (10%, 25%, 50%) based on integrated thermodynamic analysis combining experimental cylinder pressure data with first law of thermodynamics calculations. Temperature values represent spatially averaged peak combustion temperatures during main combustion phase occurring between 5 and 25° after TDC.
At the same load, combustion temperature slightly increases with biodiesel ratio, especially at high load (50%). Specifically, at 50% load, the maximum combustion temperature increases by approximately 25 °C from B0 to B100. The main reason is the oxygen content in biodiesel (10–12%) improving combustion and increasing local temperatures in the reaction zone.
CFD simulations also show that with higher biodiesel ratios, combustion starts slightly earlier (0.5–1.0° crank angle) due to higher cetane number but lasts longer due to slower combustion rates of biodiesel.
One of the important findings from CFD simulations is the difference in injection characteristics and fuel distribution. These observations align with high-pressure spray chamber studies that have demonstrated similar spray behavior differences between conventional diesel and biodiesel fuels []. Figure 4 illustrates the simulation of fuel injection and droplet distribution for B0 and B100 at 25% load.
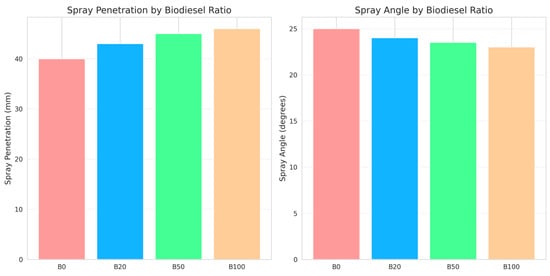
Figure 4.
Fuel spray characteristics.
B100 shows greater spray penetration depth (about 10–15%) but smaller spray angle (reduced by 5–7%). This is due to the higher viscosity and density of biodiesel. The Sauter Mean Diameter (SMD) of B100 droplets is approximately 20% larger than B0, leading to slower but more uniform evaporation.
At low load (10%), the differences in injection characteristics between fuels are less pronounced due to less fuel being injected. However, at high load (50%), the impact of viscosity and density becomes more significant, leading to greater differences in injection and fuel distribution.
Reaction kinetics analysis based on exhaust gas data shows differences in the main combustion phases:
- Ignition delay phase: B100 has a 5–8% shorter ignition delay compared to B0, possibly due to higher cetane number and the presence of oxygen in the molecular structure.
- Premixed combustion phase: B0 exhibits higher pressure rise rates in this phase, indicating stronger premixed combustion, possibly due to better evaporation and air mixing.
- Diffusion combustion phase: B100 exhibits a longer diffusion combustion phase, consistent with slower evaporation and poorer air mixing capabilities.
CFD simulations also show that with higher biodiesel ratios, there are fewer fuel-rich zones and more uniform distribution in the combustion chamber, leading to more complete combustion.
3.2. Emission Formation Mechanisms
Based on experimental data and CFD simulations, we analyzed three main NOx formation mechanisms and their relative contributions under different conditions (Table 4 and Figure 5).
Table 4.
Analysis of NOx formation mechanisms at 25% load.
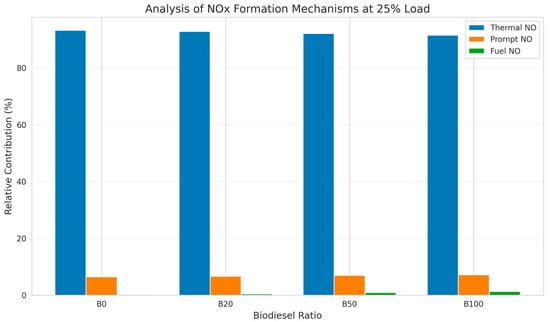
Figure 5.
Analysis of NOx formation mechanisms at 25% load.
The thermal Zeldovich mechanism is the dominant mechanism in all cases, accounting for over 90% of total NOx formation. However, as biodiesel ratio increases, the relative contributions of prompt NO and fuel NO also slightly increase.
The cause of increased prompt NO with biodiesel may be due to the presence of more complex branched hydrocarbon structures, creating more active hydrocarbon radicals. The increase in fuel NO is due to higher nitrogen content in biodiesel (500 ppm compared to almost negligible in MGO).
CFD simulations also show more non-uniform temperature distribution in the combustion chamber with higher biodiesel ratios, leading to more “hot spots” where thermal NO formation is strongly promoted.
Analysis of CO and CO2 formation mechanisms based on experimental data shows important differences between biodiesel ratios (shown in Figure 6).
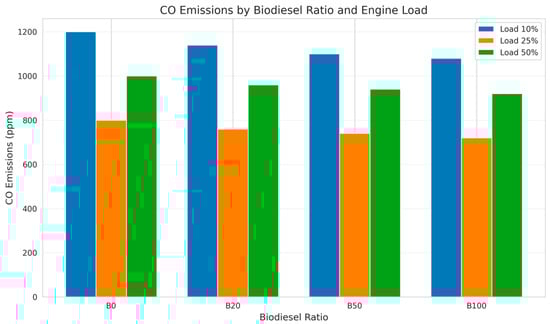
Figure 6.
CO emissions by biodiesel ratio and engine load.
CO formation: CO emissions decrease as biodiesel ratio increases (7–10% reduction from B0 to B100). CFD analysis shows three main factors contributing to this trend:
- Oxygen content in biodiesel promotes oxidation of CO to CO2
- Fewer local fuel-rich zones due to more uniform fuel distribution
- Higher combustion temperatures promote the CO + OH → CO2 + H reaction
However, at low load (10%), all fuels show higher CO emissions due to lower combustion temperatures and incomplete combustion.
CO2 formation: CO2 emissions slightly increase as biodiesel ratio increases (3–4% increase for each 20% increase in biodiesel ratio). This is mainly due to:
- Lower C ratio in biodiesel, leading to more CO2 per unit of energy
- More complete combustion, converting more carbon to CO2
- Lower thermal efficiency, requiring more fuel to produce the same power
3.3. Effects of Operating Conditions on Combustion Characteristics and Emissions
Engine load has a significant impact on combustion characteristics and emission patterns for all fuel types. Figure 7 illustrates the effect of engine load on maximum combustion temperature and NOx emissions.
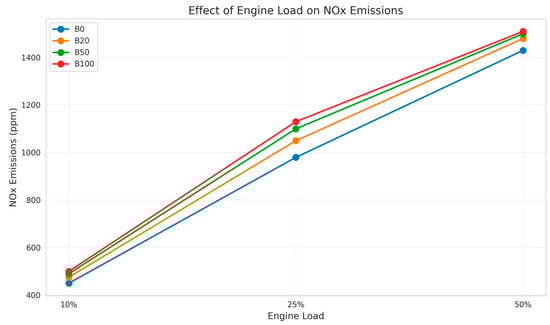
Figure 7.
Effect of engine load on NOx emissions.
As load increases from 10% to 25%, combustion temperature increases by approximately 80–100 °C, and when load increases from 25% to 50%, temperature increases by an additional 60–70 °C. This directly affects NOx emissions, as shown in the experimental data: NOx emissions increase by 110% when load increases from 10% to 25%, and by an additional 46% when load increases from 25% to 50%.
CFD simulations reveal that at higher loads, not only is combustion temperature higher, but there is also a longer high-temperature duration, leading to more thermal NOx formation through the Zeldovich mechanism.
CO emissions show a more complex pattern, with the lowest levels at 25% load and increases at both low (10%) and high (50%) loads. CFD simulations show the causes:
- At low load (10%): Low combustion temperature and high air-fuel ratio lead to incomplete combustion and slow CO oxidation rates
- At high load (50%): Despite higher temperatures a lower air-fuel ratio leads to local oxygen deficiency, inhibiting CO oxidation to CO2
Analysis of experimental data combined with CFD simulations shows complex interactions between biodiesel ratio and engine load (shown in Figure 8).
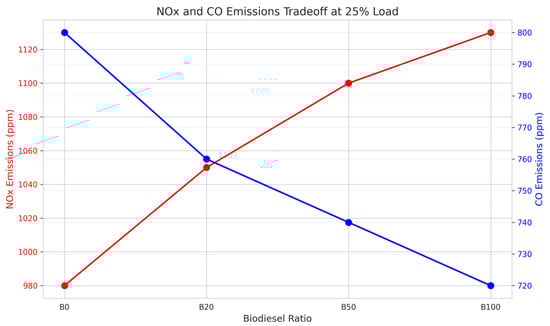
Figure 8.
NOx and CO emissions tradeoff at 25% load.
This is particularly evident when considering NOx emissions:
- At low load (10%): The difference in NOx emissions between B0 and B100 is about 6%
- At medium load (25%): The difference increases to 13%
- At high load (50%): The difference decreases to 5%
CFD simulations explain this phenomenon through the following mechanisms:
- At low load, combustion temperature is relatively low for all fuels, limiting thermal NOx formation. The presence of oxygen in biodiesel has only a small impact.
- At medium load, temperature is high enough to activate the Zeldovich mechanism, and oxygen in biodiesel accelerates combustion, creating more “hot spots” with high local temperatures.
- At high load, although combustion temperature is higher with biodiesel, the cooling effect of slower evaporation and higher heat absorption capacity of biodiesel partially offsets the heating effect of oxygen, reducing the difference in NOx emissions.
Although experimental data did not include direct tests with different fuel and ambient temperatures, CFD simulations allow us to predict the effects of these factors.
Simulations indicate that fuel temperature has a more significant effect on the combustion characteristics of biodiesel compared to traditional diesel. Increasing the fuel temperature from 30 °C to 60 °C is expected to:
- Reduce SMD of B100 droplets by about 25% but only 15% for B0
- Reduce ignition delay of B100 by about 10% but only 5% for B0
- Reduce differences in injection and evaporation characteristics between fuels
Higher ambient temperature increases NOx emissions for all fuels but has a stronger effect on biodiesel. Simulations predict that increasing ambient temperature from 25 °C to 35 °C could increase NOx emissions by an additional 7–8% for B100 compared to 5–6% for B0.
3.4. Effects of Operating Conditions on Combustion Characteristics and Emissions
This section presents results from fluid dynamics simulations, focusing on detailed physical processes in the combustion chamber. Recent advances in computational methods have significantly improved the accuracy of predicting complex flow dynamics and chemical reactions in marine engine combustion chambers [].
CFD simulations show significant differences in spray characteristics between fuels. Figure 9 illustrates the spray structure and droplet size distribution at 10° after TDC for B0 and B100 at 25% load.
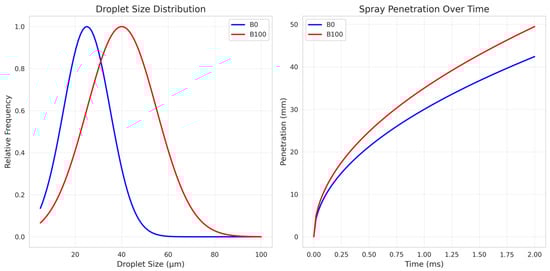
Figure 9.
Spray characteristics comparison showing (left) droplet size distribution and (right) spray penetration over time for B0 and B100 at 25% load. Droplet frequency represents number probability density, penetration measured from nozzle tip.
B100 exhibits:
- Greater spray penetration depth by approximately 12%
- Higher liquid fuel mass by 18% at the same time point
- Wider droplet size distribution with larger SMD
- 20–25% slower evaporation rate
These differences lead to different air-fuel mixture formation. B0 forms more homogeneous mixtures with more premixed zones, while B100 exhibits more characteristics of diffusion combustion with stronger fuel stratification.
Figure 10 shows temperature distribution and NOx concentration in the combustion chamber at 20° after TDC for B0 and B100 at 25% load. Figure 11 shows a comparison of different biodiesel ratios.
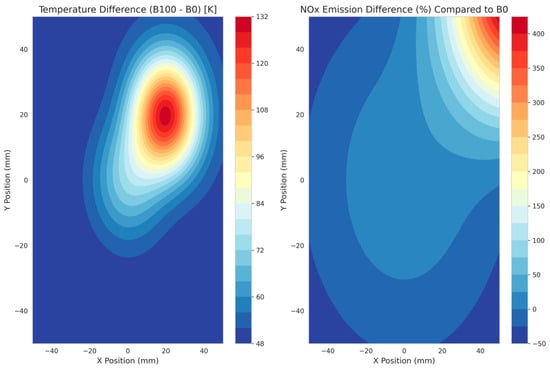
Figure 10.
Temperature difference contour (left) showing B100-B0 temperature differential and NOx emission difference contour (right) showing percentage increase in NOx formation for B100 compared to B0 at 20° ATDC, 25% load.
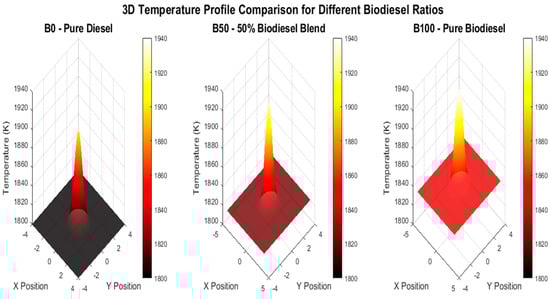
Figure 11.
3D Temperature profile for different biodiesel ratios.
B100 exhibits:
- Higher maximum combustion temperature by approximately 40–50°K
- More non-uniform temperature distribution with more local “hot spots”
- Steeper temperature gradients near fuel injection areas
- Longer high-temperature zones in the combustion chamber
Regarding NOx distribution, B100 shows:
- A 10–15% higher NOx concentration in maximum temperature zones
- More non-uniform NOx distribution, corresponding to temperature distribution
- Longer NOx formation during the expansion process
Flow field analysis also shows that B100 creates more complex vortex structures in the combustion chamber due to different spray characteristics. This affects the air-fuel mixing process and may contribute to creating a more non-homogeneous combustion environment.
From cylinder pressure data and emissions, combined with CFD simulations, we constructed a simplified reaction kinetics model for the combustion process. Table 5 illustrates and summarizes the main kinetic parameters of different fuels.
Table 5.
Estimated reaction kinetic parameters at 25% load.
These kinetic parameters explain the trends observed in the experimental data:
- Main combustion activation energy decreases with higher biodiesel ratios, consistent with shorter ignition delay.
- Higher frequency factor for B100 indicates higher molecular collision probability, possibly due to the presence of oxygen in the biodiesel molecular structure.
- NOx formation activation energy slightly decreases with higher biodiesel ratios, consistent with the slight increase in NOx emissions.
- CO formation rate constant decreases but CO oxidation rate constant increases with higher biodiesel ratios, explaining the observed reduction in CO emissions.
4. Practical Applications and Optimization
4.1. Optimization of Fuel Injection Strategies
Based on the understanding from combustion mechanism analysis and CFD simulations, we propose optimized fuel injection strategies for different biodiesel ratios to balance performance and emissions. Figure 12 shows optimal injection timing according to biodiesel ratio.
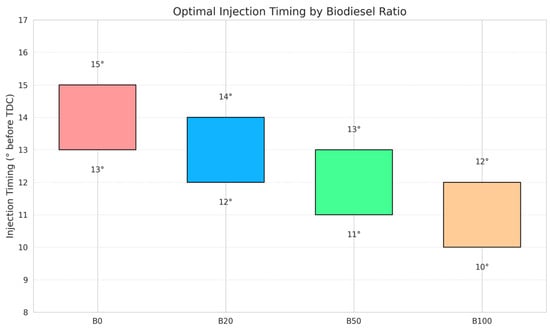
Figure 12.
Optimal injection timing according to biodiesel ratio.
CFD simulations indicate that optimal injection timing varies depending on biodiesel ratio:
- B0: 13–15° before TDC is optimal at most loads
- B20: 12–14° before TDC
- B50: 11–13° before TDC
- B100: 10–12° before TDC
This trend is due to the shorter ignition delay of biodiesel. Retarding injection timing with higher biodiesel ratios can reduce NOx emissions without significantly affecting performance.
CFD simulations also indicate that with biodiesel, higher injection pressure can improve air-fuel mixing and reduce droplet size, compensating for higher viscosity. Increasing injection pressure by 10–15% with B100 is expected to improve combustion efficiency and reduce CO emissions. Experimental studies have confirmed that optimizing injection pressure is particularly important when using biodiesel blends, as it significantly impacts atomization quality and subsequent combustion efficiency [].
Multiple injection strategies can be particularly beneficial for biodiesel. CFD simulations show that an early-main-late injection strategy can:
- Reduce NOx emissions by 15–20% with B100
- Improve combustion process at low load
- Reduce the formation of temperature “hot spots”
4.2. Optimization of Operating Parameters
CFD simulations indicate that optimal EGR ratios differ for different fuel types. B100 can tolerate higher EGR ratios (about 5–7%) compared to B0 before combustion efficiency is significantly affected, due to the available oxygen content in the fuel.
For B50 and B100, increasing fuel temperature to 60–70 °C can significantly improve injection and combustion characteristics, reducing SMD and improving mixing. This is particularly beneficial at low and medium loads.
CFD simulations show that biodiesel can operate efficiently at higher compression ratios due to a higher flash point and different combustion characteristics. Increasing compression ratio by 0.5–1.0 units with B100 can improve thermal efficiency by 2–3%.
4.3. Practical Guidelines for Marine Diesel Engine Operation with Biodiesel
Based on the research results, we propose the following practical guidelines for operating marine diesel engines with different biodiesel ratios [,,,]:
B20:
- No significant changes in operating parameters needed
- Ensure fuel temperature ≥40 °C in cold weather
- Reduce injection timing by 1–2° compared to B0
B50:
- Increase fuel temperature to 50–60 °C
- Reduce injection timing by 2–3° compared to B0
- Increase injection pressure by 5–8%
- Consider increasing EGR ratio by 2–3% at high load to control NOx
B100:
- Maintain fuel temperature at 60–70 °C
- Reduce injection timing by 3–5° compared to B0
- Increase injection pressure by 10–15%
- Consider increasing EGR ratio by 5–7%
- Adjust multiple injection parameters if available
Low load (10–25%):
- B50 may be the optimal choice, balancing low CO emissions and moderate NOx increase
- Ensure higher fuel temperature for all biodiesel ratios
- Consider multiple injections to improve combustion
Medium load (25–50%):
- B20–B30 may provide the best balance between performance and emissions
- Adjust injection timing to control NOx
High load (>50%):
- B0–B20 may be the best choice due to higher thermal efficiency
- Consider slightly increasing EGR ratio with B20 to control NOx
4.4. Policy Implications and Regulatory Considerations
The quantitative findings from this study provide critical evidence for marine emission policy development and regulatory framework optimization. Current IMO regulations under MARPOL Annex VI establish NOx emission limits that vary by engine power and installation date, with Tier III requirements mandating 80% reduction compared to Tier I baseline levels in designated Emission Control Areas.
This research demonstrates that biodiesel implementation can support regulatory compliance through several mechanisms. The observed 7–10% reduction in CO emissions directly contributes to improved air quality in port areas where CO concentration limits are increasingly stringent. However, the 5–13% increase in NOx emissions requires careful consideration for vessels operating in NOx Emission Control Areas, particularly for engines subject to Tier III standards.
Economic analysis based on the performance data indicates that optimal biodiesel blend ratios vary with operational profiles. For vessels with predominantly coastal operations requiring frequent port visits, B20-B50 blends provide acceptable emission-performance tradeoffs while maintaining fuel system compatibility. Ocean-going vessels with extended high-load operation may benefit from selective B20 usage during port approach and departure phases combined with conventional fuel for open ocean transit.
Regulatory frameworks should incorporate fuel-specific emission factors derived from this mechanistic understanding rather than applying generic correction factors. The established relationship between biodiesel ratio and emission formation enables the development of sophisticated monitoring and reporting protocols that account for actual fuel usage patterns and operational conditions.
Implementation strategies for marine operators should consider fleet-wide optimization approaches that leverage the load-dependent emission characteristics identified in this study. Port state control inspection protocols could incorporate biodiesel-specific testing procedures to verify compliance with stated emission performance claims. Furthermore, carbon credit mechanisms should reflect the quantified emission benefits while accounting for lifecycle environmental impacts including biodiesel production and distribution pathways.
Future regulatory development should address standardization of biodiesel quality specifications for marine applications, establishment of certification procedures for biodiesel-compatible engine modifications, and development of harmonized monitoring protocols that enable accurate assessment of environmental benefits across different operational scenarios.
5. Conclusions
This comprehensive investigation has established fundamental understanding of biodiesel combustion mechanisms in marine diesel engines through integrated experimental validation and computational analysis. The systematic approach combining detailed experimental measurements with three-dimensional CFD simulations has revealed quantitative relationships between fuel properties, injection characteristics, combustion processes, and emission formation that enable evidence-based optimization of marine propulsion systems.
Key mechanistic findings demonstrate that biodiesel’s molecular oxygen content (10–12% by mass) fundamentally alters combustion kinetics through enhanced local oxygen availability and modified reaction pathways. The observed 5–8% reduction in ignition delay with B100 compared to B0 results from oxygen-enhanced radical formation during the low-temperature oxidation phase, while the 25 °C increase in peak combustion temperature at 50% load reflects more complete fuel oxidation enabled by internal oxygen availability.
Injection and mixing characteristics reveal significant differences in spray development and fuel distribution patterns that directly impact emission formation. B100 exhibits 12% greater spray penetration depth, 20% larger Sauter Mean Diameter, and 20–25% slower evaporation rates compared to B0, resulting in altered air-fuel mixing patterns and spatial temperature distributions. These physical differences create more stratified combustion with longer diffusion-controlled burning phases that influence both NOx and CO formation pathways.
Emission formation mechanisms demonstrate complex relationships between fuel properties and pollutant formation rates. NOx emissions increase 5–13% with biodiesel primarily through enhanced thermal Zeldovich mechanism contributions (>90% of total NOx), with prompt-NO and fuel-NO mechanisms showing increased importance at higher biodiesel ratios (7.2% and 1.3%, respectively, for B100 at 25% load). Conversely, CO emissions decrease 7–10% due to improved oxidation kinetics enabled by molecular oxygen and more uniform fuel distribution.
Load-dependent emission behavior reveals non-linear interactions between operating conditions and fuel effects. The greatest NOx emission differences between fuels occur at medium loads (25–50%) where combustion temperatures are sufficient to activate thermal formation pathways while maintaining adequate oxygen availability. CO emission patterns show complex dependence on air-fuel ratio and mixing characteristics, with optimal performance at medium loads for all fuel types.
Optimization strategies based on mechanistic understanding enable significant emission reductions through adjusted injection timing (retarded 3–5° for B100), increased injection pressure (10–15% for B100), and modified fuel temperature management (60–70 °C for B100). These adaptations can achieve emission benefits while maintaining or improving engine performance through enhanced combustion efficiency and reduced incomplete combustion products.
The quantitative framework established in this study provides the scientific foundation for developing biodiesel implementation strategies that balance environmental benefits with operational requirements. The demonstrated ability to predict emission performance across different fuel types and operating conditions enables optimization of marine vessel operations for regulatory compliance while maintaining economic viability and operational flexibility required for commercial marine transportation.
Injection characteristics: Biodiesel shows greater spray penetration depth, smaller spray angle, and larger droplet size due to higher viscosity and density. This affects air-fuel mixing and combustion processes.
NOx formation: NOx emissions slightly increase (5–13%) with biodiesel, mainly due to the higher combustion temperature and presence of oxygen. The thermal Zeldovich mechanism is dominant, but prompt-NO and fuel-NO mechanisms also contribute significantly with high biodiesel ratios.
CO formation: CO emissions decrease (7–10%) with biodiesel due to more complete combustion, but show a complex pattern with load, with the lowest levels at 25% load.
Load-fuel interaction: Engine load has a greater influence on emissions (46–137% change) compared to biodiesel ratio (5–13% change). The interaction between load and biodiesel ratio is non-linear, with the greatest difference in NOx emissions at medium load.
CFD analysis: CFD simulations show more non-uniform temperature distribution, more “hot spots,” and more complex vortex structures with biodiesel, explaining the observed emission trends.
Operation optimization: Optimal fuel injection strategies and operating parameters differ for different biodiesel ratios. Retarding injection timing, increasing injection pressure, and adjusting fuel temperature can significantly improve biodiesel performance.
This study provides a solid scientific basis for optimizing marine diesel engines when operating with biofuels, contributing to efforts to reduce emissions from the global maritime industry without significantly affecting engine performance.
Based on the results of this study, we propose the following future research directions:
- Expand research to other types of biodiesel with different origins (palm oil, recycled fats, etc.) to determine the effects of specific composition.
- Further study the effects of environmental conditions (temperature, humidity, pressure) on the combustion characteristics of biodiesel.
- Develop more detailed reaction kinetics models, especially for NOx and soot formation processes with biodiesel.
- Extend research to dual-fuel engines and after-treatment technologies when using biodiesel.
- Long-term study on the effects of biodiesel on the durability and lifetime of marine diesel engines.
Author Contributions
K.-S.J.: formal analysis, software, resources, data curation, writing—original draft preparation, data collected and analyzed, visualization; K.-J.K.: formal analysis, software, resources, data curation, writing—original draft preparation, data collected and analyzed, visualization; S.-H.H.: supervision, project administration, writing—review and editing. All authors have read and agreed to the published version of the manuscript.
Funding
This paper was conducted with the support by Korea Planning and Evaluation Institute of Industrial Technology with funding from 2024 Materials and Parts Technology Development Project (Ministry of Trade, Industry and Energy) (No.: RS-2024-00443505). This work has supported by the National IT Industry Promotion Agency (NIPA) of Korea grant funded by the Korea government (MSIT) (Grant No. S1301-24-1007).
Data Availability Statement
The raw data supporting the conclusions of this article will be made available by the authors on request.
Conflicts of Interest
The authors declare no conflicts of interest.
References
- Choi, J.H.; Cho, S.G. Effect on Characteristics of Combustion by changing in Biofuel Temperature and Ratio of Bio injection Diesel Fuel. J. Power Syst. Eng. 2020, 24, 43–50. [Google Scholar] [CrossRef]
- Change, O.C. Intergovernmental panel on climate change. World Meteorol. Organ. 2007, 52, 1. [Google Scholar]
- Agarwal, A.K.; Gupta, J.G.; Dhar, A. Potential and challenges for large-scale application of biodiesel in automotive sector. Prog. Energy Combust. Sci. 2020, 71, 100787. [Google Scholar] [CrossRef]
- Yusuf; Abdu, A.; Inambao, F.L.; Ampah, J.D. Evaluation of biodiesel on speciated PM2.5, organic compound, ultrafine particle and gaseous emissions from a low-speed EPA Tier II marine diesel engine coupled with DPF, DEP and SCR filter at various loads. Energy 2022, 239, 121837. [Google Scholar] [CrossRef]
- Yusuf, A.A.; Yusuf, D.A.; Jie, Z.; Bello, T.Y.; Tambaya, M.; Abdullahi, B.; Muhammed-Dabo, I.A.; Yahuza, I.; Dandakouta, H. Influence of waste oil-biodiesel on toxic pollutants from marine engine coupled with emission reduction measures at various loads. Atmos. Pollut. Res. 2022, 13, 101258. [Google Scholar] [CrossRef]
- Park, K.H.; Kim, J.Y.; Kim, C.J.; Ko, J.H.; Park, H.I. The Effect of Bio-Diesel Fuel on Industrial Diesel Engine. J. Korean Soc. Mar. Eng. 2012, 36, 72–77. [Google Scholar] [CrossRef][Green Version]
- Kim, J.K.; Ainll, G.; Song, K.K.; Jung, J.Y.; Kim, H.G. An Experimental Study on Spray Characteristics of Diesel and Bio-diesel Fuel. J. Korean Soc. Mar. Eng. 2011, 35, 53–59. [Google Scholar]
- Park, K.H. Effect of cylinder wall temperature on marine engine combustion. J. Adv. Mar. Eng. Technol. 2023, 47, 309–316. [Google Scholar] [CrossRef]
- Je, M.-A.; Jung, S.-H.; Jeong, T.-Y.; Hwang, S.-C.; Moon, J.-S. Exhaust Gas Recirculation (EGR) effect on two-stroke diesel engines under sailing condition. J. Adv. Mar. Eng. Technol. 2024, 48, 1–8. [Google Scholar] [CrossRef]
- Park, Y.H.; Chung, S.Y.; Son, Y.H.; Lee, W.K. Investigation on Enhancing Efficiency in International Cooperation for Climate Change Adaptation of Republic of Korea. J. Clim. Change Res. 2010, 1, 179–188. [Google Scholar]
- Yang, S.C.; Moon, C.J.; Chang, Y.H.; Soh, S.Y.; Chung, J.Y.; Kim, E.S. Internet Monitoring of Wind-photovoltaic Hybrid Generation System. J. Korean Inst. Illum. Electr. Install. Eng. 2006, 20, 43–48. [Google Scholar]
- Park, J.W.; Shin, C.U.; Kim, G.D.; Yoon, J.H. A Study on Generation Characteristic of Building Integrated Photovoltaic System. J. Korean Sol. Energy Soc. 2013, 33, 75–81. [Google Scholar] [CrossRef]
- Choi, J.H.; Cho, S.G. A Study on the Characteristics of Exhaust Gas Emission by Changing in Biofuel Ratio and Bifuel Temperature in Diesel Engine. J. Power Syst. Eng. 2020, 24, 94–102. [Google Scholar] [CrossRef]
- Cho, S.G. An Experimental Study on Combustion Characteristics of Biodiesel Fuel in Marine Diesel Engine. J. Korean Soc. Power Syst. Eng. 2015, 19, 29–35. [Google Scholar] [CrossRef]
- Nyongesa, A.J.; Kim, J.K.; Lee, W.-J. Study on natural gas stratification enhancement in low-pressure natural gas-diesel dual-fuel marine two-stroke engine using CFD approach. J. Adv. Mar. Eng. Technol. 2023, 47, 303–308. [Google Scholar] [CrossRef]
- Kwang-Sik, J.; Seung-Hun, H.; Min-Jae, K. Analysis of Exhaust Gas Characteristics According to Load of 2.4 MW Class 4-Stroke Main Engine (Focusing on Training Ship Saebada). J. Power Syst. Eng. 2021, 25, 69–78. [Google Scholar]
- Kwang-Sik, J.; Yong-Jun, C.; Seung-Hun, H. Analysis of Exhaust Gas Characteristics by Load of Marine Diesel Engine Using Bio Diesel. J. Power Syst. Eng. 2022, 26, 14–22. [Google Scholar]
- Cui, H.; Ma, X.; Zhao, H. Experimental Analysis of Spray and Combustion Characteristics of Marine Engine Fuels Under High-Pressure Conditions. Fuel 2022, 321, 124093. [Google Scholar]
- Nayak, S.K.; Mishra, P.C. CFD Analysis of Marine Engine Combustion Chamber: Current Status and Future Perspectives. Int. J. Engine Res. 2023, 24, 184–202. [Google Scholar]
- Dec, J.E. A Conceptual Model of DI Diesel Combustion Based on Laser-Sheet Imaging; SAE Technical Paper 970873; SAE International: Warrendale, PA, USA, 1997. [Google Scholar]
- Turns, S.R. An Introduction to Combustion: Concepts and Applications, 2nd ed.; McGraw-Hill: New York, NY, USA, 2000. [Google Scholar]
- Mueller, C.J.; Boehman, A.L.; Martin, G.C. An Experimental Investigation of the Origin of Increased NOx Emissions When Fueling a Heavy-Duty Compression-Ignition Engine with Soy Biodiesel. SAE Int. J. Fuels Lubr. 2009, 2, 789–816. [Google Scholar] [CrossRef]
- Rajak, U.; Nashine, P.; Verma, T.N. Effect of Fuel Injection Pressure in a Diesel Engine Using Biodiesel-Diesel Blends: Experimental and Numerical Study. J. Energy Inst. 2021, 94, 129–142. [Google Scholar]
- IMO MEPC 66/21; Technical Code (2008): Technical code Control of Emission of Nitrogen Oxides from Marine Diesel Engine. IMO: London, UK, 2008; pp. 98–99.
Disclaimer/Publisher’s Note: The statements, opinions and data contained in all publications are solely those of the individual author(s) and contributor(s) and not of MDPI and/or the editor(s). MDPI and/or the editor(s) disclaim responsibility for any injury to people or property resulting from any ideas, methods, instructions or products referred to in the content. |
© 2025 by the authors. Licensee MDPI, Basel, Switzerland. This article is an open access article distributed under the terms and conditions of the Creative Commons Attribution (CC BY) license (https://creativecommons.org/licenses/by/4.0/).