Abstract
The Brazilian port sector faces an urgent need for modernization to meet the demands of the contemporary global economy. A significant challenge lies in the shallow depth of access channels, which hinders the navigation of larger ships with deeper drafts, and the fact that many ports are constrained by the proximity of large cities, limiting their expansion. This study aims to identify Brazilian ports with the potential to accommodate post-Panamax ships, a critical component of modern maritime trade. Using a multi-criteria evaluation system, five key criteria were selected: water depth, land capacity for expansion, dredging requirements, water accessibility, and transport infrastructure. These criteria were systematically applied to 210 Brazilian port facilities, analyzed through QGIS 3.38.3 software using satellite imagery and literature sources. To prioritize the most suitable ports, Pareto analysis and quartile analysis were employed, resulting in the identification of 58 port facilities as prime candidates for expansion. This research provides a data-driven framework to guide the modernization of Brazilian ports, positioning them to better serve the growing demands of the global maritime industry.
1. Introduction
Ports are widely recognized as essential infrastructure for the economic progress and expansion of coastal nations, serving as crucial hubs for international trade and strategic assets for enhancing commercial activities [1]. This is particularly true in Brazil, where ports handled 1.32 billion tons of cargo in 2024, marking the highest volume in the country’s history and underscoring their strategic role in supporting national economic development. Brazil’s port system supports a vast and diverse export economy, including iron ore, soybeans, and petroleum products, and is essential for the flow of both solid and liquid bulk commodities. Notably, private terminals (TUPs) now account for over 64% of national port throughput. Major ports such as Ponta da Madeira, Santos, and Itaguaí continue to lead in tonnage handled [2].
Given their pivotal role, enhancing the capacity of Brazilian ports emerges as a crucial imperative for the nation’s economic advancement. However, this endeavor faces at least two significant challenges.
The first major limitation is the shallow depth of the access channels, which hinders the navigation of increasingly larger ships with deeper drafts. Brazilian ports currently lack the capacity to accommodate the world’s largest container ships, classified as post-Panamax vessels (i.e., ships too large to pass through the original Panama Canal, typically over 294 m long and 32.3 m wide), due to limitations in draft depth [3]. Post-Panamax ships typically have drafts exceeding 15 m (original limitation of the Panama Canal), lengths ranging from around 300 m to over 400 m, and widths of 50 m or more, requiring deep-water ports for their operation [4]. It is projected that future vessels may reach capacities of 25,000 to 30,000 TEUs, with drafts of up to 17.3 m [5]. An example comparing dimensions of Panamax and post-Panamax vessels is provided in Figure 1.

Figure 1.
Comparison between Panamax and post-Panamax container vessels. Source [6].
In Brazil, the Port of Santos, the country’s largest public port, has a maximum achievable depth of 17 m [7], but maintaining this depth would require significant increases in dredging operations, up to seven times the current volume [8]. Constant dredging, as emphasized by Gouveia [3], would obstruct navigation and mooring due to the occupation of space by dredging equipment, making it a major constraint in Brazilian ports.
Additionally, many other Brazilian ports require ongoing maintenance dredging, which poses environmental risks, such as disrupting water circulation, increasing turbidity, and releasing pollutants trapped in sediments [9,10,11]. Dredging can also lead to issues such as erosion, siltation, and habitat disruption, further complicating port operations [12]. Given these challenges, prioritizing ports with adequate natural water depths that require minimal dredging is a more sustainable approach, as it reduces environmental impacts and enhances the ability to accommodate post-Panamax vessels efficiently.
The second major limitation on the expansion of Brazilian ports is the conflict between ports and cities. To accommodate post-Panamax vessels, extensive land and water areas, along with infrastructure for transportation, storage, and berths, are essential [13]. However, many Brazilian ports are tightly integrated with urban areas, resulting in space conflicts. Historically, ports like Rio de Janeiro, Santos, and Recife were instrumental in the growth of their surrounding cities, but as urban populations expanded, these ports have become encroached upon by city expansion, leading to “urban autophagy” [14].
This urban encroachment limits the ability of ports to expand and accommodate larger vessels, as seen in Santos, where 85% of port practitioners reported tensions between the port and the city, and 95% acknowledged the impact of these conflicts. Congestion and truck parking issues are also common in other ports, including Belém, Fortaleza, and Rio de Janeiro [14].
To address these challenges, some cities have relocated port activities to new areas. For example, cargo from Rio de Janeiro was moved to Porto de Sepetiba and from Belém to Vila do Conde. However, these transitions have not resolved conflicts. Ports like Itaqui and Vila do Conde have faced issues such as the displacement of communities, the destruction of roads, and a lack of infrastructure investment [15,16]. A more sustainable solution involves the adoption of “smart port-city integration” strategies, which align urban planning with port expansion. Successful examples include the development of dedicated transportation corridors and the use of digital infrastructure to minimize the impact of port operations on surrounding areas [13]. Moreover, promoting inland ports and enhancing rail and waterway connectivity could reduce the reliance on road transportation and alleviate congestion in urban port areas [17].
Recent academic studies have highlighted the complex sustainability challenges facing Latin American ports. Calcerano and Hilsdorf [18] note that Brazilian ports still exhibit low levels of environmental maturity, with limited implementation of environmental indicators and inconsistent communication with stakeholders. Schulte et al. [19] emphasize that in many Latin American and Caribbean countries, fragmented governance and a lack of coordinated policy frameworks hinder the effective adoption of sustainability measures. More recently, Sánchez and Gómez-Paz [20] discussed the potential for green corridors in Latin America, noting that institutional weaknesses and limited technical capacity continue to act as key barriers. In parallel, UN-ECLAC [21] has raised concerns about the growing exposure of ports in the region to climate risks, particularly sea level rise and extreme weather events, with few facilities actively incorporating adaptation strategies. Together, these studies indicate that port sustainability in Brazil and the wider region depends not only on technological modernization but also on systemic improvements in environmental governance, climate resilience, and long-term strategic planning.
Although there is an urgent need for the modernization and development of Brazilian ports [22], it is important to consider the potential negative environmental impacts associated with port activities and their expansion. Recent studies have shown that port and cargo operations significantly contribute to urban air pollution, especially in coastal cities [23,24]. Emissions from ships, trucks, and cargo-handling equipment release high levels of particulate matter, nitrogen oxides, and sulfur oxides, leading to poor air quality and adverse health effects for nearby populations [25]. Water pollution is another significant concern, with increased risks of oil spills, ballast water discharge introducing invasive species, and contamination from hazardous materials [26]. Moreover, ports can lead to physical alterations in coastal ecosystems through land reclamation, dredging, and habitat destruction. These changes can disrupt marine life, alter sediment flows, and negatively impact biodiversity in coastal areas [27]. Noise pollution from port operations and shipping traffic also affects both wildlife and local communities, contributing to stress and disrupting ecosystems [28].
In this context, Brazil’s own environmental monitoring efforts reveal specific areas where port sustainability performance is still lagging. The Índice de Desempenho Ambiental (IDA), developed by ANTAQ (the Brazilian National Agency for Waterway Transportation), is a standardized index used to assess the environmental performance of ports based on indicators such as waste management, energy efficiency, water use, emissions control, and regulatory compliance. Recent IDA results show that only 10% of Brazilian ports publish environmental information on their websites, and just 3.33% provide on-shore power supply (OPS) infrastructure to reduce emissions while ships are docked. In contrast, data from the European Sea Ports Organisation (ESPO) [29] reveal that 82% of European ports publish environmental data online, and 58% offer OPS. These differences highlight the implementation gap between Brazilian ports and international best practices.
Despite the collateral effects of port activities, adapting ports for post-Panamax ships can offer societal and environmental benefits. Larger vessels provide more cost-effective and sustainable cargo transportation, generating fewer emissions per unit of cargo compared to smaller vessels, which aligns with global green shipping practices [30,31,32].
Examples of this can be found internationally. Some U.S. ports, such as Norfolk, Baltimore, Miami, and New York, have successfully modernized to accommodate post-Panamax vessels. According to the U.S. Army Corps of Engineers, key criteria for post-Panamax port readiness include a channel depth of 50 feet (15.24 m), sufficient channel width, adequate turning basin size, and appropriate dock and crane capacity to handle larger ships [33]. In Latin America, ports such as Colon in Panama and Cartagena in Colombia have also achieved substantial gains in container throughput by their expansion through investments in dredging, advanced crane systems, and hinterland connectivity [34]. In addition to infrastructure, recent studies emphasize the role of port cooperation and network configuration in strengthening competitiveness. Tagawa et al. [35] show how strategic collaboration between neighboring ports can improve their hierarchical position within international maritime networks, suggesting that modernization also involves institutional and regional coordination.
Building on the successes of U.S. and Latin American ports, Brazilian ports have a unique opportunity to position themselves within the global maritime trade landscape. While ports like Santos and Rio Grande in Brazil are already significant players in the region, they are not on par with their international counterparts in terms of infrastructure upgrades and readiness for post-Panamax vessels.
While port modernization encompasses a broad range of dimensions (including digitalization, sustainability, or multimodal connectivity), this study focuses specifically on physical infrastructure, using the ability to accommodate post-Panamax vessels as a central indicator. This is due to the increasing importance of larger vessels in global maritime trade and the critical role of channel depth, berth size, and access in determining a port’s competitiveness. In the Brazilian context, these physical limitations represent some of the most urgent barriers to modernization.
Therefore, the aim of this paper is to identify an initial list of Brazilian ports with the potential of accommodating post-Panamax ships and ascertain which ones possess the potential to embrace modernization, expansion, and adaptation to the evolving paradigm in the shipping industry. It is the first national-scale study in Brazil to apply such a detailed screening process grounded in objective physical and logistical data.
2. Brazilian Ports
Brazilian ports are managed by two main institutions: the National Waterway Transport Agency (ANTAQ) and the Ministry of Ports and Airports (MPor). The ANTAQ’s role encompasses regulating, supervising, and inspecting activities related to waterway transport and the use of port and waterway infrastructure. Conversely, MPor is an agency responsible for advising on policies and guidelines for the port sector, as well as developing projects and programs related to port infrastructure [36].
According to information from ANTAQ [37], the sector in Brazil consists of a total of 210 port facilities, which are further categorized into 35 public ports (17% of the total) and 175 Private Use Terminals (TUPs) (83% of the total). Public ports in Brazil are administered by the Brazilian Government, specifically through Companhias Docas, which oversees port management in each state. Alternatively, the administration of these ports can be delegated to municipalities, states, or public consortia. On the other hand, TUPs are exclusive terminals operated by a company or a producing group, specialized in handling one or just a few types of products.
In this section, a comprehensive characterization of all ports in Brazil (public and private) is provided, covering aspects such as size, geographical features, regional distribution within the nation, land use, and water depth.
2.1. Tonnage Transported
When considering all ports in Brazil, 78% deal with less than 5 million tons annually and 13% between 5 and 15 million tons. Just a minor percentage deal with more than 15 million tons per year (Figure 2).
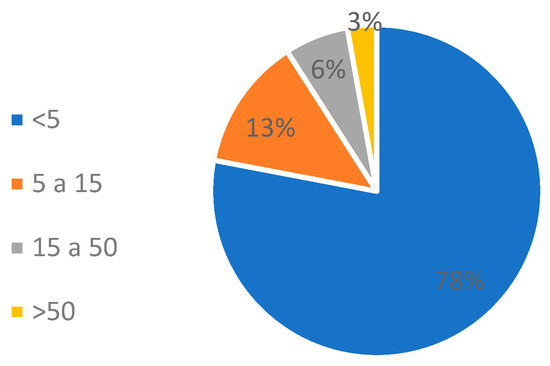
Figure 2.
Size of all Brazilian ports (annual million tons). Source: ANTAQ [37].
2.2. Geographical Characteristics
The majority of Brazilian ports (54%) are concentrated on rivers (Figure 3). The prevalence of river-based ports in the national context is largely attributed to their concentration in the Amazon region, where river transport serves as the primary mode of transportation. This is due to the fact that in this region, there are many restrictions on land connection as a consequence of its geographical characteristics. Therefore, ports located in rivers are the main means of connection. However, it is important to mention that these port terminals do not handle as much cargo compared to maritime ports. The other locations are more or less equally distributed, among engineered coastline, estuary and embayment, protected coast, and marine inlet.

Figure 3.
Geographical characteristics of all Brazilian ports. Source: Own elaboration.
2.3. Regional Distribution
Considering the regional distribution, 42% of Brazilian ports (public and private) are located in the North region (88 ports in total), 27% in the Southeast region (56 ports), 15% in the South (32 ports), 13% (28 ports) in the Northeast, and just 3% (6 ports) are in the Midwest region. Figure 4 displays the location of all ports along the country, differentiating public ports and Private Use Terminals (TUPs). The North region hosts a significant portion of Brazilian ports since it has access to the Amazon River, which provides a vital inland waterway transportation route. This river system allows for the movement of goods deep into the continent, connecting Brazil to countries like Peru, Colombia, and Bolivia.
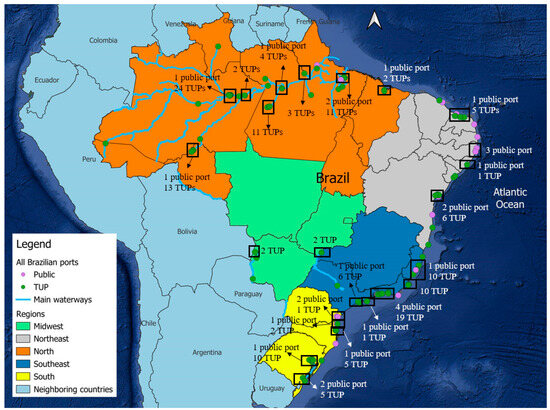
Figure 4.
Distribution of all Brazilian ports by region. Source: Own elaboration.
2.4. Land Use
Ports are strategically positioned to leverage natural resources, bolster industrial growth, and facilitate commerce with both domestic and global markets. In Brazil, the ports are predominantly situated in areas of natural vegetation (40%), followed by urban areas (31%), industrial zones (12%), coastal areas (10%), and agricultural lands (7%) (Figure 5). The distribution of ports across these different types of areas reflects the diverse economic activities and geographic features of Brazil.

Figure 5.
Land use characteristics of all Brazilian ports. Source: Own elaboration.
2.5. Water Depth
In Brazil, 54% of ports are only capable of accommodating smaller vessels with a maximum draft of 10 m, followed by ports capable of accommodating vessels with drafts between 10 and 15 m (36%). Only 10% of ports are able to accommodate ships over 15 m (Figure 6).
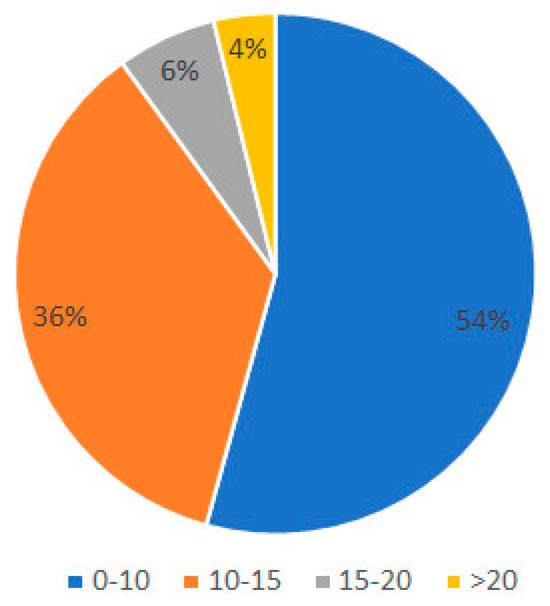
Figure 6.
Water depth of all Brazilian ports. Source: Own elaboration.
Concerning dredging, a total of 66% of ports require dredging, while 34% either do not require it or there is a lack of available information.
3. Methodology
While Section 2 presented general characteristics of Brazilian ports to contextualize the national port system, the following section outlines the five specific criteria used in this multi-criteria framework to evaluate port readiness for post-Panamax adaptation.
Based on the methodological approaches adopted in previous studies [38,39], this study develops a tailored multi-criteria evaluation system designed to assess the expansion potential of Brazilian ports based on their physical and operational characteristics. Comparable efforts have been undertaken in other emerging regions, such as the study by Gupta and Prakash [40], which applied the Multi-Attribute Utility Theory (MAUT) to measure competitiveness among emerging maritime port clusters in South Asia. Their approach illustrates the growing relevance of multi-criteria frameworks in evaluating port readiness and competitiveness, particularly in developing economies where infrastructure gaps remain a central challenge. Drawing on this trend, the present study adapts a similarly structured but context-specific methodology to the Brazilian case.
While there are other studies on port expansion in Brazil [41,42], it is important to emphasize the unique nature of this study, which considers experts’ basis of criteria to evaluate the ports and the specific knowledge gap it seeks to address. This research not only advances scientific understanding but also provides a foundation for more informed decision-making in transportation policy.
3.1. Determination of Criteria
A set of five criteria was developed to analyze which ports possess the capability to be expanded to accommodate and manage post-Panamax ships. The selection of the five criteria used to evaluate the Brazilian ports was the result of a collaborative brainstorming session among the five authors of this research. The goal was to develop a preliminary screening process that could effectively narrow down the 210 Brazilian ports, focusing primarily on key physical and infrastructural factors. These criteria were chosen for their ability to be easily and readily applied, providing a clear and practical method for identifying ports with the potential to accommodate post-Panamax vessels. Following the brainstorming session, the criteria were validated through expert consultations with professionals in port management and development. This ensured that the criteria not only reflected global best practices but also addressed the specific challenges faced by Brazilian ports. These proposed criteria are the following:
- Water depth: This criterion assesses the depth of the waterways within the port, particularly the channels and berths. It is essential for ports to have sufficient depth to accommodate the draft of post-Panamax vessels, which typically ranges around 15 m. Deeper water ensures safe navigation and prevents grounding or damage to the ships;
- Land capacity: This criterion evaluates the availability of land within the surrounding port area for the expansion or construction of new facilities necessary to accommodate post-Panamax ships. Ports may need ample space for additional container yards, storage areas, and other infrastructure to handle increased cargo volumes. A lack of space can hinder the port’s ability to expand and modernize its operations to meet the demands of larger vessels;
- Dredging: Dredging is the process of removing sediment and debris from waterways to maintain or increase their depth. Ports may need extensive dredging to deepen channels and berths to accommodate post-Panamax ships. The frequency and extent of dredging depend on factors such as tidal variations, sediment accumulation rates, and the draft of incoming vessels. Ports with significant dredging requirements must have the necessary resources and plans in place to carry out these maintenance activities effectively;
- Water accessibility: This criterion focuses on the navigational aspects of the port, including the width of channels, bridge clearance, and the curvature of waterways. Post-Panamax ships require wider and more navigable channels to maneuver safely within the port. Bridge clearance is crucial to ensure that vessels can pass under bridges without encountering height restrictions. Additionally, sharp curves or tight turns in the waterways can pose challenges for larger ships, requiring ports to assess and potentially modify their infrastructure to improve accessibility;
- Land and water connectivity: This criterion evaluates the presence and adequacy of transportation infrastructure connecting the port to inland areas with other modes of transportation. Ports need efficient road, rail, and possibly waterway connections to facilitate the movement of cargo to and from the port. Adequate infrastructure reduces congestion, improves cargo flow, and enhances the overall efficiency of the port. Ports lacking sufficient transportation infrastructure may face logistical challenges in handling the increased cargo volumes associated with post-Panamax ships.
3.2. Criteria’s Score
A scoring system was developed to assess the performance of each port according to the previously outlined five criteria. This system assigns numerical equidistant values (0, 5, and 10) to the different options of each criterion, reflecting the degree to which the port satisfies the relevant requirements. The scores were designed for simplicity and clarity, allowing for a straightforward evaluation while distinguishing between varying levels of performance.
Moreover, by using predefined and uniform scoring thresholds, the methodology minimizes subjective interpretation and ensures consistent evaluation across all 210 ports.
- A score of 10 represents the optimal scenario, where the port fully meets the criteria required for post-Panamax operations, such as sufficient water depth or robust connectivity;
- A score of 5 indicates an intermediate level, where the port meets some of the requirements but faces moderate limitations, requiring improvements or additional infrastructure to become fully suitable for larger vessels;
- A score of 0 signifies that the port does not meet the necessary conditions, presenting significant challenges or deficiencies that could impede its ability to handle post-Panamax ships.
In the case of the Land and Water Connectivity criterion, ports were evaluated based on their level of transportation infrastructure. Full connectivity, where all three transport modes (rail, road, and inland waterway) are available, was awarded the highest score of 10 points. Ports connected to only one mode received 5 points, while those lacking any connectivity were assigned 0 points. An additional score of 7 was introduced to reflect ports with a moderate level of connectivity, where two out of the three transport modes are available. This intermediate score recognizes a reasonable level of connectivity without achieving the full integration of multimodal transport systems.
The scoring methodology prioritizes ports based on specific attributes, showcasing superior abilities in accommodating post-Panamax ships and in meeting contemporary shipping demands. For instance, in evaluating Water depth, higher scores are allocated to ports with deeper waters, essential for ensuring safe navigation. Similarly, the criterion of Land capacity favors ports with extensive land availability conducive to development. Moreover, the system rewards ports that necessitate minimal maintenance Dredging, emphasizing stability in waterway maintenance. Navigational ease is a pivotal aspect considered under the Water accessibility criterion, with higher scores conferred upon ports offering wider channels and fewer obstacles. Lastly, regarding Land connectivity, the scoring system commends ports equipped with rail and federal road networks, underscoring their role in enhancing overall port efficiency.
Detailed information regarding the specific options, their descriptions, and corresponding scores for each criterion is provided in Table 1.

Table 1.
Scores and description factors are given to the criteria.
3.3. Criteria Application
Each criterion was assessed independently for each port, and the scores were aggregated to generate a final total score, offering an overall evaluation of the port’s preparedness to accommodate post-Panamax ships or undertake modernization initiatives. This scoring methodology enables a comprehensive evaluation of each criterion’s performance in comparison to others, offering valuable insights for decision-making and strategic planning.
The data used to apply the criteria were collected from a range of reputable sources. Table 2 presents the research sources used in each criterion. The use of these reliable and verifiable sources helped ensure methodological transparency and minimized the influence of subjective interpretation in the evaluation process. In total, the data collection covered over 400 sources, including technical reports, environmental licenses, ports’ websites, and remote sensing data, between 2019 and 2024. Although the number of documents varies by criterion and by port, the selection process prioritized publicly accessible and verifiable information to ensure consistency across the evaluation.
Table 2.
Research sources for each of the analyzed criteria.
These diverse sources were consulted to ensure the accuracy and reliability of the information gathered for the assessment of each criterion; nonetheless, certain limitations were identified during the review process. In the water depth analysis, for ports where direct information was unavailable, data from the river where the port is situated or extrapolated details from similar ports in the same inlet or estuary were considered. Similarly, in the dredging analysis, if data were absent, they were mostly extrapolated from other sources in the surrounding area. This consistent use of geographically and operationally comparable sources helped standardize assumptions and further reduced the influence of subjective interpretation. In instances where no information was available, it was presumed that the port would necessitate minimal maintenance dredging, as ports with substantial dredging needs typically maintain detailed records of dredging operations for planning and budgeting purposes. In the absence of data suggesting otherwise, it is reasonable to presume that the port requires minimal maintenance dredging to uphold navigational safety and efficiency. The limited available information was especially pronounced for Private Use Terminals (TUPs) and small inland ports with limited visibility, while major public ports typically have readily accessible information.
Additionally, for the land capacity criterion, the method used was qualitative rather than quantitative, relying on visual analysis of satellite imagery and land use data to categorize ports as having “expansive”, “limited”, or “restricted” land availability. While this approach was suitable for the initial screening process, it presents a limitation in terms of precision. Future studies would benefit from a more quantitative assessment, such as determining the exact percentage of unbuilt or developable land around each port, to provide a more objective and reliable evaluation.
In order to evaluate the land capacity criterion, a three-step analysis was applied to assess the available land for port expansion. Although this method was qualitative during the initial screening, it followed a structured approach using satellite imagery and land use data. The first step involved a preliminary review through the QGIS Quick Map Services plugin, which was used to visually examine the surrounding areas for potential expansion. This was followed by cross-referencing the initial findings with land use data from Mapbiomas [52], providing detailed information on the distribution of urban infrastructure, agricultural areas, and natural spaces around the port. Finally, the results were validated by consulting maps of protected areas from CSR/UFMG [53], which helped identify any conservation units or environmental preservation zones that could limit the port’s expansion. Figure 7 illustrates this three-step process.
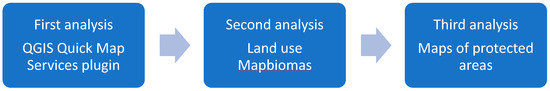
Figure 7.
Three-step process for evaluating the land capacity criterion.
3.4. Examples of Criteria Application
Illustrations showcasing the application of specific criteria are presented in this section.
3.4.1. Water Depth
As previously stated, the information about the water depth of navigation channels was obtained through the institutional webpage of ports, installation licenses, publications in newspapers, scientific magazines, and undergraduate, master’s, and doctoral studies, official publications of the federal government, and the website of Transpetro, among others.
In Figure 8, an example is provided for the water depth of Angra dos Reis Terminal, obtained from the Transpetro website [51], corresponding to a ship draft of 25 m (calado in Portuguese in the red box of Figure 8) and therefore obtaining 10 points. Other examples could be the Port of Vila do Conde with a depth of 12.8 m [55], resulting in 5 points, and Porto Alegre with a depth of 2.5 m [56], obtaining 0 points since it is less than 10 m.
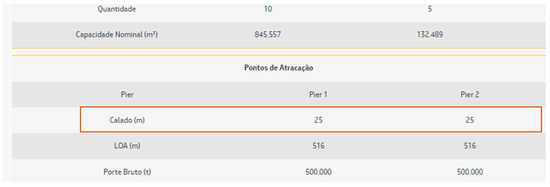
Figure 8.
Angra dos Reis Terminal depth. Source: Transpetro [51].
3.4.2. Land Capacity
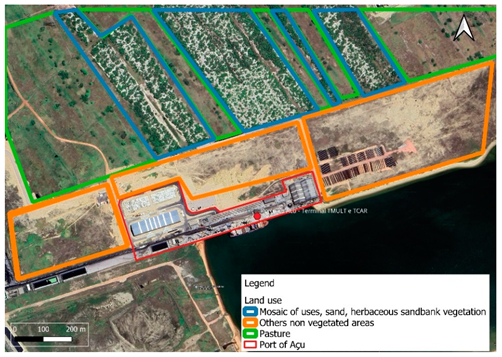
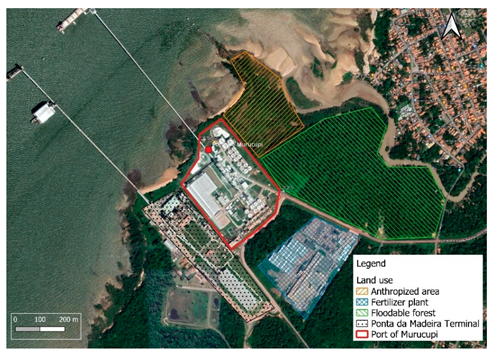
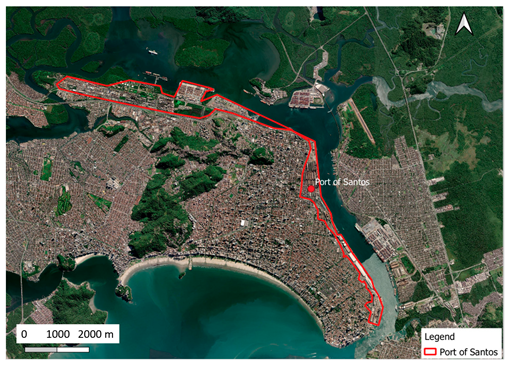
This section illustrates the three potential land capacity criteria (Expansive land availability, Limited land availability, and Restricted land availability). Satellite imagery was used to determine each option, see examples in Table 3. The red line in the photos indicates the location of the port.
Table 3.
Examples of the land capacity criterion application.
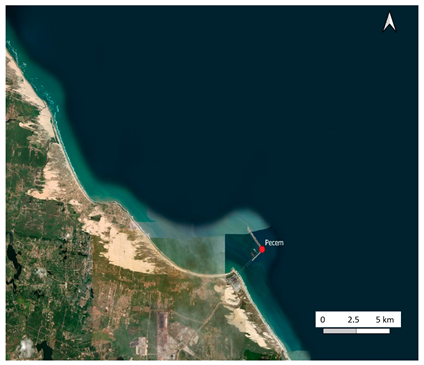
3.4.3. Dredging
Information regarding dredging was gathered from various sources, including institutional websites of each port (e.g., [57]), installation licenses (e.g., [46]), publications in newspapers (e.g., [58]) and scientific journals (e.g., [59]), official publications of the federal government as well as academic reports, theses, and dissertations (e.g., [60]).
For instance, three examples are provided concerning dredging frequency: the Port of Pecém with minimal maintenance dredging [61], obtaining 10 points, the Port of Maceio with moderate dredging frequency [62], with 5 points, and the Port of Santos with high dredging frequency [63], with 0 points.
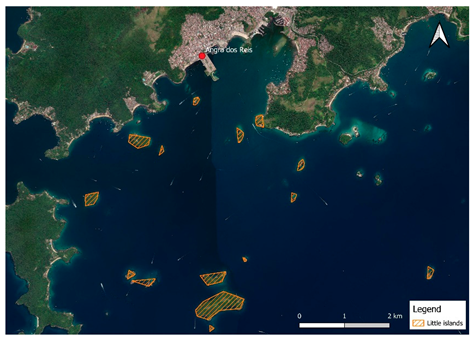
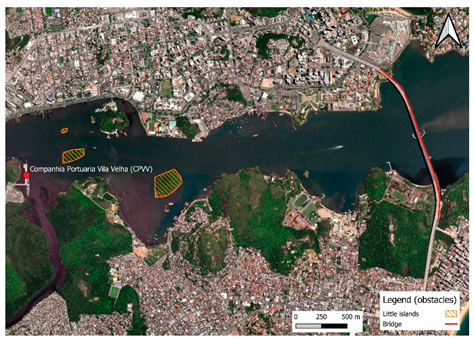
3.4.4. Water Accessibility
Impediments to navigability were thoroughly analyzed for each port in order to meet the water accessibility requirement, as shown in Table 4.
Table 4.
Examples of the water accessibility criterion application.
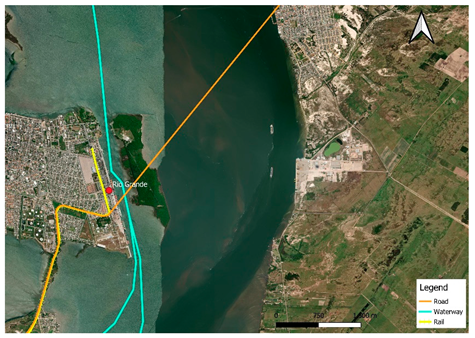
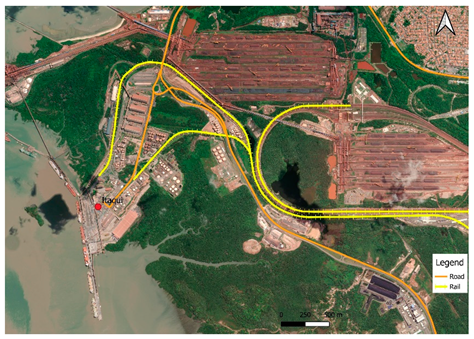
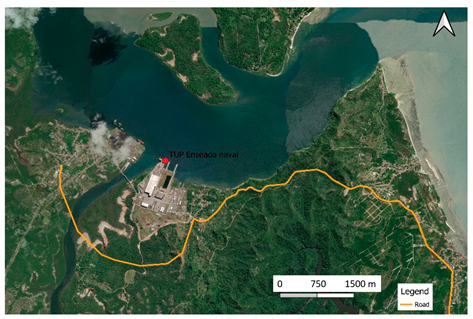
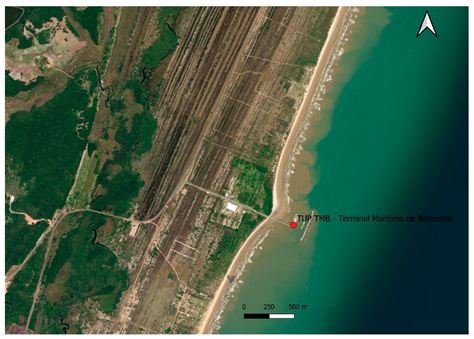
3.4.5. Land and Water Connectivity
The level of transportation infrastructure linking the port to inland areas was examined under the land and water connectivity criterion (see Table 5), as it plays a critical role in supporting the efficient movement of commodities to and from the port, including train, federal road, and inland connections.
Table 5.
Examples of the land connectivity criterion application.
While this study evaluates land and water connectivity based on the presence of nearby multimodal infrastructure (such as highways, railways, and inland waterways), it is important to acknowledge that physical connectivity alone does not fully capture a port’s strategic position in global maritime networks. Wang et al. [64] introduce the concept of the Composite Connectivity Index (CCI), which integrates traditional connectivity with network centrality measures to assess the true attractiveness and influence of hub ports. Although it is not applied in this preliminary screening, such network-based methodologies could enrich future assessments by incorporating the structural role of ports within global shipping alliances.
3.5. Ports’ Selection Process
To identify Brazilian ports with the greatest potential to accommodate post-Panamax vessels, a two-step selection approach was applied using Pareto analysis and fourth quartile analysis. These techniques provided a structured and objective framework for prioritizing ports based on their aggregated performance across the five evaluation criteria.
Firstly, a Pareto analysis was used to decide which ports would be included in the sample of Brazilian ports that may be expanded to accommodate post-Panamax vessels. A Pareto analysis is a technique used for decision-making and problem-solving [65]. It is based on the Pareto Principle, also known as the 80/20 rule, which states that roughly 80% of the effects come from 20% of the causes.
Secondly, the fourth quartile analysis was applied to refine the selection by concentrating on the top-performing ports, ensuring that the most suitable candidates were prioritized for future investment and development. This method, which focuses on the top 25% of data points [66], was used in conjunction with Pareto analysis to create a systematic and objective selection process.
Together, these methods enhance the credibility and transparency of the selection process. While Pareto analysis ensures a focus on national-level infrastructure priorities, the fourth quartile approach allows for broader inclusion of viable candidates, ensuring that the final selection supports both efficiency and equity in port modernization efforts.
4. Results
4.1. Analysis of Criteria Application
This section presents an analysis of the results derived from the application of each criterion to the 210 port facilities available in Brazil.
To provide a comprehensive overview of the port evaluation results, the data from the five criteria are presented in Table 6. This table presents the performance of the evaluated ports across each category, offering a streamlined comparison.
Table 6.
Results of each criterion analysis.
4.1.1. Water Depth
Among all of the ports, 12.4% obtained a 10-point score in this criterion, indicating depths greater than 15 m. Meanwhile, 35% of ports had a score of 5, with depths ranging from 10 to 15 m. Notably, more than half, or 53%, of ports have depths adequate for operating ships with drafts less than 10 m. According to this data, the majority of ports have insufficient channel depth, which presents issues as navigation needs to evolve. When depth information was missing, data were extrapolated from the nearby river or ports located within the same inlet or estuary.
4.1.2. Land Capacity
For the land capacity criterion, 22% of ports have surrounding regions suitable for port development, allowing for the construction of larger warehouses for storage or the installation of more modern equipment to improve port efficiency and agility during loading and unloading procedures. Furthermore, 39% of ports have regions that are somewhat confined for growth, with prospective expansion limited to only one direction, while another 39% have total limits in their surrounding territories, preventing any chance of port expansion.
4.1.3. Dredging
To maintain the safe depth of the access channel, 25% of ports require frequent dredging. An additional 29% necessitate some form of intervention to deepen the access channel, while the remaining 46% is considered to have minimal dredging frequency. As justified previously, when no information about dredging was found, it was considered that there is a minimal dredging frequency, which applies to approximately 22% of ports. This assumption is based on the understanding that ports with substantial dredging needs typically maintain detailed records of dredging operations for planning and budgeting purposes. In addition, many smaller ports, handling shallow-draft ferries and small boats, operate within the natural dynamics of river flood and ebb, requiring minimal dredging intervention.
4.1.4. Water Accessibility
The water accessibility criterion reveals that nearly half (49%) of ports lack sufficient accessibility for large ships. The majority of ports are situated in areas with challenging access, characterized by curves, islands, and bridges that impede safe entry. However, 33% of ports boast safe and adequate accessibility, featuring obstacle-free channels. Additionally, another 18% exhibit relatively acceptable accessibility conditions.
4.1.5. Land and Water Connectivity
This criterion demonstrated that 45% of all ports lack adequate transport infrastructure for efficient cargo flow. These ports mostly rely on transportation through local or municipal roads, often located in urban areas that pose challenges for port access and are unsuitable for large vehicle movement, such as big trucks. Consequently, this leads to traffic congestion, road damage, truck delays, conflicts with the local population, and detriment to both the surrounding community and the port itself. Furthermore, 38% of ports have only one main transport route, whether by highway, railway, or inland waterways, which can impede port efficiency, particularly if there is insufficient storage capacity. Fortunately, 14% of ports exhibit slightly better performance, offering two potential transportation routes, enhancing efficiency compared to the former group. Only 3% of Brazilian ports benefit from three transport routes, facilitating agile cargo flow.
4.2. Results of the Criteria Application
Using these criteria, each of Brazil’s 210 port facilities was thoroughly assessed. Since each criterion scores between 0 and 10 and there are 5 criteria, the potential score for each port ranged from 0 to 50. The findings are presented in Table A1 of the Appendix A of this paper, ordered from ports with the highest to the lowest score, detailing the result of the application of each of the five criteria. The results reveal that the port with the higher results achieved 45 points, while ports with lower results obtained 0 points.
As presented previously in Section 3.5, a Pareto analysis was undertaken to determine which ports are selected for potentially accepting post-Panamax vessels. The cutoff of 20% selected the ports with a score of 35 or more points, totaling 28 ports.
The fourth quartile technique yielded a cutoff score of 27 points, which included 58 ports and accounted for 44% of the overall score. In this study, a more inclusive approach was adopted by selecting the fourth quartile methodology, as it includes a larger sample size of ports (58 vs. 28) and yields a higher cumulative score (44% vs. 20%).
Therefore, ports with a score of 27 points or higher were selected as candidates capable of accommodating post-Panamax vessels or undergoing expansion and adaptation to accommodate these ships. This criterion led to the identification of 58 ports meeting the threshold. The distribution of these 58 ports is as follows: 1 port scored 45 points (the highest score observed), 2 ports scored 42 points, 5 ports scored 40 points, 6 ports scored 37 points, 14 ports scored 35 points, 2 ports scored 32 points, 22 ports scored 30 points, and 6 ports scored 27 points. The 58 selected ports are depicted with red dots, which are included in a black box when representing multiple ports in Figure 9. Each port is numbered according to its corresponding identifier in the Appendix A and arranged in descending order of punctuation. These selected port facilities possess the capability to handle ships with greater drafts, offer land areas suitable for expansion without being constrained by urban straggle, necessitate minimal dredging, feature navigable waterways with ample maneuvering space, and boast robust transportation infrastructure to facilitate efficient cargo flow.
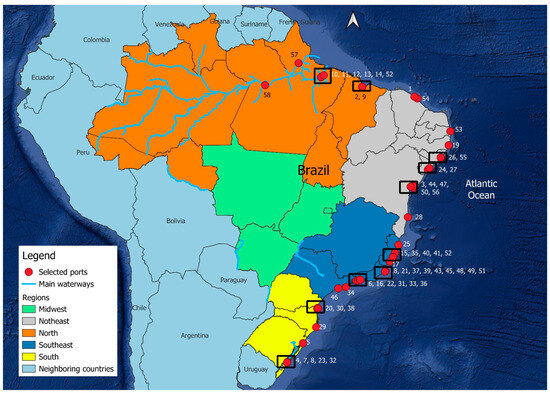
Figure 9.
Map with the selected ports (red points).
Out of the 58 chosen ports, 31% are situated along engineered coastlines, 24% are positioned within estuaries, and 28% are situated along protected coastlines. This sample distribution contrasts with the nationwide distribution of ports, as illustrated in Figure 3, where the majority (54%) are located along rivers. The predominance of river-based ports in the national context is largely attributed to their concentration in the Amazon region, where river transport serves as the primary mode of transportation. However, upon closer examination of the selected ports, the number of river-based ports decreases significantly, primarily due to criteria related to water depth and accessibility, which tend to favor coastal locations.
It is worth noting that none of the port facilities attained the maximum score of 50. The highest score recorded was 45, achieved by the Port of Pecém. Following closely behind with 42 points, there are the Port of Ponta da Madeira and the Port of Aratu; all three ports are on the Brazilian Northeast coast. This indicates that currently, no port facility in Brazil fully meets all the optimum criteria for accommodating the post-Panamax category ships.
Port of Pecém offers deep waters exceeding 15 m, land for expansion, minimal requirement for dredging, and satisfactory accessibility, lacking direct road and inland waterway access. Ponta da Madeira also features a water depth surpassing 15 m, infrequent dredging needs, and satisfactory accessibility, with the added advantage of access to both road and rail networks, but faces expansion limits due to neighboring port constraints. Aratu has expansive space, no dredging needs, and good accessibility but limited channel depth up to 12.7 m and relies on highways or railways for product flow
The third-highest score of 40 points was achieved by several ports, all of them being private terminals: Terbian Terminal Bianchini, Osório Waterway Terminal, Guaiba Island Terminal–TIG, Luiz Fogliatto Maritime Terminal–Termasa, and Bunge Alimentos Port Terminal. These ports share common attributes, such as recent construction, strategic planning, and positioning away from urban areas.
The application of the criteria revealed the underperformance of traditional ports, crucial to the country’s logistics. For example, the Port of Santos, renowned as the largest and most significant port in Latin America, ranked poorly at 152nd place, recording only 15 points. Similarly, the ports of Rio de Janeiro (62nd place, 25 points), Paranaguá (80th, 22 points), Recife (89th, 20 points), Itajaí (150th, 15 points), and Vitória (180th, 10 points) faced significant constraints due to the urban proximity. These ports, developed alongside cities, struggle with expanding infrastructure and high dredging demand.
5. Conclusions
This study developed a comprehensive data-driven framework to evaluate the suitability of Brazilian ports for accommodating post-Panamax vessels. It is the first comprehensive assessment of Brazilian ports focused specifically on their capacity to accommodate post-Panamax vessels, combining geographic, infrastructural, and operational criteria. A multi-criteria assessment was applied to 210 port facilities, using five key indicators: water depth, land capacity, dredging requirements, water accessibility, and land and water connectivity. The methodology incorporated Pareto and fourth quartile analyses to identify a prioritized subset of 58 ports with the highest potential for future expansion or adaptation.
The principal contribution of the research lies in the formulation of a replicable evaluation model specifically tailored to the Brazilian context. This model enables systematic comparison among port facilities and supports evidence-based decision-making for infrastructure planning and investment.
Findings indicate that a significant number of Brazilian ports are currently inadequately equipped to handle post-Panamax vessels, largely due to inadequate water depth, constrained land availability, and limited intermodal connectivity. In contrast, ports such as Pecém and Ponta da Madeira demonstrated higher readiness, while traditional urban ports like Rio de Janeiro and Santos face greater structural limitations.
By identifying the ports most suitable for accommodating larger vessels, this study provides a valuable first step toward prioritizing modernization efforts in the Brazilian port sector. The evaluation system proposed can also serve as a foundational model for other developing countries aiming to assess port readiness and plan strategic investments.
In conclusion, this research not only delivers a robust analytical tool for assessing Brazilian port infrastructure but also contributes to the broader discourse on port modernization in emerging economies. The results highlight the need for targeted planning and investment strategies to ensure that port development aligns with global maritime trends and supports national economic competitiveness.
6. Limitations and Future Considerations
This study presents a preliminary screening of 210 Brazilian port facilities based on five core infrastructural criteria: water depth, land capacity, dredging needs, water accessibility, and land and water connectivity. While this approach offers a structured and data-driven method for prioritizing port expansion candidates, several limitations must be acknowledged.
First, the scope did not extend to incorporate broader factors such as environmental conditions, climate influences, detailed risk assessments, financial constraints, or Environmental, Social, and Governance (ESG) criteria. These elements, while crucial to the long-term feasibility and sustainability of port development, require interdisciplinary expertise and localized studies beyond the capacity of this paper. Their exclusion reflects the study’s intent to establish a foundational technical framework rather than a comprehensive feasibility assessment.
Environmental and climatic risks, such as extreme weather events, sea-level rise, or ecological sensitivity, can significantly impact infrastructure resilience and should be evaluated in future studies. Likewise, incorporating risk management related to navigational safety, operational hazards, and geopolitical uncertainties could enhance the robustness of port selection.
The study also did not perform a detailed financial analysis, though it is acknowledged that upgrading port infrastructure, including dredging, modal integration, and digital systems, will require substantial investment. Government initiatives, such as the National Dredging Program and logistics planning frameworks, already highlight the scale of required funding.
Finally, regulatory and policy frameworks represent a significant constraint on port expansion in Brazil. Environmental licensing, land-use restrictions, and compliance with international conventions can delay project implementation and deter private investment. Future assessments could incorporate these regulatory dimensions, alongside stakeholder engagement and ESG indicators, to offer a more comprehensive and actionable basis for decision-making.
Future research should thus build on this framework by integrating economic, environmental, social, and governance perspectives to support more holistic, sustainable, and investment-ready port development strategies.
Author Contributions
A.M.P.: Data curation, Formal analysis, Writing—original draft; M.P.: Methodology, Writing—review and editing, Supervision; D.L.B.M.: Validation, Visualization; R.A.d.A.N.: Validation, Project administration, Funding acquisition; R.M.D.: Conceptualization, Supervision, Validation. All authors have read and agreed to the published version of the manuscript.
Funding
This research was financed in part by the Coordenação de Aperfeiçoamento de Pessoal de Nível Superior-Brasil (CAPES)-Finance Code 001.
Data Availability Statement
Research data are provided in Appendix A.
Acknowledgments
This study thanks the National Council for Scientific and Technological Development (CNPq grant numbers 315631/2021-0) for technical support.
Conflicts of Interest
The authors declare no conflicts of interest. The funders had no role in the design of the study; in the collection, analyses, or interpretation of data; in the writing of the manuscript; or in the decision to publish the results.
Abbreviations
The following abbreviations are used in this manuscript:
| QGIS | Quantum Geographic Information System |
| TEUs | Twenty-foot Equivalent Units |
| ANTAQ | National Waterway Transport Agency |
| MPor | Ministry of Ports and Airports |
| TUPs | Private Use Terminals |
| CSR | Centro de Sensoriamento Remoto |
| UFMG | Universidade Federal de Minas Gerais |
| SDG | Sustainable Development Goals |
Appendix A
Table A1.
Results of criteria application to all Brazilian ports.
Table A1.
Results of criteria application to all Brazilian ports.
| Position | Ports | Water Depth | Land Capacity | Dredging | Water Accessibility | Land and Water Connectivity | Score |
|---|---|---|---|---|---|---|---|
| 1 | Pecém | 10 | 10 | 10 | 10 | 5 | 45 |
| 2 | Terminal marítimo Ponta da Madeira | 10 | 5 | 10 | 10 | 7 | 42 |
| 3 | Aratu | 5 | 10 | 10 | 10 | 7 | 42 |
| 4 | Terbian Terminal Bianchini | 10 | 10 | 0 | 10 | 10 | 40 |
| 5 | Terminal Aquaviário Osório | 10 | 10 | 10 | 10 | 0 | 40 |
| 6 | Terminal da Ilha Guaíba-TIG | 10 | 5 | 10 | 10 | 5 | 40 |
| 7 | Terminal marítimo Luiz Fogliatto-Termasa | 10 | 10 | 0 | 10 | 10 | 40 |
| 8 | Terminal Portuário Bunge Alimentos | 10 | 10 | 0 | 10 | 10 | 40 |
| 9 | Itaqui | 10 | 5 | 5 | 10 | 7 | 37 |
| 10 | Porto de Murucupi | 5 | 5 | 10 | 10 | 7 | 37 |
| 11 | Terminal Ponta da Montanha | 5 | 5 | 10 | 10 | 7 | 37 |
| 12 | Terminal portuário graneleiro de Barcarena | 5 | 5 | 10 | 10 | 7 | 37 |
| 13 | Terminal Vila do Conde | 5 | 5 | 10 | 10 | 7 | 37 |
| 14 | Vila do Conde | 5 | 5 | 10 | 10 | 7 | 37 |
| 15 | Estaleiro Jurong | 10 | 10 | 5 | 10 | 0 | 35 |
| 16 | Itaguaí | 10 | 5 | 5 | 10 | 5 | 35 |
| 17 | Ponta de Ubu | 10 | 10 | 5 | 10 | 0 | 35 |
| 18 | Porto do Açu-Terminal de minério | 10 | 10 | 5 | 10 | 0 | 35 |
| 19 | Suape | 10 | 5 | 5 | 10 | 5 | 35 |
| 20 | Terminal Aquaviário de São Francisco do Sul | 10 | 10 | 10 | 5 | 0 | 35 |
| 21 | Terminal de Regaseificação de Açu | 10 | 10 | 5 | 10 | 0 | 35 |
| 22 | Terminal Thyssenkrupp | 10 | 5 | 5 | 10 | 5 | 35 |
| 23 | Yara fertilizantes | 10 | 5 | 0 | 10 | 10 | 35 |
| 24 | Terminal Aquaviário de Aracaju | 5 | 10 | 10 | 10 | 0 | 35 |
| 25 | Terminal Aquaviário do Norte Capixaba | 5 | 10 | 10 | 10 | 0 | 35 |
| 26 | Terminal Braskem | 5 | 5 | 10 | 10 | 5 | 35 |
| 27 | Terminal Marítimo Inácio Barbosa | 5 | 10 | 10 | 10 | 0 | 35 |
| 28 | TUP TMB-Terminal Marítimo de Belmonte | 5 | 10 | 10 | 10 | 0 | 35 |
| 29 | Imbituba | 10 | 5 | 0 | 10 | 7 | 32 |
| 30 | São Francisco do Sul | 5 | 5 | 5 | 10 | 7 | 32 |
| 31 | Porto Sudeste do Brasil | 10 | 5 | 5 | 10 | 0 | 30 |
| 32 | Rio Grande | 10 | 0 | 0 | 10 | 10 | 30 |
| 33 | Terminal Aquaviário de Angra dos Reis | 10 | 5 | 5 | 10 | 0 | 30 |
| 34 | Terminal Aquaviário de São Sebastião | 10 | 0 | 5 | 10 | 5 | 30 |
| 35 | Terminal de Tubarão | 10 | 0 | 5 | 10 | 5 | 30 |
| 36 | Terminal Portuário da Nuclep | 10 | 0 | 5 | 10 | 5 | 30 |
| 37 | Brasil Logística Offshore e Estaleiro Naval (Porto de Açu) | 5 | 10 | 5 | 10 | 0 | 30 |
| 38 | Itapoá | 5 | 10 | 5 | 10 | 0 | 30 |
| 39 | Porto do Açu-Terminal TMULT e TCAR | 5 | 10 | 5 | 10 | 0 | 30 |
| 40 | Portocel | 5 | 5 | 5 | 10 | 5 | 30 |
| 41 | Terminal Aquaviário de Barra do Riacho | 5 | 5 | 5 | 10 | 5 | 30 |
| 42 | Terminal de Barcaças Oceânicas | 5 | 5 | 10 | 10 | 0 | 30 |
| 43 | Terminal de combustíveis marítimos do Açu | 5 | 10 | 5 | 10 | 0 | 30 |
| 44 | Terminal de Regaseificação de GNL da Bahia-TRBA | 5 | 5 | 10 | 10 | 0 | 30 |
| 45 | Terminal Dome | 5 | 10 | 5 | 10 | 0 | 30 |
| 46 | Terminal marítimo Dow | 5 | 5 | 10 | 5 | 5 | 30 |
| 47 | Terminal marítimo Dow Aratu | 5 | 10 | 10 | 5 | 0 | 30 |
| 48 | Terminal Nov Flexibles | 5 | 10 | 5 | 10 | 0 | 30 |
| 49 | Terminal Technip Brasil Açu | 5 | 10 | 5 | 10 | 0 | 30 |
| 50 | TUP Enseada naval | 5 | 10 | 5 | 5 | 5 | 30 |
| 51 | TUP Intermoor | 5 | 10 | 5 | 10 | 0 | 30 |
| 52 | TUP Bertolini Belém | 0 | 5 | 10 | 10 | 5 | 30 |
| 53 | Cabedelo | 5 | 0 | 5 | 10 | 7 | 27 |
| 54 | Fortaleza | 5 | 0 | 5 | 10 | 7 | 27 |
| 55 | Maceió | 5 | 0 | 5 | 10 | 7 | 27 |
| 56 | Salvador | 5 | 0 | 5 | 10 | 7 | 27 |
| 57 | Santana | 5 | 0 | 10 | 5 | 7 | 27 |
| 58 | Santarém | 5 | 5 | 10 | 0 | 7 | 27 |
| 59 | Estaleiro Atlântico Sul | 10 | 5 | 5 | 5 | 0 | 25 |
| 60 | Angra dos Reis | 5 | 0 | 5 | 10 | 5 | 25 |
| 61 | Antonina | 5 | 10 | 0 | 10 | 0 | 25 |
| 62 | Rio de Janeiro | 5 | 0 | 5 | 10 | 5 | 25 |
| 63 | Terminal Aquaviário de Guamaré | 5 | 10 | 10 | 0 | 0 | 25 |
| 64 | Terminal Aquaviário Madre de Deus | 5 | 0 | 10 | 10 | 0 | 25 |
| 65 | Terminal de Praia Mole | 5 | 0 | 5 | 10 | 5 | 25 |
| 66 | Terminal marítimo alfandegário privativo de uso misto de Praia Mole | 5 | 0 | 5 | 10 | 5 | 25 |
| 67 | Terminal Portuário de Cotegipe | 5 | 10 | 5 | 5 | 0 | 25 |
| 68 | Terminal Portuário Privativo da Alumar | 5 | 10 | 10 | 0 | 0 | 25 |
| 69 | Porto de Itaituba da Caramuru alimentos | 0 | 10 | 10 | 0 | 5 | 25 |
| 70 | Caramuru Alimentos-São Simão | 0 | 10 | 10 | 0 | 5 | 25 |
| 71 | LDC Pederneiras | 0 | 10 | 10 | 0 | 5 | 25 |
| 72 | LDC São Simão | 0 | 10 | 10 | 0 | 5 | 25 |
| 73 | Terminal Trombetas | 0 | 5 | 10 | 0 | 10 | 25 |
| 74 | Terminal Saint-Gobain Icoaraci | 0 | 5 | 10 | 5 | 5 | 25 |
| 75 | ATEM Santarém | 0 | 10 | 10 | 0 | 5 | 25 |
| 76 | Bemar III | 0 | 10 | 10 | 0 | 5 | 25 |
| 77 | Terminais fluviais do Brasil | 0 | 10 | 10 | 0 | 5 | 25 |
| 78 | Base de Cruzeiro do Sul-BASUL II | 0 | 10 | 10 | 0 | 5 | 25 |
| 79 | Niterói | 5 | 0 | 5 | 5 | 7 | 22 |
| 80 | Paranaguá | 5 | 0 | 0 | 10 | 7 | 22 |
| 81 | Terminal de Munguba | 0 | 5 | 10 | 0 | 7 | 22 |
| 82 | Terminal fluvial Caulim | 0 | 5 | 10 | 0 | 7 | 22 |
| 83 | Terminal fluvial de Juruti | 0 | 5 | 10 | 0 | 7 | 22 |
| 84 | Terminal Aquaviário da Ilha d’água | 10 | 0 | 5 | 5 | 0 | 20 |
| 85 | Cattalini Terminais Marítimos | 5 | 0 | 0 | 10 | 5 | 20 |
| 86 | DP World Santos | 5 | 5 | 0 | 5 | 5 | 20 |
| 87 | Natal | 5 | 0 | 5 | 5 | 5 | 20 |
| 88 | Sucocítrico Cutrale | 5 | 5 | 0 | 5 | 5 | 20 |
| 89 | Terminal de Petróleo TPET/TOIL | 5 | 0 | 5 | 10 | 0 | 20 |
| 90 | Terminal flexível de GNL da Baía de Guanabara | 5 | 5 | 5 | 5 | 0 | 20 |
| 91 | Terminal Gerdau Aços Longos | 5 | 0 | 5 | 10 | 0 | 20 |
| 92 | Terminal Integrador Portuário Luiz Antonio Mesquita-TIPLAM | 5 | 5 | 0 | 5 | 5 | 20 |
| 93 | Terminal Marítimo Braskem | 5 | 5 | 5 | 5 | 0 | 20 |
| 94 | UTC Engenharia | 5 | 0 | 5 | 10 | 0 | 20 |
| 95 | Terminal marítimo privativo de Cubatão | 5 | 5 | 0 | 5 | 5 | 20 |
| 96 | Belo Monte Logística de Terminal | 0 | 10 | 10 | 0 | 0 | 20 |
| 97 | Areia Branca | 0 | 0 | 10 | 10 | 0 | 20 |
| 98 | Estaleiro Brasfels | 0 | 0 | 5 | 10 | 5 | 20 |
| 99 | Forno | 0 | 0 | 10 | 10 | 0 | 20 |
| 100 | Ilhéus | 0 | 0 | 5 | 10 | 5 | 20 |
| 101 | Recife | 0 | 0 | 5 | 10 | 5 | 20 |
| 102 | São Sebastião | 0 | 0 | 5 | 10 | 5 | 20 |
| 103 | Terminal de Macapá | 0 | 5 | 10 | 5 | 0 | 20 |
| 104 | Porto CPA | 0 | 10 | 10 | 0 | 0 | 20 |
| 105 | ABI Miritituba | 0 | 5 | 10 | 0 | 5 | 20 |
| 106 | Cargill Agrícola Miritituba | 0 | 5 | 10 | 0 | 5 | 20 |
| 107 | Estação Cianport Miritituba | 0 | 5 | 10 | 0 | 5 | 20 |
| 108 | Hidrovias do Brasil Miritituba | 0 | 5 | 10 | 0 | 5 | 20 |
| 109 | TERFRON Itaituba | 0 | 5 | 10 | 0 | 5 | 20 |
| 110 | Terminal de uso privado de Macau | 0 | 5 | 10 | 0 | 5 | 20 |
| 111 | TUP da Salina Francisco Menescal | 0 | 5 | 10 | 0 | 5 | 20 |
| 112 | Belém | 0 | 0 | 10 | 5 | 5 | 20 |
| 113 | Porto CRA | 0 | 0 | 10 | 5 | 5 | 20 |
| 114 | TUP J.F. de Oliveira | 0 | 0 | 10 | 5 | 5 | 20 |
| 115 | Amazon Aço Indústria e Comércio Ltda. | 0 | 5 | 10 | 0 | 5 | 20 |
| 116 | Cimento Vencemos | 0 | 5 | 10 | 0 | 5 | 20 |
| 117 | Estação EAG Bertolini | 0 | 5 | 10 | 0 | 5 | 20 |
| 118 | Itacal-Itacoatiara cálcarios Ltda. | 0 | 5 | 10 | 0 | 5 | 20 |
| 119 | J. A. Leite Navegação | 0 | 5 | 10 | 0 | 5 | 20 |
| 120 | Petróleo Sabbá-Manaus | 0 | 5 | 10 | 0 | 5 | 20 |
| 121 | Porto Brasilit | 0 | 5 | 10 | 0 | 5 | 20 |
| 122 | Rio Amazonas Terminais e Empreendimentos | 0 | 5 | 10 | 0 | 5 | 20 |
| 123 | Terminal Aquaviário Solimões Coari | 0 | 5 | 10 | 0 | 5 | 20 |
| 124 | Terminal graneleiro Hermasa | 0 | 5 | 10 | 0 | 5 | 20 |
| 125 | Terminal Portuário Novo Remanso | 0 | 5 | 10 | 0 | 5 | 20 |
| 126 | Companhia Portuária Vila Velha (CPVV) | 5 | 0 | 5 | 0 | 7 | 17 |
| 127 | J. F. de Oliveira-Manaus | 0 | 0 | 10 | 0 | 7 | 17 |
| 128 | Porto Jari-Terminal Munguba | 0 | 0 | 10 | 0 | 7 | 17 |
| 129 | Ronav | 0 | 0 | 10 | 0 | 7 | 17 |
| 130 | Terminal Aquaviário de Manaus | 0 | 0 | 10 | 0 | 7 | 17 |
| 131 | Brasco Logística Offshore | 5 | 0 | 5 | 5 | 0 | 15 |
| 132 | Cosan Lubrificantes e especialidades | 5 | 0 | 5 | 5 | 0 | 15 |
| 133 | Estaleiro Locar | 5 | 0 | 5 | 5 | 0 | 15 |
| 134 | Green Port Logística Portuária | 5 | 0 | 5 | 5 | 0 | 15 |
| 135 | Mac Laren Operações Offshore | 5 | 0 | 5 | 5 | 0 | 15 |
| 136 | Portonave | 5 | 5 | 0 | 5 | 0 | 15 |
| 137 | Teporti | 5 | 5 | 0 | 5 | 0 | 15 |
| 138 | Terminal CCPN | 5 | 0 | 5 | 5 | 0 | 15 |
| 139 | Terminal Ilha do Governador | 5 | 0 | 5 | 5 | 0 | 15 |
| 140 | Terminal marítimo ponte do Thun | 5 | 0 | 5 | 5 | 0 | 15 |
| 141 | Itajaí | 5 | 0 | 0 | 5 | 5 | 15 |
| 142 | Poly Terminais portuários | 5 | 0 | 0 | 5 | 5 | 15 |
| 143 | Santos | 5 | 0 | 0 | 5 | 5 | 15 |
| 144 | Terminal Portuário Braskarne | 5 | 0 | 0 | 5 | 5 | 15 |
| 145 | Terminal de embarque marítimo da Salina Diamante Branco | 0 | 5 | 10 | 0 | 0 | 15 |
| 146 | TUP Cesari | 0 | 5 | 10 | 0 | 0 | 15 |
| 147 | ATEM Miritituba | 0 | 5 | 10 | 0 | 0 | 15 |
| 148 | Companhia Brasileira de Asfalto da Amazônia | 0 | 5 | 10 | 0 | 0 | 15 |
| 149 | Petróleo Sabbá-Miritituba | 0 | 5 | 10 | 0 | 0 | 15 |
| 150 | Porto Crai | 0 | 5 | 10 | 0 | 0 | 15 |
| 151 | Terminal Distribuidora Equador Manaus | 0 | 5 | 10 | 0 | 0 | 15 |
| 152 | Terminal UNI-Z | 0 | 5 | 10 | 0 | 0 | 15 |
| 153 | TUP da Salina Guanabara | 0 | 5 | 10 | 0 | 0 | 15 |
| 154 | Barra do Rio Terminal Portuário | 0 | 5 | 0 | 5 | 5 | 15 |
| 155 | Base de Caracaraí-BARAC | 0 | 0 | 10 | 0 | 5 | 15 |
| 156 | Base de Distribuição secundária de Itaituba | 0 | 0 | 10 | 0 | 5 | 15 |
| 157 | Instalação Portuária Itahum Export | 0 | 10 | 0 | 0 | 5 | 15 |
| 158 | Porto Gregório Curvo | 0 | 10 | 0 | 0 | 5 | 15 |
| 159 | Terminal Santa Clara | 0 | 10 | 0 | 0 | 5 | 15 |
| 160 | TUP Vetorial Logística | 0 | 10 | 0 | 0 | 5 | 15 |
| 161 | Administração de Bens de Infraestrutura-Santarém | 0 | 0 | 10 | 0 | 5 | 15 |
| 162 | ATR Logística-Chibatão | 0 | 0 | 10 | 0 | 5 | 15 |
| 163 | Base Ipiranga Santarém | 0 | 0 | 10 | 0 | 5 | 15 |
| 164 | Chibatão Navegação e Comércio | 0 | 0 | 10 | 0 | 5 | 15 |
| 165 | Ipiranga Manaus | 0 | 0 | 10 | 0 | 5 | 15 |
| 166 | Manaus | 0 | 0 | 10 | 0 | 5 | 15 |
| 167 | Ponta Negra | 0 | 0 | 10 | 0 | 5 | 15 |
| 168 | Porto Chibatão | 0 | 0 | 10 | 0 | 5 | 15 |
| 169 | Superterminais Comércio e Indústria | 0 | 0 | 10 | 0 | 5 | 15 |
| 170 | Terminal Navecunha | 0 | 0 | 10 | 0 | 5 | 15 |
| 171 | TUP Bertolini Santarém | 0 | 0 | 10 | 0 | 5 | 15 |
| 172 | TUP Ibepar | 0 | 0 | 10 | 0 | 5 | 15 |
| 173 | TUP Moss | 0 | 0 | 10 | 0 | 5 | 15 |
| 174 | TUP Ocrim | 0 | 0 | 10 | 0 | 5 | 15 |
| 175 | Terminal Aquaviário de Niterói | 0 | 5 | 0 | 0 | 7 | 12 |
| 176 | Base logística de dutos | 5 | 0 | 0 | 5 | 0 | 10 |
| 177 | Terminal Portuário da Glória | 5 | 0 | 5 | 0 | 0 | 10 |
| 178 | Vitória | 5 | 0 | 5 | 0 | 0 | 10 |
| 179 | Norte Log | 0 | 0 | 10 | 0 | 0 | 10 |
| 180 | Terminal Aquaviário de Ilha Redonda e Ilha Comprida | 0 | 0 | 5 | 5 | 0 | 10 |
| 181 | ABI Porto Velho | 0 | 10 | 0 | 0 | 0 | 10 |
| 182 | ATEM Manaus | 0 | 0 | 10 | 0 | 0 | 10 |
| 183 | Petróleo Sabbá-Itaituba | 0 | 0 | 10 | 0 | 0 | 10 |
| 184 | Terminal de expedição de grãos Portochuelo | 0 | 10 | 0 | 0 | 0 | 10 |
| 185 | Terminal de Barcaças Luciano Villas Boas | 0 | 10 | 0 | 0 | 0 | 10 |
| 186 | Base Secundária Ipiranga Porto Velho | 0 | 5 | 0 | 0 | 5 | 10 |
| 187 | Bianchini Canoas | 0 | 5 | 0 | 0 | 5 | 10 |
| 188 | Cargill Agrícola Porto Velho | 0 | 5 | 0 | 0 | 5 | 10 |
| 189 | Ciagram Portos e Navegação da Amazônia | 0 | 5 | 0 | 0 | 5 | 10 |
| 190 | Granel Química Ladário | 0 | 5 | 0 | 0 | 5 | 10 |
| 191 | Terminal Fogás | 0 | 5 | 0 | 0 | 5 | 10 |
| 192 | TEVEL | 0 | 5 | 0 | 0 | 5 | 10 |
| 193 | TUP Supergasbrás | 0 | 5 | 0 | 0 | 5 | 10 |
| 194 | Oleoplan | 0 | 0 | 0 | 0 | 7 | 7 |
| 195 | Unidade Misturadora de Porto Alegre | 0 | 0 | 0 | 0 | 7 | 7 |
| 196 | Porto Alegre | 0 | 0 | 0 | 0 | 7 | 7 |
| 197 | AIVEL | 0 | 5 | 0 | 0 | 0 | 5 |
| 198 | ATEM Porto Velho | 0 | 5 | 0 | 0 | 0 | 5 |
| 199 | Belmont | 0 | 5 | 0 | 0 | 0 | 5 |
| 200 | Estação Cujubinzinho | 0 | 5 | 0 | 0 | 0 | 5 |
| 201 | Instalação Portuária F.H. de Oliveira Peixoto | 0 | 5 | 0 | 0 | 0 | 5 |
| 202 | Passarão | 0 | 5 | 0 | 0 | 0 | 5 |
| 203 | Terminal Hidroviário Cimbagé | 0 | 5 | 0 | 0 | 0 | 5 |
| 204 | Terminal Privado Copelmi | 0 | 0 | 5 | 0 | 0 | 5 |
| 205 | Merlim | 0 | 0 | 0 | 0 | 5 | 5 |
| 206 | Pelotas | 0 | 0 | 0 | 0 | 5 | 5 |
| 207 | Terminal de gás do Sul-Tergasul | 0 | 0 | 0 | 0 | 5 | 5 |
| 208 | CMPC Guaíba | 0 | 0 | 0 | 0 | 5 | 5 |
| 209 | Porto Velho | 0 | 0 | 0 | 0 | 0 | 0 |
| 210 | Terminal Amazongás | 0 | 0 | 0 | 0 | 0 | 0 |
References
- Puig, M.; Azarkamand, S.; Wooldridge, C.; Selén, V.; Darbra, R.M. Insights on the Environmental Management System of the European Port Sector. Sci. Total Environ. 2022, 806, 150550. [Google Scholar] [CrossRef]
- Ministério de Portos e Aeroportos Portos Brasileiros Registram Maior Movimentação da História Com 1,32 Bilhão de Toneladas Em 2024—Portos E Aeroportos. Available online: https://www.gov.br/portos-e-aeroportos/pt-br/assuntos/noticias/2025/02/portos-brasileiros-registram-maior-movimentacao-da-historia-com-132-bilhao-de-toneladas-em-2024 (accessed on 24 April 2025).
- Gouveia, T.F. Impactos dos Gargalos de Infraestrutura Portuária Sobre o Comércio Brasileiro: Uma Perspectiva a Partir do Porto de Santos. Undergraduate Thesis, Instituto de Relações Internacionais, Pontifícia Universidade Católica do Rio de Janeiro, Rio de Janeiro, Brazil, 2020. [Google Scholar]
- Carral, L.; Tarrio-Saavedra, J.; Castro-Santos, L.; Lamas-Galdo, I.; Sabonge, R. Effects of the Expanded Panama Canal on Vessel Size and Seaborne Transport. Promet-Traffic Transp. 2018, 30, 241. [Google Scholar] [CrossRef]
- Park, N.K.; Suh, S.C. Tendency toward Mega Containerships and the Constraints of Container Terminals. J. Mar. Sci. Eng. 2019, 7, 131. [Google Scholar] [CrossRef]
- American Association of Port Authorities (AAPA). Comparison between the Largest Panamax Container Vessel That Can Transit the Current Panama Canal and a Post-Panamax Size Vessel with 12,000 TEUs Container Capacity. The Larger Vessel Has 2.5 Times the Cargo Carrying Capacity of the Panamax Vessel. Court. Panama Canal Auth. (ACP) 2009. Available online: https://www.aapa-ports.org/files/Panamax%20vs%20Post-Panamax%20comparison%20article.pdf (accessed on 8 May 2025).
- Alam, G.; Oliveira, F. X FATECLOG-LOGÍSTICA 4.0 & A SOCIEDADE DO CONHECIMENTO A NECESSIDADE DA DRAGAGEM NO PORTO DE SANTOS. In Proceedings of the X FATECLOG, Guarulhos, Brazil, 31 May–1 June 2019. [Google Scholar]
- Gireli, T.Z.; Vendrame, R.F. Aprofundamento Do Porto de Santos Uma Análise Crítica. Rev. Bras. De Recur. Hídricos 2012, 17, 49–59. [Google Scholar] [CrossRef]
- Porto, M.M.; Teixeira, S.G. Portos e Meio Ambiente; Aduaneiras: São Paulo, Brazil, 2002. [Google Scholar]
- Torres, R.J. Uma Análise Preliminar Dos Processos de Dragagem Do Porto de Rio Grande, RS; Fundação Universidade Federal do Rio Grande: Rio Grande, Brazil, 2000. [Google Scholar]
- Elsaeed, G.H. The Impact of Dredging on Coastal Environments. Aust. J. Basic. Appl. Sci. 2011, 5, 74–81. [Google Scholar]
- Carolina Barbosa de Souza, A.; Felicia Pereira da Silva, M.D.; Rodrigues Moreira, N. A Importância Do Processo de Dragagem Impactos Ambientais No Porto de Santos. In Proceedings of the XII Fateclog—Gestão Da Cadeia De Suprimentos No Agronegócio: Desafios E Oportunidades No Contexto Atual, Mogi das Cruzes, Brazil, 18–19 June 2021. [Google Scholar]
- Notteboom, T.; Pallis, A.; Rodrigue, J.P. Port Economics, Management and Policy; Routledge: New York, NY, USA, 2022. [Google Scholar]
- Rocha, J.M. A Conflagração Do Espaço: A Tensa Relação Porto-Cidade No Planejamento Urbano. Estud. Avançados 2019, 33, 91–112. [Google Scholar] [CrossRef]
- Clementino, J. São Luís: A Changing Port City. Rev. De Ciência Tecnol. 2017, 21, 3–14. [Google Scholar] [CrossRef]
- Cordeiro, F.N.; de Castro Junior, O.A. Requisitos e Critérios Para Caracterizar a Relação Porto-Cidade Em Portos Brasileiros. In Proceedings of the V Congreso Internacional de Desempenho Portuário (CIDESPORT), Florianópolis, Brazil, 1–30 November 2018. [Google Scholar]
- Merk, O. The Competitiveness of Global Port-Cities: Synthesis Report. OECD Regional Development Working Papers, 6 September 2013, p. 185. Available online: https://www.oecd.org/en/publications/the-competitiveness-of-global-port-cities-synthesis-report_5k40hdhp6t8s-en.html (accessed on 8 May 2025).
- Calcerano, T.A.; de Castro Hilsdorf, W. Sustainability Practices in Container Terminals in Brazil. Production 2021, 31, 1–13. [Google Scholar] [CrossRef]
- Schulte, F.; Ascencio, L.; Gonzalez Ramírez, R.G.; Voss, S. DIRECTIONS FOR SUSTAINABLE PORTS IN LATIN AMERICA AND THE CARIBBEAN. Int. J. Transp. Econ. 2016, XLIII, 315–337. [Google Scholar]
- Sánchez, R.J.; Gómez-Paz, M.A. The Future of Green Corridors in Latin America: Potential and Obstacles. Available online: https://www.porteconomics.eu/the-future-of-green-corridors-in-latin-america-potential-and-obstractle/ (accessed on 25 April 2025).
- Economic Commission for Latin America and the Caribbean (ECLAC). Latin American and Caribbean Ports and Climate Risk: Impacts on Their Infrastructure and Possible Adaptation Measures; ECLAC: Santiago, Chile, 2024. [Google Scholar]
- Maluf, N.B. A Desestatização Dos Portos Públicos Brasileiros e Perspectivas Para a Infraestrutura. Portosenavios, 23 September 2022; p. 9. [Google Scholar]
- Bakirci, M. Smart City Air Quality Management through Leveraging Drones for Precision Monitoring. Sustain. Cities Soc. 2024, 106, 105390. [Google Scholar] [CrossRef]
- Bakirci, M. Evaluating the Impact of Unmanned Aerial Vehicles (UAVs) on Air Quality Management in Smart Cities: A Comprehensive Analysis of Transportation-Related Pollution. Comput. Electr. Eng. 2024, 119, 109556. [Google Scholar] [CrossRef]
- Fuentes García, G.; Echeverría, R.S.; Reynoso, A.G.; Baldasano Recio, J.M.; Rueda, V.M.; Retama Hernández, A.; Kahl, J.D.W. Sea Port SO2 Atmospheric Emissions Influence on Air Quality and Exposure at Veracruz, Mexico. Atmosphere 2022, 13, 1950. [Google Scholar] [CrossRef]
- Asif, Z.; Chen, Z.; An, C.; Dong, J. Environmental Impacts and Challenges Associated with Oil Spills on Shorelines. J. Mar. Sci. Eng. 2022, 10, 762. [Google Scholar] [CrossRef]
- Vilke, S.; Tadić, F.; Ćelić, J.; Debelić, B. The Impact of Northern Adriatic Ports Container Throughput on Air Quality Environmental Parameters. Sci. J. Marit. Univ. Szczec. 2022, 71, 123–131. [Google Scholar] [CrossRef]
- Schiavoni, S.; D’alessandro, F.; Baldinelli, G.; Turrioni, C.; Schenone, C.; Borelli, D.; Marsico, G. Guidelines for a Common Port Noise Impact Assessment: The ANCHOR LIFE Project. Noise Mapp. 2022, 9, 89–108. [Google Scholar] [CrossRef]
- ESPO. ESPO Environmental Report 2024; ESPO: Brussels, Belgium, 2024. [Google Scholar]
- Lindstad, H.; Asbjørnslett, B.E.; Strømman, A.H. The Importance of Economies of Scale for Reductions in Greenhouse Gas Emissions from Shipping. Energy Policy 2012, 46, 386–398. [Google Scholar] [CrossRef]
- Panagakos, G.; de Sousa Pessôa, T.; Dessypris, N.; Barfod, M.B.; Psaraftis, H.N. Monitoring the Carbon Footprint of Dry Bulk Shipping in the EU: An Early Assessment of the MRV Regulation. Sustainability 2019, 11, 5133. [Google Scholar] [CrossRef]
- Chang, C.C.; Jhang, C.W. Reducing Speed and Fuel Transfer of the Green Flag Incentive Program in Kaohsiung Port Taiwan. Transp. Res. Part D 2016, 46, 1–10. [Google Scholar] [CrossRef]
- Conway, K.C. North American Port Analysis: Beyond Post-Panamax Basics to Logistics. Real Estate Issues 2012, 37, 1. [Google Scholar]
- Miller, K.; Hyodo, T. Impact of the Panama Canal Expansion on Latin American and Caribbean Ports: Difference in Difference (DID) Method. J. Shipp. Trade 2021, 6, 8. [Google Scholar] [CrossRef]
- Tagawa, H.; Kawasaki, T.; Hanaoka, S. Evaluation of International Maritime Network Configuration and Impact of Port Cooperation on Port Hierarchy. Transp Policy 2022, 123, 14–24. [Google Scholar] [CrossRef]
- ANTAQ Competências—Agência Nacional de Transportes Aquaviários (ANTAQ). Available online: https://www.gov.br/antaq/pt-br/acesso-a-informacao/institucional/copy_of_competencias (accessed on 31 March 2025).
- ANTAQ Estatístico Aquaviário 2023. Available online: https://web3.antaq.gov.br/ea/sense/index.html#pt (accessed on 31 March 2025).
- Ilyas, M.; Jin, Z.; Ullah, I. Optimizing Logistics and Transportation Locations in the China–Pakistan Economic Corridor: A Strategic Risk Assessment. Appl. Sci. 2024, 14, 1738. [Google Scholar] [CrossRef]
- Ilyas, M.; Jin, Z.; Ullah, I.; Zaheer, Q.; Ali Aden, W. The Influence of Customer Relationships on Supply Chain Risk Mitigation in International Logistics. Civ. Eng. J. 2024, 10, 1874–1889. [Google Scholar] [CrossRef]
- Gupta, K.; Prakash, G. Unveiling the Ports of Potential: Measuring Competitiveness in Emerging South Asian Maritime Port Clusters. Res. Transp. Bus. Manag. 2024, 55, 101132. [Google Scholar] [CrossRef]
- da Silva, P.D.; Fernandes, E.H.; Gonçalves, G.A. Sustainable Development of Coastal Areas: Port Expansion with Small Impacts on Estuarine Hydrodynamics and Sediment Transport Pattern. Water 2022, 14, 3300. [Google Scholar] [CrossRef]
- Assis, A.C.V.; Silva, R.I.; Gomes, L.F.A.M.; Gonçalves, E.D.L. Port Capacity Expansion under Real Options Approach: A Case Study in Brazil. Indep. J. Manag. Prod. 2022, 13, 234–257. [Google Scholar] [CrossRef]
- Porto de Santos Porto de Santos. Available online: https://www.portodesantos.com.br/ (accessed on 26 April 2024).
- Docas do Ceará—Autoridade Portuária Informações Operacionais|Porto de Fortaleza. Available online: https://www.docasdoceara.com.br/informacoes-operacionais (accessed on 26 April 2024).
- Gazeta do Povo Após 10 Anos, Porto de Antonina Terá Processo de Dragagem. Available online: https://www.gazetadopovo.com.br/economia/apos-10-anos-porto-de-antonina-tera-processo-de-dragagem-1v0jsjl4v273oc7rowhaitq32/ (accessed on 6 May 2024).
- Portos Rio—Autoridade Portuária 23. Dragagens|PortosRio. Available online: https://www.portosrio.gov.br/pt-br/sustentabilidade/dados-ambientais-estudos-convenios/dragagens (accessed on 26 April 2024).
- Porto do Açu—Prumo Logística o Encontro da Eficiência Com a Infraestrutura Completa.
- da Silva Abel, E.L. Dinâmica Ambiental Da Bacia Hidrográfica Do Rio Juruá Na Amazônia Ocidental; Universidade Federal Rural do Rio de Janeiro: Seropédica, Brazil, 2019. [Google Scholar]
- Ministério dos Transportes DNIT Inicia Campanha de Dragagem do Rio Madeira, No Amazonas e Em Rondônia—Departamento Nacional de Infraestrutura de Transportes. Available online: https://www.gov.br/dnit/pt-br/assuntos/noticias/dnit-inicia-campanha-de-dragagem-do-rio-madeira-no-amazonas-e-em-rondonia (accessed on 26 April 2024).
- Companhia Docas do Rio de Janeiro (CDRJ). Available online: https://www.gov.br/pt-br/orgaos/companhia-docas-do-rio-de-janeiro (accessed on 4 April 2025).
- Transpetro Transpetro. Available online: https://transpetro.com.br/transpetro-institucional/nossas-atividades/dutos-e-terminais/terminais-aquaviarios/angra-dos-reis-rj.htm (accessed on 26 April 2024).
- MapBiomas Project. Available online: https://brasil.mapbiomas.org/colecoes-mapbiomas/ (accessed on 3 April 2025).
- Center for Remote Sensing of the Federal University of Minas Gerais (CSR/UFMG) CSR Maps—Centro de Sensoriamento Remoto. Available online: https://maps.csr.ufmg.br/ (accessed on 26 April 2024).
- ANTAQ. Informações Geográficas—Agência Nacional de Transportes Aquaviários (ANTAQ). Available online: https://www.gov.br/antaq/pt-br/central-de-conteudos/informacoes-geograficas (accessed on 30 April 2024).
- Ministério dos Transportes Calado Para Acesso a Vila do Conde Atinge 12,8 Metros. Available online: https://www.gov.br/transportes/pt-br/assuntos/transporte_aquaviario-antigo/noticias-portos/calado-para-acesso-a-vila-do-conde-atinge-128-metros (accessed on 4 April 2025).
- Portos RS. Localização e Acessos. Available online: https://www.portosrs.com.br/site/comunidade_portuaria/porto_alegre/localizacao (accessed on 24 April 2024).
- Bianchini DRAGAGEM NO TERBIAN—Bianchini. Available online: https://bianchinisa.com.br/informativo/dragagem-no-terbian/ (accessed on 3 April 2025).
- SOPESP (Sindicato dos Operadores Portuários do Estado de São Paulo). Porto de Vitória Conclui Dragagem e Retoma Calado Máximo de 12,5 Metros. Available online: https://sopesp.com.br/2022/03/03/porto-de-vitoria-conclui-dragagem-e-retoma-calado-maximo-de-125-metros/ (accessed on 3 April 2025).
- do Carmo Ferrão Santos, M.; Tassito Corrêa Ivo, C. EFEITOS DA DEPOSIÇÃO DE MATERIAL DRAGADO SOBRE A POPULAÇÃO DE CAMARÃO SETE-BARBAS, Xiphopenaeus Kroyeri (HELLER, 1862), EM FRENTE AO MUNICÍPIO DE CARAVELAS (BAHIA-BRASIL). Bol. Técnico-Científico Do Cepene 2008, 16, 9–22. [Google Scholar]
- Figueiredo, A.R. Análise da Influência da Corrente Marítima Na Remoção dos Sedimentos No Terminal Marítimo Ponta da Madeira Em São Luís—MA; Universidade Federal do Maranhão: São Luís, Brazil, 2018. [Google Scholar]
- Governo do Estado do Ceará Porto do Pecém Eleva Capacidade Operacional Com Nova Batimetria—Governo do Estado do Ceará. Available online: https://www.ceara.gov.br/2020/07/02/porto-do-pecem-eleva-capacidade-operacional-com-nova-batimetria/ (accessed on 6 May 2024).
- Ministérios dos Transportes Ordem de Serviço da Dragagem do Porto de Maceió é Assinada—Ministério dos Transportes. Available online: https://www.gov.br/transportes/pt-br/assuntos/noticias/ultimas-noticias/ordem-de-servico-da-dragagem-do-porto-de-maceio-e-assinada (accessed on 6 May 2024).
- Porto de Santos Dragagem. Available online: https://www.portodesantos.com.br/informacoes-operacionais/dragagem/ (accessed on 3 April 2025).
- Wang, C.; Dou, X.; Haralambides, H. Port Centrality and the Composite Connectivity Index: Introducing a New Concept in Assessing the Attractiveness of Hub Ports. Marit. Econ. Logist. 2022, 24, 67–91. [Google Scholar] [CrossRef]
- Hayley, C. Explaining the 80-20 Rule with the Pareto Distribution, D-Lab. Available online: https://dlab.berkeley.edu/news/explaining-80-20-rule-pareto-distribution (accessed on 6 May 2024).
- Cuemath Quartile Formula—What Is Quartile Formula? Available online: https://www.cuemath.com/quartile-formula/ (accessed on 6 May 2024).
Disclaimer/Publisher’s Note: The statements, opinions and data contained in all publications are solely those of the individual author(s) and contributor(s) and not of MDPI and/or the editor(s). MDPI and/or the editor(s) disclaim responsibility for any injury to people or property resulting from any ideas, methods, instructions or products referred to in the content. |
© 2025 by the authors. Licensee MDPI, Basel, Switzerland. This article is an open access article distributed under the terms and conditions of the Creative Commons Attribution (CC BY) license (https://creativecommons.org/licenses/by/4.0/).