Abstract
Tropical cyclones (TCs) induce pronounced sea surface temperature (SST) cooling, which strongly influences their intensity. Accurate prediction of TC intensity is particularly important in coastal regions where landfall occurs. While SST cooling has been extensively studied in the open ocean, its characteristics in coastal seas remain less understood. Using satellite and reanalysis data from 2004 to 2021, this study systematically characterizes SST cooling in China’s coastal seas—the Yellow Sea, East China Sea, Taiwan Strait, and northern South China Sea—and compares the cooling with adjacent offshore regions. Composite analyses of about 6300 TC track points reveal that coastal SST cooling shows significant differences relative to their offshore cooling. Regionally, the Yellow Sea exhibits significantly stronger coastal cooling (−2.5 °C vs. −1.8 °C), whereas the Taiwan Strait shows weaker coastal cooling. Further analyses using a statistical subsampling method reveal that coastal–offshore cooling differences result from the combined effects of TC attributes and pre-TC oceanic conditions, with temperature stratification exerting the dominant control. Furthermore, an increasing trend in coastal cooling is linked to enhanced temperature stratification. These findings highlight the critical role of pre-TC temperature structure in modulating coastal SST responses, with implications for improving intensity forecasts and risk assessments.
1. Introduction
Tropical cyclones (TCs), also known as typhoons or hurricanes, are among the most destructive natural disasters [1]. They produce destructive winds, torrential rainfall, storm surges, and flooding, frequently striking densely populated coastal regions and causing extensive socioeconomic losses on a global scale [2,3]. From an operational perspective, accurate forecasts of TC intensity in coastal regions are therefore essential for mitigating potential damage. While significant improvements in TC track prediction have been achieved over the past decades, forecasting TC intensity remains a considerable challenge with relatively limited progress [4,5].
The oceans serve as the primary energy source for TCs, and the sea surface temperature (SST) is one of the most important factors for predicting TC intensity [6,7]. SST directly affects the heat fluxes across the air–sea interface and largely determines the maximum potential intensity of TCs [2,8,9]. When a TC passes over the ocean, the upper ocean is cooled through some dynamic processes, including vertical mixing, upwelling, horizontal advection, and air–sea surface heat fluxes [8,10,11,12,13]. The vertical mixing triggered by TC-generated near-inertial waves dominates the SST cooling. Under strong TC wind forcing, cooler subsurface water is mixed with the warm surface water by strong sheared near-inertial currents, thus inducing significant SST cooling, accounting for ~80% of the total cooling [8,14,15]. TC-induced upwelling, horizontal advection and air–sea surface heat fluxes contribute to the remaining SST cooling [11,16]. The SST cooling is typically manifested as a cold wake left behind the TC center, extending hundreds of kilometers along the TC track [10,17]. Satellite and in situ observations show that TC-induced SST cooling typically ranges from less than 1 °C to more than 10 °C [18,19,20,21]. TC-induced SST cooling suppresses further TC intensification and often acts as negative feedback [6,22,23,24,25,26,27,28,29,30,31,32,33,34,35,36]. The temperature response to TCs is controlled by multiple factors, including TC intensity, translation speed, storm size, pre-TC ocean conditions, and some multiscale ocean processes [8,27,36]. According to previous observational and model studies, stronger TC intensity, slower translation speed, larger storm size, stronger temperature stratification, and weaker salinity stratification generally induce stronger SST cooling [27,30,34,35]. Deeper mixed layer depth (MLD) reduces SST cooling by increasing the upper ocean heat capacity, whereas shallower MLD enhances the SST cooling [37]. The pre-TC upper-ocean stratification that regulates the SST cooling can be influenced by multiscale ocean processes, including the seasonal cycle [21,38], mesoscale eddies [39,40], internal tides [31,32], barrier layers [41,42], or some specific coastal processes [43].
Coastal regions are strongly influenced by multiple ocean and atmosphere processes, such as freshwater runoff, shallow bathymetry, and complex coastal ocean dynamics [21,38,44]. These processes often lead to SST changes in coastal seas that differ significantly from those in the open ocean. For instance, several case studies revealed that TC-induced SST cooling in coastal seas is more significant than in the offshore, resulting from the sharper thermocline structure combined with coastal dynamics [21,45]. Moreover, SST cooling can be reduced in regions where typhoon-induced downwelling dominates or where surface heat fluxes play a leading role in shallow coastal environments [43,46]. Importantly, a recent study by Da and his coauthors [5] compared the global coastal and offshore cold wakes, demonstrating that the coastal SST cooling is significantly stronger in coastal seas. While these studies provide valuable insights into the global variability of TC-induced cold wakes, detailed investigations focusing specifically on coastal SST responses remain relatively limited.
China’s coastal seas have experienced a notable increase in TC-related disasters over the past several decades, and recent studies have revealed an intensification in coastal TCs during the past 40 years [3,47]. These findings highlight the need to better understand SST responses to TCs in the coastal waters. Previous studies have investigated the coastal SST responses to TCs in regions such as the Yellow Sea (YS), East China Sea (ECS), Taiwan Strait (TWS) and northern South China Sea (NSCS), where the probability of TC landfalls is high [38,48,49,50,51,52,53,54]. In the YS, the Yellow Sea Cold Water Mass (YSCWM), a remnant of the preceding winter, plays a key role in shaping the vertical thermal structure [55]. During summer, the enhanced solar radiation heating increases the SST, creating the sharp temperature stratification with the YSCWM, leading to more pronounced SST cooling to typhoons over the Yellow Sea [50]. Moreover, the shallow bathymetry seasonal evolution of the thermal structure in the YS may limit the SST cooling to intense TCs [38]. In addition, the freshwater discharge from the Changjiang Diluted River forms a low-salinity layer that enhances stratification and forms the barrier layer, thereby inhibiting the vertical mixing and reducing SST cooling during TC passage [53,54]. In the TWS, the different TC tracks, complex bathymetry and upwelling regions produce different types of SST responses, ranging from cooling and warming, as revealed by satellite and mooring observations [48,49]. In the NSCS, the location of maximum SST cooling induced by TCs—whether in the coastal or offshore seas—is affected by the TC track, moving direction, and the local bathymetry in the coastal regions [52].
Despite these previous case studies providing valuable insights into the local SST responses to TCs in China’s coastal regions, nearshore responses are highly complex due to multiple TC and oceanic factors and cannot be fully characterized by individual events. Thus, a systematic analysis of TC-induced SST responses in China’s coastal seas and their comparison with the open ocean is still lacking. In this study, we systematically compare TC-induced SST cooling between China’s coastal seas and the open ocean and further assess how TC typical attributes (TC intensity, translation speed, and storm size) and pre-TC oceanic conditions (temperature and salinity stratification) contribute to the observed differences. The remainder of this paper is organized as follows. Section 2 describes the datasets and methods used, including TC best-track data, satellite and reanalysis ocean products, along with the subsampling and bootstrap methods for composite analysis. Section 3 presents the magnitude and spatial and temporal characteristics of SST cooling induced by TCs in both coastal and offshore regions. Section 4 provides a detailed discussion on the interannual variability of SST cooling in coastal and offshore regions. Finally, Section 5 summarizes the main findings and discusses their implications for understanding and predicting TC impacts in China’s coastal seas.
2. Materials and Methods
2.1. TC Best-Track Data and Study Area
TC best-track data from 2004 to 2021 is obtained from the International Best Track Archive for Climate Stewardship (IBTrACS), latest version 4.1 [56,57], which is provided by the US Joint Typhoon Warning Center (JTWC). The dataset includes information on typhoon center locations, the minimum central pressure, the maximum wind speed (Vmax), the radius of maximum wind speed (RMW), and the radii of 34, 50 and 64 kt wind speeds (R34, R50 and R64; 1 kt ≈ 0.51 m s−1) at 6 h intervals. Note that the wind radii information has been available since 2004. TC intensity in this study is measured by 10 min maximum sustained wind speed and classified as Tropical Depression (TD; Vmax < 18 m s−1), Tropical Storm (TS; 18 m s−1 < Vmax < 33 m s−1), and the categories of the Saffir–Simpson Scale [58]: Category 1 (Cat 1; 33 m s−1 < Vmax < 43 m s−1), Category 2 (Cat 2; 43 m s−1 < Vmax < 50 m s−1), Category 3 (Cat 3; 50 m s−1 < Vmax < 58 m s−1), Category 4 (Cat 4; 58 m s−1 < Vmax < 69 m s−1), Category 5 (Cat 5; Vmax > 69 m s−1). Considering the correlation between wind radius and SST cooling, as well as the sample sizes for individual wind radii, we use R34 as the representative storm size in this study [5,35,59]. TC translation speed (Vtrans) is computed by dividing the moving distance between 6 h before and 6 h after the current position by 12 h. Overall, a total of 376 TCs with more than 6300 TC track points are analyzed here (Figure 1).
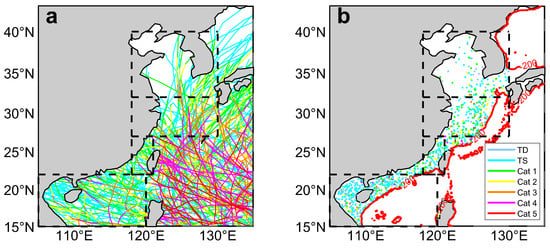
Figure 1.
(a) Six-hourly TC tracks from 2004 to 2021. (b) TC track points in the coastal seas. The thick red solid lines indicate 200 m isobath. Different colors indicate different categories of TC intensity: TD, TS, and Cat 1–5. Black dashed boxes indicate different coastal seas: YS, ECS, TWS and NSCS.
The study areas are divided into four coastal seas of China: the YS (32° N–40° N, 118° E–130° E), the ECS (27° N–32° N, 118° E–130° E), the TWS (22° N–27° N, 118° E–121° E), and the NSCS (15° N–22° N, 105° E–120° E). The boundary between coastal and offshore regions is defined using 200 m depth (Figure 1b), which effectively encompasses most of the YS, ECS and TWS, while the continental and island shelves in the NSCS are generally shallower than 200 m [60]. To further ensure this selection, we examined the variations in global mean TC attributes and pre-TC ocean stratification as a function of water depth (Figure S1 in the Supplementary Materials). Both TC attributes and pre-TC stratification exhibit relatively rapid changes in waters shallower than 200–300 m, but their rates of change decrease substantially in deeper regions. Above all, we use 200 m depth as a reasonable threshold to separate coastal and offshore regions. The open ocean used for comparison lies within the same latitudinal range as the coastal seas, with its longitudinal extent reaching 180° E.
2.2. Datasets
2.2.1. SST Observation
We use SST and its variations to investigate the temperature response to TCs rather than the ocean heat content (OHC) because OHC is much more difficult to estimate accurately in coastal seas due to shallow bathymetry, freshwater input and complex stratification. To statistically analyze TC-induced SST responses in coastal seas, we use the microwave (MW) optimally interpolated (OI) SST products from Remote Sensing Systems (RSS). These products have been widely applied in previous studies of SST responses to TCs [24,33], since MW sensors can penetrate clouds and provide reliable SST data even under TC conditions. The daily MW SST dataset, available since 1998, integrates observations from multiple satellite microwave sensors, including the Tropical Rainfall Measuring Mission Microwave Imager (TMI), the Advanced Microwave Scanning Radiometers for EOS (AMSR-E and AMSR2), the WindSat polarimetric radiometer, and the Global Precipitation Measurement (GPM) Microwave Imager (GMI), with a spatial resolution of 0.25° × 0.25°. Although SST and inner-core cooling estimates under high winds and heavy rainfall remain uncertain, as reported in both earlier and recent studies [61,62,63,64], these biases are unlikely to substantially influence the robustness of our qualified analysis.
In this study, the maximum SST anomaly (SSTA, representing the SST anomaly and the magnitude of SST cooling) is defined as the difference between the minimum SST within 0–8 days after TC passage and the pre-TC SST, calculated as the average SST over 3–12 days before TC. The cold wake is defined as the difference between the mean SST during 1–3 days after TC passage and pre-TC SST, which is used to characterize the spatial pattern of post-TC cooling.
2.2.2. Reanalysis Dataset
We use the vertical temperature and salinity from version 3.15.2 of the Simple Ocean Data Assimilation (SODA) reanalysis dataset to analyze the evolution of ocean temperature and salinity structures before and after TC passage. This allows us to examine the respective roles of temperature and salinity stratification in TC-induced SST response. The SODA 3.15.2 dataset, forced by ERA5, applies the Coast Ocean-Atmosphere Response Experiment 4 (COARE4) bulk formula and assimilates multiple observational datasets (e.g., satellite remote sensing, in situ measurements). It provides 5-day averages with a spatial resolution of 0.5° × 0.5° and 50 vertical levels extending from the surface to 5395 m.
Given the 5-day temporal resolution, we use the mean stratification averaged over 5–10 days before TC passage as the pre-TC condition. Temperature stratification is evaluated following a metric T100 proposed by Price and his coauthors [65], which assumes a TC-driven mixed layer depth of ~100 m and is widely used to explore the role of the upper-ocean temperature structure in modulating SST cooling. In shallow coastal regions, where the depth is typically less than 100 m, T100 effectively represents the vertically averaged temperature from the surface to the bottom. The strength of temperature stratification is quantified as the temperature difference between SST and T100 (denoted as Ta), while salinity stratification is defined analogously as Sa.
2.3. Subsampling Technique
To separate the influence of ocean conditions and TC attributes on the differences in SST cooling between coastal and offshore seas, we adopt a subsampling technique. All TC track points in the western North Pacific (WNP) are first divided into coastal and offshore groups. To eliminate the impact of TC attributes, we require the two groups to share consistent probability distributions of Vmax, Vtrans, and R34. Specifically, the ranges of Vmax (0–80 m s−1), Vtrans (0–20 m s−1), and R34 (0–500 km) are divided into bins with sizes of 10 m s−1, 1 m s−1, and 50 km, respectively. All possible combinations of Vmax–Vtrans–R34 bins whose Vmax, Vtrans, and R34 values fall within that specific set of bins are then constructed. For each combination, coastal and offshore TC cases are separately collected, and the smaller sample size is retained to ensure comparable distributions between the two groups. This process is repeated across all bin combinations until subsamples with matched probability distributions are obtained. More details are presented in Da and his coauthors [5]. The consistency of the distributions is further examined using the Kolmogorov–Smirnov (KS) test, and only samples passing the test are retained. In this way, the coastal and offshore subsamples are made statistically indistinguishable in terms of TC attributes while preserving as many coastal TC samples as possible. Consequently, the differences in SST response to TCs between coastal and offshore seas identified in subsequent analyses can be attributed primarily to pre-TC oceanic conditions, independent of the effects of TC intensity, translation speed, or storm size.
2.4. Bootstrap Method
We employ the bootstrap method to estimate the mean values and confidence intervals of SST cooling magnitude, TC attributes, and ocean conditions to compare differences between coastal and offshore seas [66]. Specifically, we randomly resample the original dataset with replacement using the same sample size as the original data and compute the mean for each resample. This process is repeated 1000 times, yielding a distribution of 1000 mean values. The final mean is defined as the median (50th percentile) of these 1000 values, while the 95% confidence interval is taken as the range between the 2.5th and 97.5th percentiles. Two mean values (e.g., coastal versus offshore) are considered significantly different if their confidence intervals do not overlap. Notably, the bootstrap method is not applied to the spatiotemporal SST response, as it is primarily designed for estimating mean values and confidence intervals rather than examining its temporal and spatial characteristics.
3. Results
In this section, we present the composite analysis of TC-induced SST cooling in China’s coastal seas and the open ocean. We first examined the magnitude and spatial and temporal characteristics of SST cooling in coastal and offshore seas, and analyzed their differences. Moreover, we use the subsampling method to separate the relative contributions of TC and oceanic driving factors, including Vmax, Vtrans, R34, Ta and Sa, to the observed coastal–offshore differences in SST cooling.
3.1. Characteristics of TC-Induced SST Cooling
To examine the characteristics of the magnitude and spatial pattern of the SST cooling in the coastal seas, we first composited the cold wakes associated with TCs in the coastal China seas and their corresponding offshore regions (Figure 2 and Figure 3). The characteristics of the cold wakes by observations in both coastal and offshore regions can also be simulated in numerical ocean models, such as ROMS (Regional Ocean Modeling System) and 3DPWP (three-dimensional Price–Weller–Pinkel) models [11,67,68,69,70,71]. Generally, the characteristics of SST cooling induced by coastal TCs have significant differences compared to the offshore TCs with the same latitudes in different seas.
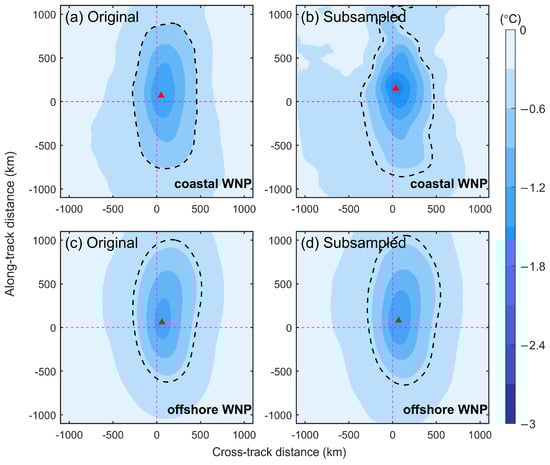
Figure 2.
Spatial patterns of composited SSTA associated with TCs in original (a) coastal, (c) offshore, and subsampled (b) coastal, (d) offshore WNP. The black dashed line in each subplot indicates the contour of SSTA = −0.5 °C, representing the cold wake area. The red triangle in each subplot indicates the location of the maximum TC-induced SSTA.
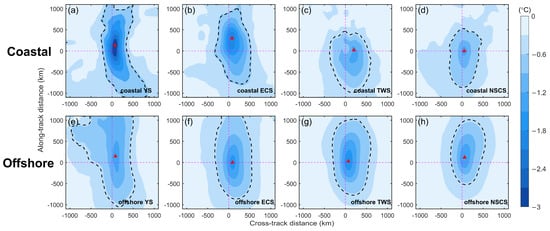
Figure 3.
As in Figure 2, but for the spatial patterns of composited SSTA associated with TCs in different (a–d) coastal and (e–h) offshore seas (from left to right, YS, ECS, TWS, and NSCS).
In the WNP, the maximum SSTA caused by coastal TCs is −1.9 °C, comparable to the offshore TCs (−1.9 °C). The cooling area with SSTA stronger than −0.5 °C refers to the cold wake in this study, and the cold wake area by coastal TCs (101.3 × 10⁴ km2) is comparable to the offshore (100.1 × 10⁴ km2) (Figure 2a,c). In the YS, the maximum SSTA reaches −2.5 °C, but only −1.8 °C for the corresponding offshore TCs (Figure 3a,e), and the cold wake area (138.7 × 10⁴ km2) is 30% smaller than that caused by offshore TCs (198.7 × 10⁴ km2). In the ECS, the maximum SSTA by coastal TCs (−2.2 °C) is slightly larger than offshore TCs (−2.0 °C), and the coastal cold wake area (109.5 × 10⁴ km2) is 24% smaller than the offshore area (143.8 × 10⁴ km2) (Figure 3b,f). The magnitude and spatial characteristics are similar between the coastal and offshore NSCS, revealing that the coastal maximum SSTA (−1.7 °C) is comparable to the offshore (−1.7 °C), and the cold wake area by coastal TCs (79.3 × 10⁴ km2) is only 17% smaller than offshore TCs (96.0 × 10⁴ km2) (Figure 3c,g).
By contrast, the maximum SSTA caused by coastal TCs in the TWS is much weaker than the offshore (−1.2 °C vs. −2.1 °C), and the cold wake area is 20% smaller (106.6 × 10⁴ km2 vs. 132.6 × 10⁴ km2) (Figure 3d,h). In addition, the shape of the cold wake in the TWS exhibits a distinct feature compared with the other three regions, with weaker cooling in the front part and stronger cooling in the rear part (Figure 3c). As the TC approaches Taiwan Island, several factors suppress SST cooling on the forward side of the TC track: (1) the shallow bathymetry and existing tidal mixing reduce the effective depth of vertical mixing [72]; (2) TC structure often weakens under the interaction with complex terrain, leading to reduced TC wind forcing; (3) TC translation speed typically increases before landfall and reduces the residence time of strong TC winds; and (4) some processes like Kuroshio branch and upwelling along the Fujian–Zhejiang coast weaken the vertical temperature gradient [73,74,75]. These processes collectively reduce SST cooling in the coastal seas. Therefore, TCs entering the TWS nearly always have their forward part of the track adjacent to land and over shallow water, where the vertical mixing is limited. By contrast, the right-rear quadrant lies over deeper water with stronger winds and is more effective for mixing. This combination causes the SST cooling pattern in the TWS with weak cooling in the front part of the TC track and enhanced cooling in the right-rear region.
The cold wake asymmetry in the TWS is also markedly different from that in the other regions. In the WNP, the location of maximum coastal cooling (50 km to the right of the TC track) is generally similar to that in the offshore (60 km). Regionally, both coastal and offshore seas in the YS exhibit maximum SSTA about 80 km to the right of the TC track (Figure 3a,e), while the difference between coastal and offshore maximum SSTA in the ECS and NSCS is within 10 km (Figure 3b,d,f,h). In contrast, the maximum coastal cooling in the TWS occurs about 200 km to the right of the track, nearly three times farther than the offshore maximum SSTA (70 km) (Figure 3c,g). Overall, except for the TWS, the coastal SST cooling magnitudes are weaker than the offshore, and coastal cold wakes are consistently smaller. The SSTA magnitude differences are attributed to both TC and oceanic driving factors; the spatial characteristics—including the cooling extent and asymmetry—are more likely controlled by TC factors, such as Vtrans and R34 [30,34,35]. These impacts will be further discussed in the following subsections.
The temporal evolution of the SSTA averaged within 100 km of the TC center for coastal and offshore TCs is shown in Figure 4. In all regions, the SST starts to drop 1–3 days before the TC passage and reaches its minimum on the day right after the TC passage, consistent with previous studies [76]. Previous studies suggested that the recovery time of SSTA is determined by its magnitude, with stronger cooling requiring longer recovery time [30]. However, the recovery of coastal SST cooling exhibits differences from that in offshore regions. In the TWS and NSCS, the SST cooling by coastal TCs is weaker than the offshore, and the recovery time is also substantially shorter. For example, in the NSCS, coastal SST recovers (to −0.5 °C) within about 5 days after reaching the maximum cooling, whereas the time for SST cooling in the offshore region to recover takes about 12 days (Figure 4d). In contrast, in the YS and ECS, where the coastal cooling is stronger or comparable to the offshore, the recovery time is much shorter. Specifically, in the YS, the coastal cooling (−2.1 °C) is 75% greater than the offshore cooling (−1.2 °C), but the recovery time occurs 2 days earlier (12 days vs. 14 days) (Figure 4a). In the ECS, coastal and offshore cooling are similar in the SSTA magnitude, but the coastal SST recovers in only 1/3 of the offshore time (5 days vs. 15 days) (Figure 4b). These differences may be attributed to variations in solar radiation or residual TC winds, which are primary controls on SST recovery [17,21,69,76]. Specifically, coastal waters tend to have shallower mixed layers and stronger temperature stratification, enabling solar heating to warm the surface more rapidly and resulting in shorter recovery times. In contrast, offshore regions exhibit deeper mixed layers and stronger TC residual winds, both of which contribute to slower SST recovery. Nevertheless, these mechanisms merit further investigation in the future.
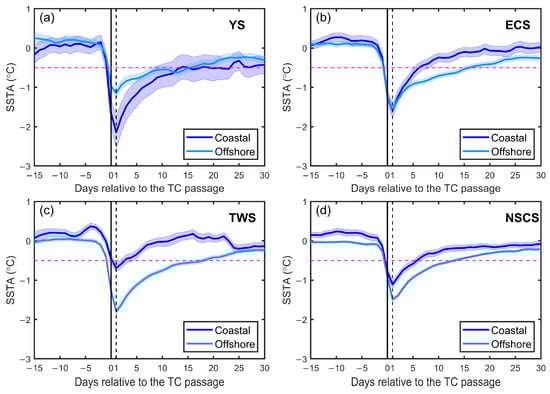
Figure 4.
Temporal evolutions of area-mean composite SSTA in coastal and offshore (a) YS, (b) ECS, (c) TWS, and (d) NSCS. The vertical black solid and dashed lines in each subplot indicate days 0 and 1 relative to the TC passage. The horizontal magenta line in each subplot indicates the −0.5 °C SST cooling.
3.2. Comparison of TC-Induced SST Cooling
3.2.1. Correlation Patterns of SST Cooling
After identifying the characteristics of TC-induced SST cooling in coastal seas and their differences from the open ocean, we next examine the roles and relative contributions of key driving factors responsible for these cooling differences. Figure 5 illustrates the spatial correlations between TC-induced SST cooling and various factors across the WNP. As shown in Figure 5, Vmax, R34 and Ta show a positive correlation with maximum SSTA over most of the WNP, indicating that stronger, larger TCs with local sharper temperature stratification induce more significant SST cooling (Figure 5a,c,d). By contrast, Vtrans and Sa are generally negatively correlated, indicating that slow-moving TCs with local weaker salinity stratification tend to cause stronger SST cooling (Figure 5b,e). These correlation spatial patterns are largely consistent with previous studies [8,11]. Moreover, the coastal China seas generally exhibit similar spatial correlation patterns as the offshore regions, except in the northern YS and Bohai Sea, where the correlations of Vtrans and R34 with SST cooling are reversed (Figure 5b,c), likely due to the relatively limited sample size of TC track points in these regions. Additionally, the influence of Sa is more pronounced in the coastal regions, particularly in the YS and ECS, where river runoff lowers surface salinity and strengthens salinity stratification, thereby suppressing vertical mixing and weakening SST cooling. Generally, the consistent correlation patterns between coastal and offshore seas suggest that complex coastal topography and dynamic processes do not change the primary roles of TC and oceanic factors in modulating SST cooling. Instead, coastal–offshore differences in SST cooling mainly result from the variations in these driving factors.
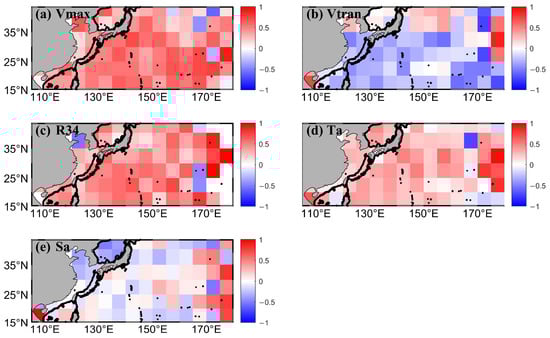
Figure 5.
Spatial correlation patterns between maximum SST cooling and different TC and oceanic driving factors, including (a) Vmax, (b) Vtrans, (c) R34, (d) Ta and (e) Sa during 2004–2021 in the WNP. Each longitude–latitude bin is 5° × 5°, and only bins containing more than 10 TC track points are retained.
Furthermore, a sensitivity analysis illustrates how each key driving factor varies with SST cooling (Figure 6). For both coastal and offshore TCs, Vmax, R34, and Ta show increasing trends with stronger SST cooling, whereas Vtrans and Sa exhibit decreasing trends, consistent with previous studies and the correlation analysis [5]. In addition, Ta and Sa show significant differences between offshore and coastal seas for the same level of SST cooling, while other factors show partial overlap. This may highlight the important role of temperature and salinity stratification in characterizing coastal–offshore cooling differences.
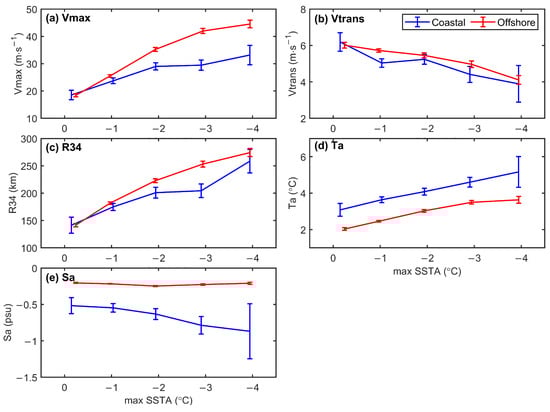
Figure 6.
Coastal and offshore (a) Vmax, (b) Vtrans, (c) R34, (d) Ta and (e) Sa as a function of TC-induced maximum SSTA. The vertical bars indicate error bars with 95% confidence intervals.
3.2.2. Comparison of Different Driving Factors
We next composited the average maximum SSTA in coastal and offshore seas and used a bootstrap method to compare the differences in TC and oceanic driving factors (Table 1 and Figure 7). On average, coastal and offshore maximum SSTAs are comparable across the China seas, both around −1.9 °C (Figure 7a). Among individual coastal seas, the YS exhibits the greatest significant difference between the coastal and offshore cooling of −0.7 °C (−2.5 vs. −1.8 °C). TCs in the ECS also show stronger coastal cooling than the offshore (−2.2 vs. −1.9 °C), although the cooling difference (−0.3 °C) is not significant. In the NSCS, the coastal and offshore SST cooling is nearly identical (−1.7 °C). By contrast, the TWS is the only region where its coastal cooling (−1.2 °C) is significantly weaker than the offshore (−2.1 °C), with a difference of −0.9 °C that even exceeds the YS. These results reveal the distinct differences in coastal–offshore SST cooling, with significant differences in the YS and TWS and insignificant differences in the ECS and NSCS, leading to an overall insignificant difference across the WNP.

Table 1.
Normalized regression coefficients of key driving factors for maximum SST cooling in coastal and offshore regions. All values are statistically significant at p < 0.05.
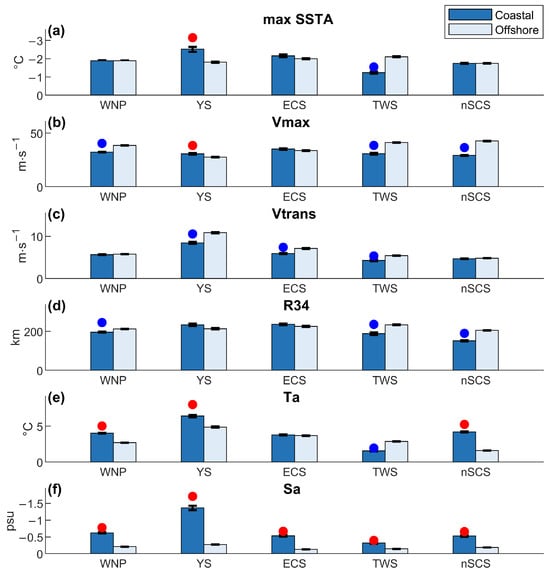
Figure 7.
Mean (a) maximum SSTA, (b) TC intensity, (c) translation speed, (d) storm size, (e) temperature stratification, and (f) salinity stratification in coastal and offshore seas of the WNP, YS, ECS, TWS, and NSCS during 2004–2021. The dark and light blue bars indicate the coastal and offshore mean values, respectively. The circle markers indicate significant differences between coastal and offshore values at the 95% confidence level. The marker colors in each subplot indicate significantly stronger (red) or weaker (blue) coastal SST cooling or driving factors compared with the offshore.
We then analyzed the differences in TC and oceanic driving factors between coastal and offshore seas. As shown in Figure 7b, the mean Vmax in the offshore WNP is 38.9 m s−1, significantly higher than 32.3 m s−1 in coastal seas, probably because TC weakens before landfall due to shallow bathymetry or coastal dynamic processes. This TC weakening is more obvious in the TWS and NSCS, where Vmax is 30.8 m s−1 and 29.2 m s−1, respectively, 34–45% significantly lower than the offshore (41.2 m s−1 and 42.7 m s−1). By contrast, the ECS shows a slightly higher coastal Vmax (35.2 m s−1 vs. 33.7 m s−1), though not significant. In the YS, however, the coastal Vmax (30.9 m s−1) is significantly higher than offshore (27.7 m s−1) with a 12% increase. The stronger TC intensity in the ECS and YS may be related to their mid-latitude conditions; that is, some TCs are already in the weakening stage when entering the ECS and the YS from low latitudes. More specific reasons need further investigation.
TC translation speed shows consistent coastal–offshore differences in that TCs move more slowly in all coastal regions generally, as shown in Figure 7c. This decrease in Vtrans may be attributed to complex reasons, such as the weakened subtropical highs that reduce steering flow [77]. In the ECS, the Vtrans is significantly lower in coastal regions (5.9 m s−1 vs. 7.1 m s−1), partially explaining its stronger SSTA compared to offshore regions. The YS also shows a notable difference (8.5 m s−1 vs. 10.9 m s−1) in Vtrans, which is conducive to stronger coastal cooling there. However, the Vtrans in both coastal and offshore seas of the YS are much faster than in other seas, thus less impacting its intense SST cooling. In the TWS, the coastal TCs move 26% slower than the offshore (4.3 m s−1 vs. 5.4 m s−1), but its cooling is still weaker, suggesting that other driving factors offset or even exceed the effect of Vtrans. In the NSCS, the coastal TCs move slightly slower than the offshore, revealing a negligible impact on the cooling difference between coastal and offshore seas.
Storm size, referring to R34 in this study, also shows distinct coastal–offshore differences in the SST cooling. Across the WNP, coastal R34 (196 km) is significantly smaller than offshore (212 km) with an 8% difference (Figure 7d). Moreover, TCs in the TWS and NSCS are much smaller coastal R34 (189 km and 152 km) than the offshore (234 km and 206 km). Moreover, R34 in the ECS and YS are insignificantly larger than offshore, with less than 6% difference. This may be related to TCs moving northward from lower latitudes when entering the coastal seas, where R34 tends to increase. Note that R34 is the only driver that consistently matches the differences in coastal–offshore SST cooling in all regions, despite some regional differences not being significant. This reveals that R34 has a strong correlation with SST cooling, which is consistent with previous studies [34,35].
Coastal seas also differ from offshore in their background oceanic conditions, particularly in temperature and salinity stratification (Figure 7e,f). In the WNP, the average temperature stratification in coastal seas (4.0 °C) is 48% stronger than the offshore (2.7 °C) (Figure 5e). Regionally, the YS exhibits the strongest Ta (6.4 °C), followed by the NSCS (4.2 °C) and ECS (3.8 °C), while the TWS shows the weakest Ta (1.6 °C). The Ta difference in the coastal YS and its offshore with the same latitudes is about 1.5 °C (6.4 °C vs. 4.9 °C), which partially explains the largest coastal–offshore cooling difference. Although the NSCS shows the greatest coastal–offshore Ta difference (2.6 °C, 4.2 °C vs. 1.6 °C), their cooling difference is smaller than in the YS, probably attributed to the offsetting effect from a significant decrease in Vmax and R34. In contrast, the TWS exhibits weaker coastal Ta (1.6 °C) than offshore (2.9 °C) due to its shallow bathymetry, while the ECS shows little difference in Ta, both consistent with their respective coastal–offshore cooling differences.
Generally, the salinity stratification is stronger in all coastal seas than in the offshore, with significant differences (Figure 7f). The YS shows the largest Sa, with its coastal value (−1.36 psu) 5 times stronger than the offshore (−0.27 psu). The ECS and NSCS also exhibit a strong Sa of −0.53 psu, about 3–4 times stronger than their offshore seas with −0.13 psu and −0.19 psu. By comparison, the TWS has the weakest Sa and the smallest coastal–offshore Sa difference (−0.32 vs. −0.14, 2.3 times). However, although Sa is higher in all coastal seas, the coastal SST cooling is stronger than the offshore in most seas, suggesting that the influence of Sa on coastal–offshore cooling differences is probably weaker than that of other driving factors.
To quantify the relative importance of key driving factors to coastal and offshore SST cooling, we performed multiple linear regression and calculated the normalized regression coefficients (β). All regression coefficients are statistically significant (p < 0.05). As shown in Table 1, the β values indicate that Ta is the most influential factor for both coastal and offshore cooling (0.45 and 0.51), followed by Vtrans (0.35 and 0.46) and R34 (0.40 and 0.49). Compared with the offshore, the β value of Ta is substantially larger than that of the other factors in coastal seas, suggesting that temperature stratification may play a more dominant role in coastal SST cooling.
The above results indicate that coastal–offshore SST cooling difference across the WNP varies significantly, mainly resulting from the combined effects of TC and oceanic driving factors. For example, in the YS, although the Sa is much stronger than offshore, the presence of stronger Vmax and Ta, and slower Vtrans collectively exceeds the effect of Sa, thereby leading to stronger coastal cooling. In contrast, in the TWS, the weaker Vmax and Ta, smaller R34, and stronger Sa suppress the cooling effect from slower Vtrans, resulting in significantly weaker coastal cooling than offshore. In the ECS and NSCS, the coastal–offshore cooling differences are small because the effects of different driving factors offset each other. Specifically, in the ECS, minimal differences in Vmax, R34, and Ta, combined with slower Vtrans and stronger Sa, produce only minor cooling differences. Similarly, in the NSCS, stronger Ta tends to enhance SST cooling, but weaker Vmax, smaller R34, and stronger Sa counteract this effect, causing nearly identical coastal and offshore SST responses.
To further distinguish the relative roles of TC and oceanic driving factors in coastal–offshore SST cooling differences, we applied the subsampling method to reselect TC track points in coastal and offshore seas for composite analysis. After subsampling, all coastal and offshore seas retained more than 50% of the original TC track points, thereby preserving the main features of the original dataset. Figure 8 shows the distributions of Vmax, Vtrans, and R34 before and after subsampling. The sample sizes of different coastal and offshore seas before and after subsampling are shown in Table S1 in the Supplementary Materials. Before subsampling, the distributions of these three factors did not pass the two-sample K-S test between coastal and offshore seas. After subsampling, however, the distributions became statistically similar and passed the K-S test, allowing the influence of oceanic conditions on SST cooling to be better isolated. Nevertheless, because of the limited number of coastal samples, the sample sizes between coastal and offshore regions could not be fully matched.
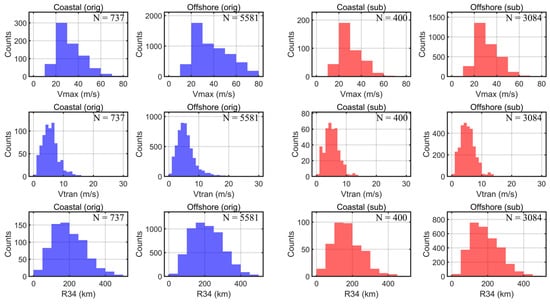
Figure 8.
Distributions of original and subsampled Vmax, Vtrans, and R34 during 2004–2021 for TC track points in the coastal and offshore WNP. N in the upper right corner indicates the total sample size in each subplot.
The subsampled maximum SSTA and oceanic factors are presented in Figure 9 and Table 2. After subsampling, the average coastal cooling becomes significantly stronger than offshore cooling (−1.9 °C vs. −1.7 °C) with a difference of 0.2 °C. Compared with the nearly negligible coastal–offshore difference in the original dataset, the change in oceanic condition has a positive contribution to the coastal SST cooling, whereas TC attributes contribute negatively. Specifically, both Vmax and R34 exert negative contributions to the coastal cooling according to their original values (Figure 7b,d). Sa exhibits a negative contribution both before and after subsampling, while Ta remains the only factor that consistently contributes positively to coastal cooling. Regionally, the YS shows the strongest coastal cooling (−2.9 °C) and the largest coastal–offshore difference (−1.1 °C) among the coastal China seas, both exceeding the original values (−2.5 °C and −0.7 °C, respectively). This suggests that oceanic conditions, particularly Ta, dominate the SST cooling in the YS. The ECS shows a similar comparison, with the coastal cooling (−2.5 °C) and its difference with the offshore (−0.4 °C) both larger than those from the original samples (−2.2 °C and −0.2 °C), though the differences remained statistically insignificant. Interestingly, based on the mean values from the original samples, the TC attributes in the YS and ECS should contribute positively to the stronger coastal SST cooling, since coastal Vmax and R34 are larger while Vtrans is slower than those in the offshore seas (Figure 7b–d). This may be attributed to two possible reasons: (1) some TC attributes, such as R34, show insignificant differences between coastal and offshore seas; and (2) some TC attributes, such as Vtrans in the YS, have relatively high mean values exceeding 8 m s−1 in both coastal and offshore, which are generally unfavorable for SST cooling. Nevertheless, the oceanic conditions likely exert a much stronger influence on coastal SST cooling than TC attributes, leading to the amplified coastal–offshore cooling differences after subsampling.
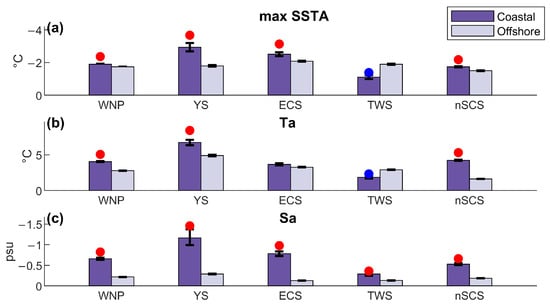
Figure 9.
As in Figure 7, but for the subsampled maximum (a) SSTA, (b) Ta and (c) Sa. The marker colors in each subplot indicate significantly stronger (red) or weaker (blue) coastal SST cooling or driving factors compared with the offshore.
Table 2.
Coastal and offshore mean maximum SSTA in different seas for original data and subsampled data during 2004–2021. Bold and italic values represent significant cooling differences at the 95% level.
In the NSCS, the coastal SST cooling (−1.7 °C) is also significantly greater than offshore cooling (−1.5 °C), larger than the negligible difference from original samples, attributing to conductive oceanic conditions and suppressed TC attributes (Figure 7 and Figure 9). However, although the Ta difference between coastal and offshore NSCS is larger than in the YS, the coastal cooling in the NSCS is still weaker, demonstrating that the much stronger Ta in the coastal YS is conducive to the intense SST cooling (Figure 9b). By contrast, in the TWS, the coastal cooling (−1.1 °C) is much lower than both the other coastal seas and its offshore (−1.9 °C), with a difference of 0.8 °C, slightly smaller than the 0.9 °C difference in the original samples. This indicates that both TC and oceanic driving factors contribute to the weaker coastal cooling in the TWS, with the role of oceanic conditions being more prominent. For salinity stratification, all coastal seas still exhibit significantly higher Sa values than offshore after subsampling, confirming its suppressive effect on SST cooling. However, except in the TWS, coastal SST cooling remains stronger than offshore. Moreover, the coastal–offshore SST cooling differences in the WNP and NSCS become significant after subsampling, further emphasizing the dominant role of temperature stratification in modulating coastal SST cooling.
After subsampling, the coastal–offshore differences in spatial characteristics of SST cooling also change, allowing the relative contributions of TC and oceanic driving factors to be distinguished. The subsampled cold wakes are shown in Figure 2b,d and Figure 10. In the WNP, the coastal (112.8 × 10⁴ km2) and offshore (111.9 × 10⁴ km2) cooling areas remain similar after subsampling, and the differences in rightward shift (50 km vs. 40 km) are also slight, consistent with the original samples. Before and after subsampling, the coastal–offshore differences in the cold area remain negligible, suggesting that TC attributes exert little effect on the spatial characteristics of the coastal–offshore cold wake differences. Similar consistency between the original and subsampled results is also found in the YS, ECS, and TWS. For example, in the ECS, the coastal cold wake area from the original samples (109.5 × 10⁴ km2) is 24% smaller than offshore (143.8 × 10⁴ km2), while the subsampled coastal area (116 × 104 km2) was 28% smaller than offshore (161.5 × 10⁴ km2). The difference in the cold wake asymmetry between coastal and offshore cold wakes is also only about 10 km. Specifically, the rightward bias in the coastal TWS is also much larger than the offshore after subsampling, suggesting that this asymmetry is more likely influenced by the bathymetry in the TWS rather than TC attributes. However, in the NSCS, although the asymmetry remains comparable, the coastal cooling area in the original sample is 17% smaller than offshore, whereas after subsampling, it became 18% larger (92.8 × 10⁴ km2 vs. 79.4 × 10⁴ km2). This indicates that TC factors have a stronger effect on cold wake spatial characteristics in the NSCS. Note that the influence of TC factors here refers to the combined effect of Vmax, Vtrans, and R34, rather than any single factor; in some cases, their impacts may partly counteract each other.
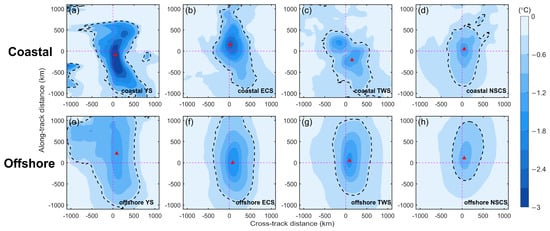
Figure 10.
As in Figure 2, but for the subsampled spatial patterns of composited SSTA associated with TCs in (a–d) coastal and (e–h) offshore YS, ECS, TWS and NSCS (from left to right).
Overall, the subsampling analysis demonstrates that pre-TC oceanic conditions, particularly the temperature stratification, play a more important role than TC factors in inducing coastal–offshore SST cooling differences. The coastal regions with stronger Ta, such as the YS and NSCS, still exhibit enhanced SST cooling compared to their offshore counterparts when TC factor distributions are consistent, highlighting the amplifying effect of Ta on the vertical mixing induced by TCs. In contrast, the TWS, characterized by weaker temperature stratification and stronger salinity stratification, reveals the limited vertical mixing and thus weaker coastal cooling. These results further suggest the regional variability of SST responses to TCs and underscore the critical role of pre-TC oceanic conditions in modulating the coastal cooling effect.
4. Discussion
According to the previous studies, China’s coastal landfalling TCs’ threat increased significantly in the past decades [3]. Based on the analysis of coastal–offshore differences in SST cooling and their driving factors, it is important to further examine the interannual variability of these responses. Over the study period (2004–2021), the coastal SST cooling exhibited an increasing trend of −0.02 °C per year (p < 0.10), while the offshore regions showed a weaker increasing trend of 0.01 °C per year (Figure 11). We then analyze and compare the interannual variations in both TC and oceanic driving factors. Among TC attributes, Vmax shows a weak decreasing trend over the study period in both coastal and offshore regions (Figure 12a), and there is almost no trend in Vtrans (Figure 12b). In contrast, for the storm size, R34 shows weak increasing trends of about 1.5 km in both coastal and offshore seas (Figure 12c). Therefore, in the coastal seas, Vmax and Vtrans cannot account for the increase in SSTA during 2004–2021. Although R34 exhibits a slight upward trend, its statistical insignificance suggests that it only marginally contributes to the observed coastal SSTA increase.
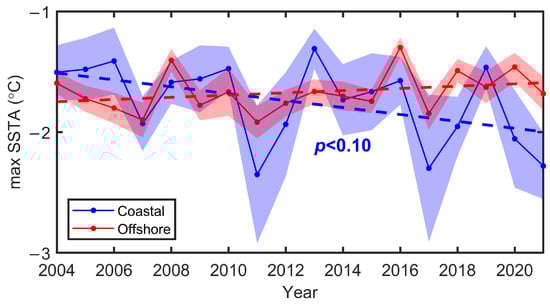
Figure 11.
Observed trends in the maximum SSTA in the coastal (blue) and offshore (red) WNP over the period 2004–2021. Shadings denote the 95% confidence interval.
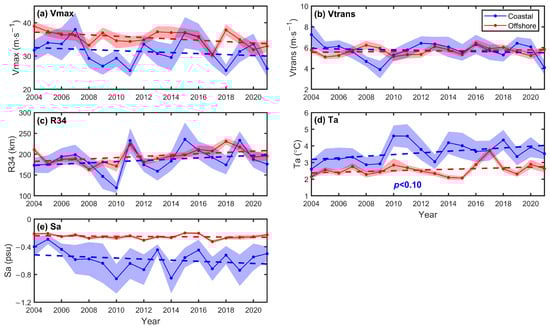
Figure 12.
As in Figure 11 but for driving factors including (a) Vmax, (b) Vtrans, (c) R34, (d) Ta, and (e) Sa.
By comparison, the pre-TC oceanic conditions, particularly the temperature stratification, exert a dominant role in driving the interannual changes. As shown in Figure 12d, the Ta exhibits an increase of ~0.05 °C per year (p < 0.10), which can explain the increase in the coastal SST cooling. Comparatively, the increasing trend of the offshore Ta is insignificant. The increasing trend in Ta is consistent with previous studies [78]. Moreover, Sa has shown nearly no trend over these years in both coastal and offshore seas (Figure 12e). Overall, the increasing trend of the coastal TC-induced SST cooling during 2004–2021 is affected by the increase in the coastal temperature stratification, further highlighting the critical role of temperature stratification in modulating the coastal SST cooling. Notably, large-scale climate modes such as ENSO and the PDO can modulate interannual to decadal variability, thereby influencing the robustness of the inferred trends. The long-term trends of coastal and offshore SSTA, as well as their driving factors, should ideally be assessed using longer observational records. However, due to the limited availability of storm size data (only since 2004), the present analysis is limited to the 2004–2021 period. Thus, the relatively short analysis period restricts the ability to detect statistically significant long-term trends. Future studies should conduct more detailed and reliable analyses of the long-term trends and drivers of coastal and offshore SSTA, as the accumulation of observations and the findings presented here should be regarded as preliminary.
5. Conclusions
In this study, we systematically examined the characteristics of TC-induced SST cooling in China’s coastal seas and compared them with those in the adjacent open ocean during 2004–2021. By using satellite observations and reanalysis data and employing composite analysis, we found that the SST cooling characteristics induced by coastal TCs differ significantly from those of offshore TCs at similar latitudes. On average, the overall coastal SST cooling magnitude and cold wake area across the WNP are comparable to those offshore. Among the coastal seas, the YS shows the most significant increase in coastal cooling magnitude (−2.5 °C) compared to its offshore region (−1.8 °C). In contrast, the TWS is the only region where coastal cooling (−1.2 °C) is notably weaker than offshore (−2.1 °C). The ECS and NSCS exhibit relatively small and statistically insignificant coastal–offshore cooling differences. Spatially, the coastal cold wake areas are generally smaller than their offshore counterparts, while the TWS exhibits a distinctive and stronger rightward asymmetry in maximum cooling. Furthermore, coastal SST recovery times are consistently shorter than those offshore, particularly in the YS and ECS.
We further analyzed the driving factors modulating these coastal–offshore differences in SST cooling. Based on original mean values, the distinct coastal–offshore cooling differences are attributed to the combined effects of TC attributes and pre-TC oceanic conditions, with the relative importance varying across regions. In the WNP, the effects of weaker Vmax, smaller R34, and weaker Sa offset the influence of stronger Ta, resulting in negligible coastal–offshore cooling differences. Similar offsetting effects are found in the NSCS. In the ECS, the competition between slower Vtrans and stronger Sa also leads to minimal coastal–offshore cooling differences. In contrast, in the YS, the effect of stronger Vmax, slower Vtrans and stronger Ta exceeds the negative effect of stronger Sa, producing significantly stronger coastal SSTA than the offshore. Conversely, in the TWS, all driving factors except slower Vtrans act to weaken coastal cooling, resulting in significantly smaller coastal SSTA.
Through conducting the subsampling method, which isolated the influence of oceanic conditions by matching TC attribute distributions, we confirmed that pre-TC oceanic conditions—especially Ta—are the dominant driver of the observed coastal–offshore cooling differences. Coastal seas with stronger temperature stratification, such as the YS and NSCS, generate more efficient vertical mixing and thus enhance SST cooling. Moreover, TC attributes generally exert relatively minor influence on the spatial patterns of coastal–offshore cold wake differences, except in the NSCS, where their effects are more pronounced.
Interannual variability analyses further underscore the leading role of temperature stratification. During 2004–2021, coastal SST cooling exhibits a significant increasing trend, which is primarily driven by a significant increase in coastal temperature stratification. In comparison, trends in TC attributes and salinity stratification are generally weak and statistically insignificant, suggesting their relatively minor role in the decadal enhancement of coastal SST cooling.
In summary, this study demonstrates that the SST responses to TCs in China’s coastal seas are primarily governed by regional oceanic conditions, with temperature stratification being a more critical factor than TC attributes and salinity stratification. These findings highlight the importance of incorporating detailed ocean thermal structure into TC intensity forecasts, particularly near coastal regions. Improved monitoring and projection of ocean stratification are essential to better anticipate the impacts of future TCs. Future work should further investigate regional differences in coastal topography and dynamic oceanic environments, along with their long-term variability. A deeper understanding of upper-ocean response characteristics will help elucidate the evolving vulnerability of coastal regions to landfalling TCs and support efforts to mitigate associated risks and losses.
Supplementary Materials
The following supporting information can be downloaded at https://www.mdpi.com/article/10.3390/jmse13122319/s1, Figure S1: Variation with respect to water depth of Ta, Sa, Vmax, Vtrans, and R34; Table S1: Sample size of coastal and offshore regions in different seas before and after subsampling.
Author Contributions
Conceptualization, H.C. and Y.L.; methodology, H.C., Y.L. and Q.L.; formal analysis, H.C., Y.L. and Q.L.; writing—original draft preparation, H.C. and Y.L.; writing—review and editing, S.G.; supervision, S.G.; and funding acquisition, S.G. All authors have read and agreed to the published version of the manuscript.
Funding
This research was funded by the National Natural Science Foundation of China (Grant 42476029).
Data Availability Statement
The TC best-track dataset was obtained from IBTrACS (https://www.ncei.noaa.gov/products/international-best-track-archive, accessed on 1 December 2024). The daily SST data were available from RSS (https://www.remss.com, accessed on 1 December 2024). The 5-day averaged vertical temperature and salinity could be found in SODA (http://dsrs.atmos.umd.edu/DATA/soda3.15.2/ORIGINAL/ocean/, accessed on 1 December 2024).
Acknowledgments
The authors thank the International Best Track Archive for Climate Stewardship for providing the TC best-track dataset, Remote Sensing Systems for providing the daily SST product, and Simple Ocean Data Assimilation for providing the 5-day averaged vertical temperature and salinity dataset. All data processing, statistical analysis, and figure plotting in this study were performed using MATLAB R2022b.
Conflicts of Interest
The authors declare no conflicts of interest.
References
- Emanuel, K.A. Increasing destructiveness of tropical cyclones over the past 30 years. Nature 2005, 436, 686–688. [Google Scholar] [CrossRef]
- Emanuel, K.A. Tropical cyclones. Annu. Rev. Earth Planet. Sci. 2003, 31, 75–104. [Google Scholar] [CrossRef]
- Guan, S.D.; Li, S.Q.; Hou, Y.J.; Hu, P.; Liu, Z.; Feng, J.Q. Increasing threat of landfalling typhoons in the western North Pacific between 1974 and 2013. Int. J. Appl. Earth Obs. 2018, 68, 279–286. [Google Scholar] [CrossRef]
- Kaplan, J.; DeMaria, M.; Knaff, J.A. A revised tropical cyclone rapid intensification index for the Atlantic and eastern North Pacific basins. Wea. Forecast. 2010, 25, 220–241. [Google Scholar] [CrossRef]
- Da, N.; Foltz, G.R.; Balaguru, K.; Fernald, E. Stronger Tropical Cyclone–Induced Ocean Cooling in Near-Coastal Regions Compared to the Open Ocean. J. Climate 2023, 36, 6447–6463. [Google Scholar] [CrossRef]
- Cione, J.J.; Uhlhorn, E.W. Sea surface temperature variability in hurricanes: Implications with respect to intensity change. Mon. Wea. Rev. 2003, 131, 1783–1796. [Google Scholar] [CrossRef]
- John, E.B.; Balaguru, K.; Leung, L.R.; Hagos, S.M.; Hetland, R.D. Observed increase in tropical cyclone-induced sea surface cooling near the U.S. Southeast Coast. Geophys. Res. Lett. 2024, 51, e2024GL110087. [Google Scholar] [CrossRef]
- Price, J.F. Upper ocean response to a hurricane. J. Phys. Oceanogr. 1981, 11, 153–175. [Google Scholar] [CrossRef]
- Schade, L.R. Tropical cyclone intensity and sea surface temperature. J. Atmos. Sci. 2000, 57, 3122–3130. [Google Scholar] [CrossRef]
- D’Asaro, E.A.; Sanford, T.B.; Niiler, P.P.; Terrill, E.J. Cold wake of hurricane Frances. Geophys. Res. Lett. 2007, 34, L15609. [Google Scholar] [CrossRef]
- Vincent, E.M.; Lengaigne, M.; Madec, G.; Vialard, J.; Masson, S.; Jourdain, N.C.; Menkes, C.E.; Jullien, S. Processes setting the characteristics of sea surface cooling induced by tropical cyclones. J. Geophys. Res. Oceans 2012, 117, C02020. [Google Scholar] [CrossRef]
- Zhang, H.; Chen, D.K.; Zhou, L.; Liu, X.; Ding, T.; Zhou, B. Upper Ocean response to typhoon Kalmaegi (2014). J. Geophys. Res. Oceans 2016, 121, 6520–6535. [Google Scholar] [CrossRef]
- Zhang, H.; Wu, R.; Chen, D.; Liu, X.; He, H.; Tang, Y.; Ke, D.; Shen, Z.; Li, J.; Xie, J.; et al. Net modulation of upper ocean thermal structure by Typhoon Kalmaegi (2014). J. Geophys. Res. Oceans 2018, 123, 7154–7171. [Google Scholar] [CrossRef]
- Sanford, T.B.; Black, P.G.; Haustein, J.; Fenney, J.W.; Forristall, G.Z.; Price, J.F. Ocean response to hurricanes. Part I: Observations. J. Phys. Oceanogr. 1987, 17, 2065–2083. [Google Scholar] [CrossRef]
- Emanuel, K.A. Contribution of tropical cyclones to meridional heat transport by the oceans. J. Geophys. Res. Atmos. 2001, 106, 14771–14781. [Google Scholar] [CrossRef]
- Huang, P.S.; Sanford, T.B.; Imberger, J. Heat and turbulent kinetic energy budgets for surface layer cooling induced by the passage of Hurricane Frances (2004). J. Geophys. Res. Oceans 2009, 114, C12023. [Google Scholar] [CrossRef]
- Price, J.F.; Morzel, J.; Niiler, P.P. Warming of SST in the cool wake of a moving hurricane. J. Geophys. Res. Oceans 2008, 113, C07010. [Google Scholar] [CrossRef]
- Leipper, D.F. Observed Ocean conditions and hurricane Hilda, 1964. J. Atmos. Sci. 1967, 24, 182–186. [Google Scholar] [CrossRef]
- Lin, I.I.; Liu, W.T.; Wu, C.C.; Wong, G.T.F.; Hu, C.; Chen, Z.; Liang, W.D.; Yang, Y.; Liu, K.K. New evidence for enhanced ocean primary production triggered by tropical cyclone. Geophys. Res. Lett. 2003, 30, 1718. [Google Scholar] [CrossRef]
- Chiang, T.L.; Wu, C.R.; Oey, L.Y. Typhoon Kai-Tak: An ocean’s perfect storm. J. Phys. Oceanogr. 2011, 41, 221–233. [Google Scholar] [CrossRef]
- Glenn, S.; Miles, T.; Seroka, G.; Xu, Y.; Forney, R.K.; Yu, F.; Roarty, H.; Schofield, O.; Kohut, J. Stratified coastal ocean interactions with tropical cyclones. Nat. Commun. 2016, 7, 10887. [Google Scholar] [CrossRef] [PubMed]
- Schade, L.R.; Emanuel, K.A. The Ocean’s Effect on the Intensity of Tropical Cyclones: Results from a Simple Coupled Atmosphere–Ocean Model. J. Atmos. Sci. 1999, 56, 642–651. [Google Scholar] [CrossRef]
- Bender, M.A.; Ginis, I. Real-case simulations of hurricane-ocean interaction using a high-resolution coupled model: Effects on hurricane intensity. Mon. Wea. Rev. 2000, 128, 917–946. [Google Scholar] [CrossRef]
- Lloyd, I.D.; Vecchi, G.A. Observational evidence for oceanic controls on hurricane intensity. J. Climate 2011, 24, 1138–1153. [Google Scholar] [CrossRef]
- Lin, I.I.; Black, P.G.; Price, J.F.; Yang, C.Y.; Chen, S.S.; Lien, C.C.; Harr, P.; Chi, N.H.; Wu, C.C.; D’Asaro, E.A. An ocean coupling potential intensity index for tropical cyclones. Geophys. Res. Lett. 2013, 40, 1878–1882. [Google Scholar] [CrossRef]
- Mei, W.; Xie, S.; Primeau, F.; McWilliams, J.C.; Pasquero, C. Northwestern Pacific typhoon intensity controlled by changes in ocean temperatures. Sci. Adv. 2015, 1, e1500014. [Google Scholar] [CrossRef] [PubMed]
- Lin, I.I.; Wu, C.C.; Pun, I.F.; Ko, D.S. Upper-ocean thermal structure and the Western North Pacific category 5 typhoons. Part I: Ocean features and the category 5 typhoons’ intensification. Mon. Wea. Rev. 2008, 136, 3288–3306. [Google Scholar] [CrossRef]
- Lin, I.I.; Pun, I.F.; Wu, C.C. Upper-ocean thermal structure and the Western North Pacific category 5 typhoons. Part II: Dependence on translation speed. Mon. Wea. Rev. 2009, 137, 3744–3757. [Google Scholar] [CrossRef]
- Mei, W.; Pasquero, C.; Primeau, F. The effect of translation speed upon the intensity of tropical cyclones over the tropical ocean. Geophys. Res. Lett. 2012, 39, L07801. [Google Scholar] [CrossRef]
- Mei, W.; Pasquero, C. Spatial and temporal characterization of sea surface temperature response to tropical cyclones. J. Clim. 2013, 26, 3745–3765. [Google Scholar] [CrossRef]
- Guan, S.D.; Zhao, W.; Huthnance, J.; Tian, J.W.; Wang, J.H. Observed upper ocean response to typhoon Megi (2010) in the Northern South China Sea. J. Geophys. Res. Oceans 2014, 119, 3134–3157. [Google Scholar] [CrossRef]
- Guan, S.D.; Jin, F.F.; Tian, J.W.; Lin, I.I.; Pun, I.F.; Zhao, W.; Huthnance, J.; Xu, Z.; Cai, W.J.; Jing, Z.; et al. Ocean internal tides suppress tropical cyclones in the South China Sea. Nat. Commun. 2024, 15, 3903. [Google Scholar] [CrossRef]
- Zhang, Y.; Liu, Y.; Guan, S.; Wang, Q.; Zhao, W.; Tian, J. Sudden Track Turning of Typhoon Prapiroon (2012) Enhanced the Upper Ocean Response. Remote Sens. 2023, 15, 302. [Google Scholar] [CrossRef]
- Liu, Y.; Guan, S.; Lin, I.I.; Mei, W.; Jin, F.F.; Huang, M.; Zhang, Y.; Zhao, W.; Tian, J. Effect of Storm Size on Sea Surface Cooling and Tropical Cyclone Intensification in the Western North Pacific. J. Climate 2023, 36, 7277–7296. [Google Scholar] [CrossRef]
- Liu, Y.; Guan, S.; Lin, I.I.; Zhao, W.; Jin, F.F.; Liu, P.; Tian, J. Storm Size Modulates Tropical Cyclone Intensification through an Oceanic Pathway in Global Oceans. J. Climate 2025, 38, 891–908. [Google Scholar] [CrossRef]
- Liu, P.; Guan, S.; Lin, I.I.; Huang, M.; Jin, F.F.; Wang, Q.; Lu, Z.; Zhao, W.; Tian, J. Response and feedback of mesoscale eddies to tropical cyclones over the South China Sea. J. Geophys. Res. Atmos. 2025, 130, e2024JD041414. [Google Scholar] [CrossRef]
- Wang, G.H.; Wu, L.W.; Johnson, N.C.; Ling, Z. Observed three-dimensional structure of ocean cooling induced by Pacific tropical cyclones. Geophys. Res. Lett. 2016, 43, 7632–7638. [Google Scholar] [CrossRef]
- Guan, S.D.; Zhao, W.; Sun, L.; Zhou, C.; Liu, Z.; Hong, X.; Zhang, Y.H.; Tian, J.W.; Hou, Y.J. Tropical cyclone-induced sea surface cooling over the Yellow Sea and Bohai Sea in the 2019 Pacific typhoon season. J. Marine Syst. 2021, 217, 103509. [Google Scholar] [CrossRef]
- Shay, L.K.; Goni, G.J.; Black, P.G. Effects of a warm oceanic feature on Hurricane Opal. Mon. Wea. Rev. 2000, 128, 1366–1383. [Google Scholar] [CrossRef]
- Zhang, H.D.; Liu, Y.; Liu, P.; Guan, S.; Wang, Q.; Zhao, W.; Tian, J. Enhanced upper ocean response within a warm eddy to Typhoon Nakri (2019) during the sudden-turning stage. Deep Sea Res. Part I Oceanogr. Res. Pap. 2023, 201, 104112. [Google Scholar] [CrossRef]
- Balaguru, K.; Chang, P.; Saravanan, R.; Leung, L.R.; Xu, Z.; Li, M.; Hsieh, J.S. Ocean barrier layers’ effect on tropical cyclone intensification. Proc. Natl. Acad. Sci. USA 2012, 109, 14343–14347. [Google Scholar] [CrossRef]
- Yan, Y.; Li, L.; Wang, C. The effects of oceanic barrier layer on the upper ocean response to tropical cyclones. J. Geophys. Res. Oceans 2017, 122, 4829–4844. [Google Scholar] [CrossRef]
- Gramer, L.J.; Zhang, J.A.; Alaka, G.; Hazelton, A.; Gopalakrishnan, S. Coastal downwelling intensifies landfalling hurricanes. Geophys. Res. Lett. 2022, 49, e2021GL096630. [Google Scholar] [CrossRef]
- Mahapatra, D.K.; Rao, A.D.; Babu, S.V.; Srinivas, C. Influence of coast line on upper ocean’s response to the tropical cyclone. Geophys. Res. Lett. 2007, 34, L17603. [Google Scholar] [CrossRef]
- Seroka, G.; Miles, T.; Xu, Y.; Kohut, J.; Schofield, O.; Glenn, S. Hurricane Irene sensitivity to stratified coastal ocean cooling. Mon. Wea. Rev. 2016, 144, 3507–3530. [Google Scholar] [CrossRef]
- Shen, W.; Ginis, I. Effects of surface heat flux-induced sea surface temperature changes on tropical cyclone intensity. Geophys. Res. Lett. 2003, 30, 1933. [Google Scholar] [CrossRef]
- Liu, K.S.; Chan, J.C.L. Interdecadal variation of frequencies of tropical cyclones, intense typhoons and their ratio over the western North Pacific. Int. J. Climatol. 2020, 40, 3954–3970. [Google Scholar] [CrossRef]
- Chang, Y.; Liao, H.T.; Lee, M.A.; Chan, J.W.; Shieh, W.J.; Lee, K.T.; Wang, G.H.; Lan, Y.C. Multisatellite observation on upwelling after the passage of typhoon Hai-Tang in the southern East China Sea. Geophys. Res. Lett. 2008, 35, L03612. [Google Scholar] [CrossRef]
- Kuo, Y.C.; Lee, M.A.; Chern, C.S. Typhoon-induced ocean responses off the southwest coast of Taiwan. Ocean Dyn. 2014, 64, 1569–1581. [Google Scholar] [CrossRef]
- Yang, G.B.; Lü, L.G.; Zhuang, Z.P.; Xiong, X.J.; Wang, G.S.; Guo, Y.L.; Yu, L.; Ma, D.J. Cruise observation of shallow water response to typhoon Damrey 2012 in the Yellow Sea. Cont. Shelf Res. 2017, 148, 1–8. [Google Scholar] [CrossRef]
- Yang, Y.; Li, K.; Du, J.; Liu, Y.; Liu, L.; Wang, H.; Yu, W. Revealing the subsurface Yellow Sea cold water mass from satellite data associated with typhoon Muifa. J. Geophys. Res. Oceans 2019, 124, 7135–7152. [Google Scholar] [CrossRef]
- Wu, R.; Zhang, H.; Chen, D. Effect of Typhoon Kalmaegi (2014) on northern South China Sea explored using Muti-platform satellite and buoy observations data. Prog. Oceanogr. 2020, 180, 102218. [Google Scholar] [CrossRef]
- Guan, S.; Huang, M.; Lin, I.I.; Wu, H.; Lin, Y.; Wu, Z.; Zhang, Y.; Jin, F.F.; Wang, W.; Hong, X.; et al. Widespread sea surface salinification induced by tropical cyclones over the Changjiang River Plume. Commun. Earth Environ. 2025, 6, 337. [Google Scholar] [CrossRef]
- Lee, S.W.; Lee, D.; Noh, S.; Kim, G.U.; Park, S.H.; Jeong, J.Y.; Lee, H.; Noh, J.H.; Jeong, J.; Lee, J.; et al. Sequential evolution of Changjiang Diluted Water and its impact on stratification and phytoplankton blooms in the East China Sea during summer 2020. J. Geophys. Res. Oceans 2025, 130, e2025JC022655. [Google Scholar] [CrossRef]
- Yang, G.B.; Xia, C.; Xiong, X.J.; Feng, Z.T.; Chen, Z.; Yang, Y.; Ma, D.J.; Ju, X.; Zheng, Q.; Yuan, Y. The seafloor heat flux driven by bottom water temperature variation in the Yellow and Bohai Seas. Ocean Model. 2022, 177, 102073. [Google Scholar] [CrossRef]
- Knapp, K.R.; Kruk, M.C.; Levinson, D.H.; Diamond, H.J.; Neumann, C.J. The International Best Track Archive for Climate Stewardship (IBTrACS) unifying tropical cyclone data. Bull. Amer. Meteor. Soc. 2010, 91, 363–376. [Google Scholar] [CrossRef]
- Knapp, K.R.; Diamond, H.J.; Kossin, J.P.; Kruk, M.C.; Schreck, C.J. International Best Track Archive for Climate Stewardship (IBTrACS) Project, Version 4. [Dataset]. NOAA Natl. Cent. Environ. Inf. 2018. [Google Scholar] [CrossRef]
- Webster, P.J.; Holland, G.J.; Curry, J.A.; Chang, H.R. Changes in tropical cyclone number, duration, and intensity in a warming environment. Science 2005, 309, 1844–1846. [Google Scholar] [CrossRef] [PubMed]
- Looney, L.B.; Foltz, G.R. Drivers of Tropical Cyclone—Induced Ocean Surface Cooling. J. Geophys. Res. Oceans 2025, 130, e2024JC021610. [Google Scholar] [CrossRef]
- Zheng, Q.; Fang, G.; Song, Y.T. Introduction to special section: Dynamics and Circulation of the Yellow, East, and South China Seas. J. Geophys. Res. Oceans 2006, 111, C11S01. [Google Scholar] [CrossRef]
- Donlon, C.J.; Minnett, P.J.; Gentemann, C.; Nightingale, T.J.; Barton, I.J.; Ward, B.; Murray, M.J. Toward Improved Validation of Satellite Sea Surface Skin Temperature Measurements for Climate Research. J. Climate 2002, 15, 353–369. [Google Scholar] [CrossRef]
- Wentz, F.J.; Gentemann, C.; Smith, D.; Chelton, D. Satellite measurements of sea surface temperature through clouds. Science 2000, 288, 847–850. [Google Scholar] [CrossRef] [PubMed]
- Meissner, T.; Wentz, F.J. The emissivity of the ocean surface between 6 and 90 GHz over a large range of wind speeds and Earth incidence angles. IEEE Trans. Geosci. Remote Sens. 2012, 50, 3004–3026. [Google Scholar] [CrossRef]
- Guan, S.; Huang, M.; Cai, W.; Zhang, Z.; Lin, I.I.; Kim, H.-S.; Zhou, L.; Lin, X.; Xu, Z.; Jin, F.-F.; et al. Fast warming trend and weak self-induced cooling of tropical cyclones revealed by drifters. Nat. Geosci. 2025; accepted. [Google Scholar]
- Price, J.F. Metrics of hurricane-ocean interaction: Vertically-integrated or vertically-averaged ocean temperature? Ocean Sci. 2009, 5, 351–368. [Google Scholar] [CrossRef]
- Efron, B. Bootstrap Methods: Another Look at the Jackknife. In Breakthroughs in Statistics; Springer: Berlin/Heidelberg, Germany, 1992; pp. 569–593. [Google Scholar]
- Meng, Q.; Zhou, F.; Ma, X.; Xuan, J.; Zhang, H.; Wang, S.; Ni, X.; Zhang, W.; Wang, B.; Li, D.; et al. Response Process of Coastal Hypoxia to a Passing Typhoon in the East China Sea. Front. Mar. Sci. 2022, 9, 892797. [Google Scholar] [CrossRef]
- Liu, X.; Yu, F.; Chen, Z.; Nan, F.; Si, G.; Diao, X.; Ren, Q.; Wang, J. Upper ocean responses to three sequential tropical cyclones in the stratified yellow sea during summer 2020. Ocean Model. 2025, 196, 102548. [Google Scholar] [CrossRef]
- Price, J.F.; Sanford, T.B.; Forristall, G.Z. Forced stage response to a moving hurricane. J. Phys. Oceanogr. 1994, 24, 233–260. [Google Scholar] [CrossRef]
- Pun, I.F.; Hsu, H.H.; Moon, I.J.; Lin, I.I.; Jeong, J.Y. Marine heatwave as a supercharger for the strongest typhoon in the East China Sea. NPJ Clim. Atmos. Sci. 2023, 6, 128. [Google Scholar] [CrossRef]
- Jullien, S.; Marchesiello, P.; Menkes, C.E.; Lefèvre, J.; Jourdain, N.C.; Samson, G.; Lengaigne, M. Ocean feedback to tropical cyclones: Climatology and processes. Clim. Dyn. 2014, 43, 2831–2854. [Google Scholar] [CrossRef]
- Zhu, J.; Hu, J.; Liu, Z. On summer stratification and tidal mixing in the Taiwan Strait. Front. Earth Sci. 2023, 7, 141–150. [Google Scholar] [CrossRef]
- Zhong, Y.; Zhou, M.; Waniek, J.J.; Zhou, L.; Zhang, Z. Seasonal Variation of the Surface Kuroshio Intrusion into the South China Sea Evidenced by Satellite Geostrophic Streamlines. J. Phys. Oceanogr. 2021, 51, 2705–2718. [Google Scholar] [CrossRef]
- Hong, H.; Chai, F.; Zhang, C.; Huang, B.; Jiang, Y.; Hu, J. An overview of physical and biogeochemical processes and ecosystem dynamics in the Taiwan Strait. Cont. Shelf Res. 2011, 31, 3–12. [Google Scholar] [CrossRef]
- Zhang, C. Responses of Summer Upwelling to Recent Climate Changes in the Taiwan Strait. Remote Sens. 2021, 13, 1386. [Google Scholar] [CrossRef]
- Dare, R.A.; McBride, J.L. Sea surface temperature response to tropical cyclones. Mon. Wea. Rev. 2011, 139, 3798–3808. [Google Scholar] [CrossRef]
- Shi, W.; Fei, J.; Huang, X.; Cheng, X.; Ding, J.; He, Y. A Numerical Study on the Combined Effect of Midlatitude and Low-Latitude Systems on the Abrupt Track Deflection of Typhoon Megi (2010). Mon. Wea. Rev. 2014, 142, 2483–2501. [Google Scholar] [CrossRef]
- Cheng, L.; Li, G.; Long, S.M.; Li, Y.; Schuckmann, K.; Trenberth, K.E.; Mann, M.E.; Abraham, J.; Du, Y.; Cheng, X.; et al. Ocean stratification in a warming climate. Nat. Rev. Earth Environ. 2025, 6, 637–655. [Google Scholar] [CrossRef]
Disclaimer/Publisher’s Note: The statements, opinions and data contained in all publications are solely those of the individual author(s) and contributor(s) and not of MDPI and/or the editor(s). MDPI and/or the editor(s) disclaim responsibility for any injury to people or property resulting from any ideas, methods, instructions or products referred to in the content. |
© 2025 by the authors. Licensee MDPI, Basel, Switzerland. This article is an open access article distributed under the terms and conditions of the Creative Commons Attribution (CC BY) license (https://creativecommons.org/licenses/by/4.0/).