Abstract
A novel pumped storage system using centrifugal pumps to transfer water between reservoirs in coastal hydropower plants has significantly mitigated grid instability. However, frequent start–stop operations of large vertical centrifugal pumps, which serve as the core equipment, severely affect the operational stability of these systems. In this study, the intrinsic connection between the cavitating flow field and irreversible losses during the process was analyzed using the entropy production theory. The time–frequency characteristics of pressure pulsation in pump were analyzed by using the continuous wavelet transform. The results indicate that with the reduction in the flow rate and rotational speed, the sheet cavitation at the impeller inlet rapidly weakens until it vanishes. The cavity cavitation within the draft tube commences to emerge in the turbine mode. Separation vortices are formed due to the mismatch in the flow angle at the impeller outlet. These vortices induce local cavitation, causing both a rapid energy loss increase and high-amplitude, low-frequency pressure pulsations. During transient processes, flow instabilities induce high-amplitude, low-frequency pressure pulsations within the stay vane region, with maximum amplitude attained during runaway condition. The research results provide a theoretical foundation for the stable operation of centrifugal pumps.
1. Introduction
In the context of global energy structure transition toward low-carbon solutions, renewable energy sources have gained increasing prominence in national energy strategies worldwide [1,2]. Energy storage technologies effectively mitigate intermittent fluctuations in renewable power generation, playing an increasingly prominent role in grid peak shaving and valley filling. Pumped hydro storage currently represents the predominant form of grid-scale energy storage due to its advantages in large-scale capacity and operational flexibility. Coastal pumped storage technology is demonstrating significant potential, utilizing large volute centrifugal pumps (LVCP) to directly and efficiently integrate fluctuating energy sources such as coastal wind power and solar power, thereby effectively enhancing the stability of regional grids, as shown in Figure 1. Consequently, the operational stability of such pumps has attracted significant research attention [3,4].
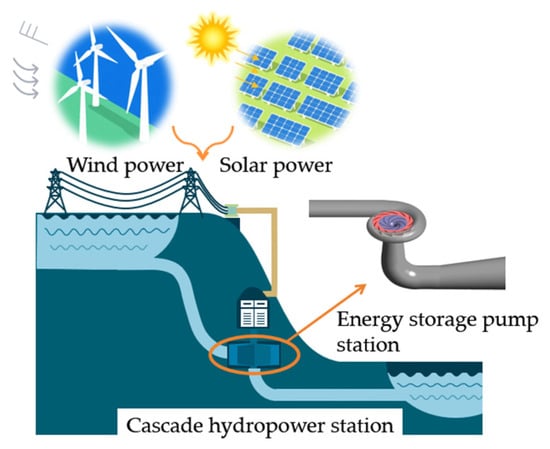
Figure 1.
Integrated wind–solar–water-storage system.
Abnormal power-off events of LVCP pose significant challenges to the operational stability of pumped storage power stations. Such events not only easily cause power frequency fluctuations or even trigger cascade failures in the power system but also induce transient pressure changes within the pump unit that severely affect operational stability through water hammer. Complex flow fields and cavitation phenomena significantly amplify instability during the transient process. The unit undergoes rapid state transitions with highly complex internal flow characteristics, while external performance parameters exhibit drastic fluctuations. The complex flows such as flow separation, stall, secondary flow and dynamic–static interference that occur in the flow passage will lead to a large amount of energy loss [5,6,7]. These phenomena can induce high-amplitude pressure pulsations, thereby severely threatening the safety and stability of the pump unit. Therefore, conducting research on the hydraulic instability of the LVCP power-off transition process under cavitation conditions, especially the study of energy loss characteristics during the process, can provide theoretical guidance for the operational stability of the unit.
Significant advancements have been achieved in characterizing hydraulic machinery power-off process through integrated experimental and numerical investigations. Duplaa et al. [8] investigated internal flow fields during rapid startup processes in centrifugal pump. Utilizing X-ray densitometry, they captured cavitation-induced density variations within the impeller passages. Walseth et al. [9] experimentally observed that characteristic parameters of pump–turbine, including pressure, flow rate, and torque, exhibit drastic variations immediately before runaway conditions are reached. Hu et al. [10] experimentally investigated the power-off process of a low-head pump–turbine prototype. Their results revealed that rotor–stator interactions between the impeller and guide vanes generate high-frequency pressure pulsations, while low-frequency pulsations correlate with rotating stall development. Sun et al. [11] conducted experimental investigations on shutdown process in centrifugal pump under both constant-speed and variable-frequency operations. Their results demonstrated that variable-frequency control enables enhanced measurement accuracy of pressure, head, flow rate, and torque parameters, along with smoother transitions throughout the shutdown sequence. The drastic parameter variations during shutdown process pose significant safety challenges for experimental test rigs. The drastic parameter variations during power-off transients impose significant operational safety challenges on experimental test rigs. Advancements in Computational Fluid Dynamics (CFD) have facilitated the widespread adoption of numerical simulations for investigating power-off process. Chirag et al. [12] revealed that during runaway transients in high-head Francis turbines, instantaneous pressure near the flow passage reaches triple the best efficiency point load levels, inducing significant fatigue risks in runner blades. Yang et al. [13] employed a combined 1D–3D coupled simulation approach validated through experimental tests, demonstrating that the variations in rotational speed and flow rate during shutdown process significantly influence the guide vane torque and the evolution of the flow field in pump–turbines. Kan et al. [14] numerically investigated shutdown process in an axial-flow pump prototype. They revealed drastic pressure fluctuations within the pump unit during runaway conditions, concurrent with significant vibration and noise generation. These phenomena pose substantial risks to operational safety under severe scenarios. Feng et al. [15] conducted numerical simulations of centrifugal pump emergency power-off processes using CFX Fortran, observing that the transient process through four distinct operational modes: pumping mode, braking mode, turbine mode, and runaway mode. This review demonstrates that while extensive studies have been conducted on transient characteristics during startup and shutdown processes of pumps or turbines, limited research has been devoted to investigating the cavitation phenomenon and its induced energy loss characteristics during shutdown procedures.
Comprehensive investigations have been conducted on complex cavitation phenomena in pump–turbines [16,17,18]. Liu et al. [19] investigated the development of sheet cavitation and its impact on pump performance characteristics under four distinct flow rate conditions through combined experimental and numerical simulations. They demonstrated that cavitation bubbles initially formed on the suction side of the blade’s leading edge, progressively expanded towards the pressure side with decreasing cavitation number, and ultimately resulted in flow passage obstruction. Fu et al. [20] examined cavitation and flow instability of a centrifugal pump under low flow conditions. Their research results indicated that there was a significant correlation between low-frequency pressure pulsation and flow instability caused by cavitation under low flow conditions. Yang et al. [21] utilized numerical simulations to investigate the interaction between cavitation and vortices during the operation of a centrifugal pump in the hump region. Their findings revealed that the interaction between cavitation and vortices is more prone to inducing leading-edge separation vortices and distinctive low-frequency stall vortices, which collectively govern the evolution of flow patterns within the guide. Sun et al. [22] revealed through experimental investigations and numerical simulations that complex couplings exist among cavitation, vortex structures, and pressure fluctuations in centrifugal pump operating under low-flow conditions. Fu et al. [23] demonstrated that the extreme pressure pulsations during the runaway condition of a pump–turbine are primarily attributed to local recirculation near the runner inlet and unstable cavitation phenomena within the runner and draft tube. Li et al. [24] investigated the influence of cavitation phenomena on the power-off process of pump–turbines. Considering the mass disturbance and wave velocity change caused by cavitation phase transition, they found that the pressure pulsation amplitude increased in the inlet pipe, thereby generating complex flow phenomena. Previous studies indicate that numerous scholars have concentrated on the simulation methodologies for cavitation and the characteristics of cavitation flow fields. However, the energy loss mechanisms within cavitation flow fields remain under-investigated and warrant further exploration.
In recent years, the entropy production theory has undergone continuous refinement and has been extensively applied to the investigation of energy loss mechanisms in fluid machinery [25,26]. Kock et al. [27] proposed a formula for calculating the entropy production rate based on the Reynolds time-averaged equations and applied it to the calculation of pipe flow with heat transfer. Li et al. [28] examined the relationship between vapor distribution and entropy production through local flow analysis and found that when cavitation fully developed, the entropy production rate increased rapidly. Wang et al. [29] conducted an analysis of the characteristics of irreversible energy loss induced by cavitation flow in centrifugal pumps and discovered that velocity pulsation was the principal cause for the increase in total entropy production, and high-speed vortices exerted a considerable influence on irreversible flow losses. Ge et al. [30] investigated the distribution law of energy loss in the internal flow field of a centrifugal pump after transient process caused by power failure under design conditions based on the entropy production theory. Deng et al. [31] systematically characterized energy loss characteristics across three operational modes of a pump–turbine during shutdown process, specifically analyzing pumping, pump braking, and turbine modes. The study identified significantly enhanced entropy production and vorticity fluctuations localized within the impeller domain. Zhang et al. [32] numerically investigated power-off process in a pump–turbine under varying discharge conditions. Their simulations revealed significantly elevated entropy production in the draft tube, along with distinct dual-helix vortex structures in the flow field.
The above investigations show that while the theories of cavitation and entropy production have been extensively investigated in hydraulic machinery, relatively limited research has focused on the power failure process. Notably, there remains a significant gap in studies concerning cavitation-based phenomena during the transient process. Therefore, this study aims to analyze the energy loss characteristics during the transient process of LVCP under cavitation conditions, establish the relationship between the flow field and energy loss distribution affected by cavitation, and explore the source of energy loss by combining the flow instability characteristics at critical moments and reveal the time–frequency characteristics of pressure pulsation in cavitation flow. The organization of this paper is as follows. Section 2 describes the simulation model, mesh generation, control equations, cavitation model and boundary conditions. The experimental test and validation of LVCP are introduced in Section 3. The energy loss, flow field evolution and pressure pulsation during the power-off transient process are discussed in Section 4. Finally, conclusions are presented.
2. Numerical Model
2.1. Calculation Model of LVCP
The model machine is selected as the subject, the specific speed number ns is 165 which is calculated by Equation (1). The basic geometric parameters of LVCP prototype machine and model machine are listed in Table 1. The computational domains are shown in Figure 2. The fluid domain contained impeller, chamber, stay vanes, elbow inlet pipe, outlet pipe, and spiral volute. To ensure stable inlet–outlet flow field conditions, the inlet pipe was extended to five times the impeller inlet diameter, while the outlet pipe was correspondingly extended to five times the volute outlet diameter.

Table 1.
Basic parameters of LVCP.
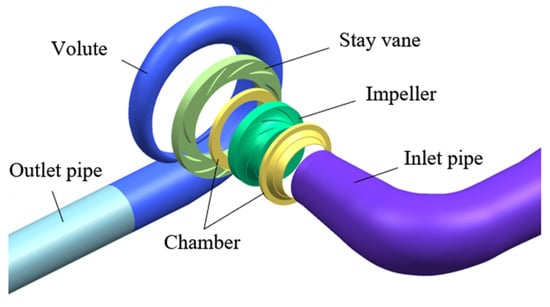
Figure 2.
Calculation domain of LVCP.
2.2. Governing Equations of Mixture Model
The mixture multiphase model is employed in this study to numerically simulate the vapor–liquid two-phase flow within the pump under cavitation conditions. The homogeneous flow assumption is implemented, assuming identical velocity and pressure fields for both liquid water and vapor phases. The Reynolds-averaged Navier–Stokes (RANS) equations are subsequently discretized through the finite volume method to establish the governing equation system. Thermodynamic variations in temperature and density are disregarded during the computational formulation process. The isothermal incompressible continuity and momentum equations are formulated by Equations (2) and (3):
where ui, uj, uk represents the instantaneous velocity component; μm is the laminar dynamic viscosity of the mixture; μt is the turbulent eddy viscosity of the mixture, which is obtained via the following turbulence model.
The mixed density ρm is defined by Equation (4):
where αv denotes the vapor volume fraction; ρl and ρv are the liquid and vapor phase densities, respectively; Vv and Vl are the volume of vapor and liquid.
2.3. Cavitation Model
The Zwart–Gerber–Belamri cavitation model, derived from a simplified formulation of the Rayleigh–Plesset equation, is applied to achieve enhanced predictive capability for unsteady cavitation dynamics while maintaining stable numerical convergence [33,34]. The transport equation of this model is defined as Equation (6).
where and describe the evaporation and condensation rates of the liquid and vapor phases, respectively, in cavitation. The interphase mass transfer rate in the vapor transport equation is mathematically expressed as:
where Rb is the mean radius of cavity (1 × 10⁻⁶ m); represents the volume fraction of vapor nuclei contained in a unit liquid (5 × 10⁻⁴); pv denotes the pressure of saturated vapor, Fe = 50 and Fc = 0.01 are empirically calibrated coefficients for evaporation and condensation processes, respectively.
2.4. Numerical Schemes and Boundary Conditions
This study utilizes steady-state cavitation simulation results as initial boundary conditions for transient numerical simulations of LVCP power-off process. The detailed boundary condition configurations are systematically listed in Table 2. The transition process in LVCP induces rapid flow variations and intense turbulence. The shear stress transport (SST) k-ω turbulence model accurately simulates complex flow features including adverse pressure gradient flows, secondary flows, and rotational shear flows [35,36]. This turbulence model enables precise determination of eddy viscosity coefficients, thereby achieving mathematical closure of the governing equation.

Table 2.
Boundary condition configurations.
This study employed numerical simulation to investigate the shutdown process, given the instability during the shutdown process that poses significant risks to the operational safety of the test rig. During the shutdown process, the impeller ceases to receive motor-driven work and moves under the combined effects of inertia and inlet–outlet pressure differentials. Its rotational speed is governed by the angular momentum differential equation, as shown in Equation (8). The angular momentum differential equation is discretized and solved through Fluent UDF, as shown in Equation (9). The torque information of the previous step is obtained through the code, and the rotational speed of the next step is calculated. The specific calculation process is shown in Figure 3.
where J is the moment of inertia of impeller and motor rotor; dt represents the unit time; dω is the change in angular velocity per unit time; Mi denotes the torque of the impeller; is the time step size.
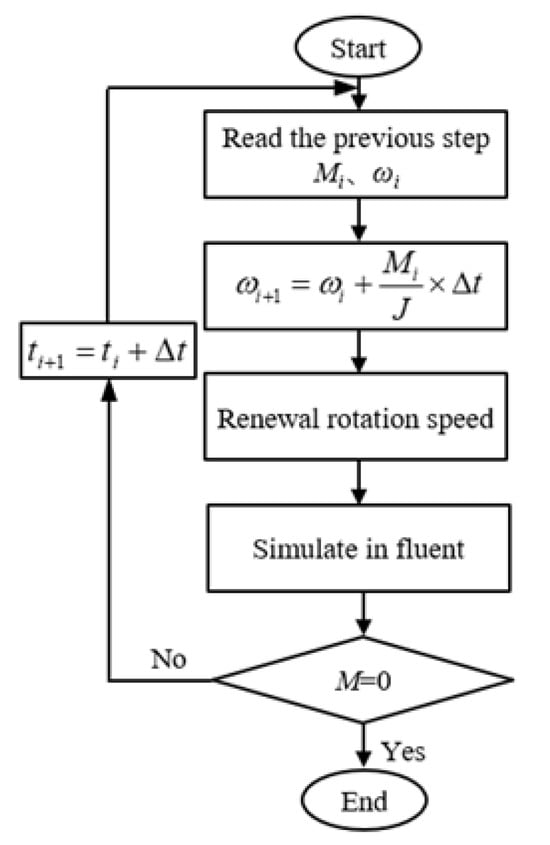
Figure 3.
Flow chart of rotational speed iteration calculation.
2.5. Mesh Generation and Uncertainty Verification
In this study, Three-dimensional (3D) CFD simulations were carried out by using commercial software ANSYS FLUENT 2022 (ANSYS, Canonsburg, PA, USA). The ANSYS ICEM CFD 2022 software was used to divide the hexahedral structure mesh of each component, and the local mesh refinement was adopted for near wall regions. The mesh characteristics of main components are illustrated in Figure 4. To mitigate the impact of the mesh number on the simulation results, six sets of mesh schemes with distinct mesh numbers were adopted to conduct mesh independence analysis. The variation in the simulated head with the mesh number is depicted in Figure 5. With the increase in the number of mesh, the change in the simulated head gradually reduces and approaches the experimental head. Considering the simulation accuracy and computational efficiency comprehensively, the scheme with a total mesh number of 8.23 million was chosen for the subsequent computations. The detailed information of the final mesh is shown in Table 3. The y+ distribution near the boundary wall surface between the impeller and the stay vanes is shown in Figure 6, with the maximum value not exceeding 40.
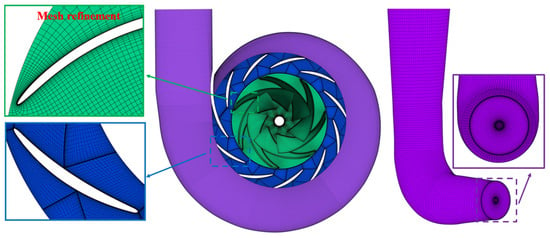
Figure 4.
Mesh partition details.
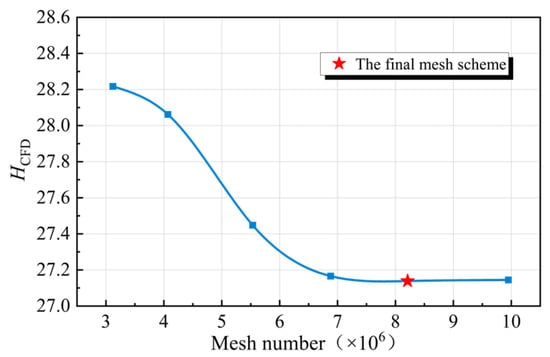
Figure 5.
Mesh independency test.

Table 3.
Detailed information of final mesh.
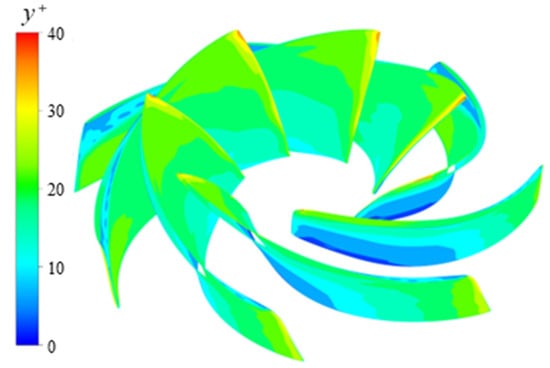
Figure 6.
Distribution of y+ on the impeller.
3. Experimental Verification
This research conducted model pump tests on a closed-loop test bench to verify the accuracy of numerical simulation. The details of the test bench are shown in Figure 7. The test rig consists of a differential pressure sensor (with an accuracy of 0.017%, fPT) (Rosemount, Chanhassen, MN, USA), a bidirectional electromagnetic flowmeter (with an accuracy of 0.15%, fQ) (Rosemount, Chanhassen, MN, USA), a torque sensor (with an accuracy of 0.051%, fM) (Interface, Scottsdale, AZ, USA), and a dynamic pressure sensor (with an accuracy of 0.062%, fDT) (PCB Piezotronics, Depew, NY, USA). The comprehensive efficiency error of the test bench is ≤±0.20%. In this paper, the flow direction when the pump operates in the pump mode is defined as the positive flow direction, and the clockwise rotation direction of the impeller in the pump mode is defined as the positive rotation direction. The head H is calculated based on the pressure sensors at the inlet and outlet of the test pump, while the efficiency η is calculated based on the flow rate Q and head H, as shown in Equations (10) and (11). The error of head H and efficiency η are calculated by Equations (12) and (13).
where pin and pout respectively represent the total pressure at the pump inlet and outlet; P denotes the motor output power, ρl represents the water density, g is the gravitational acceleration, fHT is the total error of the head, fηs is the comprehensive efficiency error of the test bench.
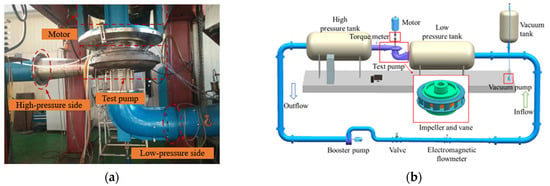
Figure 7.
Experiment platform. (a) Physical diagram of the experimental equipment. (b) Layout of experimental equipment.
The comparison results of the experiment and simulation performance parameters curves of the LVCP at n = 1000 r/min are shown in Figure 8. The trends of the performance parameters curves of the experiment and simulation are consistent, and the maximum error is less than 3%. Therefore, the numerical simulation method is validated to demonstrate reliability under the investigated operating conditions. The comparative cavitation performance curves are shown in Figure 9. As the cavitation number decreases, the head remains basically stable at first, then slightly rises, and finally drops rapidly. This is because as cavitation deepens, a large number of bubbles adhere to the blade surface and form a hydrodynamic smooth zone near the blade surface, reducing the flow loss near the wall and slightly increasing the head. When the cavitation number continues to decrease from the critical cavitation point (where the head drops by 3%), a large number of cavitation bubbles detach from the blades, accumulate and block the flow passage. As a result, the head drops rapidly. The cavitation number σ is defined as:
where pv is the saturated vapor pressure of water at 25 °C; u2 denotes the circumferential velocity at the outlet of the impeller.
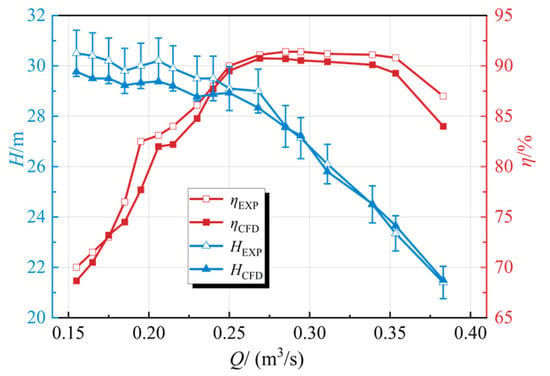
Figure 8.
Comparison of performance parameters.
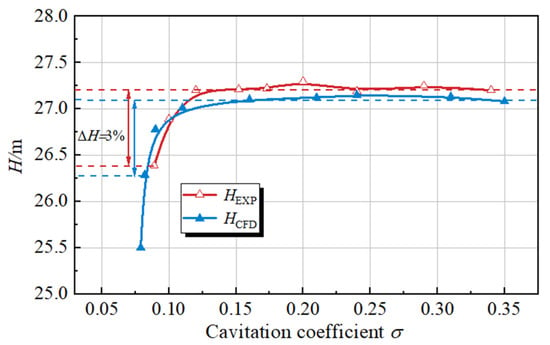
Figure 9.
Comparison of cavitation performance.
During runaway tests, the motor was reversely driven to 700 r/min while dynamically regulating the outlet pressure and flow rate to stabilize the torque measured by the torque sensor near zero. As shown in Table 4, the Fluent UDF simulation results agree closely with experimental data under runaway conditions, demonstrating a prediction error margin below 5%. This validates the reliability of the customized UDF routines for computational modeling.

Table 4.
Comparison of runaway experimental results with simulation Results.
4. Results and Discussion
4.1. Analysis of External Performance Characteristics During Shutdown Process
The variation characteristics curve of the external characteristic parameters of the LVCP during the shutdown transition process under cavitation conditions is shown in Figure 10. For the convenience of analysis, the three variables of torque, flow rate, and rotational speed are dimensionless, as defined by Equation (15):
where the subscripts t, 0 and rel, respectively, represent instantaneous value, initial value and relative value.
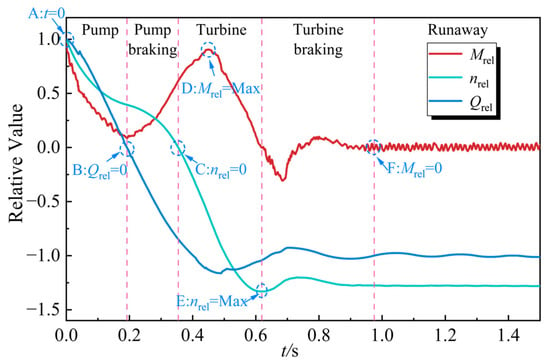
Figure 10.
Characteristic parameters of the LVCP during power-off process.
As shown in Figure 10, the flow rate Qrel exhibits less pronounced variation compared to torque Mrel and rotational speed nrel during the initial phase of emergency power-off process in the LVCP. This phenomenon can be attributed to fluid inertia effects, which maintain relatively stable flow momentum despite the abrupt cessation of impeller work input. The rotational speed nrel is positively correlated with the torque. After the impeller loses the work done by the motor, the torque rapidly decreases, causing the rotational speed to drop accordingly. In addition, during the transition process, the external characteristic parameters undergo drastic changes within a short period of time and experience five different operating modes, namely the pump mode, braking mode, turbine mode, turbine braking mode and runaway mode.
Phase I represents the pump condition (t = 0–0.195 s), during which the flow rate gradually decreases but the flow direction remains positive, and the impeller speed is also gradually reducing. Phase II represents the pump braking condition (t = 0.195–0.355 s). At 0.195 s, the flow rate drops to zero, and the torque of the impeller also reaches its minimum value due to the zero flow rate. Subsequently, under the influence of the pressure difference between the inlet and outlet, the water flow begins to reverse, and the flow rate gradually increases. During this process, the flow direction is opposite to the rotation direction of the impeller, and the impeller speed gradually decreases to 0. Phase III corresponds to turbine mode (t = 0.355–0.621 s). Following the impeller speed decaying to 0, reverse rotation initiates and progressively increases in magnitude. Within this regime, the torque initially increases to a peak value at t = 0.45 s before subsequent attenuation, with the flow rate reaching its maximum at t = 0.485 s. Phase IV represents the startup operation of turbine (t = 0.621–0.965 s). The rotor speed fluctuates with the torque. It reaches its peak at 0.621 s. As the rotor begins to be subjected to counter-torque, the speed starts to decrease. It drops to 1.18 nrel and then begins to rise again, eventually transitioning to a relatively stable runaway condition. At this phase, the speed stabilizes at 1.25 nrel, the torque fluctuates around 0, and the flow rate is 0.98 Qrel.
4.2. Analysis of Unsteady Characteristics of Cavitation Evolution
The evolution process of cavitation characteristics at critical moments (A–F) is shown in Figure 11. The cavitation structure is visualized through the iso-surface of the vapor volume fraction αv = 0.1. As presented in Figure 11a, distinct cavitation structures emerge on the suction surface near the blade’s leading edge during the initial shutdown phase (t = 0 s), manifesting as inverted triangular sheet cavitation patterns with clear geometric definition. This is primarily attributed to the presence of a pronounced low-pressure zone on the suction surface of the blade. Figure 11b illustrates that, at the critical transition point from pump operation to braking condition (Q = 0 m3/s), the cavitation in the impeller region diminishes with the reduction in flow rate and rotational speed. Meanwhile, a pronounced recirculation occurs near the volute tongue (Region I), where the induced recirculation vortex facilitates the generation of localized cavitation.
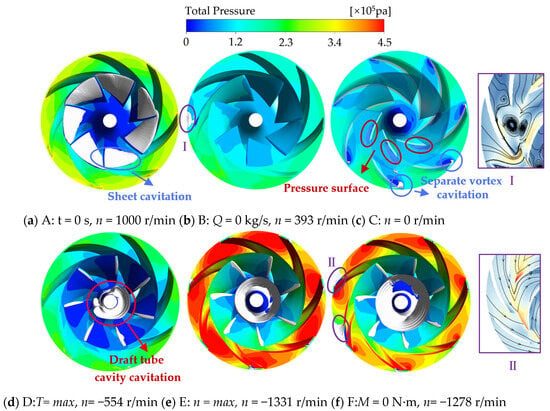
Figure 11.
Cavitation and pressure distribution in impeller domain at different times.
As illustrated in Figure 11c, the transition to turbine mode commences (n = 0 r/min), causing the impeller to rotate in reverse. The mismatch between the inflow angle and the blade installation angle induces flow separation, leading to the formation of separation vortices. Consequently, cavitation develops at the leading edge of the blade outlet and near the inlet region of the pressure surface. In Figure 11d,e, with the increase in the reverse rotational speed of the impeller, a cavity cavitating phenomenon occurs in the connection area between the impeller and the inlet pipe due to the effect of the tailwater vortex band. And as the rotational speed reaches its peak, the pressure in the impeller domain and the circumferential velocity at the blade outlet edge also reach their peaks, intensifying the generation of separation vortex cavitation. As shown in Figure 11f, after the impeller runaway (M = 0 N·m), a separation vortex is also generated near the tongue, leading to local cavitation (Region Ⅱ). Overall, throughout the shutdown process, the flow field undergoes significant and rapid variations. The internal cavitation characteristics exhibit a strong correlation with the flow field dynamics, while the complex vortex system substantially compromises the stability of the shutdown process.
To quantify the severity of cavitation at different phases within the impeller domain, curves depicting the vapor volume fraction across each axial section of the impeller domain at moments A–F were generated, as illustrated in Figure 12. Cavitation in the inlet region of the impeller (sections V1 and V2) predominantly occurs under turbine conditions. In particular, as the impeller rotational speed increases, cavity cavitation progressively intensifies. Specifically, when the speed attains its maximum value, the vapor volume fraction at Section 1 reaches 0.567 and 0.521, respectively. Cavitation mainly occurs at the inlet side of the blade (Section 3, Section 4 and Section 5) under the pump conditions. It can be observed from the figure that at the initial stage of shutdown (t = 0 s), the area of sheet cavitation is relatively large but the volume fraction is small, with a maximum value of 0.051, mainly adhering to the blade surface. Cavitation rapidly diminishes as rotational speed and flow rate decrease. At t = 0.355 s, n = 0, minor cavitation is observed in Section 3 and Section 4. Cavitation collapse and extinction persist throughout the shutdown process. Figure 13 presents the temporal evolution of vapor volume in the impeller domain and draft tube during shutdown transients. A significant increase in vapor volume is observed (t = 0.6–0.9 s), corresponding to the turbine operation mode where the impeller rotational speed reaches its peak. The maximum vapor volumes in the impeller and draft tube attain 0.00268 m3 and 0.0135 m3, respectively. This phase exhibits intensified cavitation compared to runaway conditions due to drastic fluctuations in rotational speed and flow rate, as reflected in the torque-flow rate variations shown in Figure 10. In contrast, only minor sheet cavitation occurs during the initial shutdown stage under pump mode, with a maximum vapor volume of 2.83 × 10⁻⁴ m3.
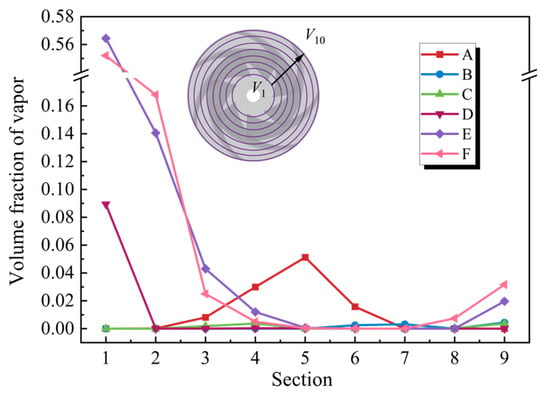
Figure 12.
Volume fraction of vapor at different sections.
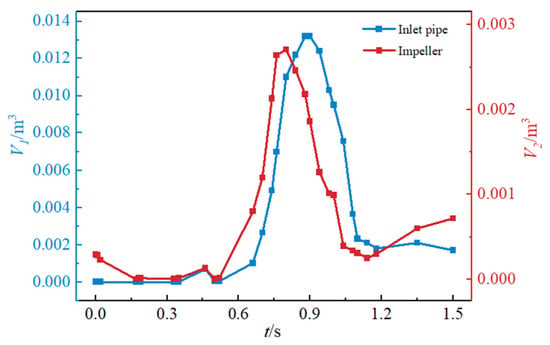
Figure 13.
Vapor volume evolution curve.
4.3. Transient Energy Loss Characteristics
4.3.1. Entropy Production Theory
During the transient process, drastic flow field alterations induce disordered flow patterns such as flow separation, backflow, and vortices, which significantly increase irreversible energy losses [37,38]. The entropy production theory is introduced to intuitively analyze the energy dissipation in each stage and provide assistance for the quantitative analysis of the flow field changes. In the simulation calculation of the LVCP, since the temperature variation is small, the dissipation term caused by heat transfer is not considered.
The volumetric viscous dissipation rate, computed from the mean velocity field, is expressed as:
where , and denote the time-averaged velocity components in the x, y and z directions, respectively.
The volumetric turbulent dissipation rate induced by fluctuating velocity components is given by:
where , and denote the fluctuating velocity components in the x, y and z directions, respectively; μeff denotes the effective dynamic viscosity of the mixture.
μeff = μm + μt
To address the limitation of Reynolds-averaged Navier–Stokes (RANS) methods in resolving fluctuating velocity components, Kock et al. [27] proposed a modified formulation for calculating the turbulent dissipation entropy production rate in the k-ω turbulence model, expressed as:
where ω represents the turbulent eddy viscosity frequency; k is the turbulent kinetic energy; β is an empirical coefficient, with a value of 0.09.
To mitigate significant errors in entropy production calculations caused by pronounced near-wall effects under high Reynolds number conditions, Zhang et al. [39] developed an isolated method for quantifying near-wall entropy production, termed wall entropy production, defined as:
where A represents the wetted surface area of flow-passing components; denotes the wall shear stress; is the velocity vector of the fluid at the center of the first layer mesh.
The direct entropy production caused by the time-averaged velocity and the turbulent entropy production caused by the fluctuating velocity in the mainstream region are solved by integrating the following equation:
Therefore, the total entropy production formula S within the entire computational domain is:
4.3.2. Characteristics of Entropy Production Distribution
The changing trends of entropy production values of each component during the shutdown process are shown in Figure 14. The entropy production within the impeller domain accounts for the largest proportion, approximately 71.4% of the total entropy production, followed by the inlet pipe, which accounts for about 27.56%. The peak and valley moments of the entropy production value of the entire system exhibit a strong correlation with the key operating points during the transition process. The entropy production ratio is relatively high near n = 0 and the torque reaches the minimum value (Mmin), with the maximum value reaching 43.5 W/K. The entropy production reaches its minimum when the flow rate Qrel = 0 and the reverse flow rate reaches its maximum.
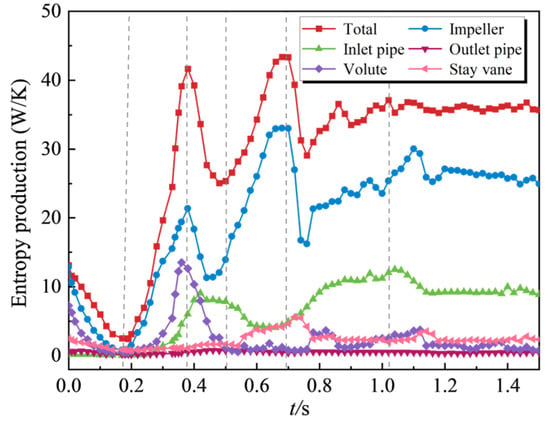
Figure 14.
Distribution of entropy production in different fluid domains.
The entropy production exhibits a relatively high proportion near n = 0 and Mmin, with its peak value reaching 43.5 W/K. Conversely, the entropy production attains its minimum when the flow rate Qrel decreases to 0 and the reverse flow achieves its maximum value. As shown in Figure 15, the individual components of total entropy production exhibit trends consistent with the total entropy production evolution. The turbulent dissipation entropy production constitutes the dominant proportion, followed by wall entropy production, while the viscous dissipation component induced by time-averaged velocity gradients accounts for the smallest contribution. This behavior is predominantly attributed to the high Reynolds number flow characteristics during shutdown transients, where the molecular viscosity μm is negligible compared to the turbulent viscosity μt.
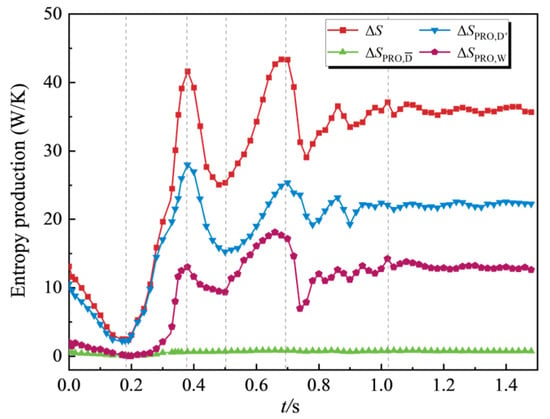
Figure 15.
Distribution of different entropy production terms.
4.3.3. Spatial Distribution Characteristics of Local Entropy Production
As analyzed in the previous section, the impeller domain and the inlet pipe domain are identified as the critical regions for irreversible energy dissipation. Consequently, this section focuses on a detailed investigation of the energy losses in these two domains during the power-off process. The entropy production rate distribution on 12 uniform sections from the shroud to the hub within the impeller domain is shown in Figure 16. Globally, the entropy production rate peaks at both zero rotational speed and maximum rotational speed. Regions adjacent to the shroud and hub exhibit significantly higher entropy production rates compared to mid-span sections. This phenomenon arises from intensified viscous effects near the walls, where steep velocity gradients amplify viscous shear stresses, thereby elevating local thermodynamic irreversibility. Elevated entropy production rates are observed at the impeller trailing edge, attributed to the pronounced flow separation and vortical structures in this region, which amplify viscous dissipation losses.
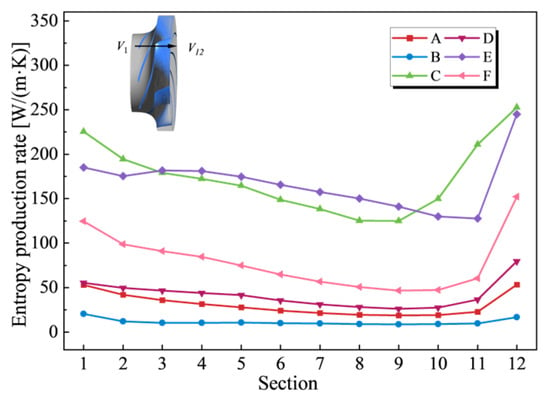
Figure 16.
Entropy production rate distribution in axial section.
Streamline patterns and entropy production distribution at the mid-span (Span = 0.5) section of the impeller domain were mapped in this study to identify the primary mechanisms driving energy loss escalation during critical operational phases of the shutdown process, as depicted in Figure 17. At time B (Qrel = 0), the incoming and outgoing fluids in the impeller converge at the tongue, as shown in the red circle in the Figure 17b. Distinct vortex generation is observed in this area, accompanied by localized cavitation near the tongue, as shown in Figure 11b, intensifying energy dissipation through enhanced entropy production. At Time C (n = 0), substantial vortices obstruct the impeller passages. The elevated vorticity and turbulent kinetic energy gradients near the vortex cores lead to intensified energy dissipation, as shown in the red circle in the Figure 17c. At Time F (M = 0), during load rejection-induced runaway conditions, high-speed circumferential flow blockage occurs at the impeller outlet, resulting in band-shaped high entropy production zones near the vaneless region and pressure surface of the impeller outlet, which is indicated by the red circles.
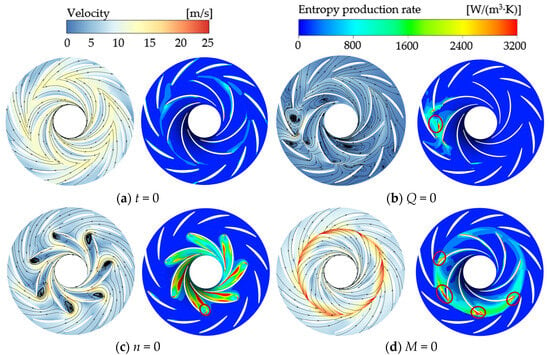
Figure 17.
Flow characteristics and entropy production rate distribution at Span 0.5 of impeller.
As illustrated in Figure 18, spanwise sections at Span 0.9, Span 0.5, and Span 0.1 (from shroud to hub) were analyzed using circumferentially unwrapped surfaces of the impeller and stay vanes to examine the temporal evolution of entropy production rates. Similarly, elevated entropy production rates are observed near the front cover plate. As shown in Figure 18a during the initial shutdown phase, cavitation inception occurs at the location marked by the red circle. A sudden increase in entropy production is detected at the trailing edge of the cavitation zone and in downstream flow passages. The microjets generated during cavitation collapse induce a drastic increase in velocity gradients within the flow field, thereby amplifying. Figure 18b shows that under Qrel = 0 conditions, the flow velocity within the system decreases significantly, resulting in low velocity gradients and a relatively low overall energy dissipation level. As shown in Figure 18c, after the rotational speed decays to zero, separation vortices dominate the suction surface at the outlet edge of the hub. This instability drives entropy production patterns that fully occupy the inter-blade flow channels, with high-entropy zones progressively extending to the pressure side of adjacent blades’ leading edges. As shown in Figure 18d, high-speed fluid blockage in the vaneless region during impeller runaway significantly elevates energy dissipation. In summary, unstable flow patterns at operational transition points generate complex vortex systems coupled with cavitation inception, resulting in increased entropy production rates.
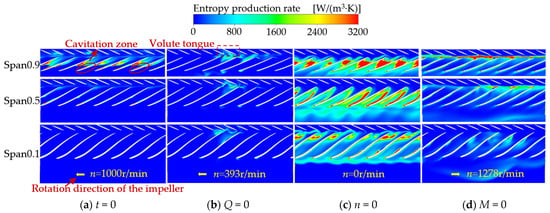
Figure 18.
Entropy production rate distribution at different sections of the stay vanes and impeller.
To investigate the unsteady flow characteristics in the impeller outlet region, this study presents entropy production rate contours and streamline distributions at the impeller trailing edge. The relative velocity streamlines were rendered with velocity magnitude color-coding, as shown in Figure 19. As observed in Figure 19a, regions with elevated entropy production rates exhibit disordered streamline patterns characterized by abrupt variations in magnitude and direction. This directly correlates with steep velocity gradient fluctuations, intensifying irreversible energy losses. Notably, these high-entropy zones predominantly localize near the suction side of the blade trailing edge. As illustrated in Figure 19b, the flow rate Qrel decreases to zero. Driven by pressure, the liquid near the tongue flows into the impeller region, whereas at other locations, it continues to undergo centrifugal motion due to inertia. The convergence and collision of the inflow and outflow streams lead to an increased velocity gradient and a rise in irreversible losses. As shown in Figure 19d, at the moment of runaway, the liquid impacts the pressure surface of the blade at high speed and simultaneously blocks the outlet of the impeller. In the enlarged area of the bladeless region, it is even found that part of the liquid is pushed out of the circulation. The high-speed circulation causes the entropy production rate to increase rapidly.
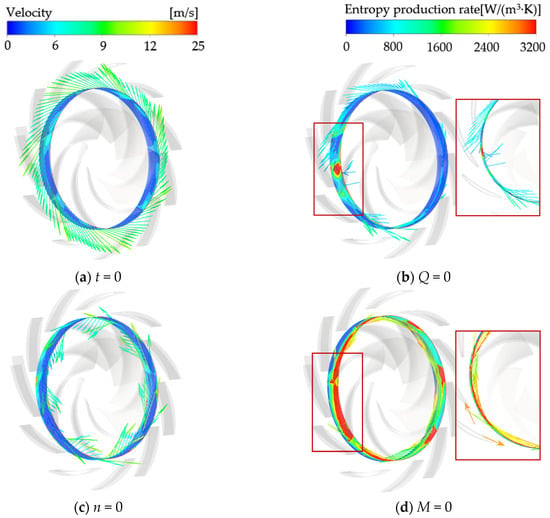
Figure 19.
Flow curve and entropy production distribution at impeller outlet.
To quantitatively analyze the velocity variation at the impeller domain outlet edge, three different blade heights were selected for analysis. The selection scheme and corresponding angles are shown in Figure 20. Figure 21 shows the flow velocity distribution characteristics. The values presented in the figure correspond to the absolute magnitudes of the relative velocity. Figure 21a presents the schematic diagram of the fixed stay vanes at their respective angles. Clearly visible in the figure are seven velocity peaks, each of which corresponds to one of the seven vanes. It was also found that the flow velocity near the rear hub was relatively higher. According to the analysis of the relationship between entropy production and cavitation in Figure 18a mentioned above, it can be seen that the flow channel near the shroud is more affected by cavitation, and the complex flow led to a corresponding decrease in the outlet flow velocity. In Figure 21b, as the Qrel drops to zero, the forward liquid flow in the impeller domain collides with the reverse liquid flow in the volute, causing a sharp decrease in the velocity at the impeller outlet edge. From Figure 19b, at the position of 210°, a rapid increase in reverse flow velocity is observed. This indicates that, at this instant, fluid near the tongue flows rapidly into the impeller under pressure, and the resultant high-speed fluid impact leads to irreversible energy losses. As shown in Figure 21d, at the runaway moment, the rotational speed reaches 1.25 times initial shutdown value. The elevated rotational speed markedly enhances the flow velocity. Significant variations in flow velocity are observed among the three positions, resulting in a relatively large velocity gradient. Furthermore, a substantial increase in entropy production is clearly identified.
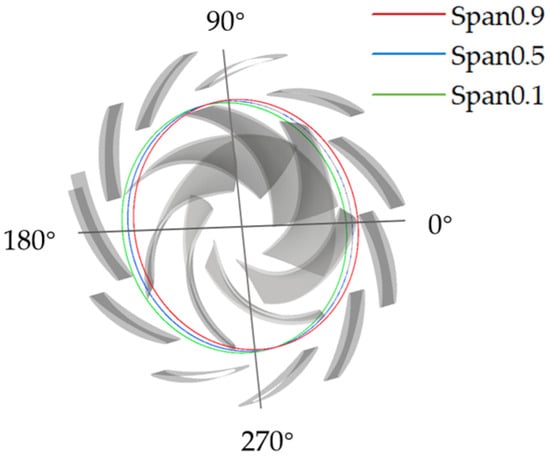
Figure 20.
Schematic diagram of the angle.
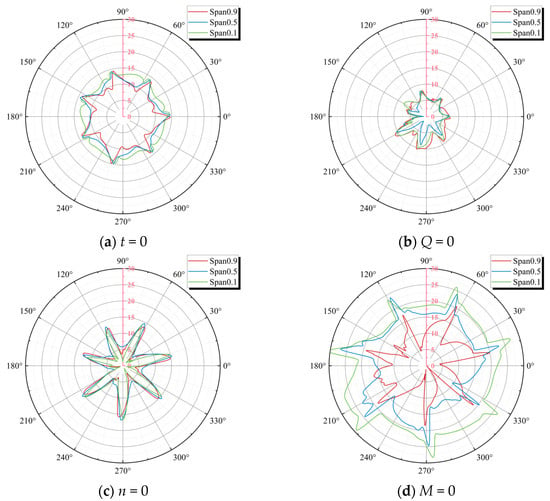
Figure 21.
Velocity distribution at different blade span at the outlet of impeller domain.
The streamline and cross-sectional entropy production distribution diagrams of the draft tube during the shutdown process are shown in Figure 22, with the streamlines rendered using the velocity cloud diagram. At the initial moment of power-off, the flow remains relatively stable. Nevertheless, at the elbow, a change in flow direction leads to the occurrence of energy losses. As illustrated in Figure 22b, when the flow rate decreases to zero, the flow velocity within the draft tube declines abruptly. Consequently, the liquid flow entering and exiting the impeller accumulates near the draft tube inlet, as indicated by the red arrow. Nevertheless, owing to the significant reduction in flow velocity, the velocity gradient exhibits only minor variations, thereby leading to a relatively low entropy production rate. The high entropy production rate region is distributed in a ring shape at the edge of the tailwater vortex band, as shown in Figure 22d. Observation of the streamlines indicates that, as the reverse flow increases, the tailwater vortex band in the middle of the flow passage begins to expand and induces cavitation. Simultaneously, two symmetrically distributed vortices with opposite rotation directions emerge at the red arrow, which are referred to as the Karman vortex street. This unstable vortex street contributes significantly to high entropy production. As shown in Figure 22e, under turbine mode, the reverse rotational speed n reaches its peak with a corresponding increase in flow velocity. The near-wall fluid is compressed by the central vortex rope, resulting in elevated velocity gradients and flow reversal formation within the region marked by the red circle. Simultaneously, viscous dissipation losses are amplified by wall shear stress effects. Ultimately, during runaway mode, a moderate reduction in entropy production rate intensity is observed. However, flow complexity increases due to cavitation-induced instabilities, with disordered streamlines in the elbow section severely compromising operational stability.
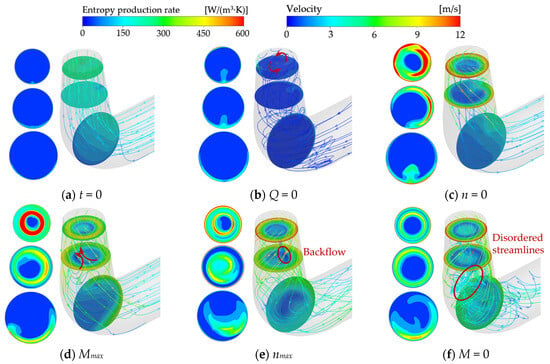
Figure 22.
Draft tube entropy production rate and velocity streamlines.
4.4. Time–Frequency Analysis of Pressure Pulsation
The analysis in preceding sections reveal that the flow within the vaneless region exhibits highly complex flow patterns and substantial energy dissipation during power-off process. To further investigate the transient flow characteristics during emergency transient process, this study conducts a systematic investigation into the pressure pulsation characteristics within the stay vane domain. During the power-off process, the internal pressure of the LVCP undergoes significant fluctuations, which may severely compromise the operational stability of the pump station and potentially lead to accidents [40]. The arrangement of pressure pulsation monitoring points is presented in Figure 23.
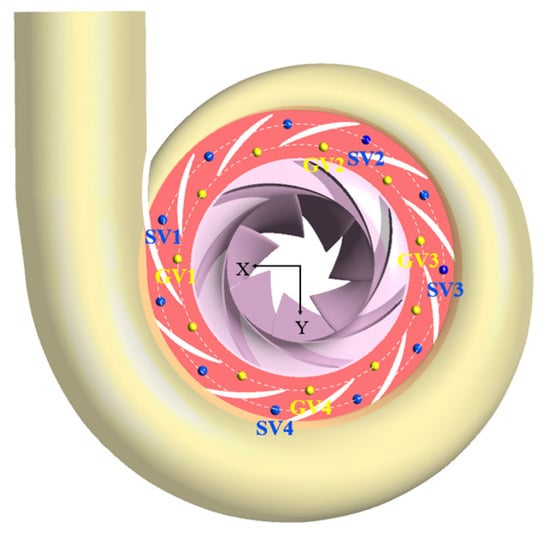
Figure 23.
Distribution of monitoring points.
As shown in Figure 24, the time-domain characteristics of pressure pulsation reveal that the pressure variation can be approximately categorized into three phases: a substantial pressure drop during pump deceleration, a progressive pressure increase following reverse rotation, and periodic pulsation after runaway mode. The pressure signal varies synchronously with the changes in flow rate and rotational speed. In the vicinity of the operating point where the flow rate is zero, the pressure exhibits abrupt increases and decreases. During the runaway process, as the rotational speed and flow rate increase to varying degrees compared to the initial stage of shutdown, the amplitude of pressure pulsation also increases accordingly. The higher amplitude has a significant impact on the operational stability of the shutdown process. The monitoring points GV1 and SV1 located at the tongue position clearly indicate that the pressure decreases to nearly zero after the flow rate Qrel reduces to zero. This observation correlates with the cavitation generation identified at the tongue position in Figure 11b. During the runaway process at the other two monitoring points, a sharp decline in instantaneous pressure is observed, and Figure 11f reveals cavitation induced by separation vortices at the blade trailing edge. The peak-to-valley pressure difference at GV2 is the greatest, suggesting that the flow pattern at this location exhibits greater complexity.
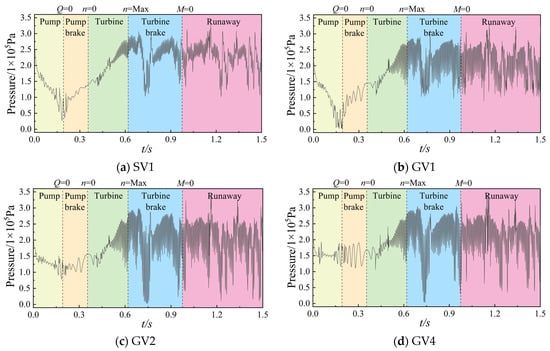
Figure 24.
Transient pressure at four typical monitoring points.
To further investigate the amplitude of pressure pulsation and its influencing factors, this study employed continuous wavelet transform (CWT) analysis implemented in Matlab R2018 (MathWorks, Natick, MA, USA) to successfully extract the unsteady excitation characteristics during the transient process. The frequency domain variation characteristics after the CWT are shown in Figure 25. During the shutdown process (t = 0–0.355 s), the forward rotational speed nrel progressively decreases, leading to a corresponding reduction in the dominant frequency. After entering the turbine mode (t = 0.355–0.965 s), as the reverse rotational speed rapidly increases, the main frequency rises accordingly. The rotational speed of the pump in the runaway condition fluctuates periodically, with the main frequency always being 7fn, which is the blade passing frequency. As shown in Figure 17 and Figure 18, cavitation generation, collapse, and flow separation were observed near the tongue at the blade outlet edge, the analysis demonstrates that high-frequency, low-amplitude pressure pulsations and their harmonics correlate with blade-passing frequencies, while low-frequency, high-amplitude pulsations are directly linked to periodic cavitation collapse and flow separation instabilities during shutdown process.
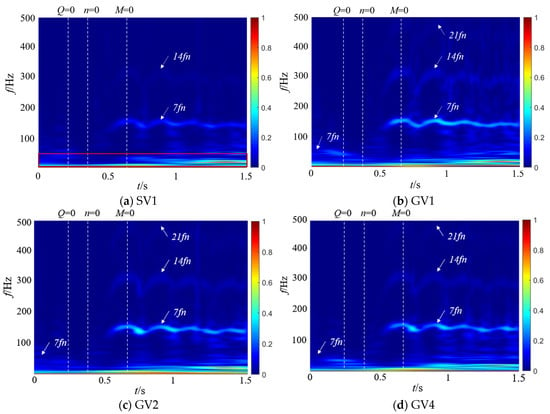
Figure 25.
Time–frequency distributions of the transient pressure signals at four monitoring points based on wavelet transform.
Figure 25a demonstrates that, during the shutdown process, as the reverse flow increases, the amplitude of the low-frequency pressure pulsation signal progressively rises, as highlighted by the red box. Observation reveals that the main frequencies of pressure pulsation in the two regions are related to the blade passing frequency, which is caused by the dynamic and static interference between the runner and the stay vanes. The secondary frequencies within the bladeless region can be clearly identified as twice and three times the blade frequency (14fn and 21fn), while for the stay vanes, only the secondary frequency twice the blade frequency (14fn) is found. From this, it can be further analyzed that the pressure pulsation generated in the bladeless region is transmitted outward through the stay vane flow passage. During this process, the interaction of frequency signals between stay vanes causes the 3-time blade frequency signal to disappear. During runaway, the amplitude of pressure pulsation reaches its maximum, seriously affecting the safety and stability of the shutdown process.
5. Conclusions and Outlook
This study predicted the power-off process in LVCP under cavitation conditions through numerical simulation methods, and analyzed in detail the evolution of external characteristic parameters and cavitation over time during the process. Based on the entropy production theory, this study systematically analyzed the energy loss characteristics during the transition process. Through detailed investigations, the primary regions and underlying causes of energy dissipation within the pump were identified. Additionally, the continuous wavelet transform technique was utilized to examine the characteristics of unstable pressure pulsation signals. The key findings are summarized as follows:
- (1)
- Following the power-off process of the LVCP, the external characteristic parameters undergo drastic changes, transitioning through multiple unstable operating conditions until runaway mode are reached, with the rotational speed ultimately stabilizing at 1.25nrel. During the transitional moment, the interaction of reversal vortices, separation vortices, and their induced secondary flows collectively disrupts the internal flow patterns within the pump. This hydrodynamic instability, manifested as abrupt flow field transitions, subsequently initiates intricate cavitation phenomena. During the initial power-off phase, inverted-triangular sheet cavitation develops on blade surfaces. As operating conditions transition, flow angle mismatch induces separation vortex cavitation, while under runaway conditions, the draft tube vortex rope propagates upstream, triggering distinct cavity-type cavitation structures. There is a strong coupling relationship between the cavitation morphology at different phases of the transient process and the dynamic characteristics of the impeller.
- (2)
- The transient process exhibits significant entropy production fluctuations. Unsteady flow patterns within the flow field demonstrate strong correlations with energy dissipation characteristics. During the initial shutdown phase, microjet formation from collapsing cavitation bubbles induces steep velocity gradient amplification in the flow field. This hydrodynamic intensification drives an exponential rise in entropy production rate within the cavitation collapse core zones, while cavitation exacerbates the flow complexity in the wake region. As the process proceeds, the separation vortices caused by the mismatch of the liquid flow angle and the induced cavitation of the separation vortices lead to a large amount of energy dissipation. The entropy production rate in the draft tube of the turbine mode increases sharply, and the high entropy production rate area corresponds to the recirculation vortex and the wake vortex band area. The pressure gradient change caused by the vortex is the main reason for energy dissipation. The fluid near the wall of the draft tube is squeezed by the draft water vortex band, resulting in an increase in shear stress and thus an increase in energy dissipation.
- (3)
- This study demonstrates that pressure pulsations induced by cavitation collapse and vortex system evolution are key factors influencing transient process stability. The main frequency of pressure pulsation exhibits dynamic variation with the shaft frequency, while its amplitude demonstrates a negative correlation with the cross-sectional area of the volute. Cavitation collapse, in conjunction with flow separation, recirculation, and other vortex-related phenomena, forms an unstable excitation source that induces low-frequency, high-amplitude pressure pulsations. During the runaway process, the pressure amplitude of LVCP reaches its peak value, and the pressure fluctuations become significantly more intense. This extreme pulsation, coupled with the potential for structural system resonance, represents a critical factor impacting the operational safety and stability of the unit.
This study numerically investigates the flow characteristics and pressure pulsation behavior of cavitating flow fields during emergency power-off process in LVCP systems. However, several critical aspects require further investigation to fully elucidate the underlying mechanisms. Future research should focus on certain extreme operating conditions, such as the complex flow dynamics that occur following an abrupt shutdown while operating in the hump region. Additionally, a high-fidelity numerical model for compressible flow should be established to account for the compressibility of both liquid water and vapor. This model will enable systematic investigation into potential water column separation and column-rejoining water hammer phenomena in the draft tube and penstock during the shutdown process of the LVCP prototype, along with their high-dynamic coupling effects on operational stability.
Author Contributions
Conceptualization, Q.P. (Qingzhao Pang); Methodology, Q.P. (Qingzhao Pang) and G.Y.; Software, Q.P. (Qingzhao Pang), G.Y. and X.S.; Formal analysis, Q.P. (Qingzhao Pang); Writing—original draft, Q.P. (Qingzhao Pang); Writing—review and editing, Q.P. (Qingzhao Pang), D.Z., G.Y. and X.S.; Project administration, D.Z.; Supervision, D.Z.; Validation, L.G., Q.P. (Qiang Pan) and Q.L.; Investigation, L.G. and Q.L.; Data curation, Q.P. (Qiang Pan); Funding acquisition, D.Z. All authors have read and agreed to the published version of the manuscript.
Funding
This work was financially supported by National Science Foundation for Distinguished Young Scholars (Grant No. 52425903), National Natural Science Foundation of China (Grant Nos. U2106225 and 52209111) and China Scholarship Council (202308690004).
Data Availability Statement
The data that support the findings of this study are available from the corresponding authors upon reasonable request.
Conflicts of Interest
The authors declare no conflicts of interest.
Nomenclature
| D1, D2 | Impeller inlet, outlet diameter (mm) |
| Hd | Design, Simulated, Experiment head (m) |
| HCFD | Simulated head (m) |
| HEXP | Experiment head (m) |
| J | The moment of inertia of the impeller and the motor rotor (kg·m2) |
| Qdes | Design flow rates (m3/s) |
| M | Impeller torque (N·m) |
| Z1, Z2 | Number of impeller, stay vane blades |
| fn | Impeller rotational frequency |
| ns | Specific speed |
| n | Rotational speed (r/min) |
| ui, uj, uk | Velocity components in x, y, z-direction (m/s) |
| pin, pout | The inlet and outlet pressure of the pump (Pa) |
| Fc | Condensation coefficient |
| Fe | Evaporation coefficient |
| μm | Laminar dynamic viscosity of mixture (Pa·s) |
| μt | Turbulent eddy viscosity (Pa·s) |
| μeff | The effective dynamic viscosity of the mixture (Pa·s) |
| ρm | mixed phase densities (kg/m3) |
| ρl | Liquid densities (kg/m3) |
| ρv | vapor densities (kg/m3) |
| fHT | The total error of the head |
| fηs | The comprehensive efficiency error of the test bench |
| αv | Vapor volume fraction |
| αnuc | Volume fraction of vapor nuclei contained in a unit liquid |
| ω | Rotational angular velocity (rad/s) |
| σ | Cavitation number |
| η | Efficiency (%) |
| Wall entropy production (W/K) | |
| Averaged velocity entropy production (W/K) | |
| Pulsating velocity entropy production (W/K) | |
| Rb | Mean radius of cavity (m) |
| , | Evaporation and condensation rates of the liquid and vapor phases |
Abbreviations
| LVCP | Large volute centrifugal pump |
| UDF | User-Defined Function |
| CFD | Computational Fluid Dynamics |
| SST | Shear stress transport |
| CWT | Continuous Wavelet Transform |
References
- Zsiborács, H.; Baranyai, N.; Vincze, A.; Zentkó, L.; Birkner, Z.; Máté, K.; Pintér, G. Intermittent renewable energy sources: The role of energy storage in the European power system of 2040. Electronics 2019, 8, 729. [Google Scholar] [CrossRef]
- Guan, H.; Yin, X.; Jiang, W. Towards the integration of distributed renewables: Operation analysis of pumped storage system under off-design condition based on CFD. Appl. Energy 2024, 355, 122217. [Google Scholar] [CrossRef]
- Zuo, Z.; Liu, S. Flow-induced instabilities in pump-turbines in China. Engineering 2017, 3, 504–511. [Google Scholar] [CrossRef]
- Rode, B.; Kumar, A. Unstable pressure fluctuations in the vaneless space of high-head reversible pump-turbines—A systematic review. J. Energy Storage 2023, 72, 108397. [Google Scholar] [CrossRef]
- Torii, D.; Nagahara, T.; Okihara, T. Suppression of the secondary flow in a suction channel of a large centrifugal pump. IOP Conf. Ser. Mater. Sci. Eng. 2013, 52, 032005. [Google Scholar] [CrossRef]
- Kye, B.; Park, K.; Choi, H.; Lee, M.; Kim, J. Flow characteristics in a volute-type centrifugal pump using large eddy simulation. Int. J. Heat Fluid Flow 2018, 72, 52–60. [Google Scholar] [CrossRef]
- Ye, W.; Huang, R.; Jiang, Z.; Li, X.; Zhu, Z.; Luo, X. Instability analysis under part-load conditions in centrifugal pump. J. Mech. Sci. Technol. 2019, 33, 269–278. [Google Scholar] [CrossRef]
- Duplaa, S.; Coutier-Delgosha, O.; Dazin, A.; Bois, G. X-ray measurements in a cavitating centrifugal pump during fast start-ups. J. Fluids Eng. 2013, 135, 041204. [Google Scholar] [CrossRef]
- Walseth, E.; Nielsen, T.; Svingen, B. Measuring the dynamic characteristics of a low specific speed pump-turbine model. Energies 2016, 9, 199. [Google Scholar] [CrossRef]
- Hu, J.; Yang, J.; Zeng, W.; Yang, J. Transient pressure analysis of a prototype pump turbine: Field tests and simulation. J. Fluids Eng. 2018, 140, 071102. [Google Scholar] [CrossRef]
- Sun, X.; Tong, J.; Zhang, Y.; Cai, H.; Zhou, W.; Jia, X.; Ou, L. Experimental analysis of radial centrifugal pump shutdown. Fluid Dyn. Mater. Process. 2024, 20, 725–737. [Google Scholar] [CrossRef]
- Chirag, T.; Gunnar, D. Interaction between trailing edge wake and vortex rings in a Francis turbine at runaway condition: Compressible large eddy simulation. Phys. Fluids 2018, 30, 075101. [Google Scholar] [CrossRef]
- Yang, Z.; Cheng, Y.; Xia, L.; Meng, W.; Liu, K.; Zhang, X. Evolutions of flow patterns and pressure fluctuations in a prototype pump-turbine during the runaway transient process after pump-trip. Renew. Energy 2020, 152, 1149–1159. [Google Scholar] [CrossRef]
- Kan, K.; Zheng, Y.; Chen, H.; Zhou, D.; Dai, J.; Maxime, B.; Yu, A. Numerical simulation of transient flow in a shaft extension tubular pump unit during runaway process caused by power failure. Renew. Energy 2020, 154, 1153–1164. [Google Scholar] [CrossRef]
- Feng, J.; Ge, Z.; Zhang, Y.; Zhu, G.; Wu, G.; Lu, J.; Luo, X. Numerical investigation on characteristics of transient process in centrifugal pumps during power failure. Renew. Energy 2021, 170, 267–276. [Google Scholar] [CrossRef]
- Kang, W.; Zhou, L.; Wang, Z. Analysis of flow characteristics and cavitation in the vanes of a reversible pump-turbine in pump mode. J. Energy Storage 2023, 68, 107690. [Google Scholar] [CrossRef]
- Li, D.; Song, Y.; Lin, S.; Wang, H.; Qin, Y.; Wei, X. Effect mechanism of cavitation on the hump characteristic of a pump-turbine. Renew. Energy 2021, 167, 369–383. [Google Scholar] [CrossRef]
- Dehghan, A.; Shojaeefard, M.; Roshanaei, M. Exploring a new criterion to determine the onset of cavitation in centrifugal pumps from energy-saving standpoint; experimental and numerical investigation. Energy 2024, 293, 130681. [Google Scholar] [CrossRef]
- Liu, H.; Liu, D.; Wang, Y.; Wu, X.; Wang, J.; Du, H. Experimental investigation and numerical analysis of unsteady attached sheet cavitating flows in a centrifugal pump. J. Hydrodyn. 2013, 25, 370–378. [Google Scholar] [CrossRef]
- Fu, Y.; Yuan, J.; Yuan, S.; Giovanni, P.; D’Agostino, L.; Huang, P.; Li, X. Numerical and experimental analysis of flow phenomena in a centrifugal pump operating under low flow rates. J. Fluids Eng. 2015, 137, 011102. [Google Scholar] [CrossRef]
- Yang, G.; Zhang, D.; Shen, X.; Pan, Q.; Pang, Q.; Lu, Q. Investigation on flow instability in the hump region of the large vertical centrifugal pump under cavitation based on proper orthogonal decomposition. Phys. Fluids 2024, 36, 115134. [Google Scholar] [CrossRef]
- Sun, W.; Tan, L. Cavitation-vortex-pressure fluctuation interaction in a centrifugal pump using bubble rotation modified cavitation model under partial load. J. Fluids Eng.-Trans. ASME 2020, 142, 051206. [Google Scholar] [CrossRef]
- Fu, X.; Li, D.; Wang, H.; Cheng, Y.; Wei, X. Hydraulic fluctuations during the pump power-off runaway transient process of a pump turbine with consideration of cavitation effects. J. Hydrodyn. 2021, 33, 1162–1175. [Google Scholar] [CrossRef]
- Li, Q.; Xin, L.; Yao, L.; Zhang, S. Flow characteristics analysis of load rejection transition process in pumped storage unit based on cavitation model. J. Appl. Fluid Mech. 2024, 17, 1735–3572. [Google Scholar] [CrossRef]
- Zhou, L.; Hang, J.; Bai, L.; Krzemianowski, Z.; El-Emam, M.; Yaseer, E.; Agarwal, R. Application of entropy production theory for energy losses and other investigation in pumps and turbines: A review. Appl. Energy 2022, 318, 119211. [Google Scholar] [CrossRef]
- Yang, G.; Shen, X.; Shi, L.; Zhang, D.; Zhao, X.; van Esch, B. Numerical investigation of hump characteristic improvement in a large vertical centrifugal pump with special emphasis on energy loss mechanism. Energy 2023, 273, 127163. [Google Scholar] [CrossRef]
- Kock, F.; Herwig, H. Local entropy production in turbulent shear flows: A high-Reynolds number model with wall functions. Int. J. Heat Mass Transf. 2004, 47, 2205–2215. [Google Scholar] [CrossRef]
- Li, X.; Jiang, Z.; Zhu, Z.; Si, Q. Entropy generation analysis for the cavitating head-drop characteristic of a centrifugal pump. J. Mech. Eng. Sci. 2018, 232, 4637–4646. [Google Scholar] [CrossRef]
- Wang, X.; Wang, Y.; Liu, H.; Xiao, Y.; Jiang, L.; Li, M. A numerical investigation on energy characteristics of centrifugal pump for cavitation flow using entropy production theory. Int. J. Heat Mass Transf. 2023, 201, 123591. [Google Scholar] [CrossRef]
- Ge, Z.; Feng, J.; Wu, Y.; Yang, Z.; Zhang, Y.; Zhu, G.; Luo, X. Numerical analysis on characteristics of transient process in centrifugal pumps during power failure under large flow initial condition. Chin. J. Hydrodyn. 2022, 37, 452–458. [Google Scholar]
- Deng, Y.; Xu, J.; Li, Y.; Zhang, Y.; Qi, C. Research on energy loss characteristics of pump-turbine during abnormal shutdown. Processes 2022, 10, 1628. [Google Scholar] [CrossRef]
- Zhang, C.; Wang, W.; Pavesi, G.; Yuan, S.; Pei, J. Research on the mechanism of severe unsteadiness of PAT braking condition during the power failure. Renew. Energy 2024, 232, 121019. [Google Scholar] [CrossRef]
- Long, X.; Cheng, H.; Ji, B.; Arndt, R.; Peng, X. Large eddy simulation and Euler-Lagrangian coupling investigation of the transient cavitating turbulent flow around a twisted hydrofoil. Int. J. Multiph. Flow 2018, 100, 41–56. [Google Scholar] [CrossRef]
- Shim, H.; Kim, K. Effects of the cross-sectional area of a volute on suction recirculation and cavitation in a centrifugal pump. J. Fluids Eng. 2022, 142, 051204. [Google Scholar] [CrossRef]
- Menter, F. Review of the shear-stress transport turbulence model experience from an industrial perspective. Int. J. Comput. Fluid Dyn. 2009, 23, 305–316. [Google Scholar] [CrossRef]
- Shi, L.; Bayeul-Laine, A.; Coutier-Delgosha, O. Numerical investigations on unsteady vortical flows and separation-induced transition over a cycloidal rotor at low Reynolds number. Energy Convers. Manag. 2022, 266, 115812. [Google Scholar] [CrossRef]
- Yang, G.; Zhang, D.; Gao, H.; Shen, X.; Pan, Q.; Pang, Q.; Lu, Q. Transient flow characteristics and energy loss investigation in a desalination energy recovery device under rotor system axial sliding conditions: Focusing on the turbine side. Phys. Fluids 2025, 37, 015196. [Google Scholar] [CrossRef]
- Chen, H.; Liu, H.; Kan, K.; Hui, X.; Feng, J.; Aboule, L. Analysis of hydraulic characteristics during low head start-up transition of pumped storage units based on entropy production theory. J. Energy Storage 2024, 102, 114042. [Google Scholar] [CrossRef]
- Zhang, X.; Wang, Y.; Xu, X. Energy conversion characteristic within impeller of low specific speed centrifugal pump. Trans. Chin. Soc. Agric. Mach. 2011, 42, 75–81. [Google Scholar]
- Wang, W.; Guo, H.; Zhang, C.; Shen, J.; Pei, J.; Yuan, S. Transient characteristics of PAT in micro pumped hydro energy storage during abnormal shutdown process. Renew. Energy 2023, 209, 401–412. [Google Scholar] [CrossRef]
Disclaimer/Publisher’s Note: The statements, opinions and data contained in all publications are solely those of the individual author(s) and contributor(s) and not of MDPI and/or the editor(s). MDPI and/or the editor(s) disclaim responsibility for any injury to people or property resulting from any ideas, methods, instructions or products referred to in the content. |
© 2025 by the authors. Licensee MDPI, Basel, Switzerland. This article is an open access article distributed under the terms and conditions of the Creative Commons Attribution (CC BY) license (https://creativecommons.org/licenses/by/4.0/).