Abstract
Coastal debris is a global environmental issue that requires systematic monitoring strategies based on reliable statistical data. Recent advances in remote sensing and deep learning-based object detection have enabled the development of efficient coastal debris monitoring systems. In this study, two state-of-the-art object detection models—RT-DETR and YOLOv10—were applied to UAV-acquired images for coastal debris detection. Their false positive characteristics were analyzed to provide guidance on model selection under different coastal environmental conditions. Quantitative evaluation using mean average precision (mAP@0.5) showed comparable performance between the two models (RT-DETR: 0.945, YOLOv10: 0.957). However, bounding box label accuracy revealed a significant gap, with RT-DETR achieving 80.18% and YOLOv10 only 53.74%. Class-specific analysis indicated that both models failed to detect Metal and Glass and showed low accuracy for fragmented debris, while buoy-type objects with high structural integrity (Styrofoam Buoy, Plastic Buoy) were consistently identified. Error analysis further revealed that RT-DETR tended to overgeneralize by misclassifying untrained objects as similar classes, whereas YOLOv10 exhibited pronounced intra-class confusion in fragment-type objects. These findings demonstrate that mAP alone is insufficient to evaluate model performance in real-world coastal monitoring. Instead, model assessment should account for training data balance, coastal environmental characteristics, and UAV imaging conditions. Future studies should incorporate diverse coastal environments and apply dataset augmentation to establish statistically robust and standardized monitoring protocols for coastal debris.
1. Introduction
Coastal debris can occur in all parts of the ocean and, as it moves across national boundaries, has become a global environmental issue with transboundary impacts [1]. Since the onset of the COVID-19 pandemic, domestic and industrial waste, as well as packaging materials and single-use containers, has increased. Meanwhile, recycling rates have stagnated or declined, further accelerating coastal debris generation [2,3]. Such debris is readily transported into the marine environment, becoming floating debris or settling as benthic debris, which ultimately causes environmental pollution, ecosystem degradation, and loss of tourism resources. To mitigate these impacts, developing systematic management strategies at the national level is essential. However, developing such strategies requires continuous monitoring of coastal debris generation, together with reliable estimation of total loads, in order to produce reliable statistical data.
The National Oceanic and Atmospheric Administration (NOAA, USA) conducts the Marine Debris Monitoring and Assessment Project (MDMAP), where volunteers and field surveyors periodically select beach transects, collect debris, and record classification information to compile statistical data [4]. In Europe, the OSPAR beach litter monitoring guidelines require government officials or trained civilian surveyors to classify and record all debris found within a designated 100 m beach section at least four times a year to compile statistical data on coastal debris [5]. In the Republic of Korea, a non-governmental organization commissioned by the government conducts regular coastal debris surveys every two months, dividing beaches longer than 100 m into 10 m segments and recording the quantity of debris along with photographs to compile statistical data [6].
However, manpower-based survey methods, even when conducted by trained investigators, are prone to subjective judgment and inconsistent classification, underscoring the need for remote sensing approaches that provide objective and reproducible results. Moreover, such surveys are time-consuming, limiting the efficiency of monitoring. To address the limitations and challenges of conventional monitoring approaches, recent studies have actively explored the use of remote sensing and artificial intelligence for coastal debris monitoring. Unmanned aerial vehicles (UAVs) can acquire high-resolution images or videos over large areas within a short period of time. Deep learning-based object detection models, supported by continuous development and performance improvements of open-source frameworks, can maintain high accuracy even when trained with custom datasets. In particular, the integration of UAVs with deep learning-based object detection enables near real-time monitoring. This approach has been applied across various domains, including invasive species detection for environmental management, road crack detection, and rice seedling identification [7,8,9].
Consistent with prior research utilizing UAVs and object detection models, Kosuke Takaya et al. identified coastal debris in the Seto Inland Sea by applying the RetinaNet model to high-resolution images captured via UAV [10]. Pfeiffer et al. collected UAV-based coastal debris images along the coasts of Malta, Gozo, and Sicily, detected debris within the images using the YOLOv5 model, and produced coastal debris distribution maps based on location information to facilitate debris monitoring [11].
Applying deep learning-based object detection models to UAV-acquired images and videos of extensive coastal areas can yield objective and reliable coastal debris statistics within a short time. However, most existing studies have primarily focused on three aspects—(1) quantitative performance evaluation, (2) field applicability assessment, and (3) detection result analysis—without sufficiently addressing how detection performance changes under varying environmental and debris conditions. Moreover, when applied to coastal environments with different characteristics from those of the original study sites, detection performance may degrade, resulting in varying outcomes. Detection performance may also vary depending on the network architecture and training methodology. In particular, the shape and characteristics of objects can further influence detection results. These issues may lead to false positives, a major factor contributing to performance degradation. Ma et al. identified coastal debris using the YOLOv12 model and further evaluated model performance by analyzing bounding box confidence and label accuracy, as well as by estimating the causes of failure or uncertain detection cases [12]. However, they did not conduct statistical analyses of falsely detected objects or compare their characteristics with those of actual objects.
The objective of this study is to detect coastal debris in UAV-acquired monitoring images using deep learning-based object detection models and to evaluate their accuracy using a novel assessment approach, rather than relying solely on conventional performance metrics. In particular, the analysis focuses on false positives and misclassified objects to calculate detection accuracy for each model, while performance evaluation is conducted based on the causes of false detections.
These results provide field-based performance metrics and model-specific false positive characteristics, enabling a comprehensive quantitative and qualitative evaluation of model performance. Furthermore, by clarifying the impact of architectural differences on detection performance and false positives, this study establishes criteria for selecting models appropriate to coastal environmental conditions and is expected to contribute to the development of efficient coastal debris monitoring systems.
2. Materials and Methods
2.1. Study Area
The characteristics, composition, and degradation levels of coastal debris vary significantly across coastal regions, depending on environmental and socio-economic conditions. Coastal areas with active tourism industries typically exhibit high proportions of domestic waste—such as PET bottles, plastic bags, and plastic food delivery containers—whereas areas dominated by fisheries generally contain fishery-related debris, including plastic buoys, Styrofoam buoys, fishing nets, and ropes. Coastal areas regularly managed by local governments or non-governmental organizations contain a higher proportion of undegraded debris due to periodic cleanup activities. In contrast, unmanaged areas contain more debris that has lost its original form or undergone surface changes from prolonged weathering and erosion.
Considering the regional characteristics of coastal debris distribution, three criteria were established to select representative study sites: (i) active debris influx, (ii) management status by local governments or non-governmental organizations, and (iii) absence of bias toward a single debris category. These criteria ensure that the site encompasses diverse debris types and degradation levels, enabling robust evaluation of model detection performance. Coastal areas meeting all three criteria were selected as study sites.
The selected site is a coastal area located in Guyeong-ri, Jangmok-myeon, Geoje-si, Gyeongsangnam-do (35°2′5″ N, 128°41′6″ E, WGS84), as shown in Figure 1. The site supports active coastal fisheries and receives debris from nearby tourist destinations, transported by waves and wind. Its proximity to the Nakdong River estuary and Busan New Port also results in the deposition of land-based debris from the river’s lower reaches and marine debris from vessels. Due to its limited accessibility and small size, it has been excluded from managed coastal sites, resulting in the accumulation of degraded debris over time. These geographical and environmental conditions provide an ideal testbed for analyzing the false detection characteristics of deep learning models with respect to debris type and degree of degradation.
Figure 1.
Map of the study site located in Guyeong-ri, Jangmok-myeon, Geoje-si, Gyeongsangnam-do (35°2′5″ N, 128°41′6″ E, WGS84).
2.2. Data Acquisition
2.2.1. UAV Image Collection
Coastal debris images of the selected study site were collected using a Phantom 4 Pro V2.0 UAV (DJI, Shenzhen, China), with detailed camera specifications provided in Table 1. To determine an appropriate flight altitude that would capture the distribution and types of debris in the study area, previous research on UAV-based coastal debris detection was reviewed.
Table 1.
Camera specifications and acquisition settings of the DJI Phantom 4 Pro V2.0 used in this study.
Kako et al. estimated the quantity of coastal debris using images captured at a ground sampling distance (GSD) of 5 mm/px from an altitude of 17 m, reporting that PET bottles could not be detected at altitudes exceeding 17 m [13]. Merlino et al. demonstrated that debris as small as 1.5–2.5 cm, corresponding to the OSPAR “small” category, could be identified in images acquired from an altitude of 6 m [14]. Martin et al. compared images taken at altitudes of 5 m, 10 m, and 20 m, and concluded that 10 m was the optimal altitude for coastal debris monitoring [15].
Based on these prior findings, the optimal flight altitude for image collection in the study area was set to 10 m. The survey was conducted on 7 May 2024 at approximately 14:00, under clear weather conditions following rainfall. A total area of 3041 m2 was captured in nadir view, resulting in the acquisition of 207 images. Each image had a resolution of 5472 × 3648 pixels, with a ground sampling distance (GSD) of 0.27 cm/px. The collected images were applied to the models without preprocessing in order to verify their field applicability, eliminate potential distortions of the visible characteristics of coastal debris objects, and facilitate the establishment of a real-time coastal debris monitoring system in the future.
2.2.2. AI-Hub Coastal Debris Dataset
To train the coastal debris detection models, we used the “Coastal Debris” dataset provided by AI-Hub, a publicly funded national AI dataset platform in the Republic of Korea. A large-scale, high-quality training dataset is essential for enhancing model performance and ensuring high detection accuracy. However, in the Republic of Korea, collecting, refining, and processing large-scale datasets that represent various beach types is time-intensive, and individual efforts often lack the resources to ensure reliable data quality. Therefore, we utilized a publicly available, large-scale dataset that was specifically developed for AI training purposes and underwent rigorous quality control.
The AI-Hub “Coastal Debris” dataset contains approximately 350,000 images captured using various equipment, including UAVs and cameras. These images are categorized into 11 classes. Following the National Coastal Debris Monitoring 2019 guidelines, the dataset defines three top-level categories—plastics, glass, and metal [16]. The plastics category is further divided into seven subcategories based on the most frequently occurring debris types.
The established classes are Glass, Metal, Net, PET Bottle, Plastic Buoy, Plastic ETC, Plastic Buoy of China, Rope, Styrofoam Box, Styrofoam Buoy, and Styrofoam Piece. Among these, the class “Plastic Buoy of China” was excluded from training, as it was not present in the study area and would not contribute to model evaluation. The number of objects and their proportions for each class are presented in Table 2. Class proportion differences can influence a model’s learning capability and performance. Although differences in class proportions can influence a model’s learning capability and performance, in this study no adjustments to class ratios were made. Instead, the dataset was divided into training and validation sets at an 8:2 ratio to analyze false positive characteristics according to the given training data.
Table 2.
Statistics of objects in the AI-Hub coastal debris dataset used for model training.
2.3. Object Detection Models
This study employed the RT-DETR and YOLOv10 models, representing the DETR and YOLO families, respectively, for coastal debris detection. Both model families are widely adopted in object detection and, through continuous development and architectural improvements, have achieved high accuracy, which has led to their frequent application in this domain. Various versions of these models—including Deformable DETR, RT-DETR, and YOLO models ranging from YOLOv3 to YOLOv10—have been actively utilized.
In prior studies, Shen et al. applied YOLOv7 and YOLOv8 to detect marine debris in satellite imagery, reporting mean average precision (mAP) values of 0.674 for YOLOv7 and 0.746 for YOLOv8 [17]. Jiang et al. employed YOLOv8 and an improved version of YOLOv8 for submerged marine debris detection, achieving mAP@0.5 values of 0.663 for YOLOv8 and 0.720 for the improved YOLOv8, confirming the superior performance of the improved model [18]. Bak et al. compared YOLOv8 and RT-DETR for coastal debris detection and applicability. They reported that YOLOv8 outperformed RT-DETR in detection accuracy, speed, robustness, handling of color distortion, and resistance to object occlusion [19]. However, most existing studies have focused primarily on quantitative performance metrics, with limited investigation into how detection accuracy and performance differ across real-world coastal conditions. In particular, despite the distinct differences in training and detection mechanisms arising from the fundamentally different architectures of the YOLO and DETR families, comparative studies reflecting these differences in detection results and performance remain limited.
The RT-DETR and YOLOv10 models provided by Ultralytics were employed in this study, and the architectures of each model are presented in Table 3 and Table 4, respectively.
Table 3.
Architecture of the RT-DETR model.
Table 4.
Architecture of the YOLOv10 model.
The RT-DETR model consists of three main components: a CSPResNet50-based backbone, an Efficient Hybrid Encoder, and an RT-DETR Decoder Module. Its backbone (CSPResNet50) supports compatibility with the Swin Transformer—one of RT-DETR’s key features—and is designed to reduce the high computational cost that limits conventional DETR models. The Efficient Hybrid Encoder incorporates an Attention-Based Intra-scale Feature Interaction module and a Cross-scale Feature Fusion module, which enhance the recognition of objects at various scales while reducing computational complexity, thereby making the model lightweight and suitable for real-time detection [20]. The Decoder Module combines a Transformer architecture with deformable convolution to predict classes and labels, producing the final detection results [21]. Owing to this design, RT-DETR achieves greater computational efficiency than traditional Transformer-based models and maintains high accuracy even in complex backgrounds and multi-object environments [20].
YOLOv10 employs an enhanced version of CSPNet as its backbone and utilizes a Path Aggregation Network (PAN) Layer in the neck. It applies a One-to-Many head in training, whereas in inference it employs a One-to-One head. The enhanced CSPNet backbone improves both feature extraction capability and computational efficiency, while the PAN layer transmits multi-scale features to the head for effective detection of objects of varying sizes. The One-to-Many head generates multiple predictions for a single object during training to improve accuracy, and the One-to-One head eliminates the need for the NMS (Non-Maximum Suppression) process during inference, thereby increasing detection speed and minimizing latency. With this architecture, YOLOv10 achieves real-time detection and demonstrates stable performance even in large-scale multi-object detection scenarios [22].
2.4. Methods
2.4.1. Model Training Parameters
In this study, the RT-DETR and YOLOv10 models trained using the large-scale AI-Hub dataset were applied to UAV images captured in the study area. The training parameters for both models are summarized in Table 5 to facilitate direct comparison. To ensure comparable quantitative performance between the models, the checkpoint corresponding to the epoch with the highest validation performance (out of 500 total epochs) was selected for each model. Because RT-DETR requires greater computational resources than YOLOv10, the lightweight option (Simplify) was set to True, and the batch size was adjusted accordingly. All other parameters were kept identical to ensure consistency during training.
Table 5.
Hyperparameters used for YOLOv10 and RT-DETR training.
2.4.2. False Positive Definition
In this study, the error patterns of coastal debris object detection models were analyzed with a focus on false positives (FP) identified in the confusion matrix, including misclassified objects. The confusion matrix visualizes the relationship between model predictions and ground truth, summarizes detection performance using True Positive (TP), True Negative (TN), False Positive (FP), and False Negative (FN). Specifically, TP denotes cases where both prediction and ground truth are positive; TN, where both are negative; FP, where the prediction is positive but the ground truth is negative; and FN, where the prediction is negative but the ground truth is positive. FP is defined as a Type I error, whereas FN corresponds to a Type II error [23].
False positives occur when the model either detects an object where none exists or assigns an incorrect class label. In this study, two specific types of false positives were analyzed: (1) misclassifications among trained classes, and (2) false detections involving untrained classes. In both cases, bounding boxes were generated: either an incorrect class was assigned to an object at the correct location, or a label was incorrectly assigned to a non-existent or untrained object. An example is provided in Figure 2.

Figure 2.
Example of false positive types for error pattern analysis. Subfigures (a,b) show false positives detected by RT-DETR, while subfigures (c,d) show false positives detected by YOLOv10. In the images, red bounding boxes indicate false positives among trained classes (label errors), while yellow bounding boxes represent false detections of objects not included in the training data (untrained classes).
2.4.3. Additional Classes for Analysis
The trained models were applied to 207 UAV images from the study area to evaluate false positive characteristics. For each image, the number of detected objects, the types of false positives, and class-specific statistics were calculated to characterize the models’ error patterns. Objects without a generated bounding box (i.e., undetected objects) were excluded from the analysis, while only those with both a bounding box and an assigned class label were included.
To analyze the causes of misclassifications, model-detected objects not represented in the training dataset were identified and grouped into five categories: plastic bags, wood, rocks, woven sacks, and seaweed. To capture finer distinctions, plastic bags and seaweed were further subdivided by color, increasing the total to eight analytical categories, as shown in Table 6.
Table 6.
Additional object categories defined for false positive analysis in UAV-based coastal debris detection.
3. Results
3.1. Quantitative Performance Evaluation
Prior to the false positive analysis, the quantitative performance of the RT-DETR and YOLOv10 models was assessed. The evaluation metrics included the F1-score, F1 confidence curve, precision–recall (PR) curve, and mean average precision (mAP@0.5). The evaluation results for the two models are presented in Table 7 and Figure 3. Both models achieved an F1-score of 0.92, indicating balanced detection performance across all classes. The PR curves for both models were concentrated in the upper-right corner, demonstrating high detection performance. The mAP@0.5 values were 0.945 for RT-DETR and 0.957 for YOLOv10, and all class-specific mAP@0.5 values exceeded 0.88, confirming the overall high detection capability of both models.
Table 7.
mAP@0.5 values by Class for YOLOv10 and RT-DETR models.
Figure 3.
Performance curves of RT-DETR and YOLOv10 models trained on AI-Hub coastal debris dataset: (a) F1 Confidence curve of RT-DETR; (b) Precision–Recall curve of RT-DETR; (c) F1 Confidence curve of YOLOv10; (d) Precision–Recall curve of YOLOv10.
However, quantitative metrics alone cannot reveal whether class labels remain consistently reliable under diverse field conditions, such as degraded surfaces, irregular shapes, or optical variations in debris objects. Therefore, in this study, additional analyses were conducted on the accuracy of detected object labels and on false positive behavior using actual coastal images.
3.2. RT-DETR False Positive Analysis
3.2.1. Bounding Box Label Accuracy by Class in RT-DETR
Prior to the misclassification analysis of the RT-DETR model, the bounding box label accuracy under real coastal conditions was calculated (Table 8). Accuracy was calculated as the ratio of correctly detected bounding boxes to the total number of bounding boxes detected in UAV images, as follows:
Bounding Box Label Accuracy = {(All Detection − False Positive)/All Detection} × 100
Table 8.
Bounding box label accuracy by Class for RT-DETR.
The RT-DETR model detected a total of 1302 debris objects, of which 258 were assigned incorrect labels and considered misclassifications Consequently, the overall bounding box label accuracy was 80.18%, lower than the mAP@0.5 value (0.945) obtained from the quantitative performance evaluation. However, considering the debris distribution and the degree of object degradation, the model maintained a relatively high level of accuracy despite the large number of detections.
The class-specific analysis revealed that Styrofoam Buoy, Plastic Buoy, and Styrofoam Piece achieved accuracies exceeding 90%. This indicates that bounding boxes and labels for these objects were assigned reliably. In contrast, Metal and Glass were almost entirely misclassified, suggesting that the model was effectively unable to detect these classes.
3.2.2. Ground Truth-Based False Positive Evaluation in RT-DETR
Following the bounding box label accuracy evaluation of the RT-DETR model, a comparative analysis with the ground truth was conducted for the 258 objects identified as misclassifications (Table 9). Among these, 79 objects (30.62%) belonged to trained classes. The remaining 179 objects (69.38%) were absent from the training dataset but were incorrectly assigned to trained classes with similar material, shape, or color. This suggests that RT-DETR misclassified untrained objects as trained classes when they exhibited visual similarity.
Table 9.
Ground Truth-Based false positive ratio for RT-DETR.
3.2.3. False Positive-Based Error Analysis in RT-DETR
A total of 258 objects identified as false positives were compared with the ground truth to analyze the underlying causes. The false positive ratios for each object type are presented in Table 10, and the class-to-class heat map is shown in Figure 4.
Table 10.
False positive counts by predicted class vs. ground-truth class (RT-DETR).
Figure 4.
Heat-map for Predicted Class and Ground Truth Class for RT-DETR.
The heat map analysis revealed that the object pairs most frequently involved in false positives were ‘Glass–Seaweed (Green)’, ‘Metal–Plastic ETC’, ‘Net–Plastic Bags (Black)’, ‘Rope–Wood’, and ‘Styrofoam Buoy–Plastic Buoy’.
At the class level, the classes with the highest false positive rates were PET Bottle (36.06%), Glass (15.50%), Styrofoam Piece (13.18%), Plastic ETC (12.40%), and Rope (8.14%).
The highest false positive rate (36.06%) was observed for PET Bottle, primarily caused by confusion with transparent or white plastic bags, rectangular plastic fragments, or wood. For Glass (15.50%), many false positives occurred when green or black seaweed washed ashore was misidentified as glass. False positives involving Styrofoam Piece, Plastic ETC, Rope, Metal, and Net were mainly attributed to indistinct object shapes and diverse colors, which led to confusion among similar classes. By contrast, Styrofoam Buoy and Plastic Buoy exhibited the lowest error rates; their consistent shapes helped minimize misclassifications despite occasional errors.
3.3. YOLOv10 False Positive Analysis
3.3.1. Bounding Box Label Accuracy by Class in YOLOv10
The bounding box label accuracy of the YOLOv10 model was calculated using the same method as that applied to RT-DETR, and the results are presented in Table 11. YOLOv10 detected a total of 629 objects, of which 291 were incorrectly labeled and thus considered misclassifications. Consequently, the overall detection accuracy was 53.74%. Although the mAP@0.5 value (0.957) for YOLOv10 was higher than that of RT-DETR in the quantitative performance evaluation, its detection accuracy decreased when applied to the same coastal environment.
Table 11.
Bounding box label accuracy by Class for YOLOv10.
The class-specific accuracy analysis showed that Styrofoam Buoy and Plastic Buoy achieved 100% detection accuracy, with all bounding boxes and labels assigned correctly. In contrast, Metal and Glass had an accuracy of 0%, indicating that, similar to RT-DETR, these classes were effectively undetectable in this coastal environment.
3.3.2. Ground Truth-Based False Positive Evaluation in YOLOv10
Based on the detection accuracy evaluation of the YOLOv10 model, a comparative analysis with the ground truth was conducted for the 291 objects identified as misclassifications. The false positive analysis results are presented in Table 12. Among these false positives, 36 objects (12.37%) belonged to classes absent from the training dataset, while the remaining 255 objects (87.63%) were misclassifications within trained classes. Notably, 77.32% of ground-truth Styrofoam Buoy were misclassified into other classes. In addition, small proportions of false positives occurred in Plastic Buoy, Plastic ETC, Styrofoam Piece, Wood, and Rock. These findings indicate that YOLOv10 exhibits a low frequency of detections for untrained objects, while misclassifications within trained classes tend to be concentrated in specific categories.
Table 12.
Ground Truth-Based false positive ratio for YOLOv10.
3.3.3. False Positive-Based Error Analysis in YOLOv10
To analyze the causes of false positives in the YOLOv10 model, false positive objects were compared with their ground truth labels. The counts and proportions of each object type are presented in Table 13, and the class-to-class heat map is shown in Figure 5.
Table 13.
False positive counts by predicted class vs. ground-truth class (YOLOv10).
Figure 5.
Heat-map for Predicted Class and Ground Truth Class for YOLOv10.
The heat map analysis revealed that the object pairs most frequently involved in false positives were ‘Metal–Plastic ETC’, ‘Plastic ETC–Styrofoam Piece’, ‘Rope–Wood’, and ‘Styrofoam Piece–Styrofoam Buoy’.
At the class level, the most frequent false positives occurred in Styrofoam Piece, PET Bottle, Plastic ETC, Metal, Rope, and Glass, in descending order. Notably, 227 out of 291 false positives (78.01%) involved Styrofoam Piece, primarily due to confusion with Styrofoam Buoy identified in the ground truth-based analysis. The YOLOv10 model frequently misclassified Styrofoam Buoy as Styrofoam Piece. Both classes are composed of white polystyrene, share similar optical properties, and lack distinguishing features other than size and shape, which led to confusion.
The next highest false positive rate was observed for PET Bottle, which was frequently confused with Plastic ETC, Styrofoam Buoy, Wood, Rock, Plastic Bag (transparent), and Plastic Bag (white). Similarly to RT-DETR, these misclassifications were attributed to similarities in material and shape. For Plastic ETC, most errors occurred when Styrofoam Piece was misclassified as Plastic ETC, likely due to irregular shapes and variable colors that made the two classes appear similar.
4. Discussion
In this study, two deep learning models, RT-DETR and YOLOv10, trained on a publicly available coastal debris dataset, were applied to UAV images collected from an actual beach to analyze false positive cases and their underlying causes under field-based conditions.
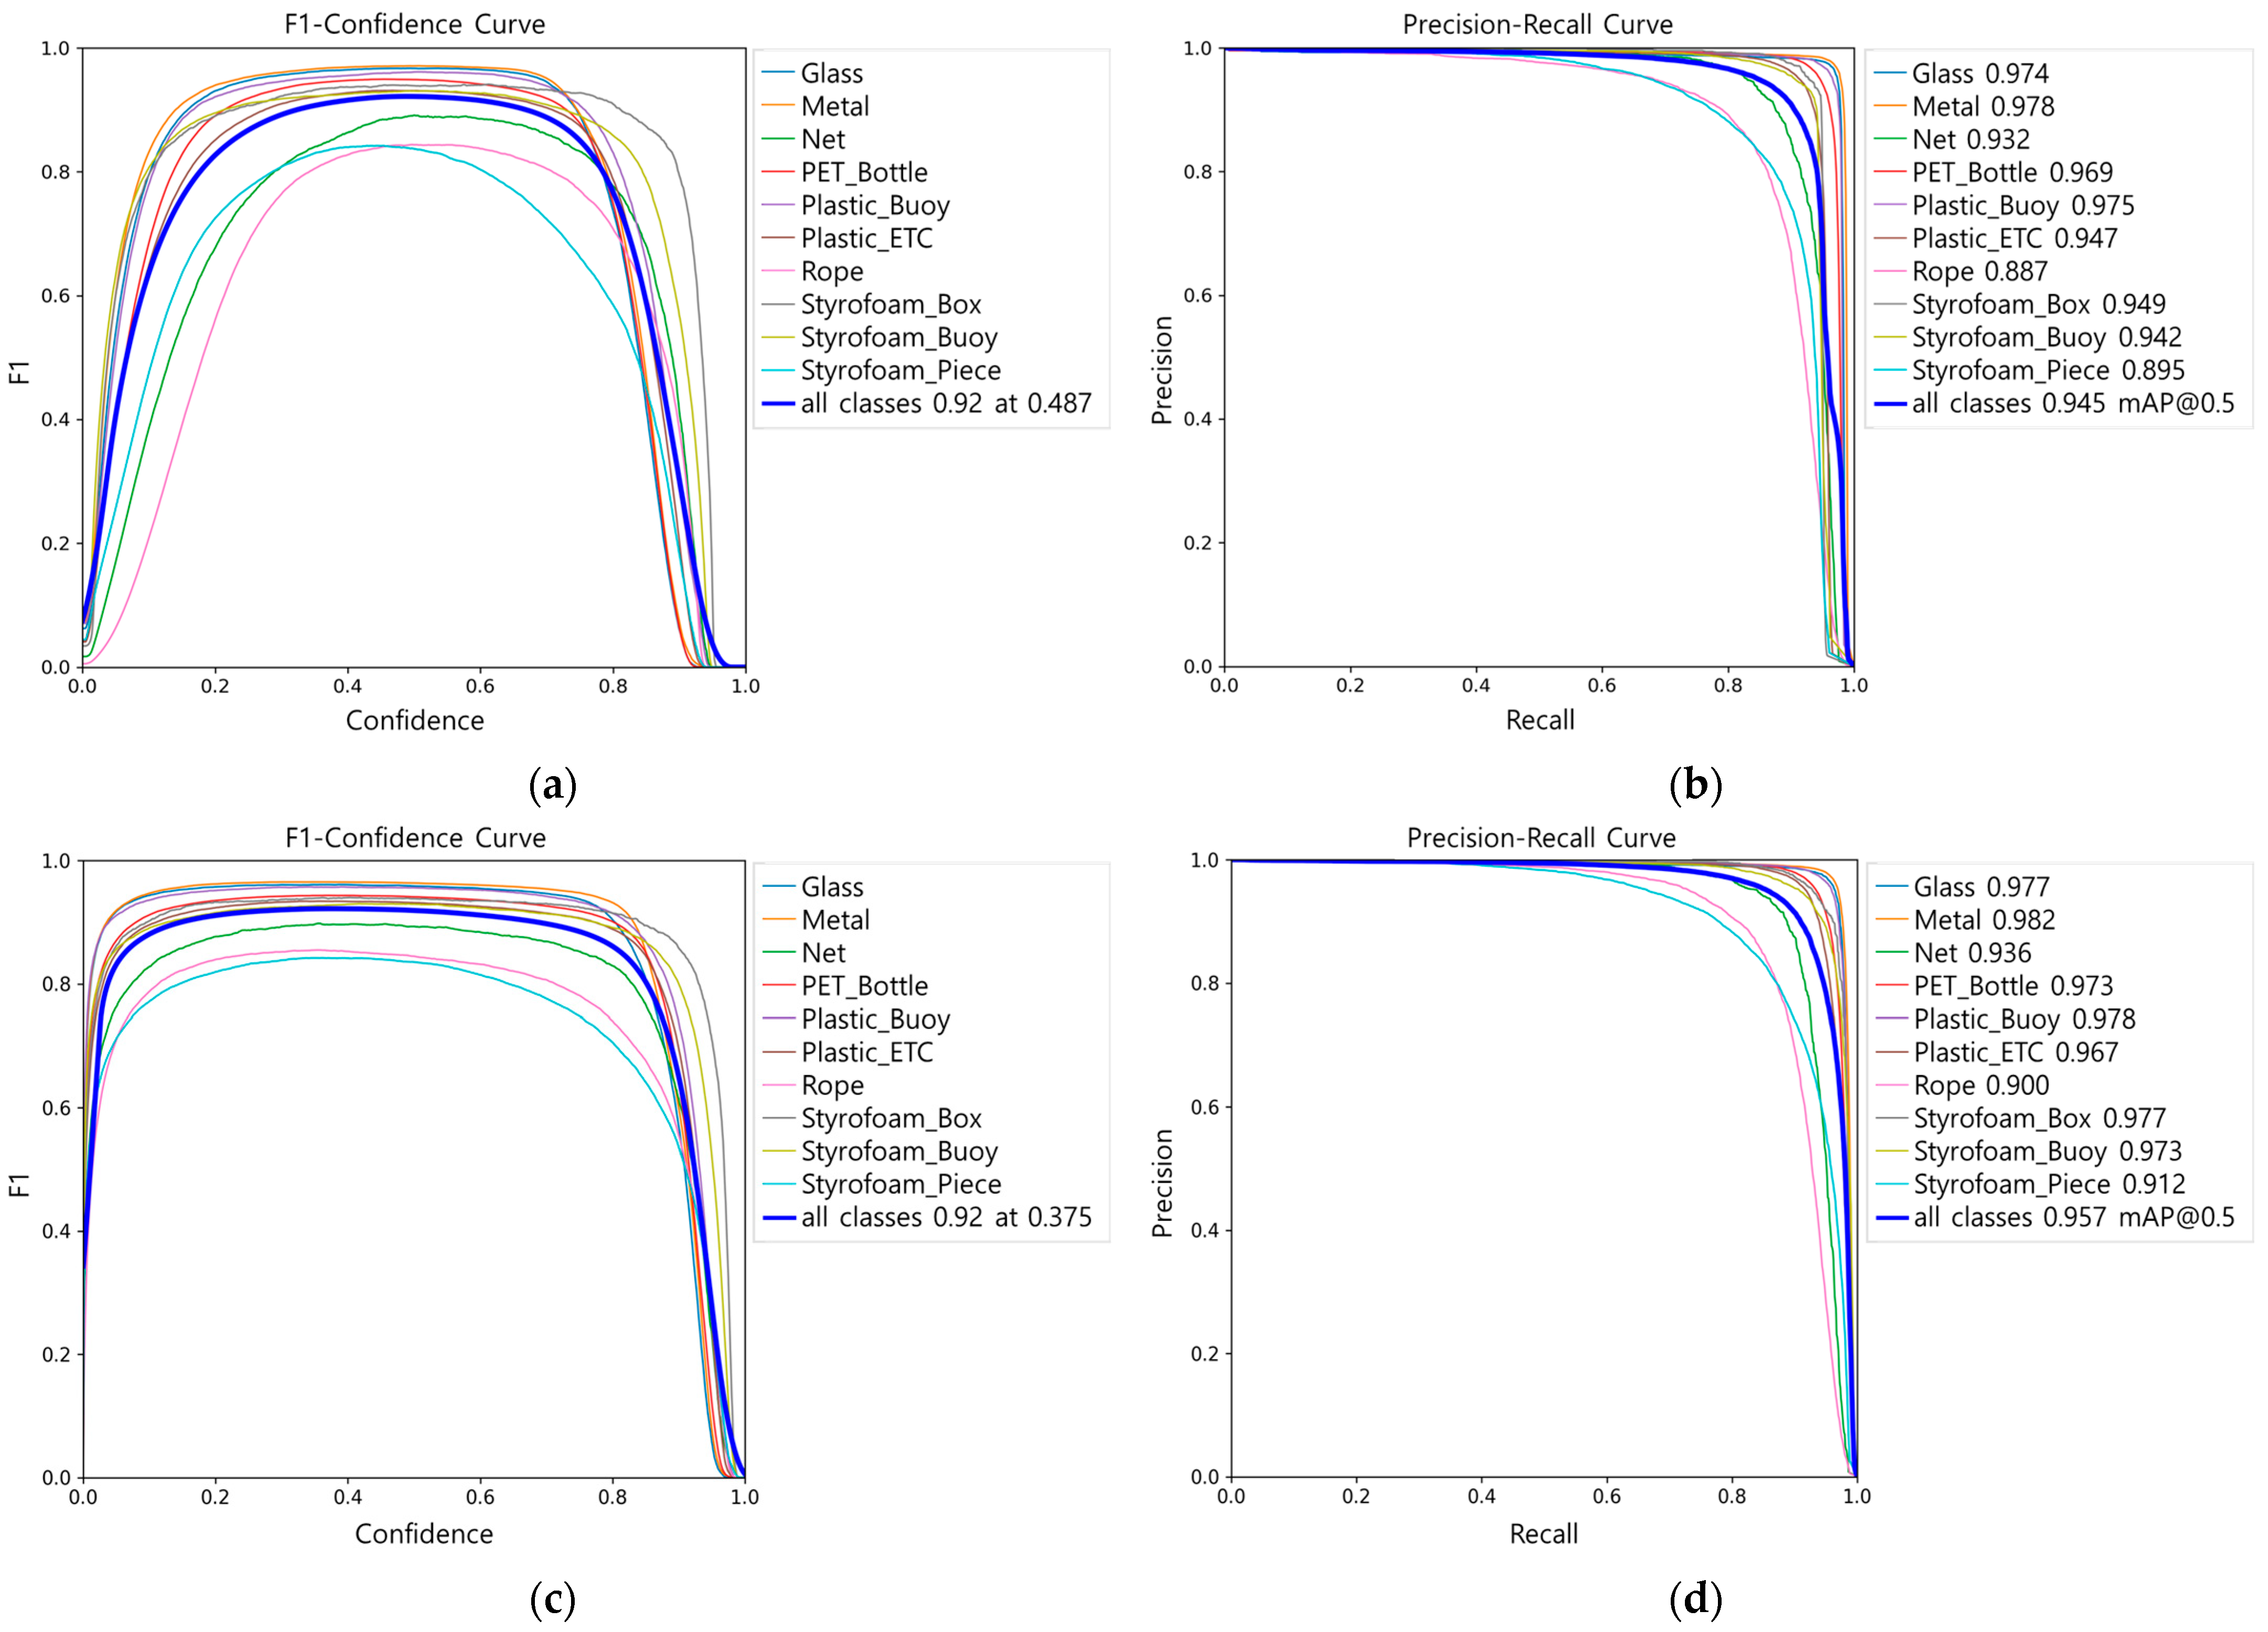
Both models achieved high performance in terms of mAP (0.945 and 0.957, respectively). However, when applied to field data, the bounding box label accuracy (Figure 6) showed similar trends between the two models, except for Styrofoam Piece and Net. In particular, both models exhibited near-zero accuracy for the Metal and Glass classes, making practical identification virtually impossible, whereas buoy-type objects with high structural integrity, such as Styrofoam Buoy and Plastic Buoy, were consistently detected with high accuracy. Nevertheless, overall bounding box label accuracy differed significantly between the two models, with RT-DETR achieving 80.18% and YOLOv10 53.74%. Furthermore, class-specific false positive ratios and the ground truth distributions of misclassified objects revealed clear differences in the false positive tendencies of the two models.
Figure 6.
Comparison of bounding box label accuracy trends between RT-DETR and YOLOv10.
The class-specific false positive analysis showed that 69.38% of false positives in RT-DETR originated from untrained classes, whereas 87.63% of YOLOv10 false positives occurred within trained classes. This indicates that both models were vulnerable to objects with similar material, shape, and color. RT-DETR exhibited a tendency toward overgeneralization by labeling untrained objects as similar classes, while YOLOv10 showed higher intra-class confusion in unstable fragment-type objects. These differences were attributed to their background processing mechanisms.
The Transformer-based RT-DETR detects objects by matching object queries with image features, and unmatched queries are automatically classified as “no object (background)”, allowing the model to learn background representations. This process involves global context integration, enabling the model to comprehensively consider color, shape, and background information across the entire image. By contrast, the CNN-based YOLOv10 employs a dense grid-based one-stage head architecture that directly predicts bounding boxes and class probabilities at each feature map location. During training, only locations spatially close to the ground truth are selected as positive samples, while the rest are excluded, meaning that YOLOv10 does not directly learn background representations. Consequently, RT-DETR assigned labels not only to objects on trained backgrounds (e.g., sand) but also to untrained objects such as wood, seaweed, and rocks, leading to higher false positive ratios in untrained classes. In contrast, YOLOv10 exhibited higher false positive ratios within trained classes, while detections of untrained objects were limited.
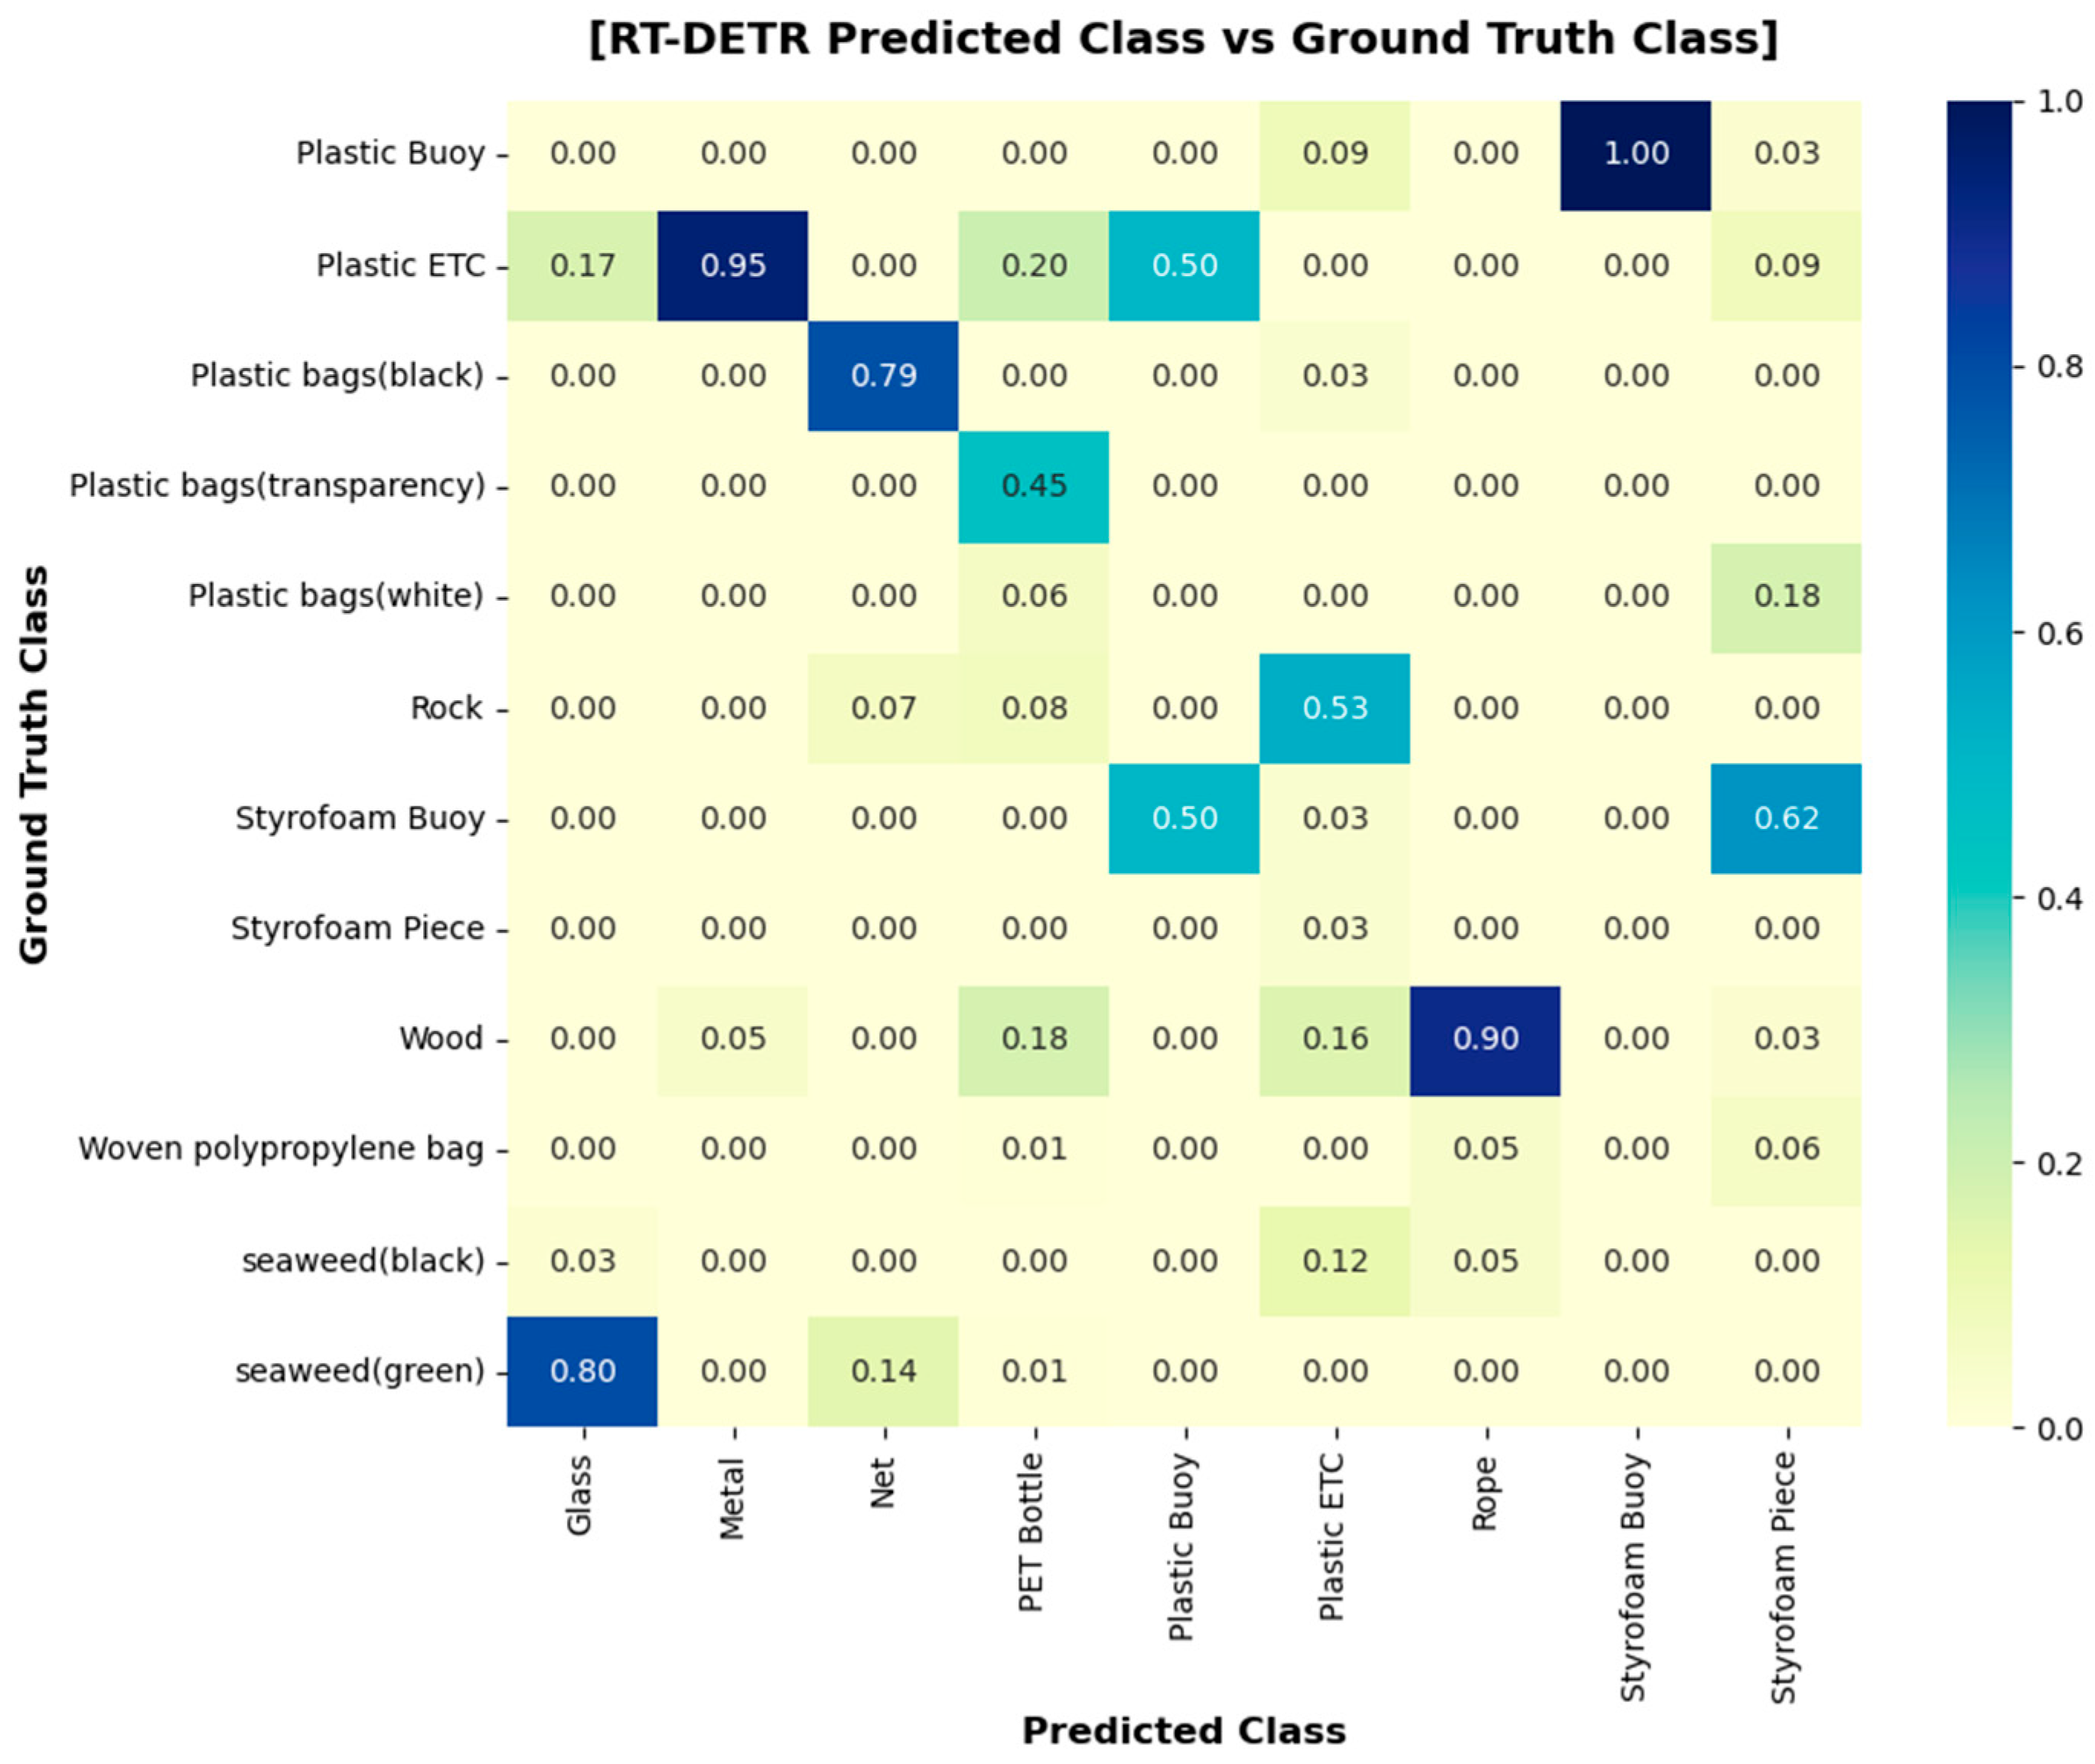
In the heat map comparing ground truth and false positives, the most frequent misclassification in RT-DETR was “Unknown Plastic” → “Plastic Bottle” (22.4%), while in YOLOv10 it was “Styrofoam Piece” → “Styrofoam Buoy” (18.7%). The high false positive rate for Styrofoam Piece in YOLOv10 can be explained by the fact that most of its training data consisted of low-altitude images with clearer feature distinctions, whereas in this study the field images were captured at 10 m altitude, making material and feature identification more difficult. Moreover, because the UAV survey was conducted at 14:00 under strong sunlight, specular reflections on Styrofoam surfaces further limited material differentiation and contributed to misclassification. PET Bottles, which showed high false positive rates in both models, were well represented in the training dataset but were mainly trained on intact forms. Thus, damaged PET bottles or other objects with similar shapes and materials were not accurately detected. Metal and Glass had relatively low representation in the training dataset and were primarily trained on intact cans and unbroken green or black bottles, resulting in very low detection accuracy for both models (RT-DETR: 0%, 2.44%; YOLOv10: 0%).
Based on these results, the mismatch between training and field data was found to significantly affect model performance due to (1) dataset bias and (2) differences in object characteristics between training images and field conditions. In the training dataset, class imbalance was evident, with Metal accounting for 16.57% and Glass for 6.9%, and the labeling criteria were narrow, focusing mainly on cans for Metal and on green and black bottles for Glass. In contrast, unmanaged coastal environments are characterized by frequent object damage and occlusion in UAV images, as well as contamination and discoloration that alter visible object properties. Consequently, even with high mAP during training, field applicability becomes substantially limited if class diversity, object shape, distribution, and degradation spectra are not adequately represented. Moreover, this study confirmed the importance of optimizing UAV survey conditions, such as conducting flights after 15:00 when sunlight intensity is reduced, or adjusting camera aperture and brightness settings to minimize the effects of specular reflection. Therefore, mAP alone is insufficient for model comparison, and it is more appropriate to evaluate models in conjunction with class balance, field-specific characteristics, and acquisition conditions.
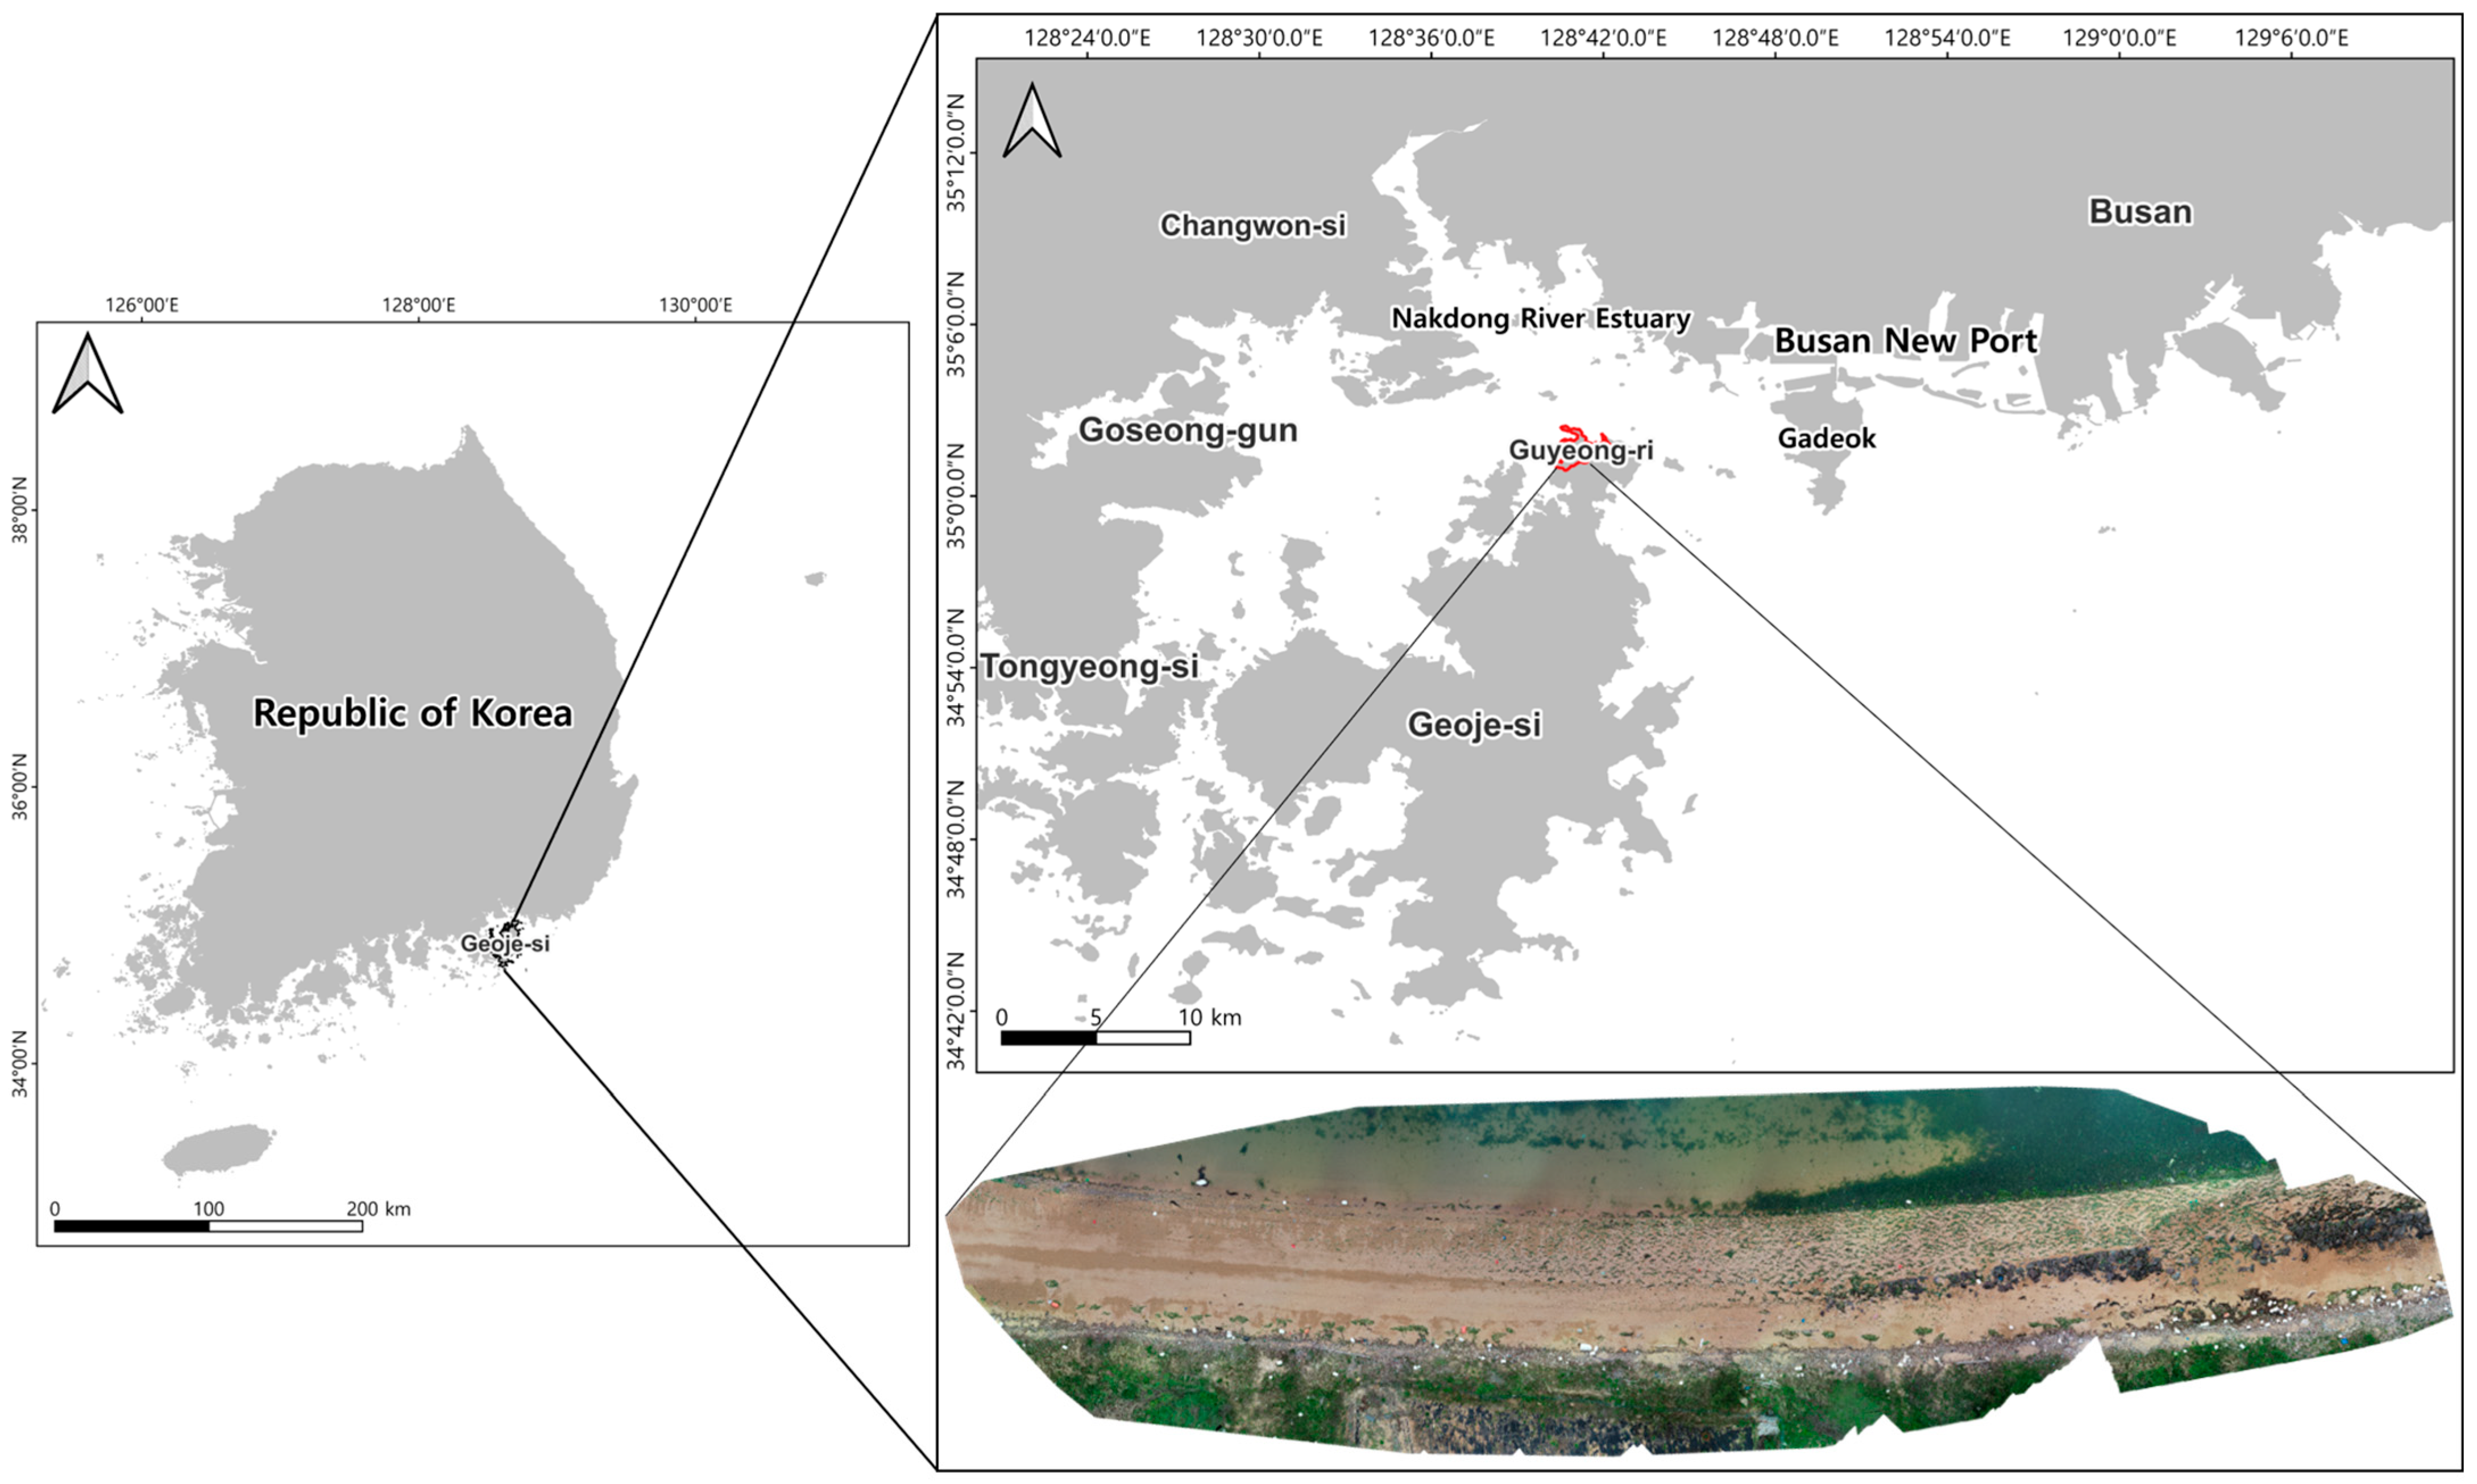
For UAV-based coastal debris monitoring, this study confirmed that it is not necessary to use UAVs equipped with high-end sensors; UAVs with cameras capable of capturing images at GSD 0.25–0.3 cm/px, such as those used in this study (GSD 0.27 cm/px), are sufficient for field surveys. For the study site, approximately 100 m of coastline was surveyed in 19 min and 41 s. To ensure efficient detection following image acquisition, GPU-based hardware is essential for training on large-scale datasets and for running inference. Even when the lightweight mode was enabled, RT-DETR required approximately 76.8 ms per image, about 4.6 times slower than YOLOv10 (16.7 ms). This result highlights that high-performance GPU hardware enables more efficient detection outcomes. From UAV acquisition to final detection results, the entire process required approximately one day. Although there was no substantial difference in the overall time depending on the model, appropriate model selection and application remain crucial depending on beach characteristics.
In summary, RT-DETR, with its strengths in detecting small fragments, damaged objects, and untrained classes, is more suitable for detailed monitoring and estimation of debris distribution and quantities in unmanaged beaches where high accuracy is required, although it demands higher computational resources and may increase deployment costs. By contrast, YOLOv10, which demonstrated high accuracy for structurally intact objects, is more suitable for rapid large-scale monitoring of managed beaches, owing to its higher computational efficiency and real-time processing capability on lower-spec hardware. Therefore, UAV-based coastal debris monitoring requires consideration not only of model performance but also of UAV operational costs, data processing infrastructure, and real-time field requirements. These findings provide practical guidance for designing coastal debris monitoring systems that balance detection accuracy, cost-efficiency, hardware requirements, and real-time applicability.
5. Conclusions
In this study, the RT-DETR and YOLOv10 models were trained on the same dataset and evaluated on an unmanaged beach. The goal was to quantitatively and qualitatively assess, at the class level, the differences between the standard performance metric (mAP) and the field-based metric (bounding box label accuracy). Although both models achieved similar mAP@0.5 values (0.945 for RT-DETR and 0.957 for YOLOv10), their field accuracies differed significantly, with RT-DETR achieving 80.18% and YOLOv10 53.74%. Both models exhibited near-zero accuracy for the Metal and Glass classes, indicating a failure in detection, whereas they consistently detected buoy-type objects with high structural integrity, such as Styrofoam Buoy and Plastic Buoy. The causes were identified as class imbalance, label bias, and variations in object appearance and visibility due to degradation, occlusion, and optical changes in field conditions. False positive patterns also differed: RT-DETR showed a tendency to overgeneralize untrained objects, while YOLOv10 frequently misclassified fragments and buoys within trained classes.
From these findings, the following practical implications can be drawn. First, model selection should be based not only on mAP but also on field conditions, the priority of the classes to be analyzed, and coastal characteristics. RT-DETR is advantageous for estimating debris loads and conducting large-scale screening in unmanaged beaches where damage and occlusion are frequent, whereas YOLOv10 is more suitable for precise monitoring and detection of specific classes in managed beaches with well-preserved object shapes. Second, to improve detection success rates across all classes, it is essential to ensure quantitative balance in the training dataset and to expand the label spectrum (e.g., color, shape). If this is not feasible, corrective measures such as data augmentation should be applied. Third, model performance should be evaluated by presenting class-specific accuracies together with false positive cause analyses to minimize the risk of overgeneralization in real-world applications.
This study has limitations in that it was conducted at a single beach, with restricted label distribution for certain classes, and lacked three-dimensional information such as object height and volume, which may cause the same type of debris to be perceived differently depending on the shooting angle or shadows. Future research should quantitatively expand the generalizability of the results by improving the quality of training data labels, statistically validating detection performance under various field conditions, and incorporating diverse coastal environmental characteristics. In addition, securing sufficiently balanced training data across classes, improving UAV imaging techniques through the use of multispectral sensors, and employing models that account for 3D object information will help to overcome the limitations of field conditions. By applying field data from diverse coastal areas to construct correction matrices between training and field datasets, it will be possible to estimate the total amount of coastal debris in Korea and establish a standardized coastal debris monitoring system based on statistically validated results.
Author Contributions
Conceptualization, Y.-B.D., B.-R.K. and T.-H.K.; methodology, Y.-B.D. and T.-H.K.; software, Y.-B.D.; validation, B.-R.K., J.-S.L. and T.-H.K.; formal analysis, Y.-B.D.; investigation, Y.-B.D. and B.-R.K.; resources, T.-H.K.; data curation, Y.-B.D.; writing—original draft preparation, Y.-B.D. and T.-H.K.; writing—review and editing, Y.-B.D., B.-R.K., J.-S.L. and T.-H.K.; visualization, Y.-B.D.; supervision, T.-H.K.; project administration, T.-H.K.; funding acquisition, T.-H.K. All authors have read and agreed to the published version of the manuscript.
Funding
This study was supported by the grant “Development of technology for impact assessment of plastic debris on marine ecosystem” from the Korea Institute of Ocean Science and Technology (PEA0114).
Data Availability Statement
The dataset generated and/or analyzed during the current study is available from the AI-Hub (https://www.aihub.or.kr/, accessed on 10 November 2024) under the name of ‘Coastal Debris’. The raw data obtained from the UAVs are not publicly available but can be provided by the corresponding author upon reasonable request.
Conflicts of Interest
The authors declare no conflicts of interest.
Abbreviations
The following abbreviations are used in this manuscript:
| NOAA | The National Oceanic and Atmospheric Administration |
| MDMAP | Marine Debris Monitoring and Assessment Project |
| UAVs | Unmanned Aerial Vehicles |
| GSD | Ground Sampling Distance |
| PAN | Path Aggregation Network |
| NMS | Non-Maximum Suppression |
| TP | True Positive |
| TN | True Negative |
| FP | False Positive |
| FN | False Negative |
| PR-curve | Precision–Recall Curve |
References
- NOAA Marine Debris Program. International Collaboration. 2025. Available online: https://marinedebris.noaa.gov/our-work/international-collaboration (accessed on 18 August 2025).
- The Plastic Pandemic: COVID-19 Trashed the Recycling Dream. Available online: https://www.reuters.com/investigates/special-report/health-coronavirus-plastic-recycling/ (accessed on 18 August 2025).
- Peng, Y.; Wu, P.; Schartup, A.T.; Zhang, Y. Plastic Waste Release Caused by COVID-19 and Its Fate in the Global Ocean. Proc. Natl. Acad. Sci. USA 2021, 118, e2111530118. [Google Scholar] [CrossRef] [PubMed]
- Marine Debris Monitoring and Assessment Project|Marine Debris Program. Available online: https://marinedebris.noaa.gov/our-work/monitoring/marine-debris-monitoring-and-assessment-project (accessed on 18 August 2025).
- OSPAR Commission. Guideline for Monitoring Marine Litter on the Beaches in the OSPAR Maritime Area. Edition 1.0; OSPAR Commission: London, UK, 2010; ISBN 90-3631-973-9. Available online: https://repository.oceanbestpractices.org/handle/11329/1466?ref=blog.indecol.no (accessed on 18 August 2025).
- OSEAN (Our Sea of East Asia Network). Ocean Knights Recruitment and Manual; OSEAN: Incheon, Republic of Korea, 2021; Available online: https://cafe.naver.com/oceanknights (accessed on 18 August 2025).
- Gautam, D.; Mawardi, Z.; Elliott, L.; Loewensteiner, D.; Whiteside, T.; Brooks, S. Detection of Invasive Species (Siam Weed) Using Drone-Based Imaging and YOLO Deep Learning Model. Remote Sens. 2025, 17, 120. [Google Scholar] [CrossRef]
- Hong, S.-M.; Kim, H.-S.; Kang, C.-H.; Kim, S.-Y. Analysis of Crack Detection Performance According to Detection Distance and Viewing Angle Variations. J. Inst. Control. Robot. Syst. 2025, 31, 818–824. [Google Scholar] [CrossRef]
- Yang, M.-D.; Tseng, H.-H.; Hsu, Y.-C.; Yang, C.-Y.; Lai, M.-H.; Wu, D.-H. A UAV Open Dataset of Rice Paddies for Deep Learning Practice. Remote Sens. 2021, 13, 1358. [Google Scholar] [CrossRef]
- Takaya, K.; Shibata, A.; Mizuno, Y.; Ise, T. Unmanned Aerial Vehicles and Deep Learning for Assessment of Anthropogenic Marine Debris on Beaches on an Island in a Semi-Enclosed Sea in Japan. Environ. Res. Commun. 2022, 4, 015003. [Google Scholar] [CrossRef]
- Pfeiffer, R.; Valentino, G.; D’Amico, S.; Piroddi, L.; Galone, L.; Calleja, S.; Farrugia, R.A.; Colica, E. Use of UAVs and Deep Learning for Beach Litter Monitoring. Electronics 2022, 12, 198. [Google Scholar] [CrossRef]
- Ma, J.; Zhou, Y.; Zhou, Z.; Zhang, Y.; He, L. Toward Smart Ocean Monitoring: Real-Time Detection of Marine Litter Using YOLOv12 in Support of Pollution Mitigation. Mar. Pollut. Bull. 2025, 217, 118136. [Google Scholar] [CrossRef] [PubMed]
- Kako, S.; Morita, S.; Taneda, T. Estimation of Plastic Marine Debris Volumes on Beaches Using Unmanned Aerial Vehicles and Image Processing Based on Deep Learning. Mar. Pollut. Bull. 2020, 155, 111127. [Google Scholar] [CrossRef] [PubMed]
- Merlino, S.; Paterni, M.; Berton, A.; Massetti, L. Unmanned Aerial Vehicles for Debris Survey in Coastal Areas: Long-Term Monitoring Programme to Study Spatial and Temporal Accumulation of the Dynamics of Beached Marine Litter. Remote Sens. 2020, 12, 1260. [Google Scholar] [CrossRef]
- Martin, C.; Parkes, S.; Zhang, Q.; Zhang, X.; McCabe, M.F.; Duarte, C.M. Use of Unmanned Aerial Vehicles for Efficient Beach Litter Monitoring. Mar. Pollut. Bull. 2018, 131, 662–673. [Google Scholar] [CrossRef] [PubMed]
- National Information Society Agency (NIA). Data Construction Guideline; NIA: Daegu, Republic of Korea, 2022. Available online: https://www.nia.or.kr (accessed on 18 August 2025).
- Shen, A.; Zhu, Y.; Angelov, P.; Jiang, R. Marine Debris Detection in Satellite Surveillance Using Attention Mechanisms. IEEE J. Sel. Top. Appl. Earth Obs. Remote Sens. 2024, 17, 4320–4330. [Google Scholar] [CrossRef]
- Jiang, W.; Yang, L.; Bu, Y. Research on the Identification and Classification of Marine Debris Based on Improved YOLOv8. JMSE 2024, 12, 1748. [Google Scholar] [CrossRef]
- Bak, S.; Kim, H.-M.; Kim, Y.; Lee, I.; Park, M.; Oh, S.; Kim, T.-Y.; Jang, S.W. Applicability Evaluation of Deep Learning-Based Object Detection for Coastal Debris Monitoring: A Comparative Study of YOLOv8 and RT-DETR. Korean J. Remote Sens. 2023, 39, 1195–1210. [Google Scholar] [CrossRef]
- Zhao, Y.; Lv, W.; Xu, S.; Wei, J.; Wang, G.; Dang, Q.; Liu, Y.; Chen, J. DETRs Beat YOLOs on Real-Time Object Detection. arXiv 2024, arXiv:2304.08069. [Google Scholar] [CrossRef]
- Ultralytics RT-DETR (Realtime Detection Transformer). Available online: https://docs.ultralytics.com/models/rtdetr (accessed on 18 August 2025).
- Wang, A.; Chen, H.; Liu, L.; Chen, K.; Lin, Z.; Han, J.; Ding, G. YOLOv10: Real-Time End-to-End Object Detection. arXiv 2024, arXiv:2405.14458. [Google Scholar]
- GeeksforGeeks. Understanding the Confusion Matrix in Machine Learning. Available online: https://www.geeksforgeeks.org/machine-learning/confusion-matrix-machine-learning/ (accessed on 18 August 2025).
Disclaimer/Publisher’s Note: The statements, opinions and data contained in all publications are solely those of the individual author(s) and contributor(s) and not of MDPI and/or the editor(s). MDPI and/or the editor(s) disclaim responsibility for any injury to people or property resulting from any ideas, methods, instructions or products referred to in the content. |
© 2025 by the authors. Licensee MDPI, Basel, Switzerland. This article is an open access article distributed under the terms and conditions of the Creative Commons Attribution (CC BY) license (https://creativecommons.org/licenses/by/4.0/).


