Abstract
In the feature identification of maritime VHF radio communication signals, shipborne VHF communication technology follows the same international technical standards formulated by IMO, uses analog communication technology and uses the same communication channel in the same area, and cannot effectively achieve signal feature identification by adding feature elements in the process of signal modulation. How to effectively identify the ship using VHF radio has always been a technical difficulty in the field of ship perception. In this paper, based on the convolutional neural network, combined with the feasibility of CAM feature extraction and BiLSTM feature extraction in non-cooperative signal recognition, a deep learning recognition model of shipborne VHF radio communication signals is established, and the deep learning approach is employed to discern the features of VHF signals, thereby accomplishing the identification and classification of transmitting VHF radio stations. Several experiments are designed according to the characteristics of ship communication scenes at sea. The experimental data show that the method proposed in this paper can provide a new feasible path for ship target perception in terms of radio signal characteristics and identification.
1. Introduction
The development of intelligent ships promotes innovation in the field of ship sensing technology, with maritime radio signal sensing emerging as a new research direction []. Ship navigation and maritime traffic management rely heavily on various radio signals, among which ship-borne Very High Frequency (VHF) Radios are most commonly used for navigation and traffic control purposes []. However, due to the utilization of analog communication technology in maritime VHF communication and the requirement for ships sailing in the same area to use a shared public channel for interactive communication, effectively identifying ships using VHF radios has always been a technical challenge within the realm of ship perception []. Ensuring accurate target identification during VHF radio communications is not only crucial for enabling autonomous driving and intelligent collision avoidance in intelligent ships but also essential for efficient water traffic management. The realization of this technology can significantly advance practical applications in intelligent ship development while simultaneously enhancing water traffic safety [,].
The identification of VHF radio falls under the domain of Specific Emitter Identification (SEI), which is an effective technique employed for identifying and locating sources of radio emissions in wireless communication networks. The SEI primarily emphasizes military scenarios, specifically the identification and classification of radar signal sources. The identification of the signal source is accomplished through statistical analysis of fundamental measurable parameters of the radar signal, such as radio frequency, amplitude, pulse width, or pulse repetition interval. Currently, hierarchical data clustering-based classification utilizing specific attributes serves as the primary technical approach for radar signal source identification [,]. However, there is still room for improvement in classifying identical types of radar emission sources [].
The propagation objectives of wireless communication signals differ significantly from those of radar signals. Traditional radio signal classification primarily relies on the modulation characteristics of radio signals []. However, the likelihood-based (LB) and feature-based (FB) methods [] require a prior design of feature symbols in the signal modulation process, which poses challenges for non-cooperative signals. The VHF voice communication at sea employs analog communication technology. However, in accordance with the international norms established by IMO, ships worldwide utilize shipboard VHF radio systems that adhere to identical technical standards and are verified by classification societies []. Unfortunately, these systems lack the capability to incorporate unique signal features during the modulation process for radio signal identification [], resulting in a typical non-cooperative signal of the same type.
With the advancement of artificial intelligence-related technologies, deep learning methods are employed to devise learning and training models for radio signal characteristics in specific frequency bands [], offering a novel technical pathway for perceiving and recognizing radio signals. The crux of utilizing deep learning techniques to identify radio signal features lies in establishing an effective mechanism for feature recognition []. Due to the operational mode of shipborne VHF radios, it is not feasible to construct a feature recognition model through supervised learning with prior information []. In practical maritime VHF voice communication, factors that can impact signal generation primarily stem from the radio frequency (RF) hardware structure of shipborne VHF radio stations on diverse vessels, the installation and operational environment within the equipment’s location onboard ships, as well as the transmission environment from the feeder line to the antenna termination point []. These factors contribute to distinct individual characteristics even when VHF radio signals employ identical modulation modes.
The current radio signal feature recognition methods can be roughly divided into three categories. The first one is based on basic machine learning methods, which usually use classical machine learning algorithms such as support vector machine and decision tree to extract signal features and classify them. Niranjan, R. et al. developed a decision tree algorithm based on time-domain digital technology for real-time recognition and classification of various radar intrapulse modulation signals []. To solve the problem of misjudgment and confusion in the feature recognition of classified signals, a three-layer optimization algorithm is proposed by Wang S, Wang Z et al. []. S. Guo, S. Akhtar, and others proposed three kinds of RF fingerprints for radar model recognition using support vector machine, decision tree, random forest, gradient lifting, and the MDA algorithm []. The utilization of basic machine learning techniques enables the recognition and classification of diverse wireless signal types, exhibiting a certain degree of universality. However, these methods possess a broad focus on features and necessitate an extensive amount of labeled data for effective model training and learning. In the context of feature recognition within signals sharing the same modulation scheme, employing various machine learning algorithms can enhance efficiency in this process. Nevertheless, there exists a potential risk of overfitting identification outcomes.
The second is based on a deep learning method, which mainly uses a deep neural network to learn complex signal feature representation, such as the convolutional neural network (CNN), recurrent neural network (RNN), etc. This method shows superior performance in tasks of object detection, recognition, and classification. Hao C, Dang X et al. proposed a symbol detection and modulation classification detector (SDMCD) based on a deep neural network (DNN) to complete the mixed signal detection [], but the parameter adjustment and optimization of the DNN model usually require some experience and expertise, and the maritime environment will also affect the performance and accuracy of the SDMCD model. Zhang J, Hu S proposed a digital signal modulation identification (DSMI) method suitable for orthogonal frequency division multiplexing (OFDM) under different multipath channels. This method can accurately detect the modulation characteristics rather than the channel characteristics to identify the modulation type, thereby reducing the amount of network training []. In the maritime VHF communication scenarios, the signal differences of the same modulation mode are mainly formed by the equipment environment and channel environment, so this kind of method lacks common attention to the signal and channel. Kim H, Kim Y-J, et al. proposed a deep signal recognition network based on multi-task learning []. The proposed modulation recognition model by Zha Y and Wang H aims to enhance the accuracy of recognizing high-order digital modulation signals in low SNR conditions, thereby significantly improving their performance []. Huynh-The, T. et al. focused on the application of classical neural networks (such as CNN, RNN, and FFNN) in deep learning for modulation recognition; Zhang, X, Wang, Y. et al.’s research focuses on the review of data sets, signal representation methods, and deep learning-based methods in the field of modulation recognition []. Generally speaking, in the scenario of VHF signal recognition at sea, it is necessary to focus on the feature recognition under the same signal modulation mode, and to describe the features from the interaction of the signal itself and environmental variables on the basis of deep learning, so as to improve the feature recognition of VHF signals.
The third is to combine the traditional machine learning method with the deep learning method, and make the concerns of the recognition model have a certain characteristic by fusing different algorithms, so as to improve the accuracy and robustness of signal recognition. F. Liu, Z. Zhang et al. proposed a modulation recognition method based on feature extraction and deep learning algorithms, which achieves high recognition rates even under low signal-to-noise ratios []. H. Xiang, B. Chen et al. proposed a feature-to-feature learning phase enhancement method based on 1D CNN and 2D CNN to improve the accuracy of DOA estimation [], CNN can effectively extract the spatial features of signals from the marine environment, and can adapt to the complex changes of signals in various marine environments, but the large amount of computing resources and long training time in recognition enhancement may increase the limitations of this method in ship communication scenarios. Lu investigated a model that combines discrete wavelet transform and Extra Trees Classifier, and designed a model that combines continuous wavelet transform and CNN to perform individual identification, which requires a high computational cost and training time in terms of complexity and parameter tuning []. Tan, Y.; Jing, X. et al. adopted CNN to extract the features of the observed signals and built a new two-dimensional dataset of the received signals []. L. Zhang used the SCF-based dataset, combining the CNN denoising module and DNN-based classification design, H. Liu et al. can achieve better feature extraction and classification performance, thereby improving the signal recognition accuracy []. The combination of machine learning and deep learning can provide a more effective feature recognition model for signal recognition of specific targets, but it is also necessary to select appropriate methods for signal scene features to cope with computational complexity and training data demand.
In summary, numerous scholars have made significant advancements and progress in the field of signal modulation recognition. However, in the context of maritime VHF voice communication scenarios, it is crucial to fully consider the characteristics of maritime VHF signal recognition based on both signal modulation characteristics and the complex conditions present in ship communication scenarios, including factors such as waves, wind, and their impact on signal propagation. Therefore, this study initially aims to establish a fundamental feature recognition model for VHF voice communication signals in maritime scenarios using CNN methods. Subsequently, we attempt to incorporate Class Activation Mapping (CAM) and Bidirectional Long Short-Term Memory (BiLSTM) feature extraction algorithms. In the maritime scene specifically, CAM enables intuitive analysis of spatial dimension-based feature extraction by the model while BiLSTM effectively captures temporal evolution of signals as a timing model. This paper endeavors to combine CAM feature extraction with BiLSTM feature extraction to enhance the effectiveness of the basic model in identifying similar types and non-cooperative signal features. The contributions made by this paper primarily lie within the following aspects.
- According to the modulation and demodulation characteristics of shipborne VHF signals, the effects of white noise and multipath propagation on the characteristics of VHF signals are studied.
- Based on feature engineering and deep learning technology, a deep learning model for extracting the features of shipborne VHF radio signals is established by integrating the idea of a channel attention mechanism (ECANET), which can realize the recognition of different shipborne VHF radio signals.
- Combined with the application scenario characteristics of VHF voice communication at sea, five VHF radios with significant similarity characteristics are selected, and the verification experiment of the correlation between communication voice and signal recognition is designed to verify the effectiveness and accuracy of the proposed method.
The paper is organized as follows. Section 1 analyzes the current main methods and technical paths in radio signal feature recognition, and analyzes the rationality of the selected method in this paper. Section 2 introduces the mathematical principles of the model and method designed in this paper. Section 3 verifies the model and method used in this paper by experiments. Section 4 analyzes and discusses the experimental results. Section 5 is the conclusion of this paper.
2. Materials and Methods
2.1. General Framework
The model consists of three core parts, which are VHF signal analysis, model optimization, and output, as shown in Figure 1. In the initial stage of signal processing, the model measures and identifies the propagation characteristics of VHF signals in different channel environments and the unique features of their modulation modes. Subsequently, it is input into the model optimization module, based on the CNN architecture. The model combines CAM and BiLSTM feature extraction methods and ECANET technology to deeply learn the time and frequency characteristics of signals, extract signal features, and achieve the accurate identification of various complex signals through training and optimized network parameters. Finally, the model outputs the recognition result of the signal to complete the whole process and achieve the accurate recognition of the input radio signal.

Figure 1.
Overall framework.
2.2. VHF Signal Analysis
Signal identification for marine VHF is achieved by channel detection of marine VHF frequency band, which is able to collect and analyze the signals of the whole channel of marine VHF, and on this basis, extract the individual radio frequency fingerprint information of each module through feature engineering and deep learning; that is, by collecting and analyzing the characteristics of radio frequency signals. These characteristic parameters may include amplitude, phase, frequency, etc. of the signal. Due to the differences in the RF hardware and the influence of the communication environment, the radio signals received at the receiving end still have typical characteristics in the radio signals generated by the same modulation mode and RF hardware structure. By analyzing and comparing these characteristic parameters, the identity information can be determined. The RF fingerprint bound with the ship identity is constructed to distinguish the hardware differences of different shipborne VHF RF transmitting modules, and the identification and tracking of the shipborne VHF radio signal fingerprint are realized.
For communication emitters in practical application scenarios, the emitted RF signals need to be transmitted through the channel and demodulated before they can become available data sets. The modulation and demodulation part of the signal is to perform a certain operation on the original time domain signal to generate a signal of another frequency suitable for transmission in the channel; that is, to convert it into a form suitable for transmission, while the subsequent signal identification algorithm is to analyze the received signal. If there is an error or distortion in the modulation and demodulation process, the subsequent signal identification algorithm may be affected. As a result, the signal cannot be correctly identified or decoded, thus affecting the accuracy and reliability of identification. Therefore, after the acquisition equipment is used to complete the VHF signal acquisition, the signal demodulation processing should be carried out, and the analysis results should be stored in the database. The VHF signal received by any radio can be expressed as
where A is the signal amplitude, is the carrier angular frequency, and is the instantaneous phase:
Orthogonal decomposition of the signal, the in-phase branch, is multiplied by and the quadrature branch is multiplied by , and decimated and low-pass filtered to obtain the in-phase and quadrature components.
Performing an arctangent operation on the quadrature component and the in-phase component:
The modulated signal is then obtained by differencing the obtained phases and scaling them appropriately.
That is, the required original signal. Thus, the demodulation of the VHF signal is completed.
The quality of maritime VHF communication is affected by many factors, such as the harsh environment of the sea, the transmission loss of sea reflection, and the transmission loss of free space. Therefore, considering the change of signal-to-noise ratio and the fading characteristics of the channel, it is necessary to preprocess the received shipborne VHF signals.
Firstly, different levels of Gaussian white noise are introduced, which can simulate the noise interference in the real environment and enhance the robustness and reliability of the signal data. Then, the Rayleigh channel function operation is employed, which can optimize the transmission characteristics of the signal and make it more suitable for subsequent analysis, identification, or transmission tasks.
(1) White noise is a random signal with a constant power spectral density. Ideal white noise has infinite bandwidth, so its energy is infinite, which is impossible in the real world. In fact, if the spectral width of a noise process is much larger than the bandwidth of the system on which it acts, and its power spectral density is essentially constant in this bandwidth, then it can be treated as white noise.
The amplitude of Gaussian white noise is subject to Gaussian distribution, and the power spectral density is uniformly distributed. Because Gaussian white noise can reflect the noise situation in the actual communication channel, it can better simulate the unknown real noise [], and can be expressed by a specific mathematical expression, which is suitable for analyzing and calculating the anti-noise performance of the system.
Usually, the signal we obtain is discrete, and the power of the signal can be calculated directly.
With the signal power, if you want the signal-to-noise ratio (SNR) of the sample after adding the noise to be SNR, you can calculate the power of the noise from these two:
(2) Different from the wired channel whose transmission carrier is physical wire, the propagation environment of a shipborne VHF signal is more complex and changeable in the process of propagation on the radio channel. There are a lot of factors that affect the propagation of electromagnetic wave signals in the radio propagation environment, mainly the scatterers in the radio propagation environment, such as clouds, water, and so on. These factors restrict the transmission quality of electromagnetic wave signals. When the transmitted signal arrives at the receiver through different paths, the multipath propagation will lead to different time and direction, and the random amplitude and phase of different multipath components will cause the change of signal strength, resulting in small-scale fading and signal distortion, affecting the quality of communication. The propagation mode of electromagnetic waves in the radio propagation environment is shown in Figure 2:
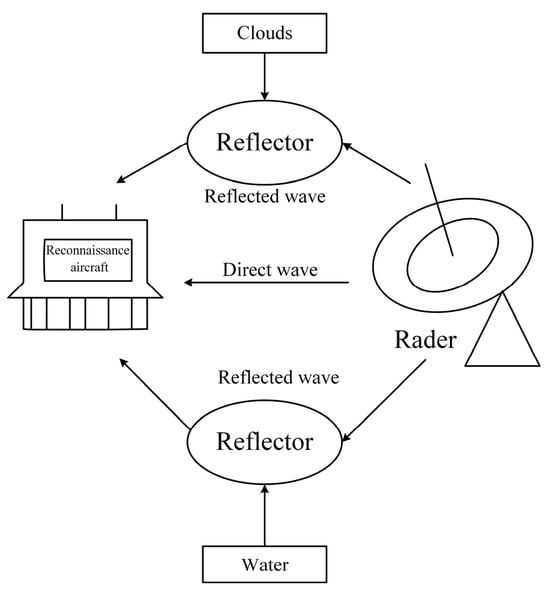
Figure 2.
Signal Propagation Diagram.
Therefore, in the research of radio communication, the primary task is to model the channel. Considering the influence of Doppler frequency shift caused by the relative movement of the transmitter and receiver on the channel in the actual situation of maritime communication, statistical modeling is more suitable for outdoor channels. The Clarke model is a commonly used radio channel model, which is suitable for the scenario of slow mobile speed. The amplitude distribution and phase distribution are random and meet the Gaussian distribution. Due to the wide applicability of the Clarke model, the Clarke model can better simulate the channel characteristics in the complex maritime communication environment with high computational efficiency. The Clarke model can be used as a statistical modeling of the Rayleigh channel.
Assuming that the multipath scattering components of the signal are uniformly distributed and the average power of the signal in each path is the same, the in-phase and quadrature components of the channel are generated by two branches, respectively. Firstly, a complex Gaussian noise signal is generated on each branch of the model, and the two complex Gaussian noise signals are guaranteed to be independent of each other. These random signals are then shaped in the frequency domain by using a Doppler shaping filter to adapt to the variable environment of signal propagation. Subsequently, the two filtered signals are subjected to inverse Fourier transform as the in-phase component and the quadrature component of the received signal, respectively. Considering that the output of the Fourier transform is a real signal, the time domain signal of one of the branches needs to be rotated by 90 degrees to meet the requirement of orthogonal components. Finally, the two signals are superposed to obtain the output fading signal. The maximum Doppler frequency shift of the output signal is the bandwidth of the shaping filter, and the expression is
where is the number of propagation paths; is the attenuation coefficient; is the maximum Doppler shift; is the Doppler phase, which follows the uniform distribution of ; as approaches infinity, approaches a zero-mean complex Gaussian process, whose amplitude envelope follows the Rayleigh distribution according to the central limit theorem.
2.3. Foundation Model
CNN is a feed-forward neural network []. The application of CNN in signal recognition usually takes the original signal as the input, such as IQ signal, which is essentially a mapping from input to output, and can learn the mapping relationship between input and output [], without precise mathematical expression, and automatically extract features and classify them through the training process. The training process includes two phases: the first phase is the forward propagation phase, in which the input is gradually transformed into a higher-level feature representation through convolution, activation function, pooling, and other operations, as shown in the following formula. The purpose of forward propagation is to calculate the prediction result of the network and compare it with the true label to calculate the loss function, which is used to measure the gap between the prediction result and the true result.
Convolve to convolutional layers:
Convolutional layer to pooling layer:
Pooling layer to fully connected layer:
The second stage is the backpropagation stage, where the gradient of the parameters in each layer is calculated by the chain rule and the gradient descent algorithm is used to update the parameter values. In this way, the network fine-tunes the parameters according to the gradient of the loss function in each training iteration to gradually optimize the predictive power of the model.
Fully connected layer error:
Error propagation from fully connected layer to pooling layer:
Error propagation from pooling layer to convolution layer:
Error propagation between convolutional layer:
Gradient of model parameters:
When the signal is processed by the CNN, the convolutional layer automatically extracts features from the data. Through different filters, the convolution operation can capture the spatial correlation and characteristics of the signal, so that the input signal can be represented more abstractly after the convolution layer. These extracted features are then passed to the fully connected layer, which is responsible for learning a higher-level abstract representation of the signal and mapping it to the corresponding output category. Ultimately, the CNN outputs the recognition result to determine which category the input signal belongs to. This process realizes the end-to-end automatic recognition from the original signal to the final classification result, and realizes the automation and efficiency of signal recognition through machine learning. The model architecture of the CNN requires very little data preprocessing, so it is considered to be a robust deep learning method for the successful application of a truly multi-level network architecture []. This model can achieve or exceed the traditional classification method which relies on experts to extract features, and at the same time, because it does not need to extract features manually, the model has greater flexibility in expanding new signals.
2.4. Model Optimization
In this paper, an improved CNN model is used to recognize VHF signals, which combines CNN, CAM, and BiLSTM feature extraction technology, and incorporates the idea of a channel attention mechanism (ECANET) to enhance the adaptive learning ability of the network to the importance of channels. The depth feature extraction and fusion of VHF signal data are realized, and the basic structure of the model is shown in Figure 3.
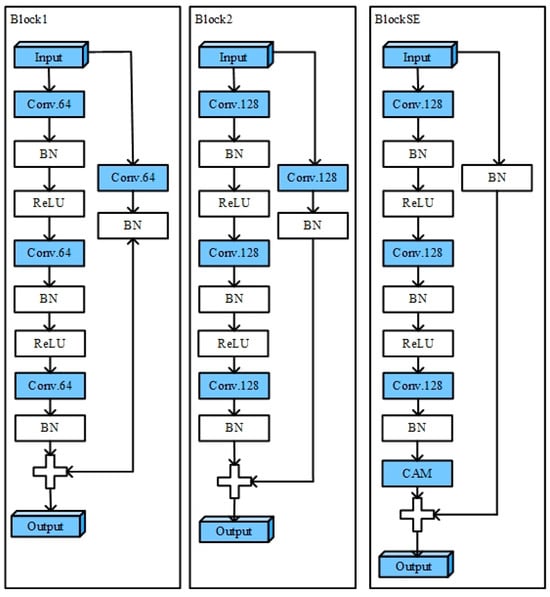
Figure 3.
Improved CNN Model Structure.
The diagram is divided into three main sections, each of which represents a different block, and each of which has a different hierarchy and operation. Each block starts with “Input” and then passes through multiple layers, ending up with “Output”. First, the Block1 part consists of three sequentially identical structures, each of which contains a convolution layer (CN), followed by a ReLU activation function and a batch normalization (BN) layer. After these three sets of operations, the output of Block1 is obtained. Block2 is similar to Block1, but with an increased number of convolution kernels per convolution layer. The input data in the BlockSE module first pass through several convolution layers (Conv), normalization layers (BN), and activation layers (ReLU), and finally through a channel attention mechanism layer (CAM), which can correlate the feature maps in the neural network with the classification results, thus helping to understand the classification basis of the network. The feature map is formed by multiplying and adding the parameters (weight matrix W) of the last fully connected layer and the final output feature map set; that is, the display model is based on which feature maps for decision classification. The extraction of CAM generally occurs in the convolution layer, especially in the last convolution layer.
CAM uses the principle of superposition of feature map weights to obtain the thermodynamic map, and the formula is as follows:
where A represents the size of the output of the last convolutional layer of the network, w represents the weight of the fully connected layer, and C is the category of classification.
Channel attention mechanism is a method used to enhance the neural network to learn feature representation between different channels, which can improve the effectiveness of feature representation by assigning different weights to different channels []. This mechanism has been widely used in Squeeze-and-Excitation Networks (SENet) and has been proved to significantly improve the performance of various computer vision tasks. In the traditional channel attention mechanism, the feature representation of different channels is usually adjusted by calculating the weight of each channel. Although this method can improve the network performance, it still has some limitations; for example, it may ignore the correlation between channels, resulting in information loss. This feedback connection allows the network to transfer information between different layers, so as to make better use of the correlation between channels. This feedback connection can help the network to better capture the dependence between specific channels, and improve the representation ability and generalization performance of the model. The improved CAM model is applied to the improved CNN model, as shown in Figure 4, which further improves the performance of the neural network in feature learning and representation.
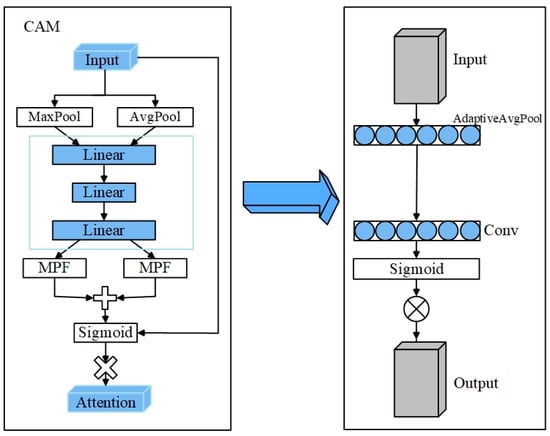
Figure 4.
Improvement of Channel Attention Mechanism.
BiLSTM is a long and short-term memory network (LSTM) with forward and backward connections []. BiLSTM processes the input through two independent LSTM layers, one in chronological order and the other in reverse chronological order, capturing the characteristics of the input sequence from the forward and reverse directions, respectively. Specifically, the forward LSTM processes the input sequence from left to right in time steps, and the hidden state and the cell state at each time step are calculated by the following formulas:
where and are the input gate, forget gate, output gate, and candidate state representing the current information, respectively, and and tanh are the Sigmoid and tanh functions, respectively. Similarly, the reverse LSTM processes the input sequence from right to left in time steps, and the hidden state and the unit state for each time step can be calculated by similar formulas. Eventually, the output of BiLSTM is stitched from the hidden states in both directions: .
Through CAM feature extraction, the model can associate the feature map with the classification results, which enhances the classification ability of VHF signals, while BiLSTM feature extraction helps to capture the temporal information in VHF signal data []. Ultimately, deep feature fusion enables the improved CNN model to understand VHF signal data more comprehensively, thus improving the accuracy and robustness of recognition and classification.
In the original model structure, the convolution kernel size of a fixed scale is used, which may lead to the model unable to effectively capture the features of different scales in the input data. In order to improve the capability of feature extraction and target recognition in different scales, the multi-scale convolution module is introduced to make the model consider the information of different scales at the same time, so that the model can better adapt to targets of different scales. A common multi-scale convolution method is to use convolution kernels of different sizes for parallel convolution operations, and then splice the resulting feature maps in the channel dimension. As shown in Figure 5, two convolution kernels can be used to convolute the input image at the same time, and then the resulting feature maps can be spliced in the channel dimension. Multi-scale convolution can help the model to extract features at different scales, thus improving the recognition ability of the model for targets at different scales. Therefore, EBlock1 and EBlock2 are used instead of Block1 and Block2 in the improved CNN model structure.
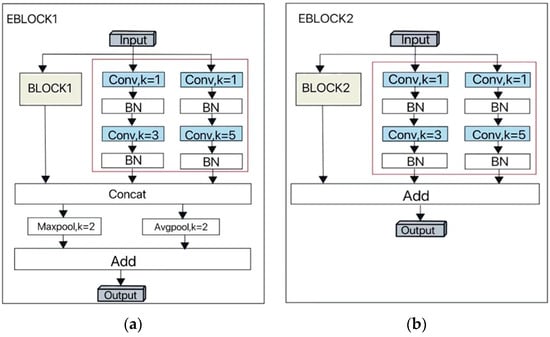
Figure 5.
Model Improvement: (a) improved EBLOCK1 module; (b) improved EBLOCK2 module.
3. Results
3.1. Experimental Design
3.1.1. Experimental Scenario
In this experiment, four groups of experiments are carried out to collect the VHF signals with the same audio and different frequencies from five VHF interphones in the indoor experimental point X and outdoor experimental point Y, and the signals are recognized by using the improved CNN model. Very high frequency (VHF) radio is used most frequently when the ship is sailing in the channel. The characteristics of a VHF signal propagation environment in the sea channel mainly include the shelter of ship superstructure, water environment, and different ship radio installation and application environments. The greater the difference of these environments, the greater the difference of signal characteristics. In order to better verify the feasibility of the method in this paper, in the design of the experimental scene, based on the simulation of the scene of ship communication in the channel, the impact of environment and equipment on signal characteristics is minimized. In the experimental scene of this paper, five hand-held VHF walkie-talkies of the same model and old and new degree are selected as VHF communication equipment. The straight-line distance between the transmitting point and the experimental point Y in the experimental scene is about 100 m, and there are some buildings and lakes in the transmission path. At the same time, the weather of the outdoor experimental point Y is overcast and rainy. The experimental scene environment can be matched with the environment of ship communication in the channel. The following analogy can be made in order to make experiments performed indoors reliable for use in the marine environment.
- 1.
- Signal propagation characteristic:
In the indoor environment, signal propagation is affected by buildings, walls, and other obstacles, which may lead to signal attenuation, multipath effect, and other problems. It can be analogized that in the marine environment, signal propagation will be affected by seawater, ships, and other objects, which may lead to problems such as seawater reflection and multipath propagation. At the same time, the multipath propagation model is introduced, and the signal propagation characteristics are studied in depth to better understand the signal propagation mechanism in the marine environment
- 2.
- Interference sources:
There may be interference signals from electrical equipment, radio networks, etc. In the indoor environment, this affects the quality of the received signal. In the marine environment, ships, radar, and other equipment may produce interference signals, which interfere with the identification of radio reception signals.
- 3.
- Weather conditions:
In the indoor environment, the weather conditions are stable and are not affected by meteorological factors. In the marine environment, weather conditions may change, such as wind and waves, rain, and snow, which affect signal transmission and reception. Therefore, an experiment is designed for comparison in the outdoor rainy environment of experimental point Y. The straight-line distance between point Y and the receiving equipment is about 100 m, and there are also problems such as multipath propagation and interference.
- 4.
- Equipment:
The experiment is to collect VHF signals of the same type and batch of new walkie-talkies in the same environment for identification, and the difference between equipment and environment is very small. Considering the complexity and uncertainty of the marine environment, it is expected that in the marine environment, with different batches of equipment and VHF signals in different environments, the recognition rate of the experimental method may be further improved, which further verifies the feasibility of the experiment.
The purpose of the experiment is to verify the feasibility of the proposed method of feature identification and VHF radio classification. According to the analysis, the signal differences of ship-borne VHF radio are mainly reflected in the frequency domain (modulation) and time domain (propagation environment), in which the environmental impact and ship motion can increase the difference of signal characteristics. The purpose of the experimental scenario design in this paper is to simulate the lowest characteristic difference scenario in the ship communication scenario of the channel, including using the same type of walkie-talkie to obtain the lowest difference between devices. In the experimental scenario, there are buildings and water surfaces in the transceiver path to simulate the characteristics of the ship communication scenario, which can better verify the feasibility of this method.
3.1.2. Experimental Process
Firstly, respectively, data were acquired of the same audio frequency and different audio frequency signals sent by an interphone in an indoor environment and an outdoor environment by utilizing a signal acquisition equipment; secondly, the acquired audio frequency data were preprocessed, possibly comprising the steps of denoising, feature extraction and the like, modulating signals, and converting into an IQ data set. The size of 2 × 128 (I and Q) is used in the experiment to form a sample as the input layer of the CNN. Samples are used to train the model for audio signal recognition tasks, and then the accuracy of the model is verified to evaluate its performance in the recognition of the same audio and different audio signals, as shown in Figure 6. The models trained in the indoor environment are applied to the recognition tasks of the same audio and different audio signals in the outdoor environment to evaluate their generalization ability. Through experiments in indoor and outdoor environments, the performance of the model in different environments is compared, which can evaluate the robustness and generalization ability of the model more comprehensively, and provide more reliable reference and support for the application of the model in the marine environment in the future.

Figure 6.
Experimental flow chart.
3.1.3. Parameter Selection
In the experiment, the above improved CNN model is concretized, and the structure of the model will directly affect the number and complexity of the parameters of the model. At the same time, by choosing reasonable parameters, the performance, generalization ability, and efficiency of the model can be optimized, so that the model can better adapt to specific tasks and data sets. In addition, the CNN extracts local features through a convolution kernel, and the model updates the convolution kernel parameter matrix through training, so that the convolution kernel can better extract features according to the purpose of the model. The number of convolution kernels determines the number of output feature maps of the layer. By adjusting the scale and number of convolution kernels, the dimension of feature maps and the expressive power of the network can be controlled. Therefore, the convolution kernel size of the Block1 convolution layer in the model structure is set to 68, and 68 convolution kernels are selected to effectively capture the characteristics of the input data without causing overfitting. In general, a smaller number of convolution kernels means that the model is simpler, easier to train, and may have better generalization ability. In Block2, the increase to 128 convolution kernels is to increase the representation capability of the network. As the network layer deepens, it is usually necessary to increase the number of convolution kernels to extract more abstract and complex features, based on further optimization of network performance and the need to capture more complex data patterns. In the improved multi-scale convolution module, different sizes of convolution kernels are used to increase the perception range of the neural network to the input data. In this paper, two sizes of convolution kernels, 3 × 3 and 5 × 5, are used. The size 3 × 3 is a smaller convolution kernel, which is mainly used to capture local details, while 5 × 5 is a larger convolution kernel, which is able to cover a wider area and thus extract more global feature information. At the same time, in practice, these two convolution kernels are widely used in deep learning models, and have achieved remarkable results. They show good performance and generalization ability in many visual tasks, providing a reliable basis for the optimization and application of the model.
3.1.4. Experimental Steps
Here are the specific steps of the experiment:
- ①
- Use the IC-M73 VHF walkie-talkie as shown in Figure 7a to transmit the signal carrying audio on channel 10.
- ②
- Use the sampling equipment as shown in Figure 7b for sampling. The center frequency of the sampling equipment is set as 156.5 MHz, and the bandwidth is set as 100 KHz; that is, the equipment collects signals from 156.45 MHz to 156.55 MHz of the VHF band, and can capture various VHF signals within this range. The sampling frequency is set to 100 × 103 and the sampling time is 5 s. The same and different audio signals of five IC-M73 walkie-talkies A\B\C\D\E at location X and location Y (location Y is farther from the receiving equipment than location X) are collected in turn as training samples.
- ③
- The samples for training are manually labeled as the signal samples sent by which walkie-talkie, and then the improved CNN model is selected for training, with 100 generations of training each time and automatic testing every three generations. Check the accuracy, loss, and test results of the model after training.
- ④
- The same and different audio signals of five IC-M73 walkie-talkies at X and Y are collected in turn as test samples.
- ⑤
- Select the test samples without manual labelling and use the trained improved CNN model to identify the signals.
- ⑥
- Check the final identification result.
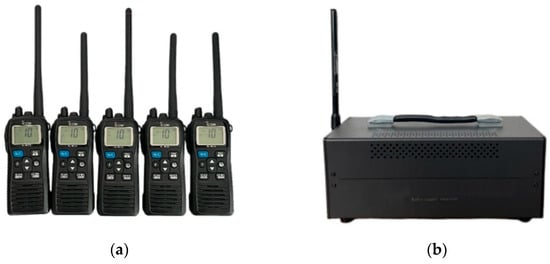
Figure 7.
Experimental equipment: (a) model IC-M73 Interphone; (b) radio signal receiving equipment.
3.2. Experiment 1: Compare the Recognition Rate of the Same Audio and Different Audio Samples at Point X
At point X, the same audio samples used for training and testing in the experiment are the digital voice broadcast samples of “74084506519174599376115120” sent by five walkie-talkies, and the different audio samples for testing are the voice broadcast of different numbers.
The model is first trained using the samples, and the experimental results of the training are shown in Figure 8 and Figure 9, with fold line 1 showing the accuracy and loss of training the model with the same audio samples at point X, and fold line 2 showing the accuracy and loss of training the model with different audio samples at point X.
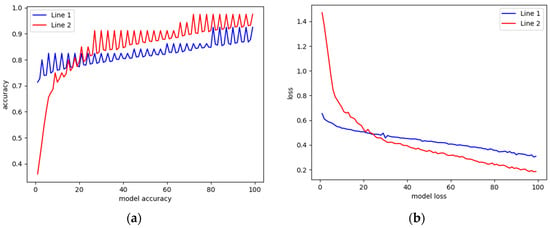
Figure 8.
Recognition Result of Experiment 1: (a) model accuracy; (b) model loss.
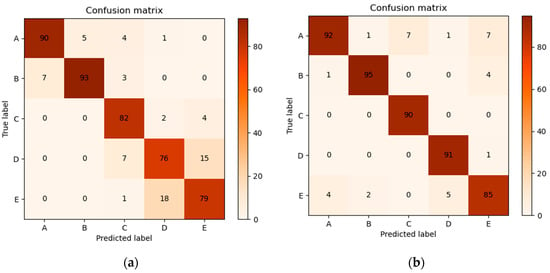
Figure 9.
Confusion matrix of Experiment 1: (a) same audio recognition result; (b) different audio recognition result.
From the image of model accuracy, the accuracy of “Line 1” rises rapidly at the beginning of training, then reaches an inflection point at about 20 iterations, and the accuracy begins to rise slowly and fluctuates around 0.9. “Line 2” is less accurate than “Line 1” from the beginning, but there is also an inflection point at about the same iteration of 20 times, after which the accuracy rises rapidly and reaches a plateau near 0.8. The reason for the inflection point may be that in the early stage of training, the model can often quickly learn some useful patterns from the data, resulting in a rapid increase in accuracy. As the training continues, the model may approach the upper limit of its ability, and it is difficult to further improve the accuracy significantly, resulting in the emergence of inflection points. At the same time, because “Line 2” is trained with different audio samples, it may cause the model to need more time to generalize different data features, resulting in fluctuations or delays in the process of increasing accuracy; in the loss diagram of the model, the model shown by “Line 1” declines faster in the early stage, which may mean that it learns faster. At a later stage, “Line 2” decreases slowly, but its loss value decreases to a similar level as “Line 1”, indicating that the two methods may eventually have similar performance. The confusion matrix of the test results shows that the test effect of different audio is better and the recognition degree is higher.
After 10 test sample recognition experiments, the average accuracy of the comparison test is close to the accuracy of the training, which shows that the model has good performance and generalization ability, and can reliably predict or classify tasks in practical applications. The accuracy of recognition results is shown in Figure 10.

Figure 10.
Multiple Recognition Results of Experiment 1: (a) same audio recognition result; (b) different audio recognition result.
3.3. Experiment 2: Compare the Recognition Rates of the Same Audio Samples at Points X and Y
The same audio samples used for training and testing in the experiments at points X and Y are the digital voice broadcast samples of “74084506519174599376115120” emitted by five walkie-talkies.
First, the model is trained using samples. The experimental results of the training are shown in Figure 11. The broken line 1 is the accuracy and loss of training the same audio sample model at point X, and the broken line 2 is the accuracy and loss of training the same audio sample model at point Y.
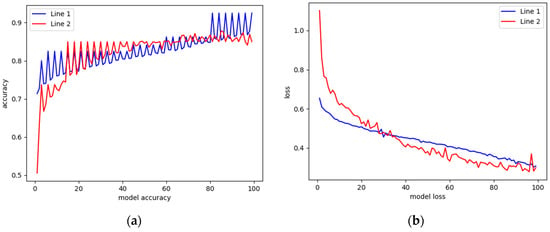
Figure 11.
Recognition Result of Experiment 2: (a) model accuracy; (b) model loss.
From the fluctuation of the fold line, we can see that the learning of the model is fluctuating throughout the training process, which is due to the fluctuation brought by the gradient update, or the model is trying to learn more complex patterns in the training set. It can be seen from the figure that when the same audio is trained, the accuracy of the model is high when it is close to the receiving point. It is possible that the signal may experience more attenuation or interference because point Y is farther away from the receiving device, resulting in a decrease in the quality of the input data, thus affecting the effect of model training. However, the overall difference is not significant, and the final “Line 2” loss is small.
The accuracy results of the recognition experiment for 10 test samples are shown in Figure 12.

Figure 12.
Multiple Recognition Results of Experiment 2: (a) The same audio recognition result at point X; (b) the same audio recognition result at point Y.
3.4. Experiment 3: Compare the Recognition Rates of Different Audio Samples at Points X and Y
In the experiment of point X and Y, different audio samples are used to train and test the voice broadcast of different numbers from five walkie-talkies.
First, use samples to train the model. The experimental results of the training are shown in Figure 13. Fold line 1 is the accuracy and loss of training different audio sample models at point X, and fold line 2 is the accuracy and loss of training different audio sample models at point Y.
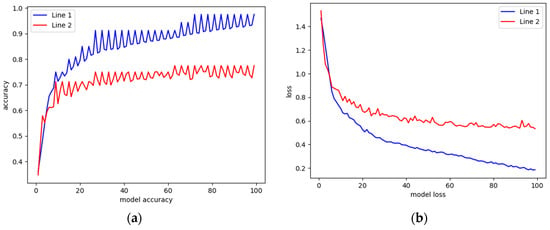
Figure 13.
Recognition Result of Experiment 3: (a) model accuracy; (b) model loss.
The figure shows that both “Line 1” and “Line 2” increase sharply with the increase of model accuracy evaluation, and then tend to be stable, but the accuracy of Line 1 is higher than that of Line 2, and shows some fluctuations in the stable period. The inflection point occurs at the moment when the accuracy of the model is low, which may be due to the rapid learning of the basic patterns in the data at the beginning of the model training when the learning rate is high, resulting in a rapid increase in accuracy. As the model continues to train, the improvement in accuracy slows down, indicating that the model is beginning to reach some saturation point in its performance, at which point further tuning of parameters or more complex model structures may be needed to continue to improve accuracy. Meanwhile, the loss of Line 1 is also lower than that of Line 2, which indicates that compared with the signal close to the receiving device, the signal far away may cause more noise or distortion, making it difficult for the model to learn and predict accurately.
The accuracy results of the recognition experiment for 10 test samples are shown in Figure 14.

Figure 14.
Multiple Recognition Results of Experiment 3: (a) different audio recognition results at point X; (b) different audio recognition results at point Y.
3.5. Experiment 4: Compare the Recognition Rate of the Same Audio and Different Audio Samples at Point Y
At point Y, the same audio samples used for training and testing in the experiment are the digital voice broadcast samples of “74084506519174599376115120” sent by five walkie-talkies, and the different audio samples used for testing are the voice broadcast of different numbers.
First, the model is trained by using samples. The experimental results of the training are shown in Figure 15 and Figure 16. Fold line 1 is the accuracy and loss of training the same audio sample model at point Y, and fold line 2 is the accuracy and loss of training different audio sample models at point Y.
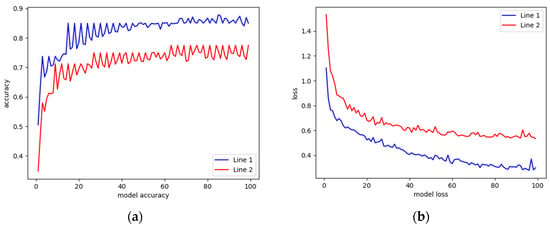
Figure 15.
Recognition Result of Experiment 4: (a) model accuracy; (b) model loss.
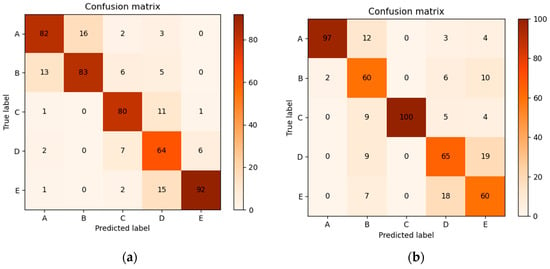
Figure 16.
Confusion matrix of Experiment 4: (a) same audio recognition result; (b) different audio recognition result.
Line 1 rises rapidly in the early iteration, then gradually stabilizes, and finally stabilizes at a higher accuracy level, which shows that the learning effect of the model on the training set is gradually saturated. Line 2 also shows an upward trend, but the accuracy rate increases more slowly, and the final accuracy rate is lower than that of Line 1. Line 2 means that different audio samples are used for training. In the case of complex experimental conditions (such as interference conditions), the accuracy of the model is naturally lower, reflecting the generalization ability of diverse data.
The experiment of receiving radio signals at sea will face many challenges, such as signal fading, noise interference, multipath effect, and so on. This may explain the low accuracy of Line 2: because the model needs to recognize signals in more diverse and complex environmental conditions, it puts forward higher requirements for the generalization capability of machine learning models.
The accuracy results of the recognition experiment of 10 test samples are shown in Figure 17, which shows that radio signals can be recognized even at a long distance.

Figure 17.
Multiple Recognition Results of Experiment 4: (a) the same audio recognition result; (b) different audio recognition result.
4. Discussion
Combining all the experimental results, it can be found that the model shows the characteristics of rapid learning in the early stage of training, and quickly learns the basic pattern from the data. With the progress of training, the accuracy of the model eventually tends to be stable and fluctuates at a relatively fixed level, indicating that the model can adapt to different data samples and environmental conditions to a certain extent and achieve certain recognition performance.
However, the accuracy of the model has a certain degree of fluctuation in the training process, and the amplitude and stability of this fluctuation are affected by the experimental conditions. Experiments 1 and 2 involve the same audio samples and different audio samples, and the model trained by the same audio samples has higher accuracy at the beginning of training and reaches a stable state faster, while different audio samples may need more training and adjustment to achieve similar accuracy levels. Experiment 3 and Experiment 4 involve different environmental conditions. It is found that the model in Experiment 4 needs more training and adjustment to improve its performance in the face of complex environments.
To sum up, the model shows some similarities and differences in the face of different data samples and environmental conditions, as shown in the following Table 1.

Table 1.
Experimental information summary.
Through four groups of the same and different audio recognition experiments in different environments, and by comparing the average accuracy, average loss, and average accuracy of the final recognition results of the model in different experiments, it is found that although there are differences in the performance of the model in different experiments, it can still achieve certain recognition performance through reasonable training and adjustment, which indicates that the model has certain applicability and feasibility in the task of maritime radio signal feature recognition. Effective signal identification and communication can be realized.
5. Conclusions
In this study, a deep learning recognition model for shipborne VHF wireless signal features is established by integrating a convolutional neural network with CAM feature extraction and BiLSTM feature extraction. To validate the effectiveness of the proposed method in non-cooperative signal feature recognition and signal source classification for the same type of signals, an experimental scenario simulating marine ship communication is designed using five VHF radios of identical model and parameters. These experiments provide a novel technical approach towards ship target perception.
Due to the inherent randomness and discreteness of ship communication scenes, obtaining a large-scale dataset for training VHF communication signals is challenging. Therefore, this paper selects hand-held VHF radios to acquire a substantial amount of training data. Additionally, the experimental scene focuses on a limited dataset consisting of five targets with low computational complexity. Future research will delve deeper into perceiving actual ship VHF signals, collecting a wider range and larger volume of ship VHF signal data, integrating AIS data and VHF voice data for annotation purposes, and establishing dynamic training models to validate their feasibility in diverse maritime business scenarios.
Author Contributions
Conceptualization, L.C.; methodology, L.C. and J.L.; software, J.L.; validation, J.L.; formal analysis, L.C. and J.L.; resources, L.C.; data curation, L.C. and J.L.; writing—original draft preparation, J.L.; writing—review and editing, L.C.; visualization, L.C. and J.L.; supervision, L.C.; project administration, L.C.; funding acquisition, L.C. All authors have read and agreed to the published version of the manuscript.
Funding
This work was supported by the National Natural Science Foundation of China (Grant No. 52372316, 51909156).
Institutional Review Board Statement
Not applicable.
Informed Consent Statement
Not applicable.
Data Availability Statement
The data presented in this study are available on request from the corresponding author as the data require the use of the signal acquisition device which was used in the experiment.
Conflicts of Interest
The authors declare no conflict of interest.
References
- Forti, N.; D’Afflisio, E.; Braca, P.; Millefiori, L.M.; Willett, P. Next-Gen Intelligent Situational Awareness Systems for Maritime Surveillance and Autonomous Navigation Point of View. Proc. IEEE 2022, 110, 1532–1537. [Google Scholar] [CrossRef]
- Ahmad, Z.; Acarer, T.; Kim, W. Optimization of Maritime Communication Workflow Execution with a Task-Oriented Scheduling Framework in Cloud Computing. J. Mar. Sci. Eng. 2023, 11, 2133. [Google Scholar] [CrossRef]
- Bisio, I.; Garibotto, C.; Lavagetto, F.; Sciarrone, A. Performance Analysis of VCA-Based Target Detection System for Maritime Surveillance. IEEE Trans. Veh. Technol. 2023, 72, 5010–5020. [Google Scholar] [CrossRef]
- Djenouri, Y.; Belhadi, A.; Djenouri, D.; Srivastava, G.; Lin, J.C.W. Intelligent Deep Fusion Network for Anomaly Identification in Maritime Transportation Systems. IEEE Trans. Intell. Transp. Syst. 2023, 24, 2392–2400. [Google Scholar] [CrossRef]
- Felski, A.; Zwolak, K. The Ocean-Going Autonomous Ship-Challenges and Threats. J. Mar. Sci. Eng. 2020, 8, 41. [Google Scholar] [CrossRef]
- Dudczyk, J. Radar Emission Sources Identification Based on Hierarchical Agglomerative Clustering for Large Data Sets. J. Sens. 2016, 2016, 1879327. [Google Scholar] [CrossRef]
- Dudczyk, J.; Kawalec, A. Specific emitter identification based on graphical representation of the distribution of radar signal parameters. Bull. Pol. Acad. Sci.-Tech. 2015, 63, 391–396. [Google Scholar] [CrossRef]
- Dudczyk, J.; Rybak, L. Application of Data Particle Geometrical Divide Algorithms in the Process of Radar Signal Recognition. Sensors 2023, 23, 8183. [Google Scholar] [CrossRef]
- Chen, J.; Guo, J.; Shan, X.; Kong, D. Signal Modulation Identification Based on Deep Learning in FBMC/OQAM Systems. Mob. Inf. Syst. 2021, 2021, 4809699. [Google Scholar] [CrossRef]
- Peng, S.; Sun, S.; Yao, Y.-D. A Survey of Modulation Classification Using Deep Learning: Signal Representation and Data Preprocessing. IEEE Trans. Neural Netw. Learn. Syst. 2022, 33, 7020–7038. [Google Scholar] [CrossRef]
- Demirci, S.M.E.; Cicek, K. Intelligent ship inspection analytics: Ship deficiency data mining for port state control. Ocean Eng. 2023, 278, 18. [Google Scholar] [CrossRef]
- Rong, B. Reinforcement Learning for Maritime Communications. IEEE Wirel. Commun. 2023, 30, 12. [Google Scholar] [CrossRef]
- Xiao, W.S.; Luo, Z.Q.; Hu, Q. A Review of Research on Signal Modulation Recognition Based on Deep Learning. Electronics 2022, 11, 2764. [Google Scholar] [CrossRef]
- Salem, M.H.; Li, Y.J.; Liu, Z.Y.; AbdelTawab, A.M. A Transfer Learning and Optimized CNN Based Maritime Vessel Classification System. Appl. Sci. 2023, 13, 1912. [Google Scholar] [CrossRef]
- Rawson, A.; Brito, M.; Sabeur, Z.; Tran-Thanh, L. A machine learning approach for monitoring ship safety in extreme weather events. Saf. Sci. 2021, 141, 11. [Google Scholar] [CrossRef]
- Guo, S.; Akhtar, S.; Mella, A. A Method for Radar Model Identification Using Time-Domain Transient Signals. IEEE Trans. Aerosp. Electron. Syst. 2021, 57, 3132–3149. [Google Scholar] [CrossRef]
- Niranjan, R.K.; Rao, C.B.R.; Singh, A.K. FPGA based Identification of Frequency and Phase Modulated Signals by Time Domain Digital Techniques for ELINT Systems. Def. Sci. J. 2021, 71, 79–86. [Google Scholar] [CrossRef]
- Wang, S.; Wang, Z.; Zhang, T. Modulation signal identification and classification based on the OA algorithm model. Int. J. Electron. 2023, 111, 1012–1032. [Google Scholar] [CrossRef]
- Hao, C.; Dang, X.; Li, S.; Wang, C. Deep Learning Based Low Complexity Symbol Detection and Modulation Classification Detector. IEICE Trans. Commun. 2022, E105B, 923–930. [Google Scholar] [CrossRef]
- Zhang, J.; Hu, S.; Du, Z.; Wu, W.; Gao, Y.; Cao, J. Deep learning-based digital signal modulation identification under different multipath channels. IET Commun. 2021, 15, 1950–1962. [Google Scholar] [CrossRef]
- Kim, H.; Kim, Y.-J.; Kim, W.-T. Multitask Learning-Based Deep Signal Identification for Advanced Spectrum Sensing. Sensors 2023, 23, 9806. [Google Scholar] [CrossRef] [PubMed]
- Zha, Y.; Wang, H.; Shen, Z.; Shi, Y.; Shu, F. Intelligent identification technology for high-order digital modulation signals under low signal-to-noise ratio conditions. IET Signal Process. 2023, 17, e12189. [Google Scholar] [CrossRef]
- Huynh-The, T.; Pham, Q.V.; Nguyen, T.V.; Nguyen, T.T.; Ruby, R.; Zeng, M.; Kim, D.S. Automatic Modulation Classification: A Deep Architecture Survey. IEEE Access 2021, 9, 142950–142971. [Google Scholar] [CrossRef]
- Liu, F.; Zhang, Z.; Zhou, R. Automatic modulation recognition based on CNN and GRU. Tsinghua Sci. Technol. 2022, 27, 422–431. [Google Scholar] [CrossRef]
- Xiang, H.H.; Chen, B.X.; Yang, T.; Liu, D. Improved De-Multipath Neural Network Models with Self-Paced Feature-to-Feature Learning for DOA Estimation in Multipath Environment. IEEE Trans. Veh. Technol. 2020, 69, 5068–5078. [Google Scholar] [CrossRef]
- Lu, L.J.; Mao, J.N.; Wang, W.Q.; Ding, G.X.; Zhang, Z.W. A Study of Personal Recognition Method Based on EMG Signal. IEEE Trans. Biomed. Circuits Syst. 2020, 14, 681–691. [Google Scholar] [CrossRef] [PubMed]
- Tan, Y.H.; Jing, X.J. Cooperative Spectrum Sensing Based on Convolutional Neural Networks. Appl. Sci. 2021, 11, 4440. [Google Scholar] [CrossRef]
- Zhang, L.; Liu, H.; Yang, X.L.; Jiang, Y.; Wu, Z.Q. Intelligent Denoising-Aided Deep Learning Modulation Recognition with Cyclic Spectrum Features for Higher Accuracy. IEEE Trans. Aerosp. Electron. Syst. 2021, 57, 3749–3757. [Google Scholar] [CrossRef]
- Pereira, M.I.; Claro, R.M.; Leite, P.N.; Pinto, A.M. Advancing Autonomous Surface Vehicles: A 3D Perception System for the Recognition and Assessment of Docking-Based Structures. IEEE Access 2021, 9, 53030–53045. [Google Scholar] [CrossRef]
- Yang, Y.; Shao, Z.P.; Hu, Y.; Mei, Q.; Pan, J.C.; Song, R.X.; Wang, P. Geographical spatial analysis and risk prediction based on machine learning for maritime traffic accidents: A case study of Fujian sea area. Ocean Eng. 2022, 266, 113106. [Google Scholar] [CrossRef]
- Byeon, Y.-H.; Kwak, K.-C. Individual Identification by Late Information Fusion of EmgCNN and EmgLSTM from Electromyogram Signals. Sensors 2022, 22, 6770. [Google Scholar] [CrossRef] [PubMed]
- Liu, R.W.; Yuan, W.Q.; Chen, X.Q.; Lu, Y.X. An enhanced CNN-enabled learning method for promoting ship detection in maritime surveillance system. Ocean Eng. 2021, 235, 109435. [Google Scholar] [CrossRef]
- Chen, X.Q.; Liu, S.H.; Liu, R.W.; Wu, H.F.; Han, B.; Zhao, J.S. Quantifying Arctic oil spilling event risk by integrating an analytic network process and a fuzzy comprehensive evaluation model. Ocean. Coast Manag. 2022, 228, 106326. [Google Scholar] [CrossRef]
- Park, J.; Jeong, J.; Park, Y. Ship Trajectory Prediction Based on Bi-LSTM Using Spectral-Clustered AIS Data. J. Mar. Sci. Eng. 2021, 9, 1037. [Google Scholar] [CrossRef]
- Zhou, X.Y.; Liu, Z.J.; Wang, F.W.; Xie, Y.J.; Zhang, X.X. Using Deep Learning to Forecast Maritime Vessel Flows. Sensors 2020, 20, 1761. [Google Scholar] [CrossRef]
Disclaimer/Publisher’s Note: The statements, opinions and data contained in all publications are solely those of the individual author(s) and contributor(s) and not of MDPI and/or the editor(s). MDPI and/or the editor(s) disclaim responsibility for any injury to people or property resulting from any ideas, methods, instructions or products referred to in the content. |
© 2024 by the authors. Licensee MDPI, Basel, Switzerland. This article is an open access article distributed under the terms and conditions of the Creative Commons Attribution (CC BY) license (https://creativecommons.org/licenses/by/4.0/).