Article

Diversity and Distribution of Mesozooplankton in the Coastal Southwestern Mediterranean Alboran Sea, during Summer: What Are the Driving Factors?

1
Health and Environment Laboratory, Ain Chock Faculty of Sciences, Hassan II University of Casablanca, B.P. 5366, Casablanca 20100, Morocco
2
National Institute of Fisheries Research, Avenue Sidi Abderrahmane, B.P. 20100, Aïn Diab Casablanca, Casablanca 20180, Morocco
3
MARBEC, University of Montpellier, CNRS, Ifremer, IRD, 34095 Montpellier, France
4
MARBEC, University of Montpellier, CNRS, Ifremer, IRD, 34200 Sète, France
*
Author to whom correspondence should be addressed.
J. Mar. Sci. Eng. 2024, 12(4), 674; https://doi.org/10.3390/jmse12040674
Submission received: 13 March 2024 / Revised: 14 April 2024 / Accepted: 16 April 2024 / Published: 18 April 2024
(This article belongs to the Special Issue Plankton Community in Marine Ecosystem)

Abstract

:
The southern Alboran Sea is a dynamic ecosystem and is highly influenced by Atlantic waters. Unfortunately, despite the importance of the mesozooplankton in this ecosystem, the number of studies on this ecosystem is low. The composition and abundance of mesozooplankton communities were studied during the summer season (July 2017) along the Moroccan Mediterranean coast between M’diq and Saïdia. A total of 14 mesozooplankton groups were identified and were dominated by copepods (48%) and cladocerans (35%). Abundance and biomass spatial distribution distinguished two main regions east and west of Al Hoceima. The same distribution pattern was observed when using copepod and cladoceran abundance. Environmental parameters (temperature, salinity, and nutrients) differed in these two regions. Our results confirm the hypothesis that the water flux from the Atlantic Ocean is responsible for the eastward gradients of the mesozooplankton abundance and diversity. Copepods were the most diversified group with 27 species, dominated by Paracalanus parvus (30.5%), Temora stylifera (14%), and Oncaea venusta (12.4%). The diversity index (H’) of copepods varied between 1.35 and 2.8 bits ind−1, and the regularity index (J) varied between 0.21 and 0.45, without a remarkable longitudinal gradient. Multivariate analysis showed that the mesozooplankton biomass, abundance, and distribution were influenced mainly by hydrology (gyres), by temperature and salinity, and to a lesser degree by phytoplankton.

1. Introduction

The Mediterranean Sea is considered to be a very special ecosystem because of its location, reduced dimension, and high biodiversity [1]. It is also highly sensitive to environmental changes and subjected to anthropogenic pressure [2,3,4]. In marine ecosystems, zooplankton plays a crucial role in global biogeochemical cycles [5].
At the heart of these ecosystems, zooplankton emerges as a pivotal component, significantly influencing global biogeochemical cycles through their population and community dynamics, which include growth, mortality, distribution, and diversity [5,6]. These biological processes are directly influenced by various environmental covariates such as temperature, nutrient availability, ocean acidification, habitat structure, and predation/competition [6,7]. Understanding the direct connections between zooplankton dynamics and environmental factors is essential for predicting and managing the responses of zooplankton populations to climate change and for assessing the health and resilience of marine ecosystems [7].
The Alboran Sea, of which the Moroccan coast is part, is a region characterized by a permanent surface current (0–200 m) from the Atlantic Ocean (the Atlantic jet stream) that enters the Mediterranean through the Strait of Gibraltar, forming a path that generates two main gyres: the Western Alboran Gyre (WAG) and the Eastern Alboran Gyre (EAG) [8]. This narrow (~13 km) and shallow (~300 m depth) strait allows for mixing with pre-existing Mediterranean water while moving toward the eastern Mediterranean basin [9,10]. The western Alboran Sea (west of Al Hoceima) is characterized by colder and less salty water, which could correspond to the development of the anticyclonic WAG [11]. Further east, the temperature and salinity are higher and are associated with the presence of a variable central cyclonic gyre (CCG) and the EAG. The WAG is permanent, while the EAG is present only during the summer–autumn period, and is associated with the westward displacement of the CCG [8]. Furthermore, the existence of quasi-permanent frontal areas associated with these anticyclonic eddies contributes to the high zooplanktonic productivity of the Alboran Sea [12,13,14] due to the enrichment of the Atlantic waters [15]. Several studies have revealed the presence of sub-mesoscale vortices around the gyres [16,17], which are spots of high biological productivity due to the large vertical velocities involved.
The rich and dynamic Alboran Mediterranean system has led to the development of numerous studies conducted during the last 25 years on the phytoplanktonic component [18,19]. However, very few studies have focused on the zooplankton in the southern Mediterranean, including the Alboran Sea [14,20,21,22,23], compared to the northern Mediterranean region (e.g., [24,25,26,27,28]).
Studies published on the diversity and distribution of zooplankton along the Moroccan Mediterranean coast are very limited [22,29,30]. This coast has yet to be explored when compared with the Atlantic Coast [31,32,33,34,35,36,37,38]. The western Mediterranean Sea holds important fish resources. Consequently, it is important to understand the impact of the zooplankton communities on the richness of fish resources, as more than 75% of commercial marine fishes are planktivorous [39,40].
This study aims to determine the diversity and abundance of mesozooplankton in the Moroccan Mediterranean Sea and to understand how the hydrology and main environmental factors could influence the distribution of the mesozooplankton community. Based on zooplankton sampling and identification, we may complete other data collection efforts, such as oceanographic measurements. Integrating zooplankton data with other datasets allows us to explore multidimensional relationships and assess ecosystem dynamics.

2. Materials and Methods

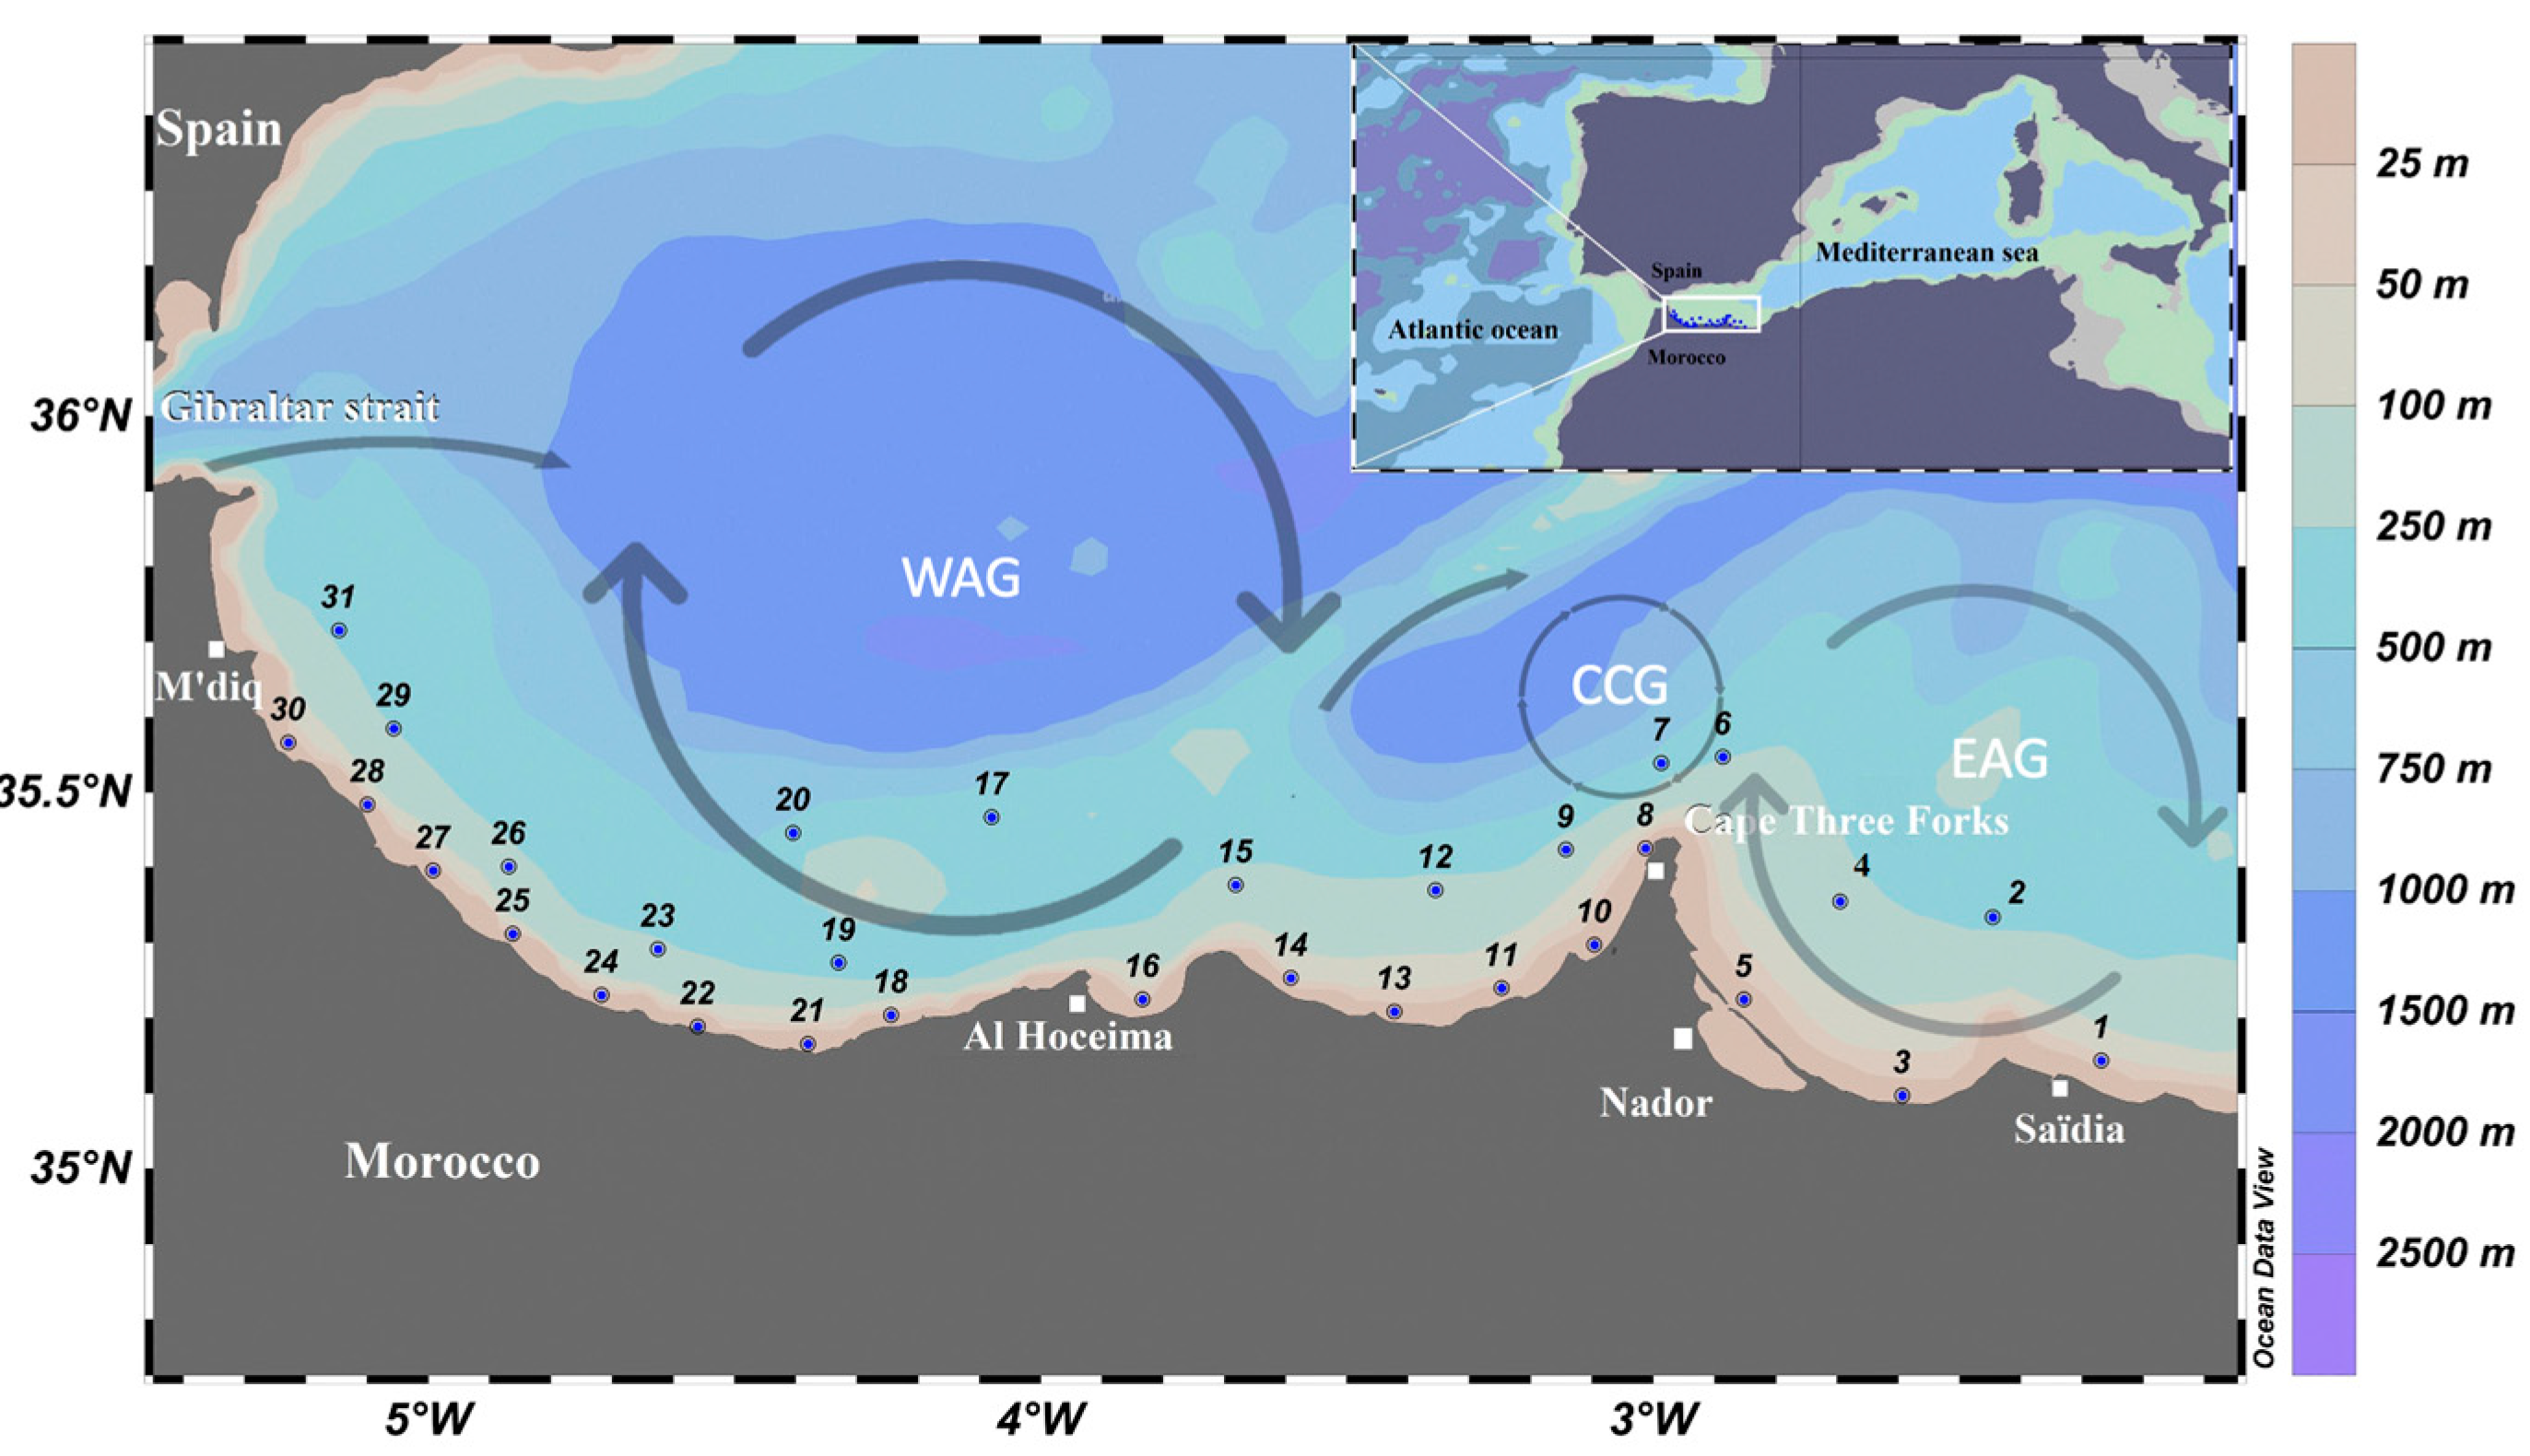
2.1. Study Area, Sampling, and Measurements

An oceanographic survey was carried out along the Moroccan Mediterranean coast from M’diq (35°52′ N, 05°14′ W) to Saïdia (35°10′ N, 02°16′ W) from the 20th to the 26th of July 2017 (the summer season). This survey is part of the regular research campaign conducted by the National Institute of Fisheries Research (INRH) in Morocco, aboard the research vessel R/V Al Amir Moulay Abdellah. During this survey, a range of environmental factors were measured to understand the physical, chemical, and biological processes that shape the marine ecosystems and are essential for effective oceanographic research and management. The sampling network included 31 stations covering the entire area and was located between the coast and isobaths at 500 m (Figure 1).
At each station, temperature, salinity, and dissolved oxygen were measured using a conductivity, temperature, and depth (CTD)-type RINKO. Water samples were taken from Niskin bottles in two layers (surface and bottom), for chlorophyll-a measurement [41,42] using a fluorimeter (10-AU). Nutrients (nitrate, phosphate, and silicate) were measured using an auto-analyzer AA3 AxEFlow [43].
Mesozooplankton was collected by oblique hauls from 0 to 100 m depth in deep waters and to the bottom in shallower waters using a Bongo net (20 cm opening diameter and 150 μm mesh size) equipped with a flow meter. Mesozooplankton samples were preserved in a solution of seawater and formaldehyde (5%). Zooplankton biomass (mg.m−3) was obtained by wet weight measurement on predetermined aluminum foil. Interstitial water was removed using blotting paper. The samples were fractionated using a Motoda box-splitter [44] with a variable number of fractions (sub-samples) depending on the density of the sample. This operation allows for better and more accurate identification and enumeration of specimens under a stereomicroscope. The zooplankton taxa were identified to the lowest taxonomic level possible.

2.2. Data Analysis

Zooplankton abundance (A) was expressed as individuals per cubic meter (ind.m−3) and was calculated as follows:
A = (n × 1000)/V
where n is the number of individuals per volume of water and V is the filtered water volume (m3).
The description of the zooplankton community structure was based on the calculation of four ecological indices:
-
The specific richness (S), which is the number of encountered species.
-
The relative abundance of species i in a sample:
Pi = ni/N
where n is the number of species i and N is the total number of all species.
-
The Shannon–Weaver diversity index (H’; [45]) is used to characterize species diversity in a community. It establishes the link between the number of species (ni) and the number of individuals (N) within the ecosystem or a community. It is measured with the following formula:
H = i = 1 S n i N l o g 2 n i N
where ni is the abundance of species i and N is the total abundance of all species.
-
The Pielou index (J; [46]), a measure of the equitability (or equidistribution) of the species, is calculated according to the following formula:
J = H′/log2 S

2.3. Statistical Analysis

Principal component analysis (PCA) was performed on normalized and log-transformed environmental variables in order to examine their distribution patterns. The environmental variables used were: sea surface temperature (SST), sea surface salinity (SSS), dissolved oxygen, nitrate, phosphate, chlorophyll-a surface concentration, and zooplankton wet weight biomass.
The spatial variation in the structure of the mesozooplankton communities in the study area was described with cluster analysis and non-metric multidimensional scaling (NMDS) as described by Clarke and Warwick (1994) [47]. Before calculating inter-station resemblances, species abundances for each sampling site were square-root transformed to down-weight abundant species and increase the importance of less-abundant ones. A dissimilarity matrix between stations was constructed based on differences in species composition and abundance using the Euclidean distance. Relationships between the mesozooplankton community composition and environmental parameters were evaluated by distance-based linear modeling analysis (DistLM). Distance-based redundancy analysis (dbRDA) was used to visualize the influence of variables identified by DistLM on the zooplankton community. All environmental parameters were log (x + 1) transformed and normalized, and then the DistLM was run with a dbRDA plot by combining the resemblance matrix (based on Euclidean distance between the abundances of mesozooplankton species in the samples) and the environmental variables. To run DistLM, we chose “Step-wise” as a selection procedure, “AIC” as a selection criterion, and the number of permutations was 999.
The key species and groups contributing mostly to the similarity and dissimilarity between different areas were identified using the similarity percentage (SIMPER) analysis method.
The analyses were conducted using the PRIMER-PERMANOVA + v.6 software package [48]. At each transect, the horizontal distribution of surface temperature, salinity, and dissolved oxygen was obtained with Ocean Data View software (ODV Version: ODV 5.7.0, [49]).

3. Results

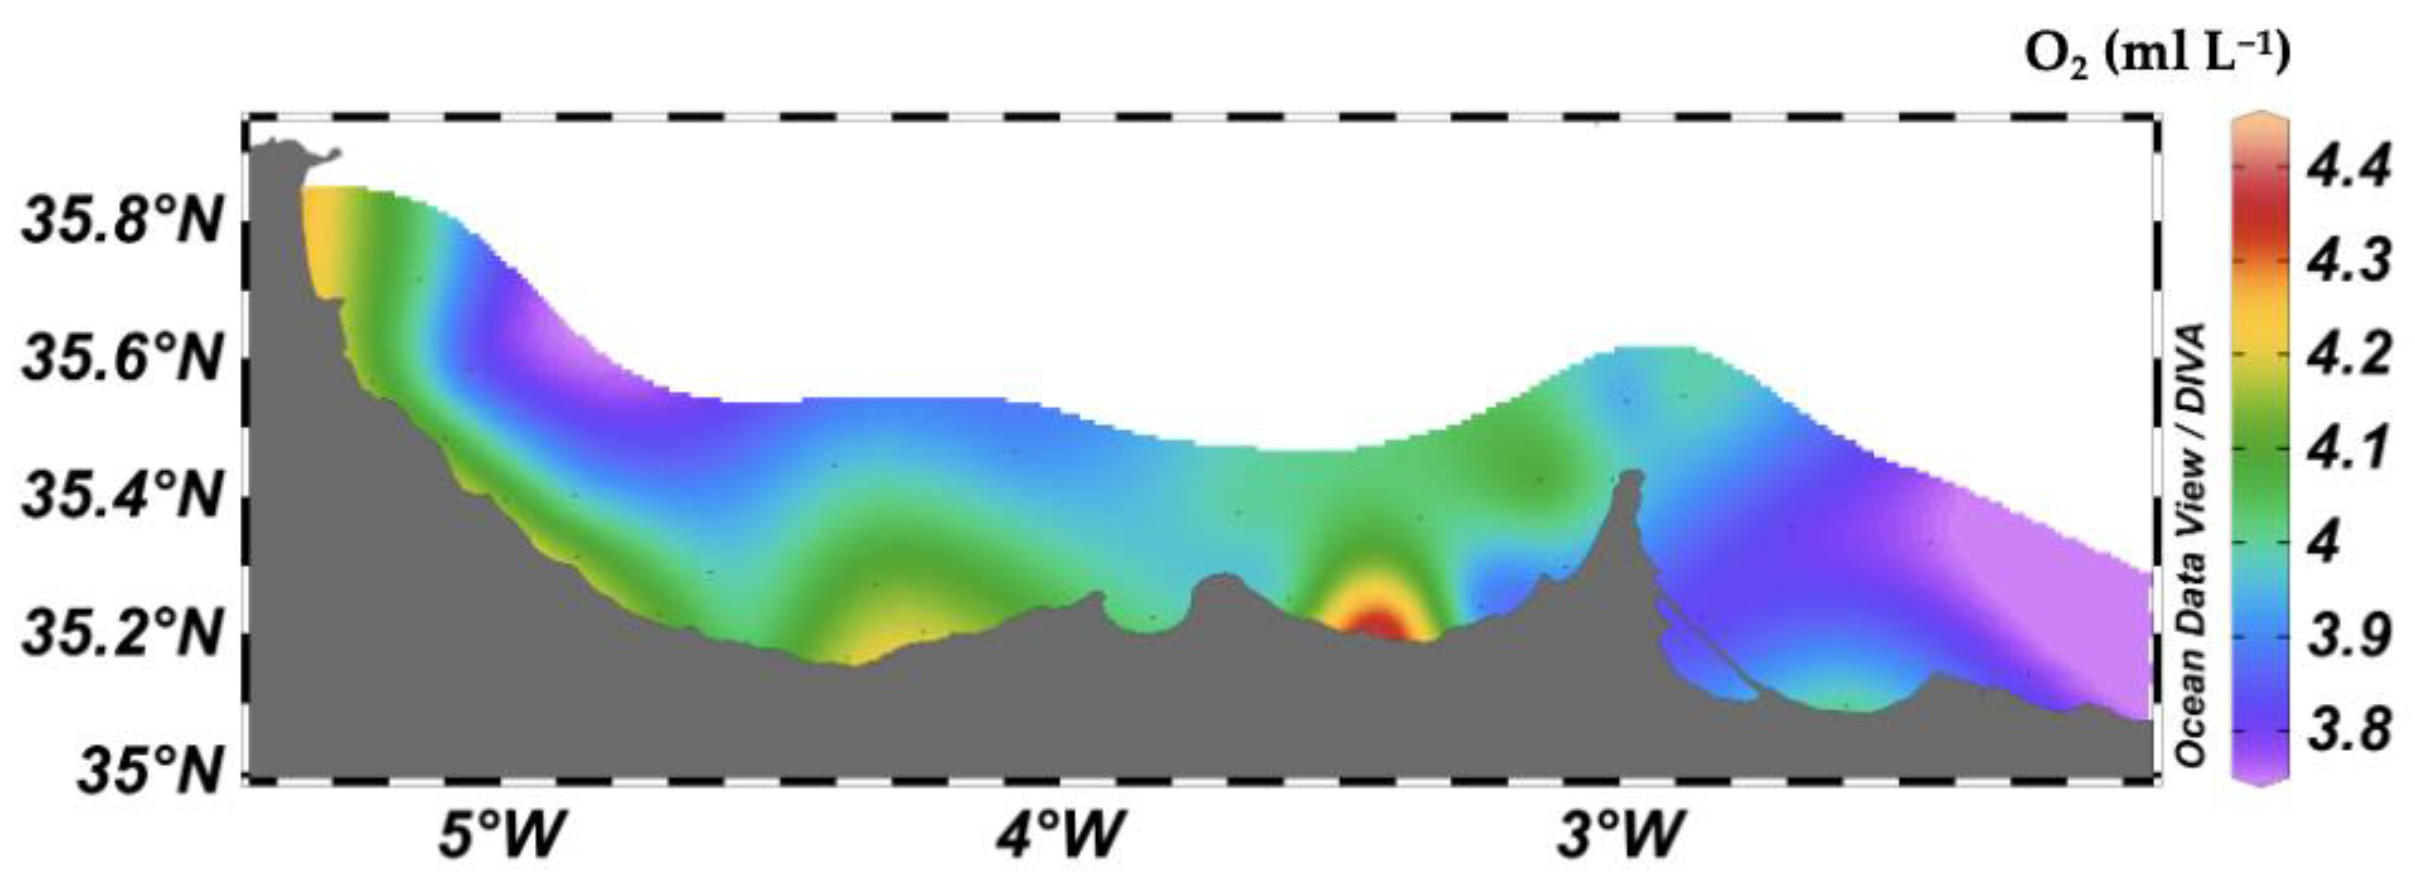
3.1. Environmental Parameters

The distribution of surface temperature and salinity showed a gradual eastward increase (Figure 2a,b), and their values ranged from 21.09 to 25.51 °C and 36.41 to 36.93 psu, respectively.
The concentrations of surface nutrients (phosphates and nitrates) were relatively high (Figure 3a,b), increasing in the west of Al Hoceima with values reaching 0.8 µM and 1.8 µM for phosphates and nitrates, respectively. Low concentrations of surface nutrients (silicate) (Figure 3c) were observed in the western region, especially between Al Hoceima and M’diq (<2 µM). The highest values were encountered in the eastern region with a maximum of 4.57 µM.
The concentration of chlorophyll-a (Figure 4) was very low on the surface with a maximum of 0.063 µg L−1 coastal between M’diq and Al Hoceima, while at depth the values ranged between 0.004 and 0.14 µg L−1 (Figure S2, Supplementary Data). In fact, relatively high concentrations were found in coastal stations located to the west of the study area (with an average surface value of 0.02 µg L−1), which is confirmed by satellite data (Supplementary Materials Figure S1).
Dissolved oxygen was high throughout the stations (>3.8 mL L−1) with a west–east decreasing trend (Figure 5).

3.2. Vertical Distribution of Environmental Parameters from T–S Diagrams

The temperature–salinity diagrams were different from one station to another. They showed a similarity among coastal and offshore stations as shown in Figure 6. Both offshore and coastal stations have a similar value of temperature and salinity in the surface layer. Interestingly, the deeper layers in offshore stations (>200 m) showed temperature and salinity values typical of Mediterranean waters, while coastal stations did not show any stratification (Figure 6).

3.3. Relationships between Mesozooplankton Biomass and Environmental Factors

The standardized PCA was used to visualize the structure of the total biomass in relation to the environmental parameters. The considered variables were surface temperature, surface salinity, phosphates, nitrates, dissolved oxygen, bathymetry depth, and Chl-a, as well as total zooplankton biomass. The first two axes of the factorial plane F1 × F2 represented 56.5% of the total inertia for the PCA. The first axis was mostly described by salinity and temperature on one side, and Chl-a and oxygen on the other. The second axis was represented by bathymetry depth on one side and phosphates on the other (Figure 7). The total mesozooplankton biomass contributed equally to both axes, where it correlated positively with the ‘nutrient’ variables.
Two main groups of stations were observed (Figure 7). Group I has stations localized in the eastern part of the Moroccan Mediterranean area from Saïdia to Al Hoceima. These stations are characterized by high values of temperature and salinity. Group II is mainly associated with stations localized in the western part from Al Hoceima to M’diq. This region is characterized by high concentrations of Chl-a, phosphates, nitrates, dissolved oxygen, and high mesozooplankton abundance.

3.4. Diversity, Biomass, and Abundance of Mesozooplankton

The most dominant groups in the study area were copepods and cladocerans with a relative abundance of 48.49% and 35.55%, respectively (Table 1). Appendicularia, Chaetognatha, Salpida, gastropod larvae, meroplankton larvae of crustaceans, and Siphonophora had low relative abundance (<6%).
The spatial distribution of biomass has created a division of the study area into two parts: the western part with high biomass and the eastern part with the lowest biomass (Figure 8), where the lowest value reached 7 mg.m−3 in the east and the highest value reached 788.7 mg.m−3 in the west of the study area.
The spatial distribution of total mesozooplankton abundance also highlighted two different zones: the western coast (from M’diq to Al Hoceima), characterized by high abundance with a maximum of 6300 ind.m−3 registered at Station 16 located in Al Hoceima Bay, and an eastern zone (from Al Hoceima to Saïdia) with low abundance (<1000 ind.m−3) (Figure 9a). The same distribution pattern was observed for copepod and cladoceran abundances, as they dominate the mesozooplankton community (Figure 9b). Appendicularia and Chaetognatha were fairly abundant throughout, with a peak at Station 16. Meroplankton mainly consisted of the larval stage of decapods and was mainly distributed in coastal stations in the western part of the study area. Salps were commonly found at most stations and occasionally found in large numbers (361 ind.m−3 at Station 16). The other groups were sparsely represented in the surveyed area.
Cladocerans were represented by three species with the absolute dominance of Penilia avirostris (81.93% of the total cladocerans abundance), which appeared over the whole area, with the maximum abundance at Station 21 (1852 ind.m−3). Evadne nordmanni and Podon leuckartii constituted 13.51% and 4.55% of the total cladocerans abundance, respectively (Table 2).
The copepod community was represented by 27 species with a high contribution (31.18% of total copepods) of Paracalanus parvus with the maximum abundance located at Station 16 (1229 ind.m−3), followed by Temora stylifera (14% of total copepods), Oncaea venusta (12.71% of total copepods), and Clausocalanus furcatus (8.25% of total copepods) (Table 3).
The species richness of copepods along the study area varied from 6 to 13 species. In general, the Shannon index (H’) was >1.5 bits ind−1, and the regularity (J) diversity index was >0.3 with few differences (Figure 10). The maximum values of H’ (2.8 bits ind−1) and J (0.45) were registered in the west at Station 29 (near the M’diq bay). The lowest diversity was observed at Station 14 (H’ = 1.35 bits ind−1 and J = 0.2), characterized by a quasi-dominance of P. parvus, which represented more than 58% of the total copepod population.

3.5. Mesozooplankton Community Structure

Cluster and NMDS analyses based on the zooplankton abundance matrix identified two groups of stations corresponding to two distinctive zooplankton communities (Figure 11 and Figure 12). The first group (G1), located mainly in the eastern part of the study zone (Al Hoceima to Saïdia) with the lowest abundance of zooplankton, and the second group (G2), including stations located in the western area between M’diq and Al Hoceima with a higher abundance of zooplankton. As indicated by both the cluster dendrogram and the NMDS ordination plot, Station 16 displayed considerable dissimilarity with G1 and G2. This station is located in Al Hoceima Bay and is characterized by the maximum zooplankton abundance.
The SIMPER analysis conducted on mesozooplankton abundance data reveals significant contributors to the dissimilarity between groups. In the overall dataset, prominent contributors to dissimilarity included species like Podon leuckartii, Penilia avirostris, Paracalanus parvus, Evadne nordmanni, and Appendicularia, each displaying distinct average values and squared distances (Table 4). Notably, Penilia avirostris and Paracalanus parvus stood out as the most substantial contributors to dissimilarity between eastern and western zones, showcasing average values of 117 and 95.2 ind.m−3, respectively, and squared distances illustrating their prominent role in delineating the dissimilarity between these regions. The dissimilarity between eastern and western groups was predominantly influenced by Penilia avirostris, representing 50.3% of the dissimilarity contribution, followed by Paracalanus parvus at 17.7%. Other species, such as Evadne nordmanni, Appendicularia, and Oncaea venusta, also contributed significantly to the dissimilarity between these zones, emphasizing their role in shaping the distinct mesozooplankton communities in the eastern and western coastal regions. The considerable dissimilarity in species abundance between these zones underscores the spatial heterogeneity and distinct ecological characteristics along the Moroccan Mediterranean coast.

3.6. Relationships between Mesozooplankton Community and Environmental Variables

Two environmental parameters had a significant influence (p < 0.05) on the mesozooplankton community, as they explained 18.2% of the variation (Table 5) using DistLM. These parameters were then used in the dbRDA to illustrate their impact on the mesozooplankton community distribution.
The primary axis of the dbRDA (Figure 13) explained 22.3% of the total variation but 64.5% of the fitted variation within the linear model created by DistLM to analyze the environmental variables. The secondary axis described 4.4% of the total variation and 12.8% of the fitted variation. The configuration of mesozooplankton stations on the graph suggests two gradients of variation. The first gradient was determined by the longitude, creating a western and an eastern part. The second gradient was determined by the salinity variable, which distinguishes between stations with high salinity in the east (Mediterranean water) and stations with lower salinity (Atlantic water) in the west.

4. Discussion

Yebra et al. [50] suggested that the hydrodynamics of the Alboran Sea constrain both the vertical and horizontal distribution of the zooplankton. This assumption concerning the horizontal distribution of zooplankton was confirmed in our study, as we found that the environmental parameters (temperature, salinity, nutrients, and Chl-a), as well as the qualitative and quantitative richness of the zooplankton, varied according to longitudinal and cross-shore gradients due to the interplay between rich Atlantic surface waters and deeper Mediterranean waters.
Based on the hydrological parameters of the surface layer and mesozooplankton biomass, in the sampled water column, we propose to divide the studied area into two regions: the western zone (from M’diq to Al Hoceima) and the eastern zone (from Al Hoceima to Saïdia). The western zone is characterized by high concentrations of phosphates, nitrates, Chl-a, and dissolved oxygen, and lower water temperature and salinity. In the eastern zone, the concentration of phosphates, nitrates, Chl-a, and dissolved oxygen were lower compared to the western zone and were characterized by high surface temperature and salinity. This division was also noticed when applying PCA analysis based on the structure of the mesozooplankton biomass in relation to the environmental parameters (Figure 7). The same subdivision as in the PCA seems to govern the mesozooplankton abundances when examining their geographic distribution (Figure 9).
The cluster groups from the cluster analysis (Figure 11) were more obvious in the NMDS analysis conducted on the mesozooplankton abundance, where the presence of a subdivision in the study area was clear as it showed a grouping of sites belonging to the western zone and another grouping belonging to the eastern zone of the study area (Figure 12). The same pattern of area division was shown when using total abundance (Figure 9a) and total biomass (Figure 8).
The mesozooplankton and copepod abundance and diversity and mesozooplankton species richness were different between offshore and coastal stations (Supplementary Figures S3 and S4). In particular, a great dissimilarity was found as expected between the coastal and offshore stations for abundance, with high abundance for both total mesozooplankton and copepods in the coastal area. The coastal region is enriched by river discharge from the continent, delivering nutrients that stimulate the phytoplankton growth to these marine ecosystems, favoring high abundance of mesozooplankton species, which are herbivores or omnivores (Johnson and Allen 2005) [51].
The zooplankton community of the western Moroccan Mediterranean coast is more abundant; this result has been confirmed by Berraho et al. (2016) [22], where they found high copepod abundances. High phytoplankton biomass [52] was also recorded in this zone. This could be due to the closeness to the Strait of Gibraltar, which creates hydrodynamic movements from the flow from the Atlantic Ocean (Atlantic jet stream). In particular, the highest mesozooplankton abundance observed west of Al Hoceima is associated with the well-defined maximum chlorophyll-a concentration measured. This feature is probably associated with the eastern side of the permanent WAG, which supplies rich, modified Atlantic waters from the Spanish coasts.
Anthropic factors may also locally enrich the coastal domain, such as the presence of industrial and agricultural effluents, unauthorized tourist dwellings, or the disappearance of wetlands due to agricultural, urban, and industrial development [53]. However, the influence of the water movements of the gyres and the water coming from the Atlantic jet stream [18] could be considered the dominant influencing factors. Bryden and Stommel (1982) [54] suggested that the existence of an energetic WAG promotes the ventilation of the western Mediterranean deep water across the Strait of Gibraltar. This finding was also confirmed by Naranjo et al. (2012) [55] and García Lafuente et al. (2017) [56] using long-term temperature data obtained across the seafloor of the Strait of Gibraltar. In addition, the presence of sub-mesoscale vortices across the gyres has been observed in a variety of studies [16,17,18]; these are the places of high biological productivity due to the large vertical velocities involved.
Regarding mesozooplankton composition, the eastern area was slightly more diverse than the western area of the studied coast with 25 groups and 19 groups of mesozooplankton, respectively. Our results showed that the Moroccan Mediterranean coast is dominated by copepods and cladocerans during summer over the other mesozooplankton groups, representing 48% and 35% of the total count, respectively. Several studies involving zooplankton sampling with mesh sizes ranging from 147 to 200 microns showed the dominance of copepods in different Mediterranean ecosystems greater than 60% in the eastern and western Alboran Sea [57,58,59]. The dominance of copepods was previously demonstrated in the Moroccan Mediterranean [22,30] and in the Moroccan Atlantic coasts [36,37,60,61], as well as in the Canary Current Large Marine Ecosystem (CCLME) region [38]. Although samples were collected in these areas using nets with different mesh sizes, copepod dominance remains significant and consistent across all these zones. This consistency may highlight the importance of considering mesh size variations, particularly if the mesh size is too small, which could lead to an underestimation of the abundance of larger zooplankton. A total of 27 copepod species were recorded during this study period with 14 common species found in each domain of the investigated area. Furthermore, two species were found only in the western zone (E. acuta and C. helgolandicus), and a single species (S. crassus) was found only in the eastern zone. Some species were recorded only in either the eastern or transition zones but not in the western zone, such as C. pavo and C. contractus. Some other species were observed only in the western and transition zones, such as C. arcuicornis and S. magnus. The influx of Atlantic water could explain the presence of some rare species of Atlantic origin, such as S. magnus, which was recorded at a few stations. Zaafa et al. (2012) [30] recorded 103 zooplankton species on both sides of the Strait of Gibraltar during 2006–2007, with 61.2% of them common in both Atlantic and Mediterranean waters, while 21.4% were endemic to the Atlantic Ocean and 17.5% were endemic to the Mediterranean. The flow of the surface Atlantic water toward the Mediterranean Sea caused more transference of zooplankton species than in the opposite direction through the Strait of Gibraltar [38].
In our study, the most abundant copepod species, such as P. parvus, T. stylifera, O. venusta, C. furcatus, O. plumifera, and E. acutifrons, were frequently found in the western Mediterranean. According to Siokou-Frangou et al. (2010) [18], Zaafa et al. (2012) [30], and Berraho et al. (2016) [22], the dominance of small copepods, such as Clausocalanus, Calocalanus, Oithona, Oncaeidae, and Corycaeidae, represents the key feature of the structure of the mesozooplankton community in the Mediterranean Sea with an important contribution to species abundance and diversity of the zooplankton community, especially in the western zone [62]. Berraho et al. (2016) [22] also found that two species, P. parvus and O. nana, dominated the copepod community in April 2013 along the Moroccan Mediterranean coast.
The SIMPER analysis conducted on mesozooplankton abundance data from the Moroccan Mediterranean coast highlighted key species contributing to the dissimilarity between eastern and western coastal zones. Notably, species like Penilia avirostris and Paracalanus parvus emerged as pivotal contributors to the observed differences in mesozooplankton communities between these regions (Table 5). Penilia avirostris, specifically, accounted for 50.29% of the dissimilarity between eastern and western groups, emphasizing its substantial role in delineating distinct ecological patterns along the coast. This finding echoes previous studies, emphasizing the influence of hydrological gradients in shaping mesozooplankton distribution along coastal regions [63]. Additionally, Paracalanus parvus contributed significantly (17.69%) to the dissimilarity between zones, underlining its importance in characterizing the distinct mesozooplankton communities in these coastal areas during summer. These findings corroborate the significance of specific zooplankton species, such as Penilia avirostris and Paracalanus parvus, in reflecting the spatial heterogeneity of the Moroccan Mediterranean coast, indicating the influence of environmental parameters in structuring zooplankton communities [64].
Our study highlights the substantial influence of hydrological factors (e.g., longitude and surface salinity) on the complex structure of mesozooplankton communities along the Moroccan Mediterranean coast, aligning with prior research and emphasizing the pivotal role of environmental parameters in shaping these communities [64,65]. The observed longitudinal gradient likely stems from the intricate hydrodynamics within the Alboran Sea, where interactions between Atlantic and Mediterranean water masses generate pronounced environmental variations that intricately influence zooplankton distribution [18,66]. Moreover, the discernible differences in zooplankton communities linked to surface salinity variations between Mediterranean and Atlantic water stations echo previous findings, highlighting salinity as a primary determinant of zooplankton distribution and abundance [63,67]. Our analyses, particularly the DistLM and dbRDA, collectively demonstrate that longitude and surface salinity accounted for substantial variations in mesozooplankton abundance, reaffirming the significance of these factors in shaping the zooplankton distribution in marine ecosystems [68,69,70]. These findings accentuate the necessity for further investigations to elucidate the complicated intricate relationships between environmental parameters and zooplankton abundance within the Moroccan Mediterranean region.

5. Conclusions

This study highlighted large-scale spatial mesozooplankton distribution, diversity, and abundance, along with environmental parameters, across a large zone of the southern Mediterranean coast close to the Strait of Gibraltar, where such data are dramatically lacking. The results clearly showed the presence of a major longitudinal gradient, both physicochemically and biologically. The western zone (M’diq to Al Hoceima) was characterized by low temperatures and salinities and a high abundance of mesozooplankton, particularly copepods, with the highest nutrient levels. The eastern zone exhibited relatively high temperatures and salinities, low nutrient levels (PO4 and NO3), and significantly lower abundance of total mesozooplankton and copepods. Under the influence of both the Atlantic jet stream and the WAG, physicochemical parameters (temperature and salinity) appeared to be the main driving factors for shaping the mesozooplankton characteristics. To a lesser degree, phytoplankton could be also included in those factors. In this study, mesozooplankton sampling was conducted during a single period of time during the summer season. While this approach provided valuable insights into the community structure and environmental interactions during this peak period, it essentially limits our understanding of the temporal variability and dynamics of these communities. Mesozooplankton populations are known to exhibit significant seasonal fluctuations influenced by environmental changes such as temperature, food availability, and predation pressures. Consequently, the results presented here might not express the full range of annual mesozooplankton diversity and abundance. Further studies should consider multiple sampling periods throughout different seasons to capture a more comprehensive picture of these dynamic communities and to assess the reproducibility of our findings under varying environmental conditions.

Supplementary Materials

The following supporting information can be downloaded at: https://www.mdpi.com/article/10.3390/jmse12040674/s1, Figure S1: Chlorophyll-a concentration from the MODIS sensor during the same survey period; Figure S2: Distribution of bottom chlorophyll-a (µg L−1); Figure S3: Longitudinal comparison along the Moroccan Mediterranean coast of the mesozooplankton and copepod total abundance (ind.m−3) for coastal and offshore stations; Figure S4: Longitudinal comparison along the Moroccan Mediterranean coast of the species richness (RS) and the Shannon index (H’) for coastal and offshore stations.

Author Contributions

M.R.B.: Conceptualization, Methodology, Formal analysis, Investigation, Writing—original draft, Writing—review & editing; A.E.: Investigation, Methodology, Formal analysis, Writing—review & editing, Supervision; L.S.: Investigation, Methodology, Writing—review & editing; H.D.: Writing—review & editing; M.L.: Writing—review & editing; A.M.: Investigation; Y.G.: Investigation, Methodology; H.I.: Investigation; A.A.: Investigation; M.I.: Investigation; O.E.: Investigation, Methodology, Writing—review & editing, Supervision. All authors have read and agreed to the published version of the manuscript.

Funding

This research received no external funding.

Institutional Review Board Statement

Not applicable.

Informed Consent Statement

Not applicable.

Data Availability Statement

The data presented in this study are available on request from the corresponding author. The data are not publicly available due to privacy/ethical restrictions.

Acknowledgments

This work was carried out in the context of the pelagic ecosystem monitoring program of the Moroccan Mediterranean coast and supported wholly by the National Institute of Fisheries Research. The authors thank the program coordinators and the entire team that participated in the survey aboard the Moroccan Research Vessel Al Amir Moulay Abdellah. The authors would also like to thank the reviewers for their useful comments.

Conflicts of Interest

The authors declare no conflicts of interest. The funding sponsors had no role in the design of the study; in the collection, analysis, or interpretation of data; in the writing of the manuscript; and in the decision to publish the results.

References

  1. Bianchi, C.N.; Morri, C. Marine biodiversity of the Mediterranean Sea: Situation, problems and prospects for future research. Mar. Pollut. Bull. 2000, 40, 367–376. [Google Scholar] [CrossRef]
  2. Beaugrand, G.; Edwards, M.; Legendre, L. Marine biodiversity, ecosystem functioning, and carbon cycles. Proc. Natl. Acad. Sci. USA 2010, 107, 10120–10124. [Google Scholar] [CrossRef] [PubMed]
  3. Brander, K. Impacts of climate change on fisheries. J. Mar. Syst. 2010, 79, 389–402. [Google Scholar] [CrossRef]
  4. Burrows, M.T.; Schoeman, D.S.; Buckley, L.B.; Moore, P.; Poloczanska, E.S.; Brander, K.M.; Brown, C.; Bruno, J.F.; Duarte, C.M.; Halpern, B.S.; et al. The Pace of Shifting Climate in Marine and Terrestrial. Ecosyst. Sci. 2011, 334, 652–655. [Google Scholar] [CrossRef]
  5. Steinberg, D.K.; Landry, M.R. Zooplankton and the Ocean Carbon Cycle. Annu. Rev. Mar. Sci. 2017, 9, 413–444. [Google Scholar] [CrossRef] [PubMed]
  6. Keister, J.E.; Bonnet, D.; Chiba, S.; Johnson, C.L.; Mackas, D.L.; Escribano, R. Zooplankton population connections, community dynamics, and climate variability. ICES J. Mar. Sci. 2012, 69, 347–350. [Google Scholar] [CrossRef]
  7. Rice, E.; Stewart, G. Decadal changes in zooplankton abundance and phenology of long and Island Sound reflect interacting changes in temperature and community composition. J. Mar. Environ. Res. 2016, 120, 154–165. [Google Scholar] [CrossRef] [PubMed]
  8. Sánchez-Garrido, J.C.; Lafuente, J.G.; Fanjul, E.; Sotillo, M.G.; Santos, F.J.D.L. «What Does Cause the Collapse of the Western Alboran Gyre, Results of an Operational Ocean Model». J. Prog. Oceanogr. 2013, 116, 142–153. [Google Scholar] [CrossRef]
  9. Rohling, E.J.; Abu-Zied, R. The Marine Environment: Present and Past. In The Physical Geography of the Mediterranean; Jamie, W., Ed.; Oxford Academic: Oxford, UK, 2009. [Google Scholar] [CrossRef]
  10. Bergamasco, A.; Malanotte-Rizzoli, P. The circulation of the Mediterranean Sea: A historical review of experimental investigations. Adva. Oceanogr. Limn. 2010, 1, 11–28. [Google Scholar] [CrossRef]
  11. Vargas-Yáñez, M.; Plaza, F.; García-Lafuente, J.; Sarhan, T.; Vargas, J.M.; Vélez-Belchí, P. About the seasonal variability of the Alboran Sea circulation. J. Mar. Syst. 2002, 35, 229–248. [Google Scholar] [CrossRef]
  12. Seguin, G.; Gaudy, R.; Errhif, A.; Thibault, D. Observations on the abundance, taxonomic composition and ecological affinities of pelagic copepods collected from the Almeria-Oran frontal region. J. Mar. Life 1993, 3, 19–29. [Google Scholar]
  13. Gaudy, R.; Youssara, F. Variations of zooplankton metabolism and feeding in the frontal area of the Alboran Sea (western Mediterranean) in winter. Oceanologica Acta 2003, 26, 179–189. [Google Scholar] [CrossRef]
  14. Riandey, V. Etude de la Structure de Taille des Populations Zooplanctoniques Dans Différents Écosystèmes Marins. Apports des Nouveaux Appareils Automatisés D’observation. Ph.D. Thesis, Université de la Méditerranée—Aix Marseille II, Marseille, France, 2005; p. 372. [Google Scholar]
  15. Gómez, F.; Gorsky, G.; Striby, L.; Vargas, J.M.; Gonzalez, N.; Picheral, M.; García-Lafuente, J.; Varela, M.; Goutx, M. Small-scale temporal variations in biogeochemical features in the Strait of Gibraltar, Mediterranean side—The role of NACW and the interface oscillation. J. Mar. Syst. 2001, 30, 207–220. [Google Scholar] [CrossRef]
  16. Tintoré, J.; Gomis, D.; Alonso, S.; Parrilla, G. Mesoscale dynamics and vertical l motion in the Alborán Sea. J. Phys. Oceanogr. 1991, 21, 811–823. [Google Scholar] [CrossRef]
  17. García Lafuente, J.; Delgado, J. The Meandering Path of a Drifter around the Western Alboran Gyre. J. Phys. Oceanogr. 2004, 34, 685–692. [Google Scholar] [CrossRef]
  18. Siokou-Frangou, I.; Christaki, U.; Mazzocchi, M.G.; Montresor, M.; Ribera d’Alcala, M.; Vaqué, D.; Zingone, A. Plankton in the open Mediterranean Sea: A review. Biogeosciences 2010, 7, 1543–1586. [Google Scholar] [CrossRef]
  19. Mazzocchi, M.G.; Siokou, I.; Tirelli, V.; Bandelj, V.; Fernandez de Puelles, M.L.; Ak Örek, Y.; de Olazabal, A.; Gubanova, A.; Kress, N.; Protopapa, M.; et al. Regional and seasonal characteristics of epipelagic mesozooplankton in the Mediterranean Sea based on an artificial neural network analysis. J. Mar. Syst. 2014, 135, 64–80. [Google Scholar] [CrossRef]
  20. Zakaria, H.Y.; Hassan, A.M.; Abo-Senna, F.M.; El-Naggar, H.A. Abundance, distribution, diversity and zoogeography of epipelagic copepods off the Egyptian Coast (Mediterranean Sea). Egypt. J. Aquat. Res. 2016, 42, 459–473. [Google Scholar] [CrossRef]
  21. Khelifi-Touhami, M.; Semroud, R.; Hamdi, H.; Ounissi, M.; Haridi, A.; Nejib Daly, M.; Aissa, P. The planktonic copepod communi-ties from the southern Mediterranean Sea (Algeria, Tunisia) with a re-description of Paracalanus indicus Wolfen-den 1905 (Copepoda: Calanoida). Cah. Biol. Mar. 2007, 48, 327–337. [Google Scholar]
  22. Berraho, A.; Abdelouahab, H.; Charib, S.; Essarraj, S.; Larissi, J.; Abdellaoui, B.; Christou, E.D. Copepod community along the Mediterranean coast of Morocco (Southwestern Alboran Sea) during spring. Med. Mar. Sci. 2016, 17, 661–665. [Google Scholar] [CrossRef]
  23. Ounissi, M.; Laskri, H.; Khélifi-Touhami, M. Net-zooplankton abundance and biomass from Annaba Bay (SW Mediterranean Sea) under estuarine influences. Mediterr. Mar. Sci. 2016, 17, 519–532. [Google Scholar] [CrossRef]
  24. Alcaraz, M.; Calbet, A.; Estrada, M.; Marrasé, C.; Saiz, E.; Trepat, I. Physical control of zooplankton communities in the Catalan Sea. J. Prog. Oceanogr. 2007, 74, 294–312. [Google Scholar] [CrossRef]
  25. Fernandez de Puelles, M.L.; Alemany, F.; Jansá, J. Zooplankton time-series in the Balearic Sea (Western Mediterranean): Variability during the decade 1994–2003. J. Prog. Oceanogr. 2007, 74, 329–354. [Google Scholar] [CrossRef]
  26. Raybaud, V.; Nival, P.; Mousseau, L.; Gubanova, A.; Altukhov, D.; Khvorov, S.; Ibañez, F.; Andersen, V. Short term changes in zooplankton com-munity during the summer-autumn transition in the open NW Mediterranean Sea: Species composition, abundance and diversity. J. Biogeosciences. 2008, 5, 1765–1782. [Google Scholar] [CrossRef]
  27. García-Comas, C.; Stemmann, L.; Ibanez, F.; Berline, L.; Mazzocchi, M.G.; Gasparini, S.; Picheral, M.; Gorsky, G. Zooplankton long-term changes in the NW Mediterranean Sea: Decadal periodicity forced by winter hydrographic conditions related to large-scale atmospheric change. J. Mar. Syst. 2011, 87, 216–226. [Google Scholar] [CrossRef]
  28. Mazzocchi, M.G.; Licandro, P.; Dubroca, L.; Di Capua, I.; Saggiomo, V. Zooplankton associations in a Mediterranean long-term time-series. J. Plankton Res. 2011, 33, 1163–1181. [Google Scholar] [CrossRef]
  29. Zerouali, F.; et Melhaoui, M. Diversité Spécifique et Biomasse des Copépodes Pélagiques de la Région de Ras Kebdana (Côte Méditerranéenne Marocaine); Actes Institut Agronomique Vétérinaire: Maroc, North Africa, 2002; Volume 22, pp. 91–102. [Google Scholar]
  30. Zaafa, A.; Ettahiri, O.; Berraho, A.; Elkhiati, N.; Somoue, L.; Zizah, S.; Ramdani, M.; Blaghen, M.; Flower, R. A comparative study of marine zooplankton communities in the Tangier and M’Diq (Gibraltar strait) regions. Hydroécologie Appliqué 2012, 18, 67–80. [Google Scholar] [CrossRef]
  31. Furnestin, M.L. Chaetognathes et zooplancton du secteur atlantique Marocain. Rev. Trav. L‘institut Tech. Sci. Pêches Marit. 1957, 21, 1–356. [Google Scholar]
  32. Furnestin, M.L.; et Belfequih, M. Les copépodes du plateau continental marocain et du détroit canarien. II-Les espèces au cours d’un cycle annuel dans les zones d’upwelling. J. Cons. Int. Explor. Mer. 1976, 9, 22–46. [Google Scholar]
  33. Blackburn, N. Distribution of plankton biomass in an upwelling area off northwest Africa: Preliminary results from expedition joint–I. Coast. Upw. Ecosys. Anal (CUEA) News Lett. 1976, 5, 13–19. [Google Scholar]
  34. Belfequih, M. Les Copépodes du Plateau Atlanto-Marocain. Un Cycle Annuel Dans les Zones D’upwelling. Ph.D. Thesis, University Aix-Marseille I, Marseille, France, 1980; 126p. [Google Scholar]
  35. Boucher, J. Peuplement de copépodes des upwellings côtiers nord-ouest africains. II Maintien de la localisation spatiale. Oceanol. Acta 1982, 5, 199–207. [Google Scholar]
  36. Chiahou, B.; et Ramdani, M. Observations sur les variations de la densité et de la biomasse des copépodes pélagiques des côtes atlantiques marocaines (région d’El Jadida) au cours d’un cycle annuel. Mar. Life 1996, 6, 21–25. [Google Scholar]
  37. Somoue, L.; Elkhiati, N.; Ramdani, M.; Thong, L.H.; Ettahiri, O.; Berraho, A.; Thang, D.C. Abundance and structure of copepod communities along the Atlantic coast of Southern Morocco. Acta Adr. 2005, 46, 63–76. [Google Scholar]
  38. Berraho, A.; Somoue, L.; Hernandez-Leon, S.; Valdés, L. Zooplankton in the Canary Current Large Marine Ecosystem. Oceanographic and Biological features in the Canary Current Large Marine Ecosystem. IOC UNESCO Tech. Ser. 2015, 115, 183–195. [Google Scholar]
  39. Murphy, E. Spatial structure of the Southern Ocean ecosystem: Predator-prey linkages in Southern Ocean food webs. J. Anim. Ecol. 1995, 64, 333–347. [Google Scholar] [CrossRef]
  40. Robin, R.S.; Srinivasan, M.; Chandrasekar, K. Distribution of zooplankton from Arabian Sea, along Southern Kerala (Southwest Coast of India) during the cruise. Curr. Res. J. Biol Sci. 2009, 1, 155–159. [Google Scholar]
  41. Linder, S. A proposal for the use of standardized methods for chlorophyll determinations in ecological and eco-physiological investigations. Physiol. Plant 1974, 32, 154–156. [Google Scholar] [CrossRef]
  42. Strickland, J.D.H.; Parsons, T.R. A Practical Handbook of Seawater Analysis. Fish. Res. Board Canada 1972, 167, 405. [Google Scholar] [CrossRef]
  43. Aminot, A.; Chaussepied, M. Manuel des analyses chimiques en milieu marin. Cent. Natl. Pour L’exploitation Océans 1983, 551, 5–395. [Google Scholar]
  44. Motoda, S. Devices of simple plankton apparatus. Mem. Fac. Fish. Hokkaido Univ. 1959, 7, 73–94. [Google Scholar]
  45. Shannon, C.E.; Weaver, W. The Mathematical Theory of Communication; University of Illinois Press: Urbana, IL, USA, 1949; p. 117. [Google Scholar]
  46. Pielou, E.C. Species diversity and pattern diversity in the study of ecological succession. J. Theoret. Biol. 1966, 10, 370–383. [Google Scholar] [CrossRef] [PubMed]
  47. Clarke, K.R.; Warwick, R.M. Changes in Marine Communities: An Approach to Statistical Analyses and Interpretation; Natural Environment Research Council: Plymouth, UK, 1994. [Google Scholar]
  48. Anderson, T. The Theory and Practice of Online Learning; Athabasca University Press: Athabasca, AB, Canada, 2008. [Google Scholar] [CrossRef]
  49. Schlitzer, R. Ocean Data View. Available online: https://odv.awi.de (accessed on 1 May 2022).
  50. Yebra, L.; Herrera, I.; Mercado, J.M.; Cortés, D.; Gómez-Jakobsen, F.; Alonso, A.; Sánchez, A.; Salles, S.; Valcárcel-Pérez, N. Zooplankton production and carbon export flux in the western Alboran Sea gyre (SW Mediterranean). J. Prog. Oceanogr. 2018, 167, 64–77. [Google Scholar] [CrossRef]
  51. Johnson, W.S.; Allen, D.M. Zooplankton of the Atlantic and Gulf Coast; Johns Hopkins University Press: Baltimore, MA, USA, 2005. [Google Scholar]
  52. Idmoussi, H.; Somoue, L.; Peters, F.; Demarcq, H.; Laabir, M.; Estrada, M.; Arin, L.; Makaoui, A.; Ettahiri, O.; Baibai, T.; et al. Patterns of microphytoplankton biomass and diversity in the southern Alboran Sea. J. Med. Mar. Sci. 2021, 23, 103–114. [Google Scholar] [CrossRef]
  53. METAP. Le Programme D’Assistance Technique Pour la Protection de L’Environnement de la Méditerranée (Metap): Seize Années de Succès Dans L’Amélioration de L’Environnement Dans Les Pays du Maghreb. La Lettre D’information Trimestrielle du Groupe de la Banque Mondiale au Maghreb—Septembre 2006—N°3; 2006. Available online: http://hdl.handle.net/123456789/30291 (accessed on 1 July 2023).
  54. Bryden, H.L.; Stommel, H.M. Origin of the Mediterranean outflow. J. Mar. Res. 1982, 40, 55–71. [Google Scholar]
  55. Naranjo, C.; Lafuente, J.G.; Garrido, J.C.S.; Román, A.S.; Cabello, J.D. The Western Alboran Gyre helps ventilate the Western Mediterranean Deep Water through Gibraltar. Deep. Sea Res. Part I J. Oceanogr. Res. Rap. 2012, 63, 157–163. [Google Scholar] [CrossRef]
  56. García-Lafuente, J.; Naranjo, C.; Sammartino, S.; Sánchez-Garrido, J.C.; Delgado, J. The Mediterranean outflow in the Strait of Gibraltar and its connection with upstream conditions in the Alborán Sea. Ocean Sci. 2017, 13, 195–207. [Google Scholar] [CrossRef]
  57. Youssara, F.; Gaudy, R. Variations of zooplankton in the frontal area of the Alboran sea (Mediterranean Sea) in winter 1997. J. Oceanol. Acta 2001, 24, 361–376. [Google Scholar] [CrossRef]
  58. Chen, C.-T.; Bănaru, D.; Carlotti, F.; Faucheux, M.; Harmelin-Vivien, M. Seasonal variation in biochemical and energy content of size-fractionated zooplankton in the Bay of Marseille (North-Western Mediterranean Sea). J. Mar. Syst. 2019, 199, 103223. [Google Scholar] [CrossRef]
  59. Protopapa, M.; Zervoudaki, S.; Tsangaris, C.; Velaoras, D.; Koppelmann, R.; Psarra, S.; Möllmann, C. Zooplankton distribution, growth and respiration in the Cretan Passage, Eastern Mediterranean. Deep. Sea Res. Part II Top. Stud. Oceanogr. 2019, 164, 156–169. [Google Scholar] [CrossRef]
  60. Somoue, L. Structure des Communautés Planctoniques de L’écosystème Pélagique de L’atlantique sud Marocain Entre Cap Boujdor et Cap Blanc (26°30′–21° N). Ph.D. Thesis, Nationale, Faculty of Science Ain Chock, University Hassan II, Casablanca, Morocco, 2004; p. 211. [Google Scholar]
  61. El Arraj, L.; Tazi, O.; Somoue, L.; Hilmi, K.; Serghini, M.; Ettahiri, O. Diversity and Copepods’composition off Moroccan Atlantic Coast (Northwest Africa): A Review. Eur. Sci. J. 2017, 13, 272. [Google Scholar] [CrossRef]
  62. Gaudy, R. Features and peculiarities of zooplankton communities from the western Mediterranean. In Mediterranean Marine Ecosystems; Moraitou-Apostolopoulou, M., Kiortsis, V., Eds.; Plenum: New York, NY, USA, 1985; pp. 279–301. [Google Scholar] [CrossRef]
  63. González-Quirós, R.; Checkley, D.M.; Silva, N.; Freire, J.; Valdés, L. Effects of environmental conditions on the seasonal distribution of phytoplankton biomass in the upwelling ecosystem off central-southern Chile. J. Mar. Syst. 2010, 80, 1–19. [Google Scholar]
  64. Ramírez-Romero, E.; Palomera, I.; Sabatés, A. Environmental drivers of mesozooplankton biomass variability in the North-Western Mediterranean Sea. Prog. Oceanogr. 2018, 166, 227–240. [Google Scholar]
  65. Gallienne, C.P.; Robins, D.B.; Woodd-Walker, R.S. Abundance, variance and diversity of zooplankton in the sub-tropical Atlantic: A comparison of nepheloid layer and water column assemblages at the Mid-Atlantic Ridge. Deep. Sea Res. Part I Oceanogr. Res. Pap. 2004, 51, 365–382. [Google Scholar]
  66. Millot, C. Circulation in the Western Mediterranean Sea. J. Mar. Syst. 1999, 20, 423–442. [Google Scholar] [CrossRef]
  67. Gubanova, A.; Altukhov, D.; Mukhanov, V. Diversity and structure of zooplankton communities in the southeastern Black Sea in relation to environmental factors. Turk. J. Fish. Aquat. Sci. 2011, 11, 375–385. [Google Scholar]
  68. Kiørboe, T.P.; Sabatini, M.; Tiselius, P. The influence of viscosity on swimming and feeding of marine copepods. J. Exp. Mar. Biol. Ecol. 2002, 281, 61–75. [Google Scholar]
  69. Hsieh, C.H.; Reiss, C.S.; Hunter, J.R.; Beddington, J.R.; May, R.M.; Sugihara, G. Fishing elevates variability in the abundance of exploited species. Nature 2004, 427, 692–695. [Google Scholar] [CrossRef]
  70. Chiba, S.; Tadokoro, K.; Saino, T.; Nakata, H. Vertical distribution and community structure of mesozooplankton in the central Arctic Ocean in summer. Deep. Sea Res. Part I Oceanogr. Res. Pap. 2003, 50, 663–681. [Google Scholar]
Figure 1. Sampling area and position of stations in the Moroccan Mediterranean Sea. Alboran gyres (WAG, CCG, and EAG) are represented by the gray arrows.
Jmse 12 00674 g001
Figure 2. Distribution of the surface (a) temperature (°C) and (b) salinity (psu).
Jmse 12 00674 g002
Figure 3. Distribution of surface nutrients: (a) phosphates (PO4), (b) nitrates (NO3), and (c) silicates (Si) in µM.
Jmse 12 00674 g003
Figure 4. Distribution of surface chlorophyll-a (µg L−1).
Jmse 12 00674 g004
Figure 5. Distribution of surface dissolved oxygen (mL L−1).
Jmse 12 00674 g005
Figure 6. Vertical distribution of temperature (T in °C) and salinity (psu) of representative coastal and offshore stations.
Jmse 12 00674 g006
Figure 7. Two-dimensional PCA ordination of environmental variables: sea surface temperature (SST), sea surface salinity (SSS), dissolved oxygen (O2), nitrate (NO3), phosphate (PO4), chlorophyll-a surface concentration (Chl-a), and zooplankton wet weight biomass (ZPK-biomass). PC1 and PC2 account for 56.5% of the total variance.
Jmse 12 00674 g007
Figure 8. Spatial distribution of total mesozooplankton wet biomass (mg.m−3) eastward.
Jmse 12 00674 g008
Figure 9. Spatial distribution of (a) total mesozooplankton abundance (ind.m−3) eastward and (b) the abundances of total mesozooplankton, copepods, and Cladocera along the study area. CTF stands for Al Hoceima.
Jmse 12 00674 g009
Figure 10. Spatial variation of copepod diversity indices: Shannon index (H’) and Pielou index (J).
Jmse 12 00674 g010
Figure 11. Dendrogram for hierarchical clustering of the zooplankton sampling stations, using group-average linking of Euclidean distance calculated on fourth root transformed abundance data.
Jmse 12 00674 g011
Figure 12. Non-metric multidimensional scaling (NMDS) of the spatial variation in the structure of the mesozooplankton communities in the study area.
Jmse 12 00674 g012
Figure 13. Result of the distance-based redundancy analysis (dbRDA) showing the effect of the spatial variation in zooplankton community structure related to the predictor variables selected through the best linear models based on distance (DistLM).
Jmse 12 00674 g013
Table 1. Relative species abundance (Pi %) of mesozooplankton groups.
GroupsPi
Amphipoda0.07
Annelida0.1
Appendicularia5.3
Chaetognata 3.6
Cladocera35.6
Copepoda48.5
Meroplankton larvae of crustaceans1.5
Foraminifera0.004
Echinodermata larvae0.01
Gastropod Veliger1.6
Ostracoda0.1
Radiolaria0.3
Salpida1.9
Siphonophora1.4
Table 2. Relative abundance (Pi %) of cladoceran species.
SpeciesPi
Evadne nordmanni (Lovén, 1836)13.51
Penilia avirostris (Dana, 1849)81.93
Podon leuckartii (G.O. Sars, 1862)4.55
Table 3. Relative abundance (Pi %) of copepod species.
SpeciesPi
Acartia clausi (Giesbrecht, 1889) 3.07
Calanus helgolandicus (Claus, 1863)0.10
Calocalanus contractus (Farran, 1926)0.12
Calocalanus pavo (Farran, 1926)0.10
Centropages typicus (Krøyer, 1849)0.08
Clausocalanus arcuicornis (Dana, 1849)0.43
Clausocalanus furcatus (Brady, 1883)8.25
Eucalanus elongatus (Dana, 1848)3.44
Euchaeta acuta (Giesbrecht, 1893)0.93
Euterpina acutifrons (Dana, 1847)6.40
Farranula rostrata (Claus, 1863)1.82
Macrosetella gracilis (Dana, 1846)0.12
Microsetella norvegica (Boeck, 1865)0.24
Oithona nana (Giesbrecht, 1893)2.71
Oithona plumifera (Baird, 1843)6.71
Oncaea curta (Sars G.O., 1916)1.59
Oncaea venusta (Philippi, 1843)12.71
Paracalanus parvus (Claus, 1863)31.18
Pseudocalanus elongatus (Brady, 1865)3.65
Rhincalanus nasutus (Giesbrecht, 1888)0.40
Sapphirina intestinata (Giesbrecht, 1891)0.65
Saphirina sp. (Thompson, J.V. 1829) 0.21
Spinocalanus magnus (Wolfenden, 1904)0.12
Subeucalanus crassus (Giesbrecht, 1888)0.02
Subeucalanus monachus (Giesbrecht, 1888)0.02
Temora longicornus (Müller, 1785)0.78
Temora stylifera (Dana, 1849)14.00
Table 4. Distance-based linear model (DistLM) between mesozooplankton abundance, against environmental variables. Pseudo-F—multivariate analog to Fisher’s F test; P—significant p-values; Prop—proportion of variance explained by each predictor variable.
VariablePseudo-FPProp
LongE6.46730.0010.18235
Depth1.48280.1344.8643 × 10−2
TSS1.62350.0945.3013 × 10−2
SSS5.42890.0010.15768
O22.61770.0885.2836 × 10−2
Chl-a1.78090.0585.7859 × 10−2
Table 5. SIMPER analysis results of the mesozooplankton community between the east and west. Av. Value—average abundance; Contrib%—percentage of contribution; Cum.%—cumulative percentage of contribution.
Group EastGroup West
VariableAv. ValueAv. ValueContrib%Cum.%
Penilia avirostris11766360.9060.90
Pracalanus parvus95.230715.1976.09
Evadne nordmanni291015.3081.39
Appendicularia25.71173.7885.17
Oncaea venusta13.71463.4688.63
Temora stylifera43.21373.3691.99
Disclaimer/Publisher’s Note: The statements, opinions and data contained in all publications are solely those of the individual author(s) and contributor(s) and not of MDPI and/or the editor(s). MDPI and/or the editor(s) disclaim responsibility for any injury to people or property resulting from any ideas, methods, instructions or products referred to in the content.

