Article

YOLO-RSA: A Multiscale Ship Detection Algorithm Based on Optical Remote Sensing Image

1
National Ocean Technology Center, Tianjin 300112, China
2
College of Ocean Science and Technology, Tianjin University, Tianjin 300072, China
*
Author to whom correspondence should be addressed.
J. Mar. Sci. Eng. 2024, 12(4), 603; https://doi.org/10.3390/jmse12040603
Submission received: 17 February 2024 / Revised: 16 March 2024 / Accepted: 26 March 2024 / Published: 30 March 2024

Abstract

:
Currently, deep learning is extensively utilized for ship target detection; however, achieving accurate and real-time detection of multi-scale targets remains a significant challenge. Considering the diverse scenes, varied scales, and complex backgrounds of ships in optical remote sensing images, we introduce a network model named YOLO-RSA. The model consists of a backbone feature extraction network, a multi-scale feature pyramid, and a rotated detection head. We conduct thorough tests on the HRSC2016 and DOTA datasets to validate the proposed algorithm. Through ablation experiments, we assess the impact of each improvement component on the model. In comparative experiments, the proposed model surpasses other models in terms of Recall, Precision, and MAP on the HRSC2016 dataset. Finally, in generalization experiments, our proposed ship detection model exhibits excellent detection performance across various scenarios. The method can accurately detect multi-scale ships in the image and provide a basis for marine ship monitoring and port management.

1. Introduction

Since the 21st century, ocean development has emerged as a universal consensus among humanity. Leading maritime nations actively seize the initiative, dedicating efforts to explore the path of maritime development [1]. Ships, serving as pivotal carriers for ocean resource development and international trade, play an increasingly crucial role in maritime activities. With the continuous evolution and sophistication of maritime affairs, ship identification and detection are involved with multiple critical roles internationally, spanning defense construction, port management, cargo transportation, maritime rescue, and the suppression of illegal ships across various domains [2,3,4].
However, in response to the demands for extensive maritime ship monitoring and emergency management, the current ship monitoring systems exhibit certain limitations [5,6]. Firstly, with variations in environmental background, light intensity, sea surface topography, and other factors, the significant differences in ship visibility gradually increase. Secondly, large-scale maritime ship monitoring and emergency management impose higher requirements on the detection accuracy, stability, and reliability of ship detection systems [7,8]. Compared to Synthetic Aperture Radar (SAR) and hyperspectral images, optical remote-sensing images exhibit a higher resolution and lower noise [9,10,11]. As a result, during the ship detection process, optical remote-sensing images can more clearly extract the structural and textural information of ship targets, thereby presenting a richer and more detailed representation of ship scenes. Consequently, ship detection based on optical remote-sensing images has attracted widespread attention [12,13,14].
In the field of ship-object detection, ships in remote-sensing images exhibit a series of characteristics, including multi-scale, multi-aspect, small-size object, and complex backgrounds [15,16]. Firstly, ships exhibit characteristics of being multi-scale and multi-aspect in images. This necessitates ship detection models to possess robust scale adaptability and rotatedal invariance. Additionally, ships may manifest relatively small targets, adding to the difficulty of accurate detection and identification. Furthermore, the maritime environment may contain numerous other objects, such as buoys and waves, creating complex visual scenes that interfere with ship recognition. Moreover, complex environmental factors like sea waves, cloud cover, and changes in illumination can impact the clarity of ship images. However, corresponding to the aforementioned characteristics, the current ship detection methods, which are based on deep neural networks, are constrained by training on singular ship scenes, making it challenging to adapt to the diversity of ship features [17,18,19]. Therefore, the design of ship detection models capable of adapting to different detection scenarios has become a key focus in the current field of ship visual perception in remote sensing.
Object detection can be classified into two categories: traditional object detection (pre-2014) and deep learning-based object detection (post-2014) [20]. Ship-object detection is one application within the domain of object detection.
Firstly, image preprocessing is conducted, encompassing operations such as image enhancement or color space transformation. Subsequently, feature extraction is performed on the preprocessed images, wherein these features (typically classified into three major categories—texture features, shape features, and color features) are determined based on diverse visual attributes and feature computation methods [21]. Commonly employed feature detection algorithms include SIFT [22], HOG [23], SURF [12], and DPM [24]. Following this, various target detection methods, such as threshold segmentation [25], edge detection [26], and region growing [27], are employed to ascertain potential ship targets within the images. The final step involves ship identification and classification, wherein various methods are applied to further recognize and classify the detected ship targets, including the use of predefined ship feature templates or machine learning-based classifiers [28,29]. However, traditional ship detection algorithms typically rely on manually designed features, exhibit a limited capability for feature extraction, and possess poor robustness to noise and clutter. These algorithms face challenges in handling scale and orientation variations. Consequently, they fail to adequately capture the complex shapes, textures, and background variations associated with ships, resulting in diminished accuracy and efficiency in ship detection.
In recent years, with the rapid advancement of deep learning, an increasing number of researchers have begun to incorporate deep learning into the study of ship detection technology. Deep learning-based object detection methods can be broadly categorized into two types: two-stage detection and one-stage detection. Representative two-stage detectors include R-CNN, SSPNet [30], Fast R-CNN [31], Faster R-CNN [32], FPN [33], Mask RCNN [34], etc. Due to the separation of detection into two stages, two-stage detectors typically achieve higher accuracy, especially in small object detection and precise object localization. In contrast, one-stage detectors directly accomplish target detection and localization within a single feedforward network. They predict the category and location of the target end-to-end through a single network. Typical one-stage detectors include SSD [35], RetinaNet [36], CenterNet [37], FCOS [38], YOLO series [39], etc.
Since the inception of R-CNN, scholars have continuously improved general detection frameworks based on deep learning, progressively applying them to ship target detection. Matthijs et al. [40] achieved real-time ship detection and tracking systems by enhancing the SSD model to adapt to extreme variations in ship size and aspect ratio. Bousetouane et al. [41] leveraged Fast R-CNN for improvement, employing a low-cost weakly supervised detector based on handcrafted features for ship filtering and candidate box extraction. Kim et al. [42] proposed a probabilistic ship detection and classification system based on Faster R-CNN, enhancing ship detection accuracy through Bayesian fusion. Qi et al. [43] improved the Faster R-CNN target ship detection model through image down sampling, constructing a hierarchical downsizing network to enhance computational speed. Ye et al. [44] proposed a multi-scale feature detection network similar to SSD, improving maritime ship detection efficiency by adding a density module for feature reuse and incorporating contextual information. Sebastian et al. [45] introduced an SMD-based benchmark for maritime target ship detection, evaluating Faster R-CNN and Mask RCNN in addition to confirming the adaptability of SMD. Dilip et al. [46] explored evaluation metrics for object detection and proposed using bottom edge proximity as a new metric for maritime target detection. Wang et al. [47] proposed a maritime ship detection algorithm based on YOLOv3, applying dark channel dehazing to the original image and using YOLOv3 for real-time detection of the processed image. Miao et al. [48] improved Resnet-50 by using the Ghost Convolution module to construct a lightweight backbone. Zhuo et al. [49] based on the YOLOv7 algorithm, designed the SAS-FPN module, combining wireless spatial pyramid pooling and shuffle attention to enhance detection accuracy and multi-scale object detection capabilities.
The aforementioned methods have improved the accuracy of ship detection through various enhancements; however, some challenges persist. Optical remote sensing images exhibit characteristics such as multi-scale, multi-aspect, small-sized targets, and complex backgrounds when it comes to ship detection. Existing optical remote sensing ship datasets, however, often feature homogeneous ship scenes, potentially causing models to be biased towards dominant categories and perform poorly on minority classes, such as small-sized or specific types of ships. Additionally, a single ship scene may hinder the model’s ability to accurately detect targets in complex scenarios, leading to instances of both false positives and false negatives. These challenges need to be considered when designing ship detection methods that involve multi-scale, multi-aspect, and complex background features.
Addressing the aforementioned challenges and the need for marine ship detection algorithms, we have developed a high-performance multi-scale ship detection network named YOLO-RSA that has demonstrated excellent performances across various datasets. The main contributions of this paper are as follows:
  • To address significant scale variations in the detection of diverse objects in remote sensing ship images, we introduce a 4-layer multi-scale feature pyramid. Leveraging this pyramid, we integrate the multi-scale features of remote sensing ships through multi-level connections, with the goal of augmenting the saliency of features at varying scales and enhancing detection accuracy.
  • To effectively extract features from small ships in complex backgrounds, we introduce a mechanism that focuses on small ships to improve the success rate of extraction for medium and small-sized ships.
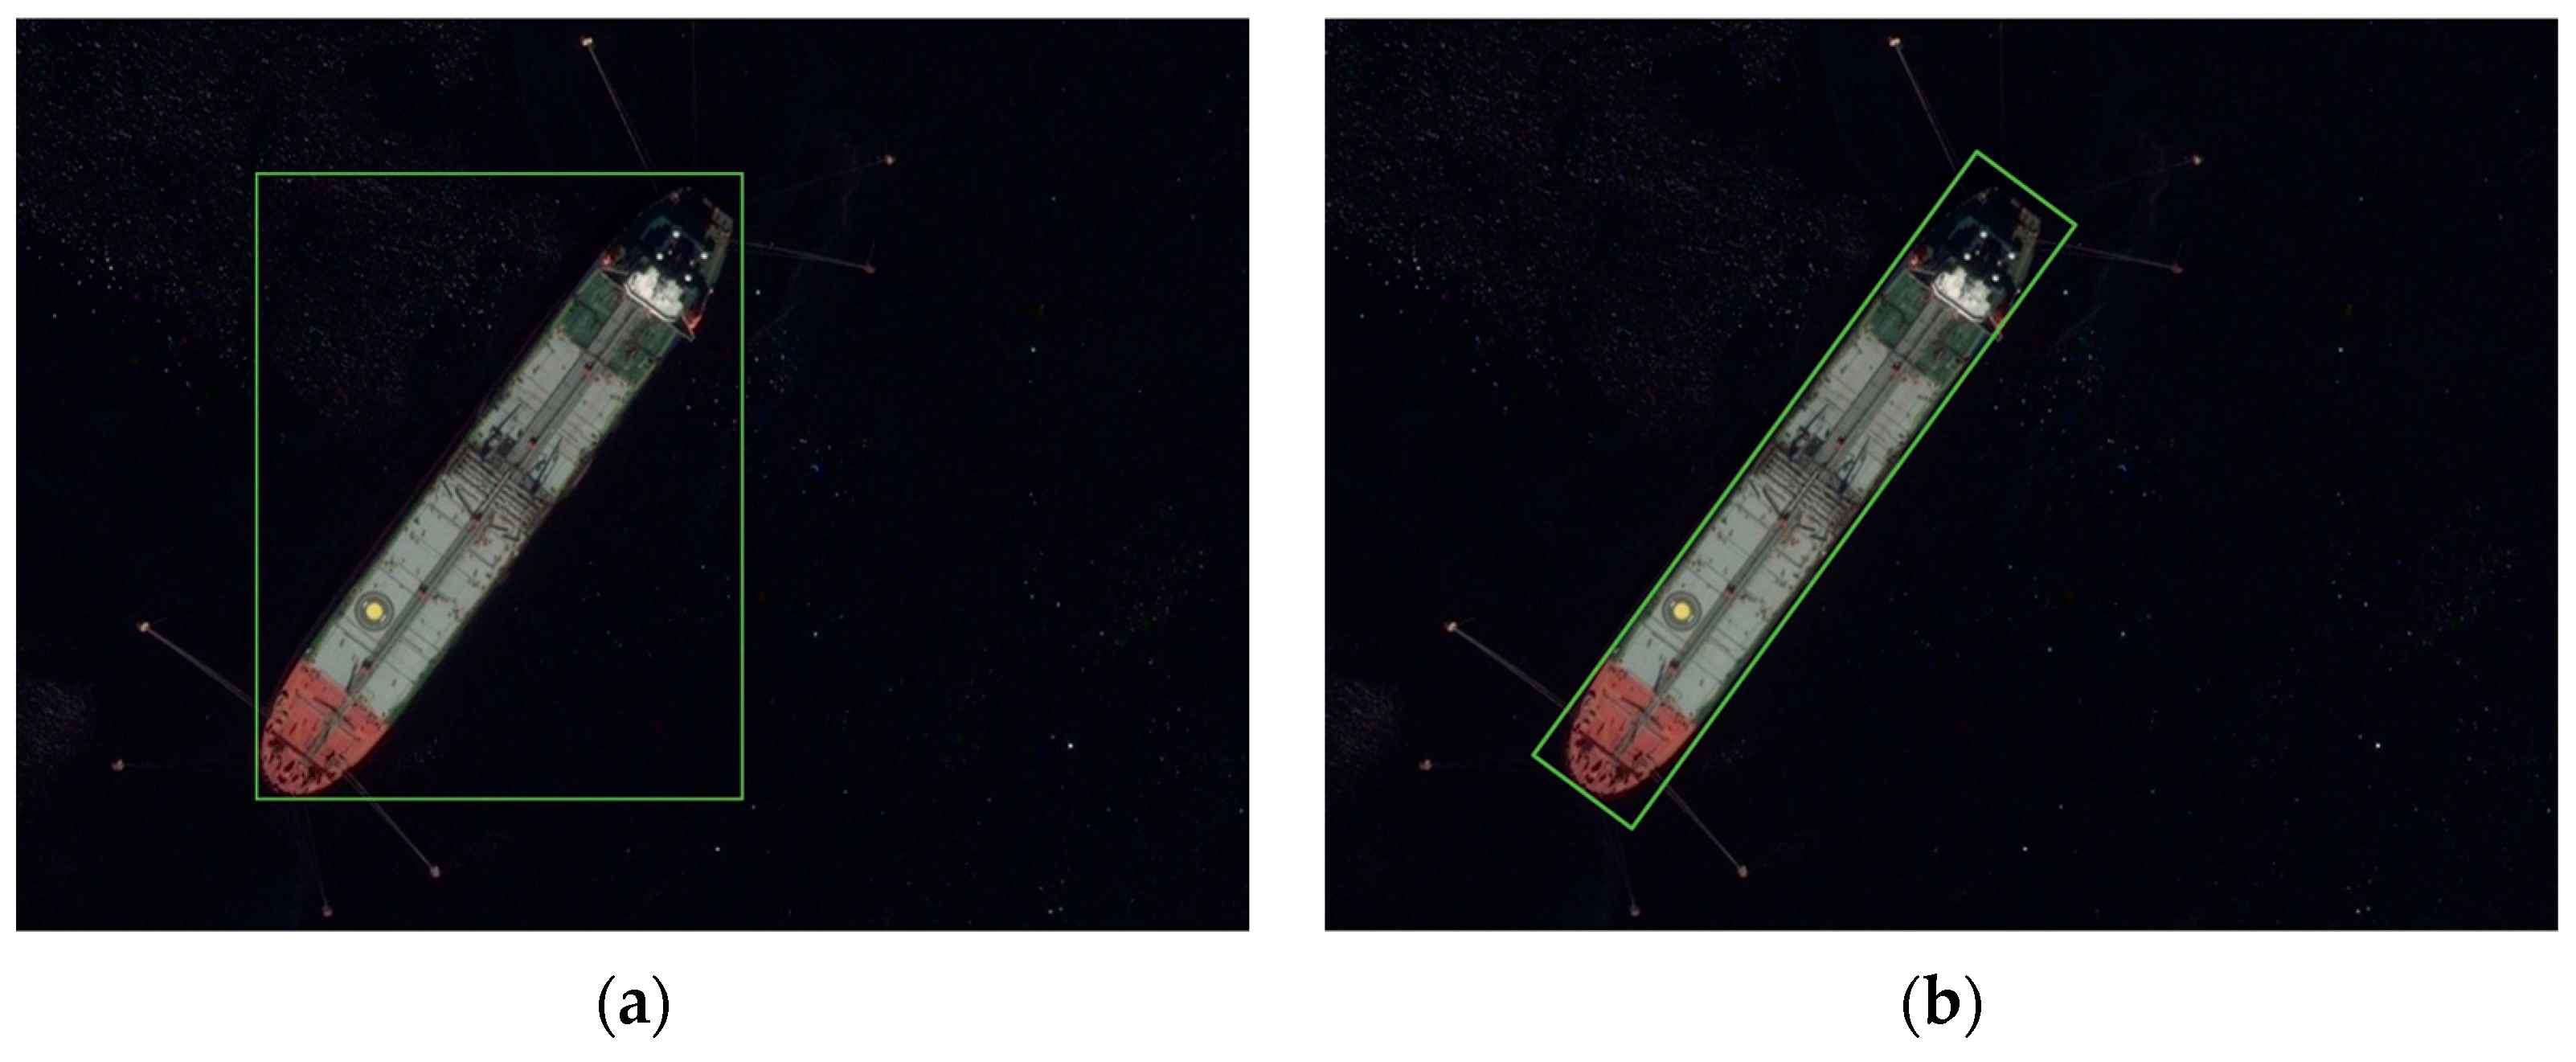
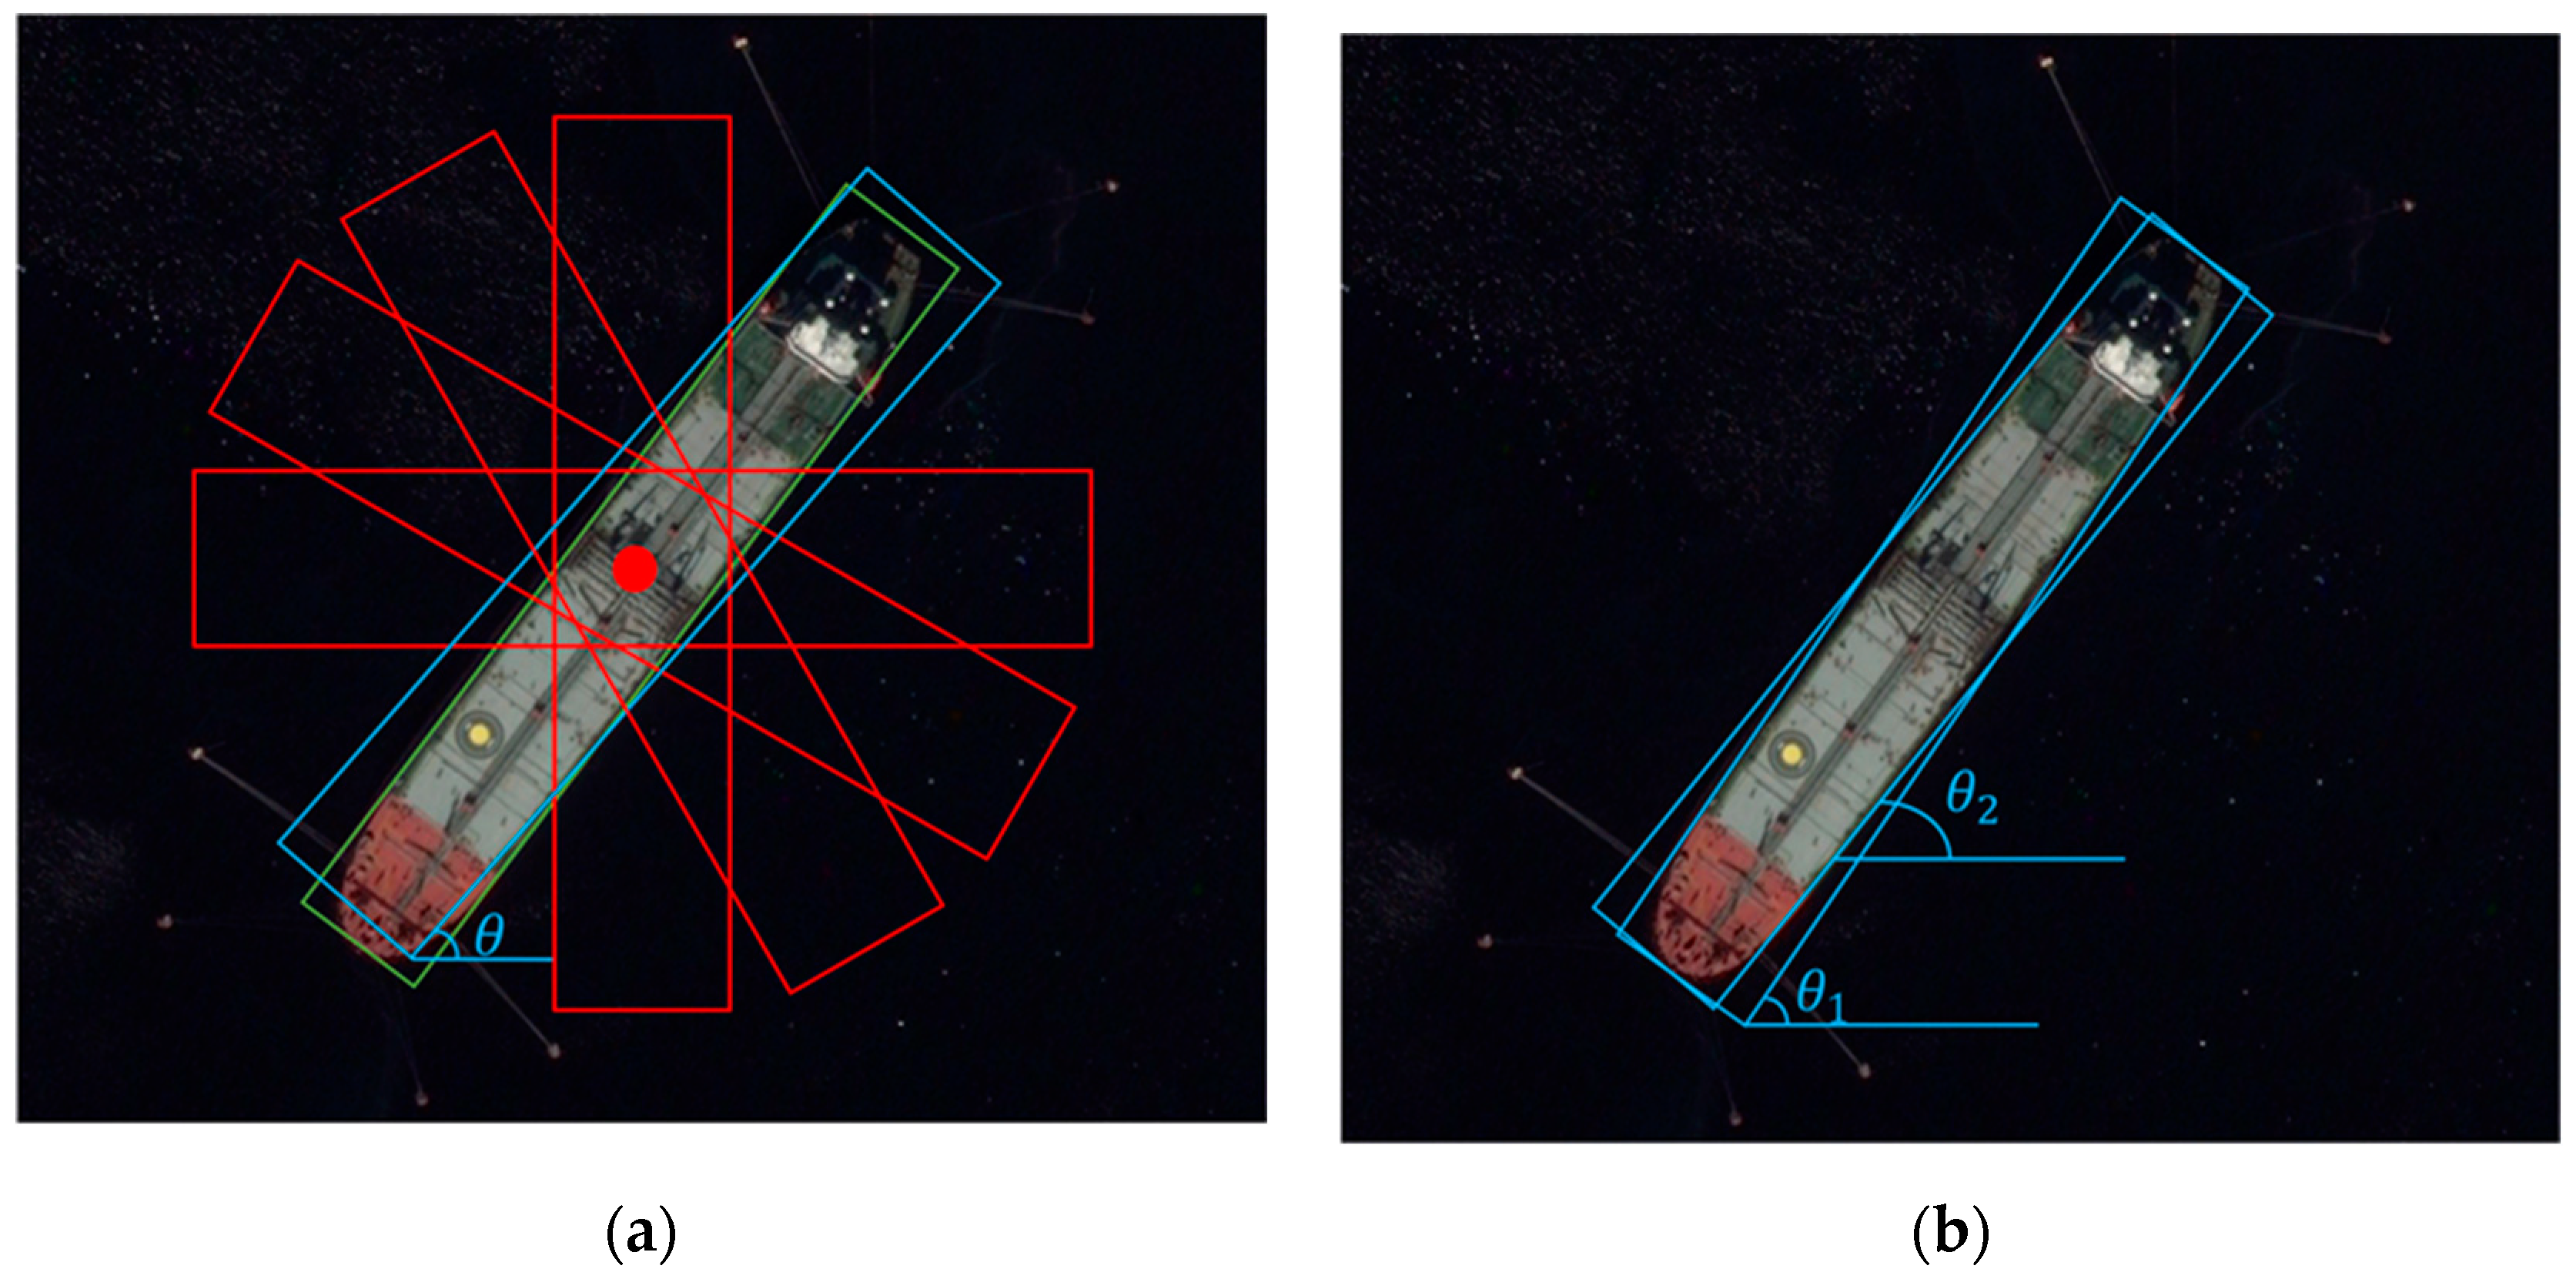
  • To improve the ship detection algorithm’s performance in crowded scenes, we introduce a rotated decoupling detection head during the detection stage, employing rotated bounding boxes instead of horizontal ones for ship extraction. Moreover, we enhance the angle prediction model by transitioning from direct angle prediction to predicting sine and cosine values.
  • On the HRSC2016 and DOTA datasets, we compare YOLO-RSA with three existing detection models in multiple ways, designing ablation experiments as well as Generalizability Experiments to demonstrate the excellent performance of YOLO-RSA.

2. Proposed Methods

2.1. Cross-Level Feature Extraction Network

The overall YOLO-RSA framework consists of three essential modules: the feature extraction network module, a 5-layer FPN structure, and the rotated box detection module. The procedure is delineated as follows: Initially, pre-processed optical remote sensing ship images are input into the feature extraction network module for preliminary feature extraction. Subsequently, the derived features are channeled into the 5-layer FPN structure to accomplish the integration of multi-scale features associated with remote sensing ships, thereby generating spatial and semantic data of heightened refinement. Subsequent to this, feature maps of varying scales are directed to the rotated box detection network module for the prediction of rotated detection boxes. The predicted outcomes undergo iterative optimization through a loss function, and, ultimately, following non-maximum suppression, the conclusive detection results are obtained. The main flow of the algorithm is shown in Figure 1.

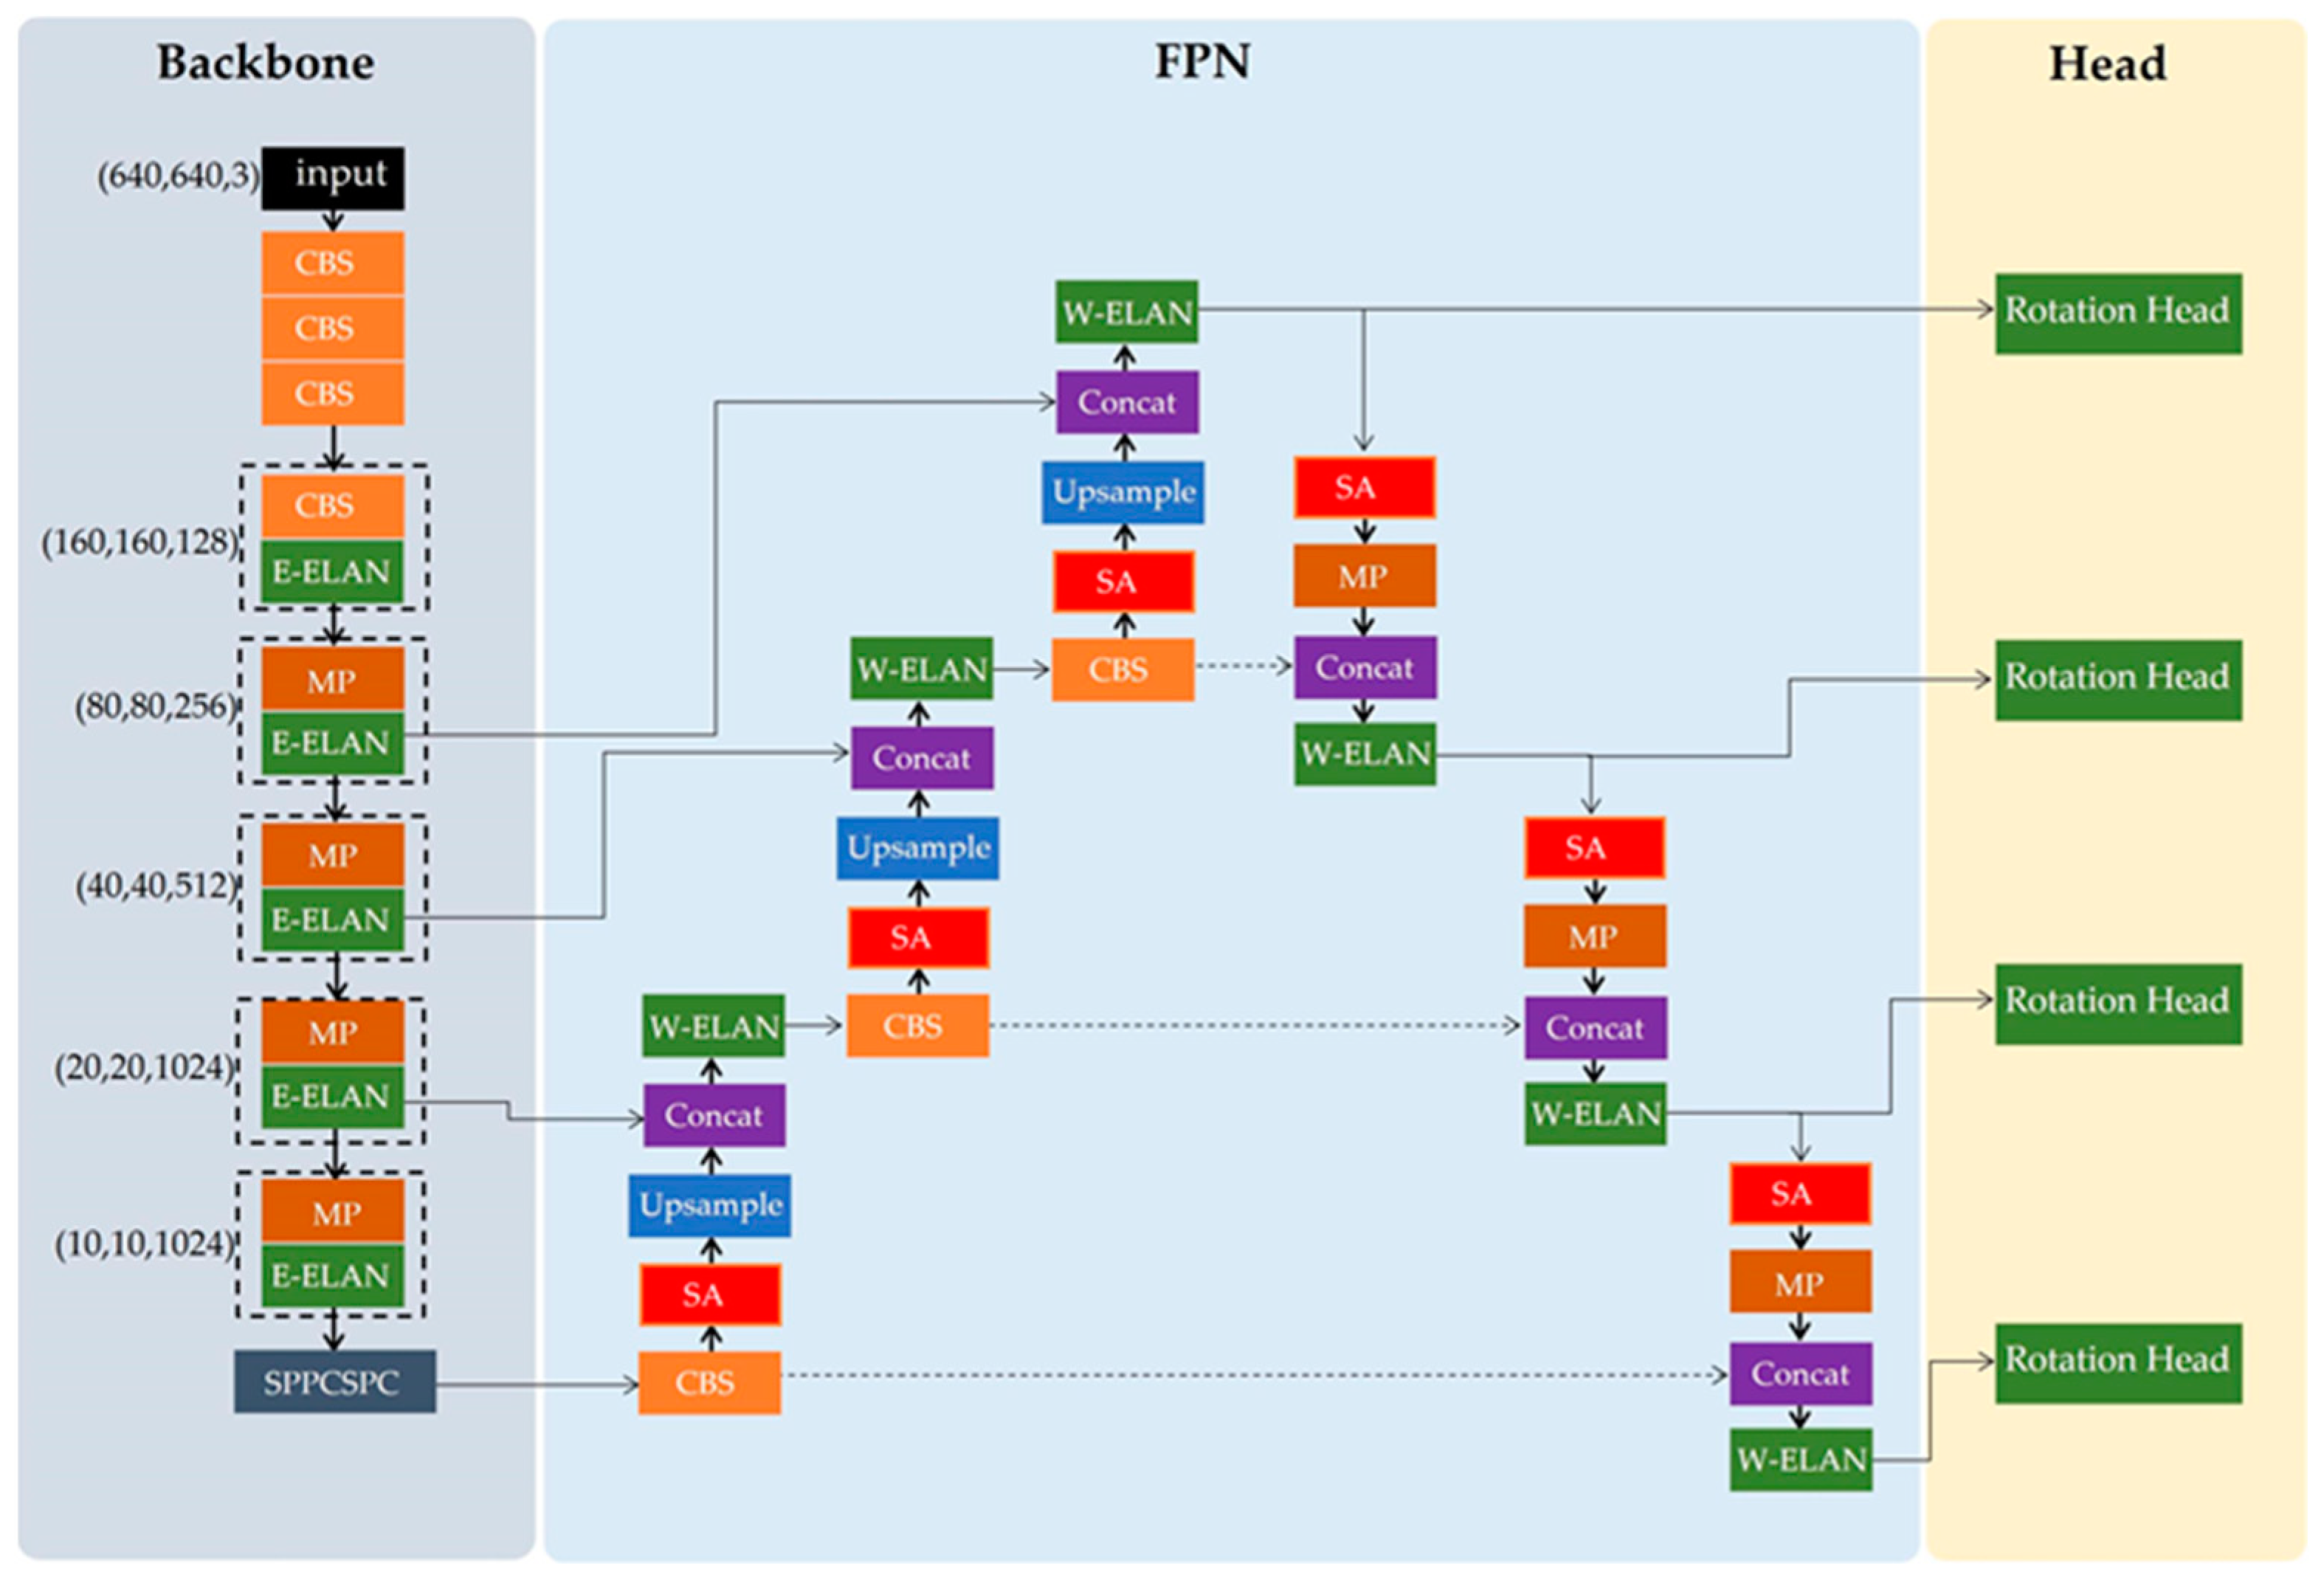
2.2. Model Structure

The detailed model structure is depicted in Figure 2, delineated into three principal components: the backbone, multi-scale feature pyramid, and rotated detection head. Given the distinctive attributes observed in optical remote sensing images, where ships manifest characteristics encompassing multiple scales, orientations, small target sizes, and complex backgrounds, this study proposes a Feature Pyramid Network incorporating a 4-layer pyramid structure. Additionally, a Small Ship Attention Mechanism (SA) is introduced to specifically address small-scale ship targets, augmenting the salient features across various scales and enhancing the precision of small target ship detection.

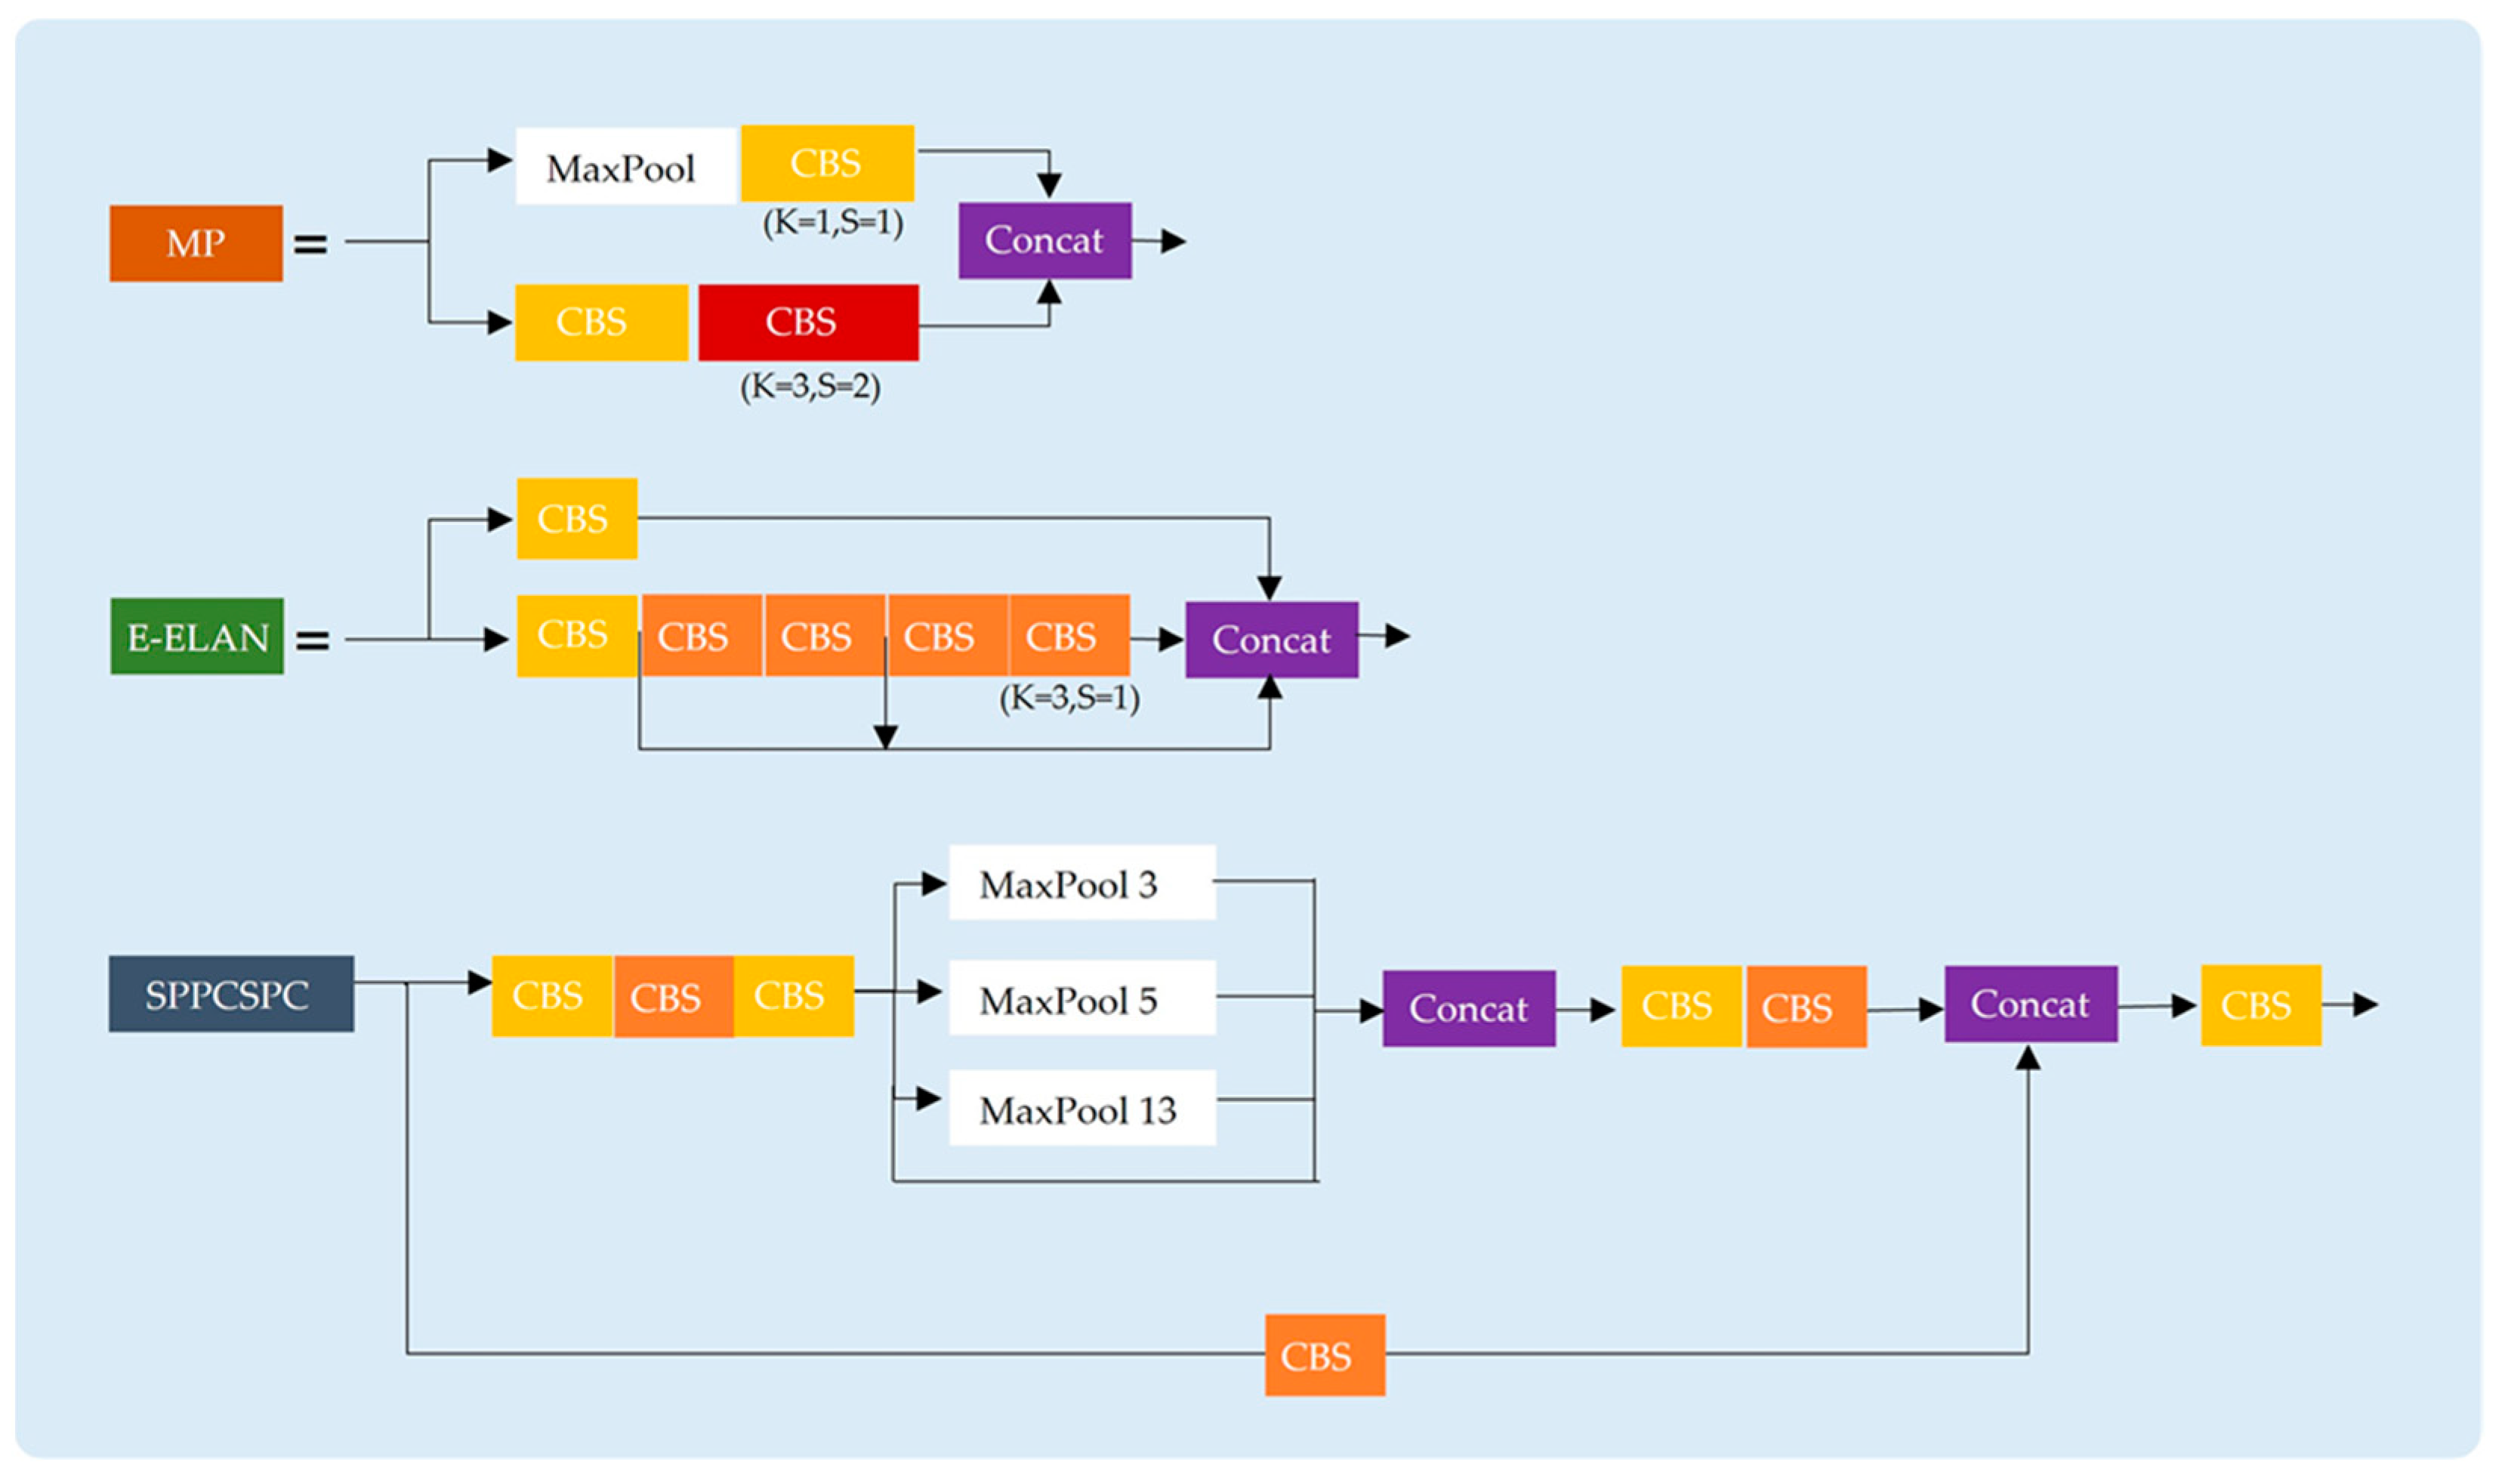
2.2.1. Backbone Network

The primary function of the backbone network is to extract features from the image, as depicted in Figure 2. It comprises CBS convolutional layers, E-ELAN convolutional modules, MP convolutional modules, and SPPCSPC modules. The CBS convolutional layer’s role is to extract features of various scales from the image, and the E-ELAN convolutional module enhances the network’s learning capabilities by adjusting computation blocks. It serves as an efficient aggregation network, notable for retaining the original transition structure during computation block adjustments. The MP-Conv convolutional module combines the down sampling results of maximum pooling and convolutional blocks, enlarging the receptive field, reducing computational complexity, and effectively propagating global information; regarding the SPPCSPC module, its distinctive feature lies in its ability to use four different scale sizes of maximum pooling, adapting to various resolutions and better distinguishing objects of different scales. The structures of these modules are detailed in Figure 3.

2.2.2. 4-Layer Multi-Scale Feature Pyramid

The multiscale feature pyramid proposed in this paper is an improvement based on FPN. The FPN network generates three new feature layers through lateral connections and adjacent upper feature layers, producing richer semantic features. However, optical remote sensing ship images possess characteristics such as high background complexity, low contrast, small target sizes, and multiscale variations, which differ from traditional images. The semantic features of ships extracted by the FPN algorithm may not be comprehensive enough; therefore, building upon the FPN structure, this paper introduces a 4-layer multi-scale feature pyramid. By increasing the number of feature layers on the basis of the FPN network, the salience of features for objects at different scales is enhanced.
Specifically, we choose the four different resolution feature layers conv 3, conv 4, conv 5, and conv 6 modules of the final output of the backbone network to form the bottom-up network. As shown in Figure 2, if the image size of the input feature extraction network is H × W pixels, the pixels of the feature maps of the four convolutional layers are H/8 × W/8, H/16 × W/16, H/32 × W/32, and H/64 × W/64. Regarding the construction of the bottom-up network, the input of the feature maps for each layer consists of the output of the up-sampled feature layer of the top layer of the network after enhancement by the shuffle attention module [50] and the output of the corresponding feature layer in the corresponding bottom-up network after 1 × 1 convolution. After this process, we can obtain the multilevel cross-layer feature fusion of the pyramid network. This not only achieves the fusion of multi-scale features of remotely sensed ships, but also enables the model network to suppress environment-induced interference to detect targets at different scales, as each feature layer is enhanced by the shuffle attention module.

2.2.3. Small Ship Attention Mechanism

Due to the characteristics of small size and complex backgrounds in optical remote sensing ship images, conventional ship detection methods are susceptible to interference when detecting small ships, resulting in both missed detections and false alarms during the detection process. Additionally, attention mechanisms in small ship detection often face challenges in the presence of complex backgrounds. To address this issue, this paper proposes a Small Ship Attention Mechanism.
In this mechanism, the shuffle attention module is introduced into the feature pyramid, continuously enhancing the network through pyramid fusion. This enables the network to consider the same tokens in different orders and relationships. The module effectively suppresses interference caused by the environment, improving the model’s performance and enhancing the detection of small targets more effectively. Specifically, for a given feature map X R H × W × C   , the first step of this method involves grouping the input features into G (we set the value of G to 64 in this paper) groups along the channel dimension. Each group of features is then split into two branches, X k 1 R H × W × C / 2 G and X k 2 R H × W × C / 2 G ( k 1 , , G ), along the channel dimension. The X k 1 branch is used to learn channel attention features and the X k 2 branch is utilized for learning spatial attention features.
Channel attention focuses on the crucial “what” factor, and the process is described as follows:
s = F g p X k 1 = 1 H × W i = 1 H j = 1 W X k 1 i , j
X k 1 = σ F c s X k 1 = σ W 1 s + b 1 X k 1
where W 1 R 1 × 1 × C / 2 G and b 1     R 1 × 1 × C / 2 G parameters used to scale and shift s.
In contrast to channel attention, spatial attention concentrates on the crucial “where” factor and serves as a complement to channel attention. In implementation, Group Norm is initially applied to process X k 2 for obtaining statistical information at the spatial level. The process is described as follows:
X k 2 = σ W 2 G N X k 2 + b 2 X k 2
where W 2 and b 2 are parameters with shape R 1 × 1 × C / 2 G . By introducing the shuffle attention module into the multiscale feature pyramid, the Small Ship Attention Mechanism enhances the model’s pixel recognition performance for small ship targets in low-contrast and small-sized conditions.

2.2.4. Rotated Detection Head

The function of the rotated detection head is to produce a rotated bounding box in an arbitrary direction. The traditional horizontal detection box is limited for an object with a big length–width ratio. As can be seen from Figure 4a, due to the feature of the big length–width ratio of the remote-sensing ship, the horizontal bounding box can bring up many redundant pixels not belonging to the ship, causing a deviation in the positioning result. In addition, in crowded scenes, a lot of overlap among the ground true of horizontal bounding boxes of multiple ships produces a big IOU value, which will cause the ground true to be filtered out in NMS, cause the correct proposal region to be discarded, and result in missing detection, which can be clearly seen in Figure 5.
Due to the limitations of the horizontal detection box, we use a rotated box detection head in the inspection section to inspect the ships.
This paper’s model incorporates a rotated box detection head during the detection phase, producing output that includes confidence scores p, horizontal box regression parameters u, and rotated box regression parameters v. As shown in Figure 6, the detection head can be divided into the following main components:
  • FPN Features: extracted feature layers through the feature extraction network, utilized for subsequent RPN layer and proposal extraction.
  • RPN: This network is used for generating candidate boxes. The tasks involve two aspects: firstly, classification, determining if there is a target within all predefined anchors; secondly, bounding box regression, refining anchors to obtain more accurate proposals.
  • RoI Pooling: Region of Interest Pooling is employed for collecting proposals generated by RPN. It extracts feature maps from FPN Features to generate proposal feature maps.
  • Fully Connected Layer: Classification and Regression, utilizing proposal feature maps to compute specific categories. Simultaneously, another round of bounding box regression is performed to obtain the final precise position of the detection box.
  • Three prediction branches: output three parameters, confidence score p, horizontal box regression parameter u, and rotated box regression parameter v.
Figure 6. Schematic diagram of Rotated Detection Head.
Jmse 12 00603 g006

2.2.5. The Sine–Cosine Angle Prediction Branch

A rotated box is typically represented as x ,   y ,   w ,   h ,   θ , with the angle θ presenting a challenge.
The traditional method of rotated box angle prediction is shown in Figure 7a. If we generate a red box with the size, as shown in the figure at the red point, and rotate the box around the red dot, generating an anchor for every fixed angle (which you can choose yourself), we can see that, when the red box is rotated to the position of the blue box, it is able to match more closely with ground truth (the green box) and generate a more appropriate anchor; in the same way, with the corresponding use of the blue region to generate the proposal angle information θ , the relationship between proposal and ground truth will be closer than using the horizontal box. Afterwards, by inputting a rotated proposal with angle θ , a standard pooling result can be returned, which can be connected to a structure similar to ROI Head to further predict the angle of the target rotated box.
Traditional angle prediction methods predict angles directly, but in real application scenarios, the number of ground truth on a graph may be up to dozens (such as dense ship scenarios), and then this angle prediction method will prove excessively slow, mainly because you need to generate enough boxes at each position. If you increase the size of the rotating anchor for speed, the accuracy is bound to drop; thus, this paper introduces a novel representation method for the rotated box. Rather than directly predicting θ , we choose to predict the sine and cosine values. Introducing additional corrective degrees of freedom improves the speed as well as the accuracy of the prediction. As shown in Figure 7b, when generating two close proposed regions, we receive two angle information, θ 1 and θ 2 , and we use this angle information as an intermediate variable by setting v s i n = s i n θ 1 , v c o s = c o s   θ 2 . The sine–cosine angle prediction branch initially generates intermediate result v = v x , v y , v w , v h ,   v c o s , v s i n . Subsequently, a custom layer is employed to refine v c o s , v s i n into v c o s , v s i n . The custom layer’s specific calculation method is outlined as follows:
v c o s = v c o s v c o s 2 + v s i n 2
v s i n = v s i n v c o s 2 + v s i n 2
As a result, there is no need to keep repeatedly generating proposals, which can avoid generating too many boxes that would affect the speed of detection while, at the same time, making the predictions more accurate.
Figure 8 shows an example of a heatmap for ship detection. The heatmap of the detection using the conventional angle prediction module is shown in Figure 8b, in which the positive sampling region of the ship is somewhat different from the real boundary of the ship. In contrast, the positive sampling region of the heat map of the detection result using the positive cosine angle prediction module shown in Figure 8c is closer to the real situation.

2.2.6. Loss Function

In this work, the model refrains from directly predicting the five degrees of freedom for the rotated box x ,   y ,   w ,   h ,   θ , instead predicting six degrees of freedom x ,   y ,   w ,   h ,   s i n θ ,   c o s θ . In combination with the classification loss and regression loss, the expression of the loss function in the multi-task form of the ship detection network is:
L p , u , v = L c l s p , p + p · [ λ 1 · L r e g H u , u + λ 2 · L r e g R v , v
In the equation, L represents the loss of the model in the second stage; p and p denote the true label and predicted confidence of the candidate region, respectively; u and u represent the true horizontal box regression parameters and predicted horizontal box regression parameters of the candidate region; v and v represent the true rotated box regression parameters and predicted rotated box regression parameters of the candidate region; the constants λ 1 and λ 2 serve as balancing factors for the losses in the three categories and are both set to one in the conducted experiment.; L c l s is the loss function for confidence; and   L r e g H   and   L r e g R are the loss functions for horizontal box regression parameters and rotated box regression parameters. The function L c l s uses the cross-entropy loss function, defined as follows:
L c l s p , p = l o g p p
The rotated box regression loss function L r e g R , defined as follows
L r e g R v , v = S m o o t h L 1 v , v
Of   which   S m o o t h L 1 m = 0.5   m 2 ,         m < 1 m 0.5 ,     m 1

3. Experiments and Results

3.1. Experimental Platform

The experimental platform is based on the high-performance host with AMD Ryzen 75800 H with Radeon Graphics CPU ((Lenovo Group, Beijing, China), 16 GB DDR4 3200 MHz RAM (Lenovo Group, Beijing, China), NVIDIA GeForce RTX 3060 Laptop GPU (6 GB, Lenovo Group, Beijing, China), while the operating system is Windows 11. PyTorch 1.10.1, based on Python 3.9.1, was used as the development language; moreover, CUDA 11.6 and CUDNN 8.6.0 were adopted to accelerate training on the GPU device.

3.2. Experimental Parameters

The initial learning rate is set to 0.01, the optimization method is Adaptive Moment Estimation (Adam), the initial learning rate is set to 0.01, and the batch size is set to 10. The dataset HRSC2016 has a training time of 112 s per epoch and the dataset DOTA has a training time of 127 s per epoch.

3.3. Datasets

(1)
HRSC2016
The HRSC201 dataset, derived from six prominent ports in Google Earth, was released by Northwestern Polytechnical University in 2016. This dataset utilizes two annotation formats: Horizontal Bounding Box (HBB) and Oriented Bounding Box (OBB). The image dimensions span from 300 × 300 to 1500 × 900 pixels. The officially provided training and test sets, equipped with rotated boxes, comprise 1061 images, encompassing a total of 2976 ship instances. The training set comprises 617 images with 1702 instances, while the test set includes 444 images with 1274 instances.
(2)
DOTA
The DOTA dataset consists of 2806 optical images with dimensions ranging from 800 × 800 to 4000 × 4000 pixels, covering 188,282 instances distributed across 15 categories [51]. In this study, we specifically leverage images from DOTA annotated with rotated boxes, concentrating on instances related to ships. The officially provided training and test sets display notable variations in image sizes, surpassing the dimensions of 1000 × 1000 pixels. Consequently, we performed appropriate cropping on the official dataset, resulting in an experimental dataset comprising 1014 images and containing 79,824 instances.
Table 1 presents detailed information about the datasets used in the experiments, including the number of images, instances of ships, image dimensions, and resolution. Due to the primary purpose of the DOTA dataset, which is to provide high-resolution aerial images for object detection and classification, and not to emphasize precise geographical coordinates or geodetic accuracy, the dataset does not provide the exact geographical resolution of the images.

3.4. Evaluation Indicators

We use precision (P), recall (R), and average precision (AP) as evaluation metrics for our proposed model. The better the model, the higher the values of P, R, and AP. MAP is the mean value of multiple classes of AP, and there is only one class in our dataset, so in this experiment, the value of MAP is the value of AP.
Precision and recall are calculated as follows:
P = T P T P + F P
R = T P T P + F N
where TP is the number of ship targets detected correctly, FP is the number of ship targets detected incorrectly, and FN is the number of ship targets that were missed. The AP is the average of the accuracies obtained for IOU at 0.05 intervals between 0.5 and 0.95 and can be calculated by using both precision and recall, The calculations are as follows:
A P = 0 1 P R d R
m A P = 1 N i = 1 N A P i  

3.5. Results

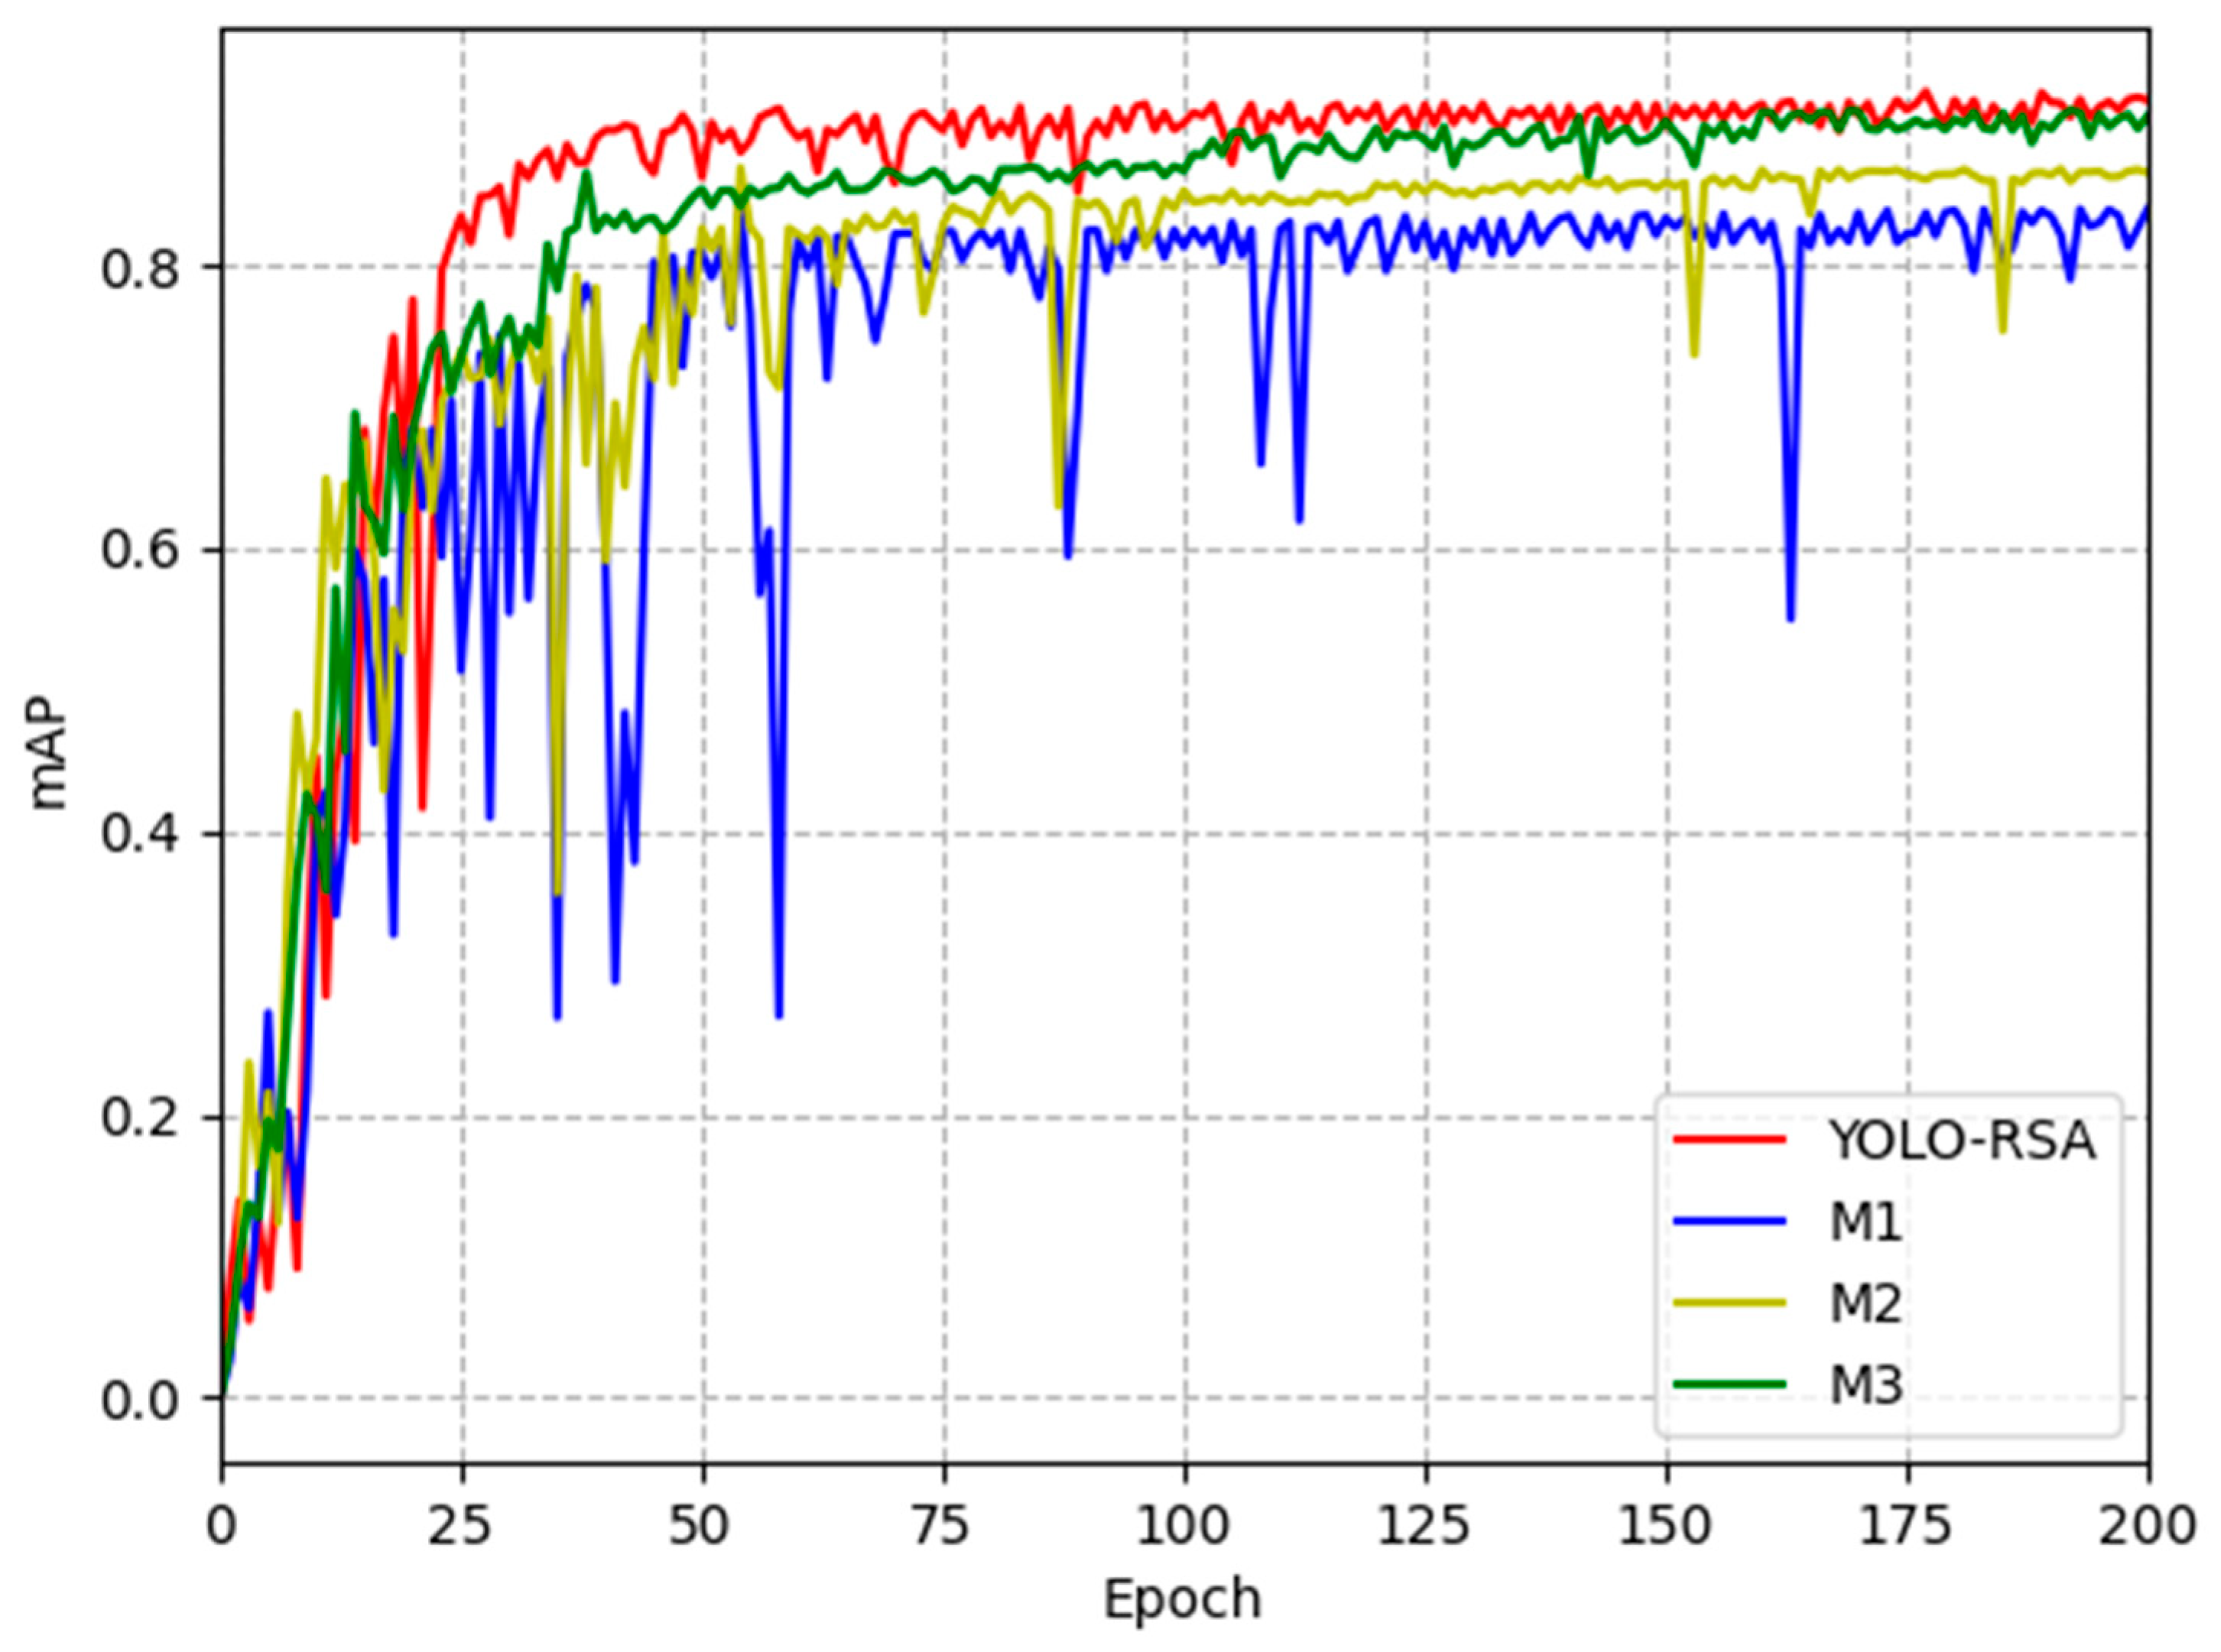
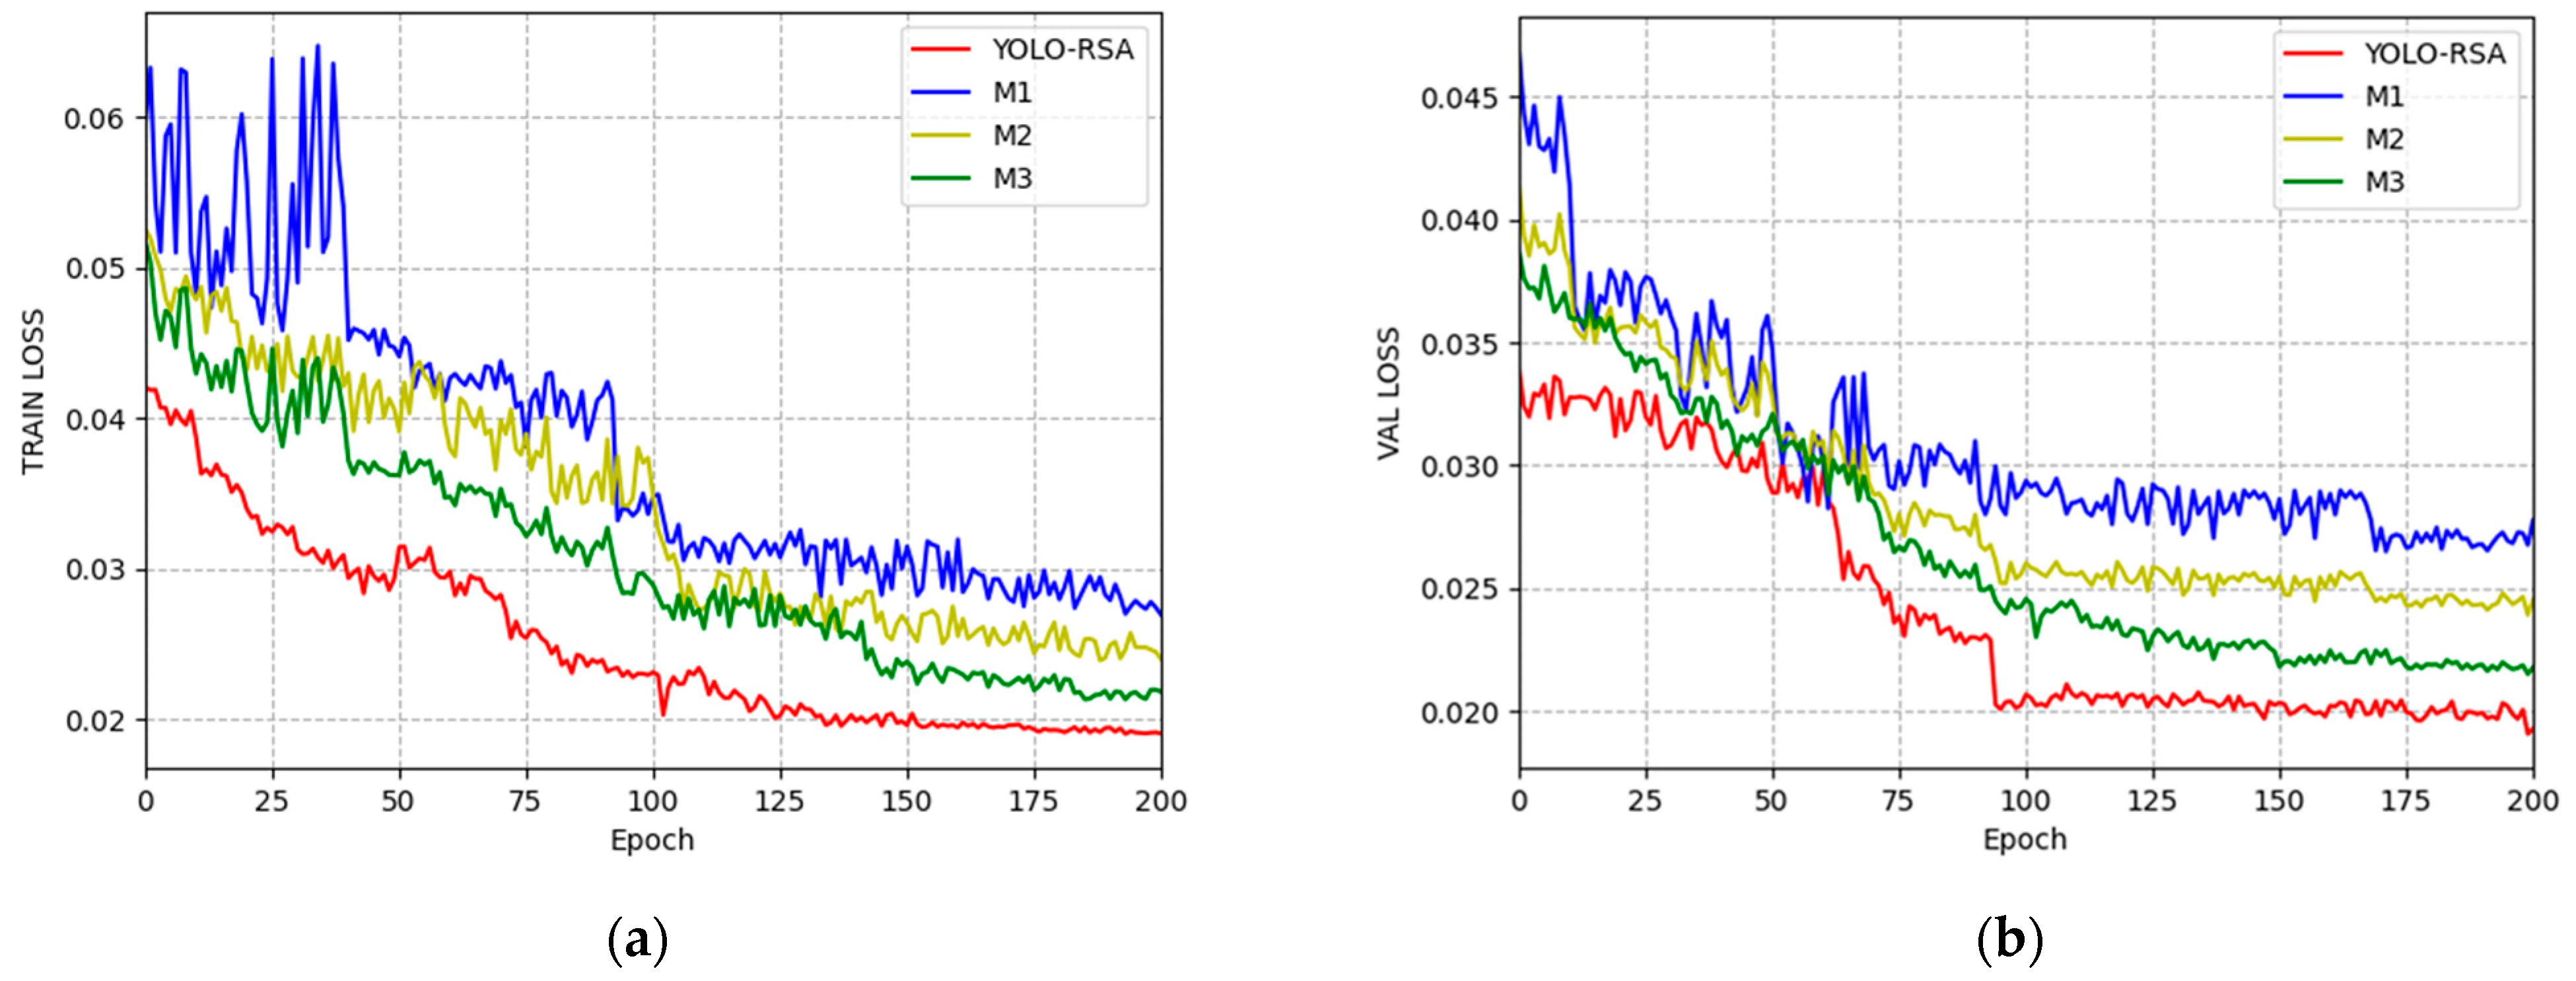
3.5.1. Ablation Experiment

YOLO-RSA is a ship detection model that integrates a multi-scale feature pyramid, Small Ship Attention Mechanism, and rotated detection head. To evaluate the impact of each module and improvement component, this study conducted an ablation experiment. The experimental methodology is outlined below: initially, we employed a model, denoted as M1, which combines the FPN network with a rotated box detection head directly predicting angles as the baseline for the ablation experiment. Experiments were conducted using the HRSC2016 dataset, and by means of comparative analysis, we assessed the contributions of each module and improvement component to the prediction results. The experimental findings are summarized in Table 2, where 4-FP signifies a 4-layer Multi-Scale Feature Pyramid, SA represents a Small Ship Attention Mechanism, and SC corresponds to the sine–cosine angle prediction branch. M2 and M3 represent the model code names under different improvement strategies, respectively.
Table 2 reveals that the 4-layer Multi-Scale Feature Pyramids network exerts a substantial influence on detection outcomes. Precision (P), Recall (R), and Mean Average Precision (MAP) metrics increased by 3.8%, 0.7%, and 2.6%, respectively. The proposed 4-layer Multi-Scale Feature Pyramid network in this study generates more intricate semantic features, augmenting feature saliency for targets at varying scales. Given the multi-scale and intricate background characteristics of optical remote sensing images, the 4-layer Multi-Scale Feature Pyramid network exhibits a significant enhancement in detection results. In Experiment 3, it is observed that incorporating the Small Ship Attention Mechanism elevates the model’s mAP to 0.945. This suggests that introducing the shuffle attention module mitigates false negatives for small-scale ships, a consequence of unknown feature extraction in the M1 model algorithm. Lastly, the sine–cosine angle prediction branch has a minimal impact on detection results. Nevertheless, the slight increase in mAP implies that the sine–cosine angle prediction branch indeed contributes to more precise predictions of rotated angles.
Figure 9, generated based on the experimental results, illustrates mean average precision (mAP) curves for the detection results of YOLO-RSA, M1, M2, and M3. We can see that the mAP curve of YOLO-RSA is significantly superior to the mAP curves of M1, M2, and M3, while the mAP curves of M1, M2, and M3 are enhanced sequentially, which indicates that the effect of each improvement component added to the model extraction effect is positive.
Additionally, Figure 10a,b depict the bounding box loss of the YOLO-RSA, M1, M2 and M3 models on both the training and validation sets throughout the experiment process. The graphs clearly show that, in both the training and validation sets, the bounding box loss of the YOLO-RSA model is consistently lower than the M1, M2, and M3 models, signifying the superior accuracy of the detection boxes produced by YOLO-RSA. Meanwhile, the bounding box loss of M1, M2, and M3 decreases sequentially, indicating that the inclusion of each improvement component makes the detection box more accurate. Each improvement component can effectively improve the detection effect.

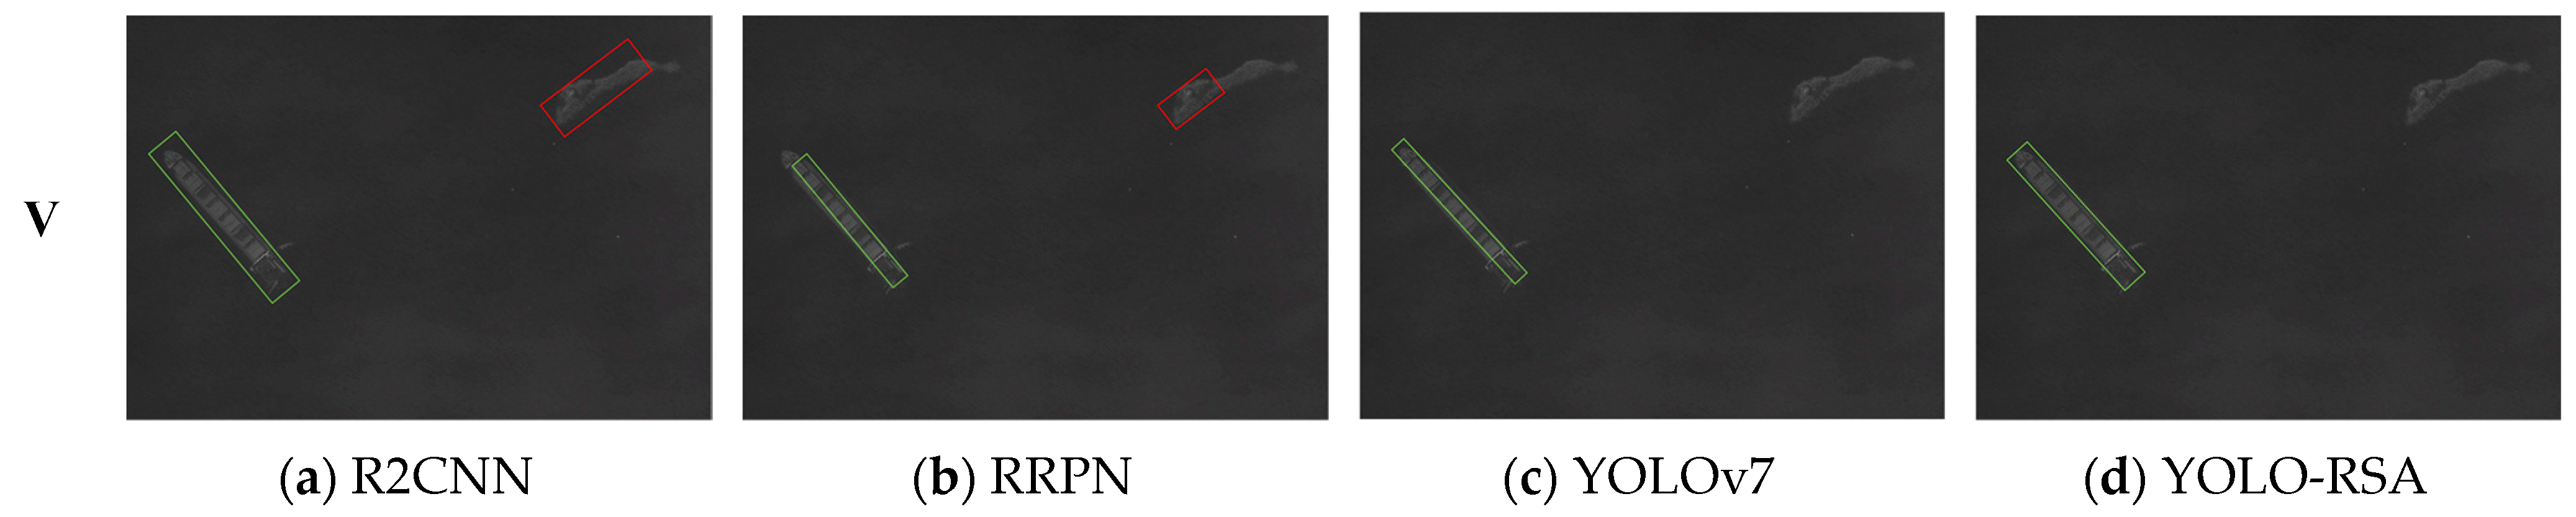
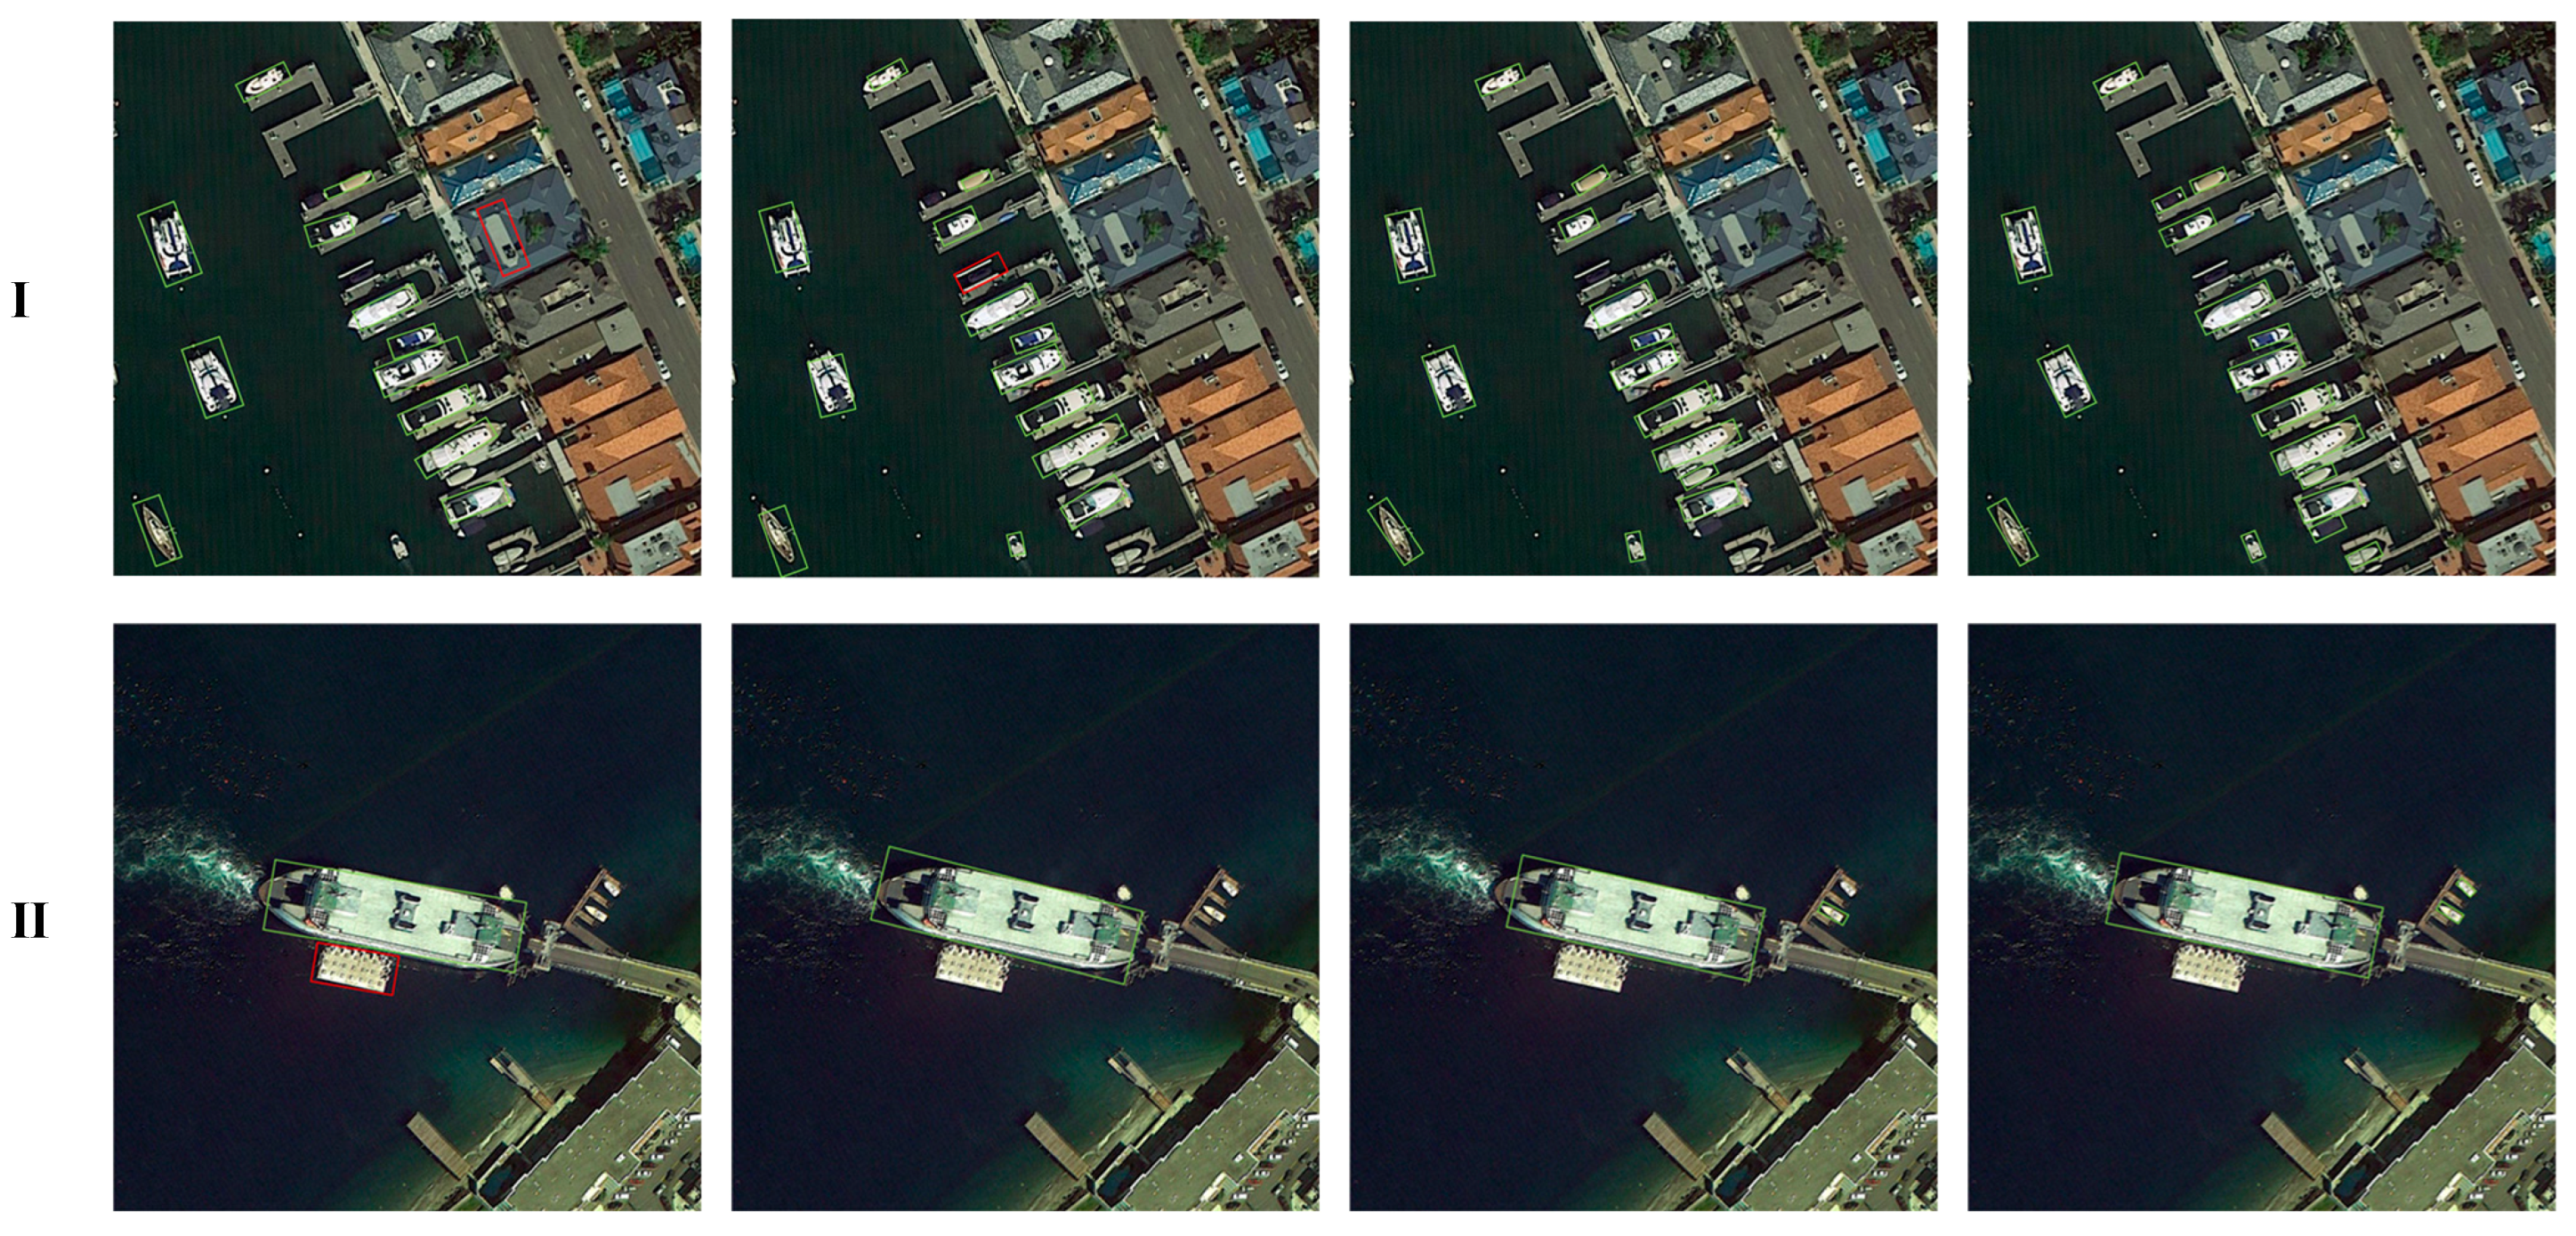
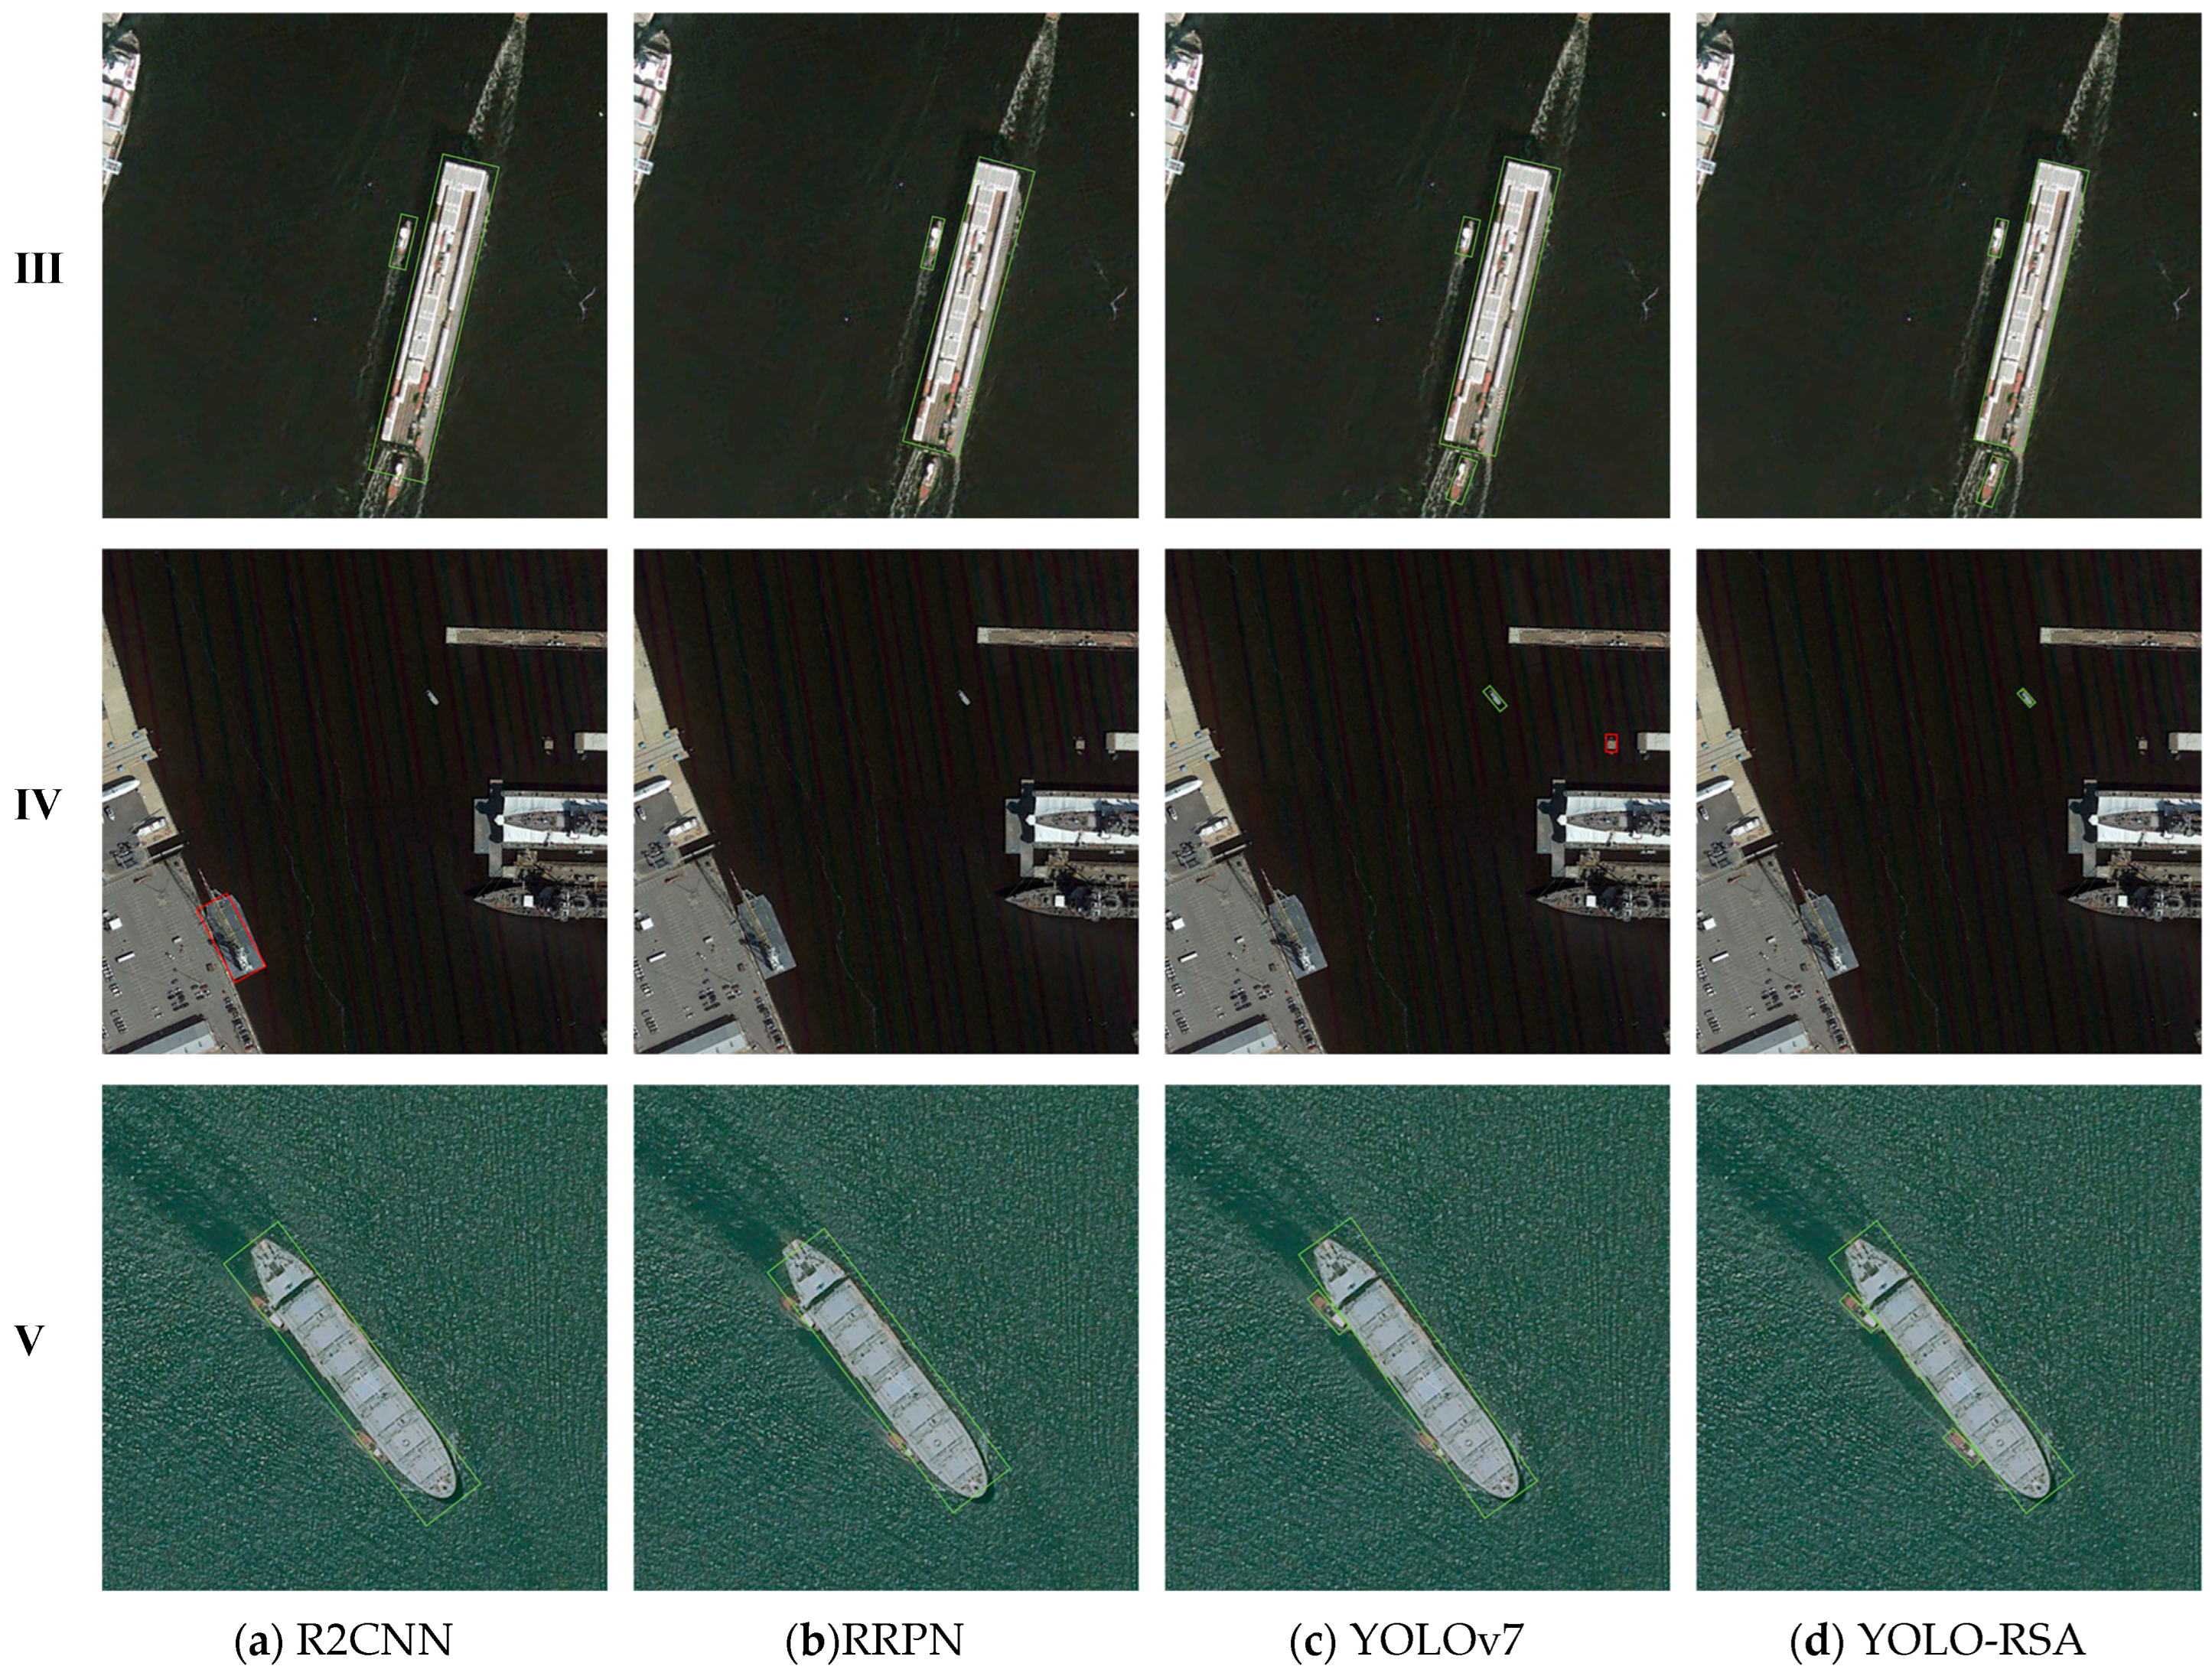
3.5.2. Comparison Experiment with Other Models

In order to substantiate the efficacy of the proposed methodology in this study, we utilized three prevalent ship detection models, specifically R2CNN [52], RRPN [53], and YOLOv7. Comparative experiments were executed on the HRSC2016 and DOTA datasets, with a comparative analysis against YOLO-RSA. The outcomes of these comparative experiments are comprehensively presented in Table 2.
The experimental results indicate that, whether in the HRSC2016 dataset or the DOTA dataset, YOLO-RSA achieved the highest mAP (91.7% in HRSC and 83.0% in DOTA). This is attributed to the 4-layer Multi-Scale Feature Pyramids network, which generated rich semantic features, enhanced the saliency of features for different scale targets, reduced interference from background environments on detection results, and consequently improved the precision of the model’s detection. Additionally, the Small Ship Attention Mechanism strengthened the model’s sensitivity to low contrast and small targets in images of small ships, reducing the probability of false negatives. From Table 3, it is evident that the detection performance of the four models on the DOTA dataset is inferior to that on the HRSC2016 dataset. Specifically, R2CNN, RRPN, and YOLOv7 experienced decreases of 37%, 29.2%, and 15.2%, respectively, in mAP on the DOTA dataset compared to the HRSC2016 dataset. This is mainly attributed to the DOTA dataset containing numerous instances of small and medium-sized ships, leading to a higher likelihood of missed detections and false positives. In contrast, YOLO-RSA exhibited only an 8.7% decrease in mAP on the DOTA dataset compared to HRSC2016, indicating that the detection performance of the YOLO-RSA model for small and medium-sized ships surpasses that of other models. Overall, YOLO-RSA outperforms the other three models in terms of ship detection.

3.5.3. Generalizability Experiments

Owing to the utilization of the HRSC2016 and DOTA training sets and validation sets for model training, evaluating the model’s generalizability using optical remote sensing ship images not encountered during training becomes crucial. Consequently, images with complex backgrounds from the HRSC2016 and DOTA test sets were selected as the dataset for generalizability experiments. The test samples encompass ships of different scales and feature various background and environmental characteristics. Subsequently, we will compare and analyze the specific experimental results for multiple scenarios in the test dataset to elucidate the model’s generalizability across different scenarios.
(1)
Effectiveness of Ship Detection in Different Scenarios
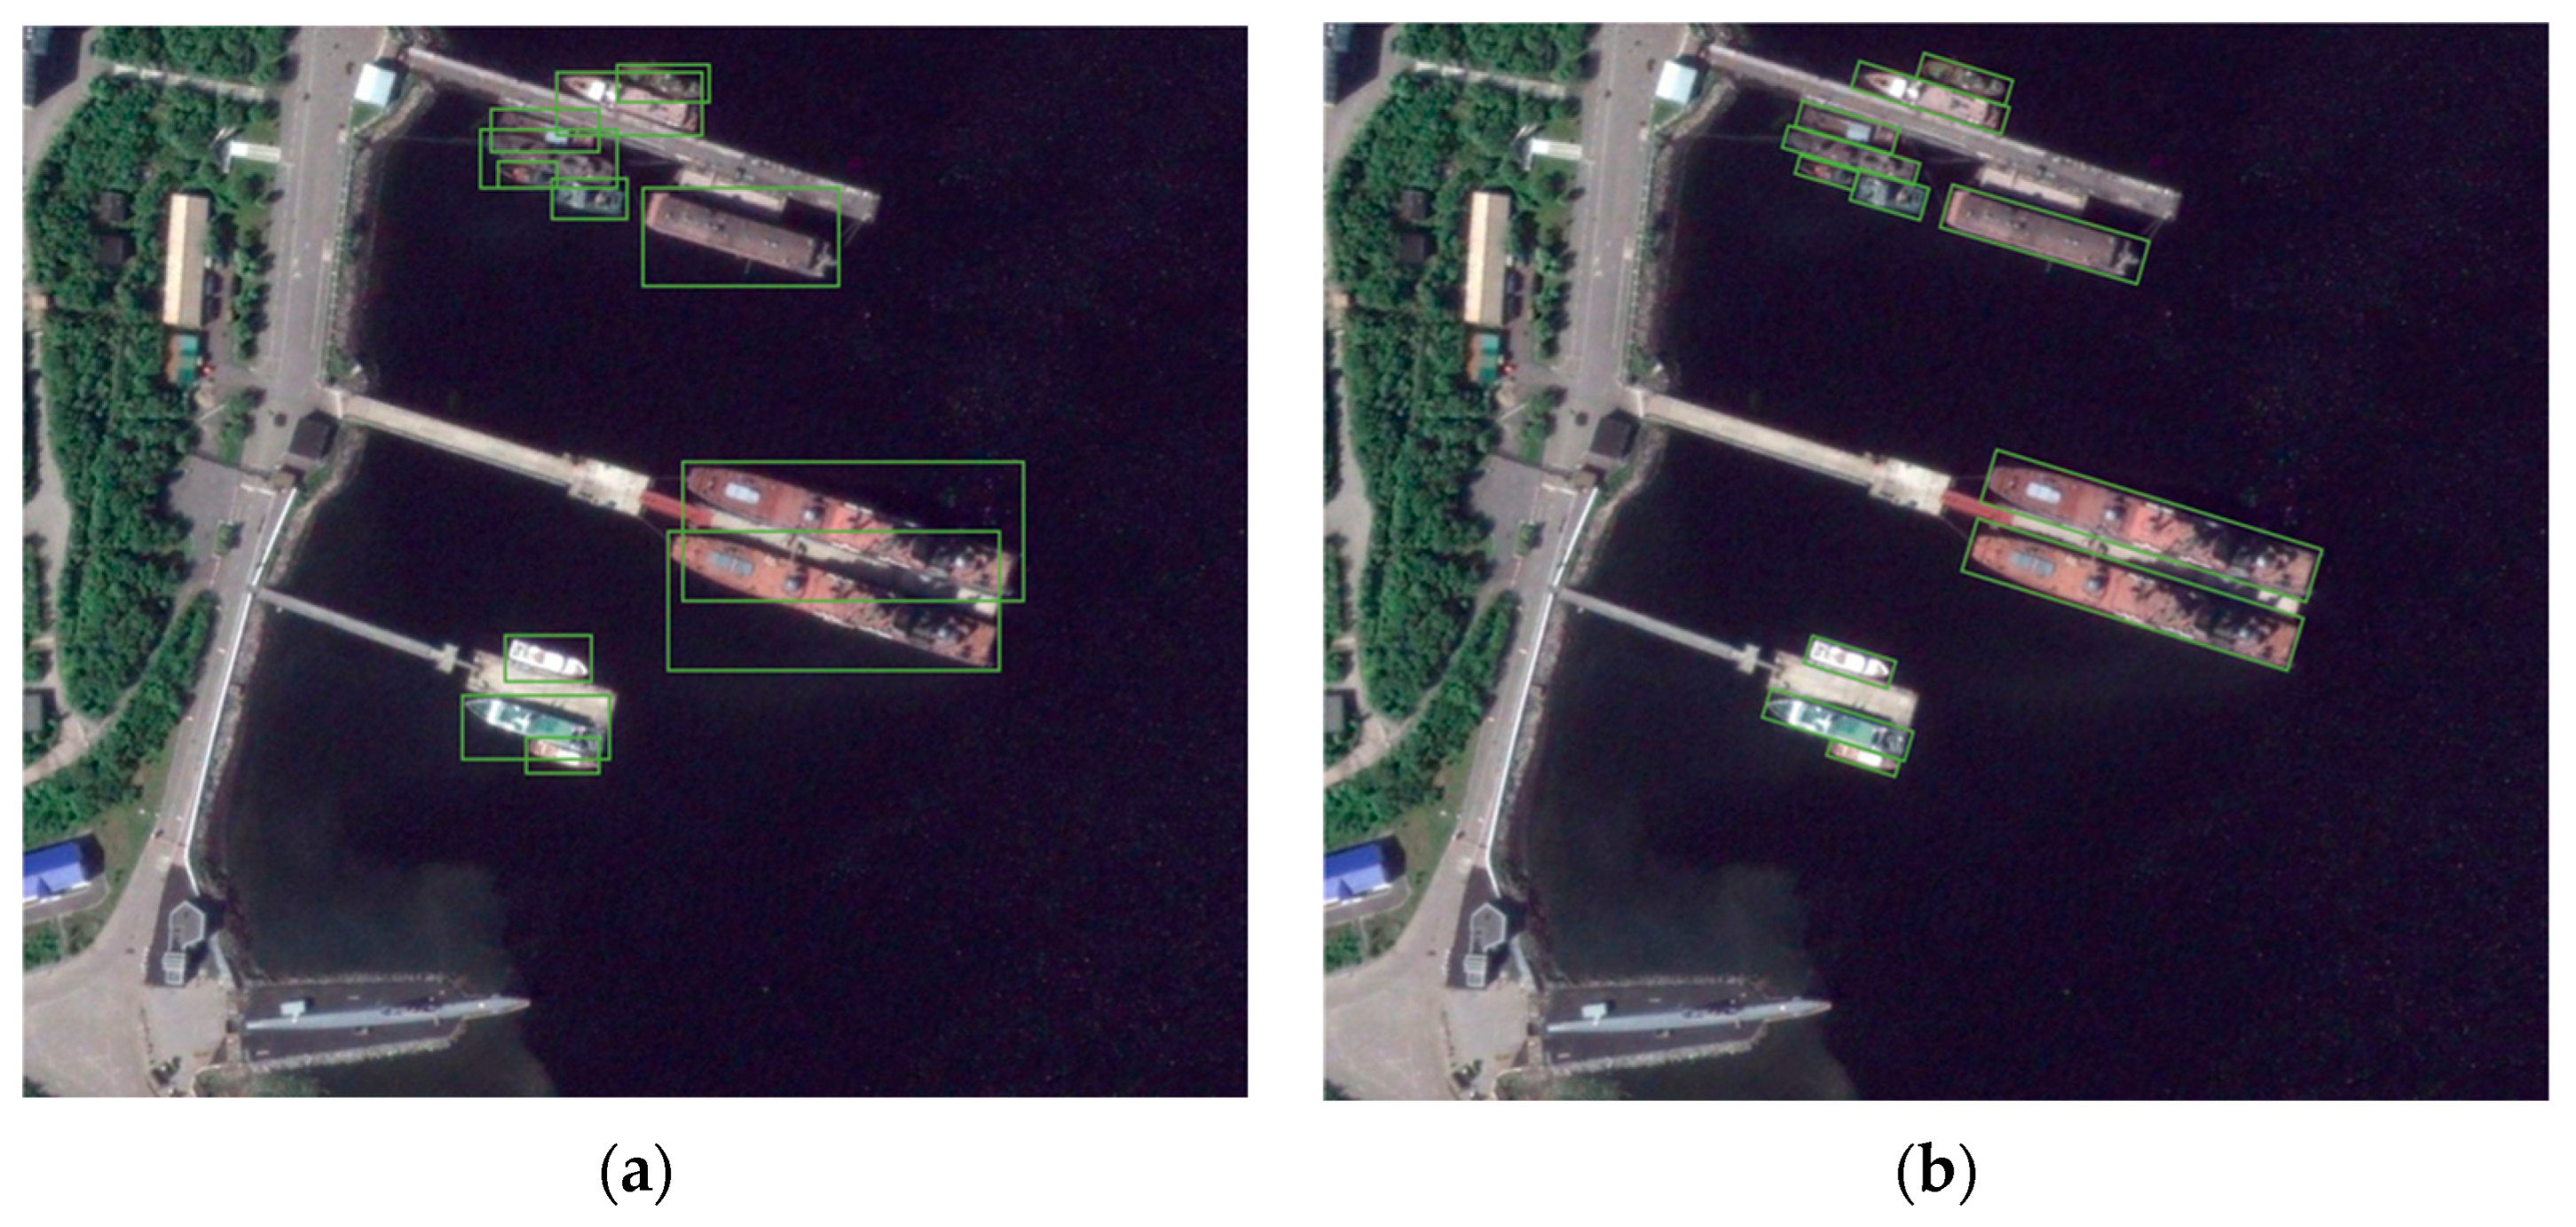
The detection outcomes in different scenarios are depicted in Figure 11. Ship targets of different scales are presented in Figure 11I, while interference factors, such as harbors, are present in the background. It is notable that both Figure 11I(a,b) manifest instances of false positives, characterized by a noticeable displacement between the detection box and the actual ship boundary. In contrast, although Figure 11I(c) does not display false positives, its detection accuracy is inferior when compared to Figure 11I(d). Through a thorough examination of the detection results presented in the figure, it becomes apparent that YOLO-RSA effectively improves the precision of ship detection in multi-scale ship scenes.
Detection results in a blurry environmental setting are compared, as depicted in Figure 11II. For ship scenes in foggy weather conditions, we observe that, due to background interference, the positions of detection boxes in Figure 11II(a–c) all exhibit displacement from the actual ship boundaries, resulting in significant redundant areas. This is attributed to the blurred environmental background causing the detection model to mistakenly identify some ports as ships. In contrast, the detection box in Figure 11II(d) is much closer to the actual ship boundary. Thus, it can be concluded that, in a blurry background environment, VOLO-RSA achieves accurate and reliable ship detection.
The detection results in a crowded ship scenario are compared, as shown in Figure 11III. The arrangement of ships in the figure is highly dense. In both Figure 11III(a,b), there are varying degrees of false detections of containers and other objects, with instances of predicted bounding boxes overlapping. In Figure 11III(c), some predicted bounding boxes exhibit larger redundant areas; however, in Figure 11III(d), the detection boxes closely align with the actual boundaries of the ships, and therefore, in crowded ship scenarios, the detection results of VOLO-RSA remain highly accurate and reliable.
A comparison of the detection results for a ship in motion is shown in Figure 11IV, where in Figure 11IV(a,b) there are instances where the currents generated by the ship in motion are recognized as ships. In Figure 11IV(c), the predicted bounding box has a larger redundant region. In contrast, in Figure 11IV(d), the detection boxes are all closer to the real boundaries of the ship.
The comparison of test results under low lighting conditions is shown in Figure 11V. It can be observed, that due to the change in radiation amount, the resolution of the ship image decreases, and the situation of false detection appears in Figure 11V(a,b). At the same time, the position of the detection box is offset from the real boundary of the ship, and there is a large redundancy area. In Figure 11V(c), the predicted boundary box differs considerably from the true boundary of the ship. In Figure 11V(d), the detection boxes are relatively close to the real boundary of the ship. Under low light conditions, VOLO-RSA still has good performance.
(2)
Detection Effectiveness of Small Ship Targets
The detection results of small-sized ship targets are compared, as illustrated in Figure 12. The figure predominantly features small-scale ship targets with background interference, such as ports, roads, and houses. In Figure 12I(a), there is a case of misidentifying a house as a ship, while in Figure 12I(b), there is a situation of identifying a port as a ship. Additionally, Figure 12I(a–c) all exhibit varying degrees of missed detections. In contrast, Figure 12I(d) shows neither missed nor false detections.
If we observe Figure 12II, we can see that the large ships in Figure 12II(a–c) are all detected, while, for the small ships on the right side of the image, only a fraction of them are detected in Figure 12II(c), and they are completely ignored in Figure 12II(a,b). In contrast, all ships in Figure 12II(d) are detected.
Turning to Figure 12III, which is an image of a large ship travelling together with a small ship, it is clear from Figure 12III(a,b) that we can see that the small ships at the stern of the large ship have been missed. Both Figure 12III(c,d) correctly identify all the ships in the image, although, in contrast, Figure 12III(d) shows better detection than Figure 12III(c).
This is followed by Figure 12IV, with only one small ship in the image. In Figure 12IV(a) there is no correct detection and only one false detection; in Figure 12IV(b) we do not see any detection box. In Figure 12IV(c), although the small ship is recognized, it also produces a false detection. In Figure 12IV(d), the target is correctly identified.
Moving on to the last case, the large ship is in close proximity to the small ship. We can see that in Figure 12V(a–c), all produce missed detections. The detection in Figure 12V(d) is the best.
In summary, YOLO-RSA demonstrates robust performance in ship images across various scenarios, and its detection results exhibit high accuracy and reliability under diverse conditions (especially for small ship targets), highlighting the method’s strong adaptability.

3.6. Discussion of Experimental Results

In order to verify the effectiveness of the algorithm proposed in this paper, a total of three experiments are designed in this paper, which are ablation experiment, comparison experiment and generalizability experiments. In the ablation experiment, we demonstrate the effectiveness of the various modules of this design by comparing the model test results under four improvement strategies; in the comparison experiment, we compare YOLO-RSA with three currently popular ship detection methods. In the dataset HRSC2016, YOLO-RSA’s model detection mAP is improved by 6.4%, 5.3%, and 3.0% compared to R2CNN, RRPN, and YOLOv7, respectively. Additionally, in the dataset DOTA, YOLO-RSA’s model detection mAP is improved by 34.7%, 25.8% and 9.5% compared to R2CNN, RRPN and YOLOv7, respectively, which indicates that YOLO-RSA has the best detection performance in both of the above datasets; In the generalizability experiments, we compare the detection results of YOLO-RSA with three popular algorithms in the HRSC2016 and DOTA test sets. The results show that YOLO-RSA has good generalizability and applicability, still performing well compared to R2CNN, RRPN, and YOLOv7 in never-encountered optical remote sensing ship images, especially in the detection of small target ships.

4. Conclusions

To tackle the ship detection challenge in high-resolution optical remote sensing images, we introduce a network model named YOLO-RSA that comprises three main components: a backbone feature extraction network, a multi-scale feature pyramid, and a rotated detection head. In order to improve the feature saliency of different scale objects and to integrate the multi-scale features of remote sensing ships, we design a 4-layer multi-scale feature pyramid and add the shuffle attention module to the bottom-up network to form a small ship target attention mechanism so as to increase the algorithm’s effectiveness in detecting the small ship targets. Finally, in the angle prediction branch, we propose a sine–cosine angle prediction branch that predicts the angle by predicting the sine–cosine value of the angle, possessing higher accuracy compared to direct angle prediction. YOLO-RSA is evaluated through experiments with the HRSC2016 and DOTA datasets, and the results indicate remarkable performance in ship detection. Notably, compared to traditional methods, YOLO-RSA excels in accurately identifying ships of various scales, particularly small targets, while maintaining robust detection capabilities in complex environmental backgrounds. Ablation experiments are conducted to validate the performance enhancement of each module in YOLO-RSA, benchmarked against the baseline model M1. Comparative experiments showcase YOLO-RSA’s superiority over three popular ship detection algorithms, emphasizing its heightened detection accuracy. Moreover, generalizability experiments affirm that YOLO-RSA consistently demonstrates outstanding detection performance across diverse scenarios.
However, there is still room for improvement in our proposed model, and we will focus on the following aspects in our future work: Firstly, in terms of dataset, the image dataset trained in this paper is relatively insufficient, so more remote sensing images should be collected in the subsequent research. Furthermore, the classification of ships can become more detailed; this paper did not classify the ship dataset, so the subsequent research can be subdivided into ship image types. Finally, we need to improve the detection speed and model robustness. Due to the improvement of accuracy, the detection time will increase accordingly. We must try to reduce the model detection time without affecting the model accuracy to adapt to different application scenarios, such as large-scale ship monitoring in the target sea area and so on.

Author Contributions

Conceptualization, Z.F., X.W. and B.J.; methodology, Z.F. and B.J.; software, Z.F.; validation, Z.F. and X.W.; Data collection, Z.F. and B.J.; Data analysis, Z.F.; Writing—original draft preparation, Z.F.; Writing—review and editing, X.W., B.J. and L.Z.; Supervision, X.W. and B.J.; Funding acquisition, X.W. All authors have read and agreed to the published version of the manuscript.

Funding

This research was funded by National Key R&D Program of China (2023YFB4203200).

Institutional Review Board Statement

Not applicable.

Informed Consent Statement

Not applicable.

Data Availability Statement

The data presented in this study are available on request from the corresponding author.

Acknowledgments

Acknowledging the technical support of College of Ocean Science and Technology, Tianjin University and National Ocean Technology Center, China.

Conflicts of Interest

The authors declare no conflicts of interest.

References

  1. Colgan, C.S. The Blue Economy. In The Blue Economy Handbook of the Indian Ocean Region; Africa Institute of South Africa: Pretoria, South Africa, 2018; Volume 38. [Google Scholar]
  2. Ma, J.; Jiang, J.; Zhou, H.; Zhao, J.; Guo, X. Guided Locality Preserving Feature Matching for Remote Sensing Image Registration. IEEE Trans. Geosci. Remote Sens. 2018, 56, 4435–4447. [Google Scholar] [CrossRef]
  3. Li, X.; Tang, Z.; Chen, W.; Wang, L. Multimodal and Multi-Model Deep Fusion for Fine Classification of Regional Complex Landscape Areas Using ZiYuan-3 Imagery. Remote Sens. 2019, 11, 2716. [Google Scholar] [CrossRef]
  4. Li, X.; Li, Z.; Lv, S.; Cao, J.; Pan, M.; Ma, Q.; Yu, H. Ship detection of optical remote sensing image in multiple scenes. Int. J. Remote Sens. 2022, 43, 5709–5737. [Google Scholar] [CrossRef]
  5. Li, K.; Cheng, G.; Bu, S.; You, X. Rotation-insensitive and context-augmented object detection in remote sensing images. IEEE Trans. Geosci. Remote Sens. 2017, 56, 2337–2348. [Google Scholar] [CrossRef]
  6. Huang, K.; Tian, C.; Li, G. Bidirectional mutual guidance transformer for salient object detection in optical remote sensing images. Int. J. Remote Sens. 2023, 44, 4016–4033. [Google Scholar] [CrossRef]
  7. Cheng, G.; Han, J. A Survey on Object Detection in Optical Remote Sensing Images. ISPRS J. Photogramm. Remote Sens. 2016, 117, 11–28. [Google Scholar] [CrossRef]
  8. Yasir, M.; Jianhua, W.; Mingming, X.; Hui, S.; Zhe, Z.; Shanwei, L.; Colak, A.T.I.; Hossain, M.S. Ship detection based on deep learning using SAR imagery: A systematic literature review. Soft Comput. 2023, 27, 63–84. [Google Scholar] [CrossRef]
  9. Li, J.; Qu, C.; Shao, J. Ship detection in SAR images based on an improved faster R-CNN. In Proceedings of the 2017 SAR in Big Data Era: Models, Methods and Applications (BIGSARDATA), Beijing, China, 13–14 November 2017. [Google Scholar]
  10. Jiao, J.; Zhang, Y.; Sun, H.; Yang, X.; Gao, X.; Hong, W.; Fu, K.; Sun, X. A Densely Connected End-to-End Neural Network for Multiscale and Multiscene SAR Ship Detection. IEEE Access 2018, 6, 20881–20892. [Google Scholar] [CrossRef]
  11. Kim, T.S.; Oh, S.; Chun, T.B.; Lee, M. Impact of Atmospheric Correction on the Ship Detection Using Airborne Hyperspectral Image. In Proceedings of the IGARSS 2019—2019 IEEE International Geoscience and Remote Sensing Symposium, Yokohama, Japan, 28 July–2 August 2019. [Google Scholar]
  12. Bay, H.; Ess, A.; Tuytelaars, T.; Van Gool, L. Speeded-Up Robust Features (SURF). Comput. Vis. Image Underst. 2008, 110, 346–359. [Google Scholar] [CrossRef]
  13. Chang, H.-H.; Wu, G.-L.; Chiang, M.-H. Remote Sensing Image Registration Based on Modified SIFT and Feature Slope Grouping. IEEE Geosci. Remote Sens. Lett. 2019, 16, 1363–1367. [Google Scholar] [CrossRef]
  14. Wen, L.; Cheng, Y.; Fang, Y.; Li, X. A comprehensive survey of oriented object detection in remote sensing images. Expert Syst. Appl. 2023, 224, 119960. [Google Scholar] [CrossRef]
  15. Yang, X.; Sun, H.; Fu, K.; Yang, J.; Sun, X.; Yan, M.; Guo, Z. Automatic Ship Detection in Remote Sensing Images from Google Earth of Complex Scenes Based on Multiscale Rotation Dense Feature Pyramid Networks. Remote Sens. 2018, 10, 132. [Google Scholar] [CrossRef]
  16. Sun, B.; Wang, X.; Oad, A.; Pervez, A.; Dong, F. Automatic Ship Object Detection Model Based on YOLOv4 with Transformer Mechanism in Remote Sensing Images. Appl. Sci. 2023, 13, 2488. [Google Scholar] [CrossRef]
  17. Girshick, R.; Donahue, J.; Darrell, T.; Malik, J. Rich Feature Hierarchies for Accurate Object Detection and Semantic Segmentation. In Proceedings of the IEEE Conference on Computer Vision and Pattern Recognition, Columbus, OH, USA, 23–28 June 2014. [Google Scholar] [CrossRef]
  18. Wu, F.; Zhou, Z.; Wang, B.; Ma, J. Inshore Ship Detection Based on Convolutional Neural Network in Optical Satellite Images. IEEE J. Sel. Top. Appl. Earth Obs. Remote Sens. 2018, 11, 4005–4015. [Google Scholar] [CrossRef]
  19. You, Y.; Cao, J.; Zhang, Y.; Liu, F.; Zhou, W. Nearshore Ship Detection on High-Resolution Remote Sensing Image via Scene-Mask R-CNN. IEEE Access 2019, 7, 128431–128444. [Google Scholar] [CrossRef]
  20. Zou, Z.; Chen, K.; Shi, Z.; Guo, Y.; Ye, J. Object Detection in 20 Years: A Survey. Proc. IEEE 2023, 111, 257–276. [Google Scholar] [CrossRef]
  21. Yi, H.; Cheng, B.; Cai, Y.; Liu, Z. A review of vision-based target detection and tracking. J. Autom. 2016, 42, 1466–1489. [Google Scholar]
  22. Lowe, D.G. Object recognition from local scale-invariant features. In Proceedings of the Seventh IEEE International Conference on Computer Vision, Kerkyra, Greece, 20–27 September 1999; pp. 1150–1157. [Google Scholar]
  23. Dalal, N.; Triggs, B. Histograms of oriented gradients for human detection. In Proceedings of the 2005 IEEE Computer Society Conference on Computer Vision and Pattern Recognition (CVPR’05), San Diego, CA, USA, 20–25 June 2005; pp. 886–893. [Google Scholar]
  24. Girshick, R.; Felzenszwalb, P.; McAllester, D. Object detection with grammar models. In Advances in Neural Information Processing Systems; NeurIPS: San Diego CA, USA, 2011; Volume 24. [Google Scholar]
  25. Zhang, Y.; Li, Q.Z.; Zang, F.N. Ship detection for visual maritime surveillance from non-stationary platforms. Ocean. Eng. 2017, 141, 53–63. [Google Scholar] [CrossRef]
  26. Kim, S.; Lee, J. Small Infrared Target Detection by Region-Adaptive Clutter Rejection for Sea-Based Infrared Search and Track. Sensors 2014, 14, 13210–13242. [Google Scholar] [CrossRef]
  27. Wang, B.; Su, Y.; Wan, L. A sea-sky line detection method for unmanned surface vehicles based on gradient saliency. Sensors 2016, 16, 543. [Google Scholar] [CrossRef]
  28. Loomans, M.J.H.; Wijnhoven, R.G.J.; De With, P.H.N. Robust automatic ship tracking in harbours using active cameras. In Proceedings of the 2013 IEEE International Conference on Image Processing, Melbourne, VIC, Australia, 15–18 September 2013. [Google Scholar]
  29. Uma, M.; Kumar, S.S. Sea objects detection using color and texture classification. Int. J. Comput. Appl. Eng. Sci. (IJCAES) 2011, 1, 59–63. [Google Scholar]
  30. He, K.; Zhang, X.; Ren, S.; Sun, J. Spatial pyramid pooling in deep convolutional networks for visual recognition. IEEE Trans. Pattern Anal. Mach. Intell. 2015, 37, 1904–1916. [Google Scholar] [CrossRef] [PubMed]
  31. Girshick, R. Fast R-CNN. In Proceedings of the IEEE International Conference on Computer Vision (ICCV), Santiago, Chile, 7–13 December 2015. [Google Scholar]
  32. Ren, S.; He, K.; Girshick, R.; Sun, J. Faster R-CNN: Towards Real-Time Object Detection with Region Proposal Networks. IEEE Trans. Pattern Anal. Mach. Intell. 2017, 39, 1137–1149. [Google Scholar] [CrossRef] [PubMed]
  33. Kaur, P.; Khehra, B.S.; Pharwaha, A.P.S. Deep Transfer Learning Based Multiway Feature Pyramid Network for Object Detection in Images. Math. Probl. Eng. 2021, 2021, 5565561. [Google Scholar] [CrossRef]
  34. He, K.; Gkioxari, G.; Dollár, P.; Girshick, R. Mask R-CNN. In Proceedings of the IEEE International Conference on Computer Vision (ICCV), Venice, Italy, 22–29 October 2017. [Google Scholar]
  35. Liu, W.; Anguelov, D.; Erhan, D.; Szegedy, C.; Reed, S.; Fu, C.-Y.; Berg, A.C. Ssd: Single shot multibox detector. In Proceedings of the Computer Vision—ECCV 2016: 14th European Conference, Amsterdam, The Netherlands, 11–14 October 2016; pp. 21–37. [Google Scholar]
  36. Lin, T.Y.; Goyal, P.; Girshick, R.; He, K.; Dollár, P. Focal Loss for Dense Object Detection. In Proceedings of the IEEE International Conference on Computer Vision (ICCV), Venice, Italy, 22–29 October 2017; pp. 2999–3007. [Google Scholar]
  37. Duan, K.; Bai, S.; Xie, L.; Qi, H.; Huang, Q.; Tian, Q. CenterNet: Keypoint Triplets for Object Detection. In Proceedings of the IEEE/CVF International Conference on Computer Vision (ICCV), Seoul, Republic of Korea, 27 October–2 November 2019. [Google Scholar]
  38. Tian, Z.; Shen, C.; Chen, H.; He, T. FCOS: Fully Convolutional One-Stage Object Detection. arXiv 2019, arXiv:1904.01355. [Google Scholar]
  39. Wang, C.-Y.; Bochkovskiy, A.; Liao, H.-Y.M. YOLOv7: Trainable bag-of-freebies sets new state-of-the-art for real-time object detectors. In Proceedings of the IEEE/CVF Conference on Computer Vision and Pattern Recognition, Vancouver, BC, Canada, 17–24 June 2023; pp. 7464–7475. [Google Scholar]
  40. Zwemer, M.H.; Wijnhoven, R.G.J.; With, P.H.N.D. Ship Detection in Harbour Surveillance based on Large-Scale Data and CNNs. In Proceedings of the International Joint Conference on Computer Vision, Imaging and Computer Graphics Theory and Applications, Funchal, Portugal, 27–29 January 2018. [Google Scholar]
  41. Bousetouane, F.; Morris, B. Fast CNN surveillance pipeline for fine-grained ship classification and detection in maritime scenarios. In Proceedings of the 2016 13th IEEE International Conference on Advanced Video and Signal Based Surveillance (AVSS), Colorado Springs, CO, USA, 23–26 August 2016. [Google Scholar]
  42. Kim, K.; Hong, S.; Choi, B.; Kim, E. Probabilistic ship detection and classification using deep learning. Appl. Sci. 2018, 8, 936. [Google Scholar] [CrossRef]
  43. Qi, L.; Li, B.; Chen, L.; Wang, W.; Dong, L.; Jia, X.; Huang, J.; Ge, C.; Xue, G.; Wang, D. Ship Target Detection Algorithm Based on Improved Faster R-CNN. Electronics 2019, 8, 959. [Google Scholar] [CrossRef]
  44. Ye, J.; Sun, Y.F.; Liu, G.; Liu, L. Ship Detection Framework Based on Deep Learning Network; DEStech Publications: Lancaster, PA, USA, 2019. [Google Scholar]
  45. Moosbauer, S.; Knig, D.; Jkel, J.; Teutsch, M. A Benchmark for Deep Learning Based Object Detection in Maritime Environments. In Proceedings of the 2019 IEEE/CVF Conference on Computer Vision and Pattern Recognition Workshops (CVPRW), Long Beach, CA, USA, 16–17 June 2019. [Google Scholar]
  46. Prasad, D.K.; Dong, H.; Rajan, D.; Quek, C. Are Object Detection Assessment Criteria Ready for Maritime Computer Vision; Institute of Electrical and Electronics Engineers (IEEE): Piscataway, NJ, USA, 2020. [Google Scholar]
  47. Wang, F.; Liu, M.; Liu, X.; Qin, Z.; Ma, B.; Zheng, Y. Real-Time Detection of Marine Ships under Sea Fog Weather Conditions Based on YOLOv3 Deep Learning. Mar. Sci. 2020, 44, 8. [Google Scholar]
  48. Miao, T.; Zeng, H.; Yang, W.; Chu, B.; Zou, F.; Ren, W.; Chen, J. An improved lightweight RetinaNet for ship detection in SAR images. IEEE J. Sel. Top. Appl. Earth Obs. Remote Sens. 2022, 15, 4667–4679. [Google Scholar] [CrossRef]
  49. Chen, Z.; Liu, C.; Filaretov, V.; Yukhimets, D. Multi-Scale Ship Detection Algorithm Based on YOLOv7 for Complex Scene SAR Images. Remote Sens. 2023, 15, 2071. [Google Scholar] [CrossRef]
  50. Yang, Y.B. SA-Net: Shuffle Attention for Deep Convolutional Neural Networks. In Proceedings of the ICASSP 2021—2021 IEEE International Conference on Acoustics, Speech and Signal Processing (ICASSP), Toronto, ON, Canada, 6–11 June 2021. [Google Scholar]
  51. Xia, G.-S.; Bai, X.; Ding, J.; Zhu, Z.; Belongie, S.; Luo, J.; Datcu, M.; Pelillo, M.; Zhang, L. DOTA: A large-scale dataset for object detection in aerial images. In Proceedings of the 2018 IEEE/CVF Conference on Computer Vision and Pattern Recognition (CVPR), Salt Lake City, UT, USA, 18–23 June 2018; pp. 3974–3983. [Google Scholar]
  52. Jiang, Y.; Zhu, X.; Wang, X.; Yang, S.; Li, W.; Wang, H.; Fu, P.; Luo, Z. R2CNN: Rotational Region CNN for Orientation Robust Scene Text Detection. arXiv 2017, arXiv:1706.09579. [Google Scholar]
  53. Ma, J.; Shao, W.; Ye, H.; Wang, L.; Wang, H. Arbitrary-Oriented Scene Text Detection via Rotation Proposals. In IEEE Transactions on Multimedia; IEEE: Piscataway, NJ, USA, 2017; pp. 3111–3122. [Google Scholar]
Figure 1. The main flow of YOLO-RSA.
Jmse 12 00603 g001
Figure 2. The detailed model structure of YOLO-RSA.
Jmse 12 00603 g002
Figure 3. The structures of MP, E-ELAN and SPPCSPC.
Jmse 12 00603 g003
Figure 4. The mark of the horizontal bounding box and the rotated bounding box: (a) horizontal bounding box; (b) rotated bounding box.
Jmse 12 00603 g004
Figure 5. The mark of the horizontal bounding box and the rotated bounding box in a crowded scene: (a) horizontal bounding box; (b) rotated bounding box.
Jmse 12 00603 g005
Figure 7. Schematic diagram of the angle prediction method: (a) traditional angle prediction method; (b) sine–cosine angle prediction method.
Jmse 12 00603 g007
Figure 8. The heatmap instance: (a) optical remote sensing ship image; (b) traditional angle prediction branch; (c) sine–cosine angle prediction branch.
Jmse 12 00603 g008
Figure 9. mAP curves of YOLO-RSA, M1, M2 and M3.
Jmse 12 00603 g009
Figure 10. Bounding box loss of the YOLO-RSA, M1, M2 and M3: (a) Train loss; (b) Validation loss.
Jmse 12 00603 g010
Figure 11. The detection effect in different scenarios: (a) R2CNN; (b) RRPN; (c) YOLOv7; (d) YOLO-RSA.
Jmse 12 00603 g011aJmse 12 00603 g011b
Figure 12. The detection effect about small-sized ships: (a) R2CNN; (b) RRPN; (c) YOLOv7; (d) YOLO-RSA.
Jmse 12 00603 g012aJmse 12 00603 g012b
Table 1. Detailed information about the two datasets.
DatasetsHRSC2016DOTA
Image number10611014
Ship number297673,824
Size(pixel)300 × 300~1500 × 900800 × 800~1500 × 1500
Resolution(m)0.4~2-
- The DOTA dataset does not provide the exact geographical resolution.
Table 2. The result of Ablation Experiment.
NO.Improvement StrategyDatasetPRmAP
1M1HRSC20160.8370.8460.839
2M1 + 4 − FP (M2)0.8740.8530.865
3M1 + 4 − FP + SA (M3)0.9110.8970.905
4M1 + 4 − FP + SA + SC (YOLO-RSA)0.9230.9110.917
Table 3. The result of Comparison Experiment.
ModelDatasetPRmAP
R2CNNHRSC20160.8630.8490.853
DOTA0.6580.4370.483
RRPNHRSC20160.8820.8390.864
DOTA0.5880.6390.572
YOLOv7HRSC20160.9120.8640.887
DOTA0.8960.7240.735
YOLO-RSAHRSC20160.9230.9110.917
DOTA0.9070.7960.830
Disclaimer/Publisher’s Note: The statements, opinions and data contained in all publications are solely those of the individual author(s) and contributor(s) and not of MDPI and/or the editor(s). MDPI and/or the editor(s) disclaim responsibility for any injury to people or property resulting from any ideas, methods, instructions or products referred to in the content.

