Abstract
Ocean recreational activities (ORAs), including swimming, surfing, diving, paddleboarding, etc., in global marine areas are becoming increasingly popular. However, there are potential risks in coastal ocean environments. This study aims to establish a framework for assessing the risk according to the joint hazard and vulnerability levels of the ORA environment. Important factors include meteo-ocean conditions, geographic features, biological and chemical characteristics, and records of historical accidents, as well as social, environmental and tourist perceptions. The fuzzy Delphi method (FDM) is used to screen the representative factors, followed by using the analytical hierarchy process (AHP) to determine the weight of each factor. The results show that 9 hazard factors and 12 vulnerability factors are dominant. The framework is applied to 307 beaches in Taiwan, and 8% of them are categorized as very high risk and 13% as very low risk for ORAs. A risk map that displays the hazard, vulnerability, and overall risk levels is presented to tourists to provide quick access to risk information.
1. Introduction
Ocean recreational activities (ORAs) are popular ways to enjoy nature. They encompass a wide variety of activities, such as swimming and snorkeling, which do not require equipment, as well as those that use natural forces, such as surfing, sailing, and stand-up paddleboarding (SUP). There are also activities powered by machinery, such as jet skiing and water skiing. Many of these activities are considered sports, with some even included in the Olympic Games. Billions of people in the world engage in ORAs [1,2,3,4,5], especially in countries surrounded by sea, such as Taiwan, where these activities are incredibly popular.
However, all activities carry risks. The risks associated with ORAs are associated with three sources: (1) meteo-oceanographic environmental characteristics, which include physical, chemical, and biological factors such as strong winds, rip currents, giant waves, sudden rogue waves, tidal changes, tsunamis, storm surges, whirlpools, marine life, and water quality; (2) geographical environmental factors, such as seabed slopes, artificial structures, sandbars, hidden reefs, and seabed materials; and (3) tourist factors, such as the types of recreational activities undertaken, the physical and mental state of individuals, trip planning, pretrip preparation, and the proper use of safety equipment [6,7,8,9,10,11,12,13].
Among the natural factors that influence ORAs, wind, waves, tides, currents, and sea temperature change rapidly and are the most direct elements affecting the safety of ORAs [14,15,16,17]. Sudden gusts of wind significantly impact ORAs within a short period, posing considerable danger for activities such as SUP or windsurfing. Wind contacting the sea surface transfers energy between the atmosphere and the ocean, generating surface waves. Among physical factors, waves carry the most energy. Large waves can easily capsize boats, and even small sudden rogue waves can cause maritime accidents [18,19,20,21]. Waves pose varying degrees of danger to nearly all ORAs. Tidal changes, a comparatively slower process, theoretically might have less impact on the safety of water activities. However, in areas with mild slopes, the flow of tides is not easily noticeable, and there are frequent incidents of tourists becoming trapped in rising tidal waters and unable to return to shore. Additionally, rip currents are considered by many to be the main silent danger for ORAs [22,23,24,25]; they are strong, narrow currents moving away from the shore, and they are difficult to detect and challenging to combat considering human swimming capabilities. Although sea temperature primarily affects the comfort of marine activities, low temperatures can also easily lead to hypothermia or cramping, posing dangers to individuals engaged in recreation. In addition to physical factors, the chemical characteristics of the sea are also crucial to ORA safety. These include the presence of E. coli, heavy metals, and toxic algae in seawater, all of which pose safety hazards to individuals. The presence of marine creatures such as sharks, jellyfish, and poisonous fish, which are sometimes aggressive for self-protection or defense, can also lead to unwelcome encounters during ORAs.
The United Nations Disaster Relief Organization [26] defined risk as the product of hazard and vulnerability. Hazard refers to the likelihood of a potentially harmful event occurring within a specific area or timeframe, while vulnerability indicates the degree of loss caused by such an event. Regarding coastal risk assessments, past studies primarily focused on assessing the risks of coastal disasters, such as coastal erosion or flooding [27,28,29,30,31,32]. Some studies have also evaluated the safety of ORAs. For instance, Abraldes and Pérez-Gómez accounted for morphology, infrastructure, and lifeguard services in assessing beach risk levels [33]. Alvarez-Ellacuria et al. presented a real-time beach hazard level associated with nearshore hydrodynamics and applied the alert system to fifteen beaches in the Balearic Islands (Western Mediterranean Sea) to provide nearshore safety conditions for beach safety managers [34]. Chen and Bau established a multi-criteria evaluation structure for tourist beaches [35]. Yang et al. quantified danger levels for 300 Korean beaches based on waves, tides, and topographical conditions and established a risk assessment formula that factored in tourist numbers [36]. Botero et al. and Rangel-Buitrago et al. evaluated recreational beach risks considering urbanization, coastal zoning, and the coastal environment, applying their research in Colombia [37,38]. Bush et al. proposed the utilization of geoindicators for rapid assessment of coastal hazard risk and mitigation [39]. Chen and Teng presented the management priorities and carrying capacity at the high-use beach from tourists’ perspectives [40]. Cervantes and Espejel designed a composite index for assessing recreational beaches using descriptive beach indicators (BIs), beach user perceptions (KIs), and beach economic value indicators (MIs) [41]. Ferrari et al. introduced the Risk of Bathing Index (RBI), a product of hazard and vulnerability, with the hazard level calculated based on the beach’s physical features and hydrodynamic conditions, such as breakwater patterns, rip currents, and slope stability, and vulnerability represented by beach accessibility [42]. In addition, the Coastal Vulnerability Index (CVI) is one of the most used and straightforward methods to assess coastal vulnerability [43,44,45]. Chen et al. engaged in marine risk management due to hazards associated with hydrodynamics and water quality [46]. Mucerino et al. performed image monitoring for beaches along the northwest coast of Italy, analyzed rip currents and wave parameters and quantified marine recreational danger based on probability theory [47].
From the aforementioned studies, it is evident that most research on the risk of ORAs has concentrated on beach-associated risks. However, our study extends to the risks involved in activities occurring within the seawater itself. Consequently, both natural and anthropogenic factors must be simultaneously considered in such risk assessments. Therefore, a framework for assessing the risks of ORAs is proposed. This framework consists of risk identification, the screening of representative risk factors, weighting, and risk analysis.
2. Risk Assessment Method
2.1. The Risk Assessment Process
In this study, risk is calculated as the product of hazard and vulnerability [26]. The process of risk assessment includes risk identification, risk analysis, and risk evaluation. Risk identification is used to determine the factors that cause risk; risk analysis involves setting the grading criteria for each factor and then examining the extent of each factor’s impact based on collected data. The impact is typically categorized into five levels (grades 1 to 5), with 5 being the most severe and 1 being the most minor. Since the impact of each factor on a target varies, it is necessary to perform a weight analysis to obtain the weight value for each factor. In this study, the fuzzy Delphi method (FDM) is employed to determine the significant factors in the risk identification process, while the analytical hierarchy process (AHP) is used to determine the weighting of the factors in the risk analysis process. They will be described in the following paragraphs. Risk evaluation then entails applying the graded risk factors, performing a weight analysis for the study area, and calculating the hazard and vulnerability scores to determine the level of risk for that area. Anfuso et al. summarized the studies that analyzed the main factors affecting coastal vulnerability and susceptibility in recent years [48].
The risk matrix presents the likelihood of risk occurrence in a two-dimensional table format [49], which has been widely used to display the results of risk assessments. For instance, Ferrari et al. assessed the risks in the northwestern maritime region of Italy based on a 4 × 5 risk matrix [42]. This study employs a 5 × 5 risk matrix, as shown in Figure 1, with the horizontal axis divided into five hazard score categories (very low, low, medium, high, and very high hazard) and the vertical axis comprising five levels of vulnerability. Based on the levels of hazard and vulnerability, the risk levels of recreational activities in a maritime area can be quickly identified according to the risk matrix.
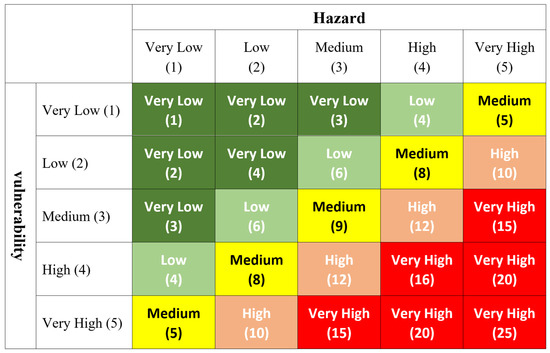
Figure 1.
The risk matrix used in this study.
2.2. Fuzzy Delphi Method (FDM)
Due to the inherently ambiguous nature of human expression and the variability in interpretation from person to person, fuzzy theory has been incorporated into the traditional Delphi method to form the fuzzy Delphi method (FDM), which preserves the integrity of information [50]. The FDM is capable of expressing the fuzziness and uncertainty present in human thought processes, thereby reducing the number of questionnaire iterations needed. In recent years, this approach has been extensively utilized in risk analyses.
For instance, Lee et al. employed the FDM to develop vulnerability indicators across social, economic, and hydrological dimensions to assess the vulnerability of the Han River basin in Korea to flood disasters [51]. Wang et al. applied the FDM in their risk analysis of the coastal zones of China and evaluated indicators such as economic status, level of social development, geomorphology, and coastal disasters to establish a model suitable for complex disaster scenarios [52]. The FDM is employed in this study for the preliminary assessment of factors by stakeholders, which helps make the selection of evaluation factors objective and practical. In this study, “double-triangle fuzzy numbers” are used to consolidate stakeholder opinions, and the “gray zone test method” is applied to verify opinion convergence. The application and test steps are elaborated on below.
First, experts complete the questionnaire based on their expertise to subjectively rate and score the factors in the table on a 0–10 scale, with higher scores indicating greater importance. The lowest value, which represents the expert’s conservatively perceived value (CPV), and the highest value, which represents the expert’s optimistically perceived value (OPV), are selected to establish the quantitative score for each indicator. Second, the minimum value (CLi), geometric mean value (CMi), and maximum value (CUi) are calculated for the remaining CPVs, as are the minimum value (OLi), geometric mean value (OMi), and maximum value (OUi) for the remaining OPVs for each factor i, excluding outliers beyond double the standard deviation, yielding double triangular fuzzy numbers, as depicted in Figure 2. The consensus level achieved by the experts is determined based on the overlap between the two triangular fuzzy numbers. If no overlap occurs (no gray-zone area), the consensus importance value (CIV) of evaluation factor i equals the arithmetic mean of CMi and OMi. If an overlap exists and the gray zone Zi is smaller than the interval range Mi between the geometric averages of CPV and OPV, the CIV of factor i is expressed by the fuzzy set of the intersections of the fuzzy relationships of the two triangular fuzzy numbers. Then, the quantized fraction with the highest membership value is determined. If overlap exists and the gray zone Zi is larger than the interval range Mi, another round of the survey is conducted for factors with divergent opinions. These steps are repeated until all factor opinions converge and the CIV value is obtained.
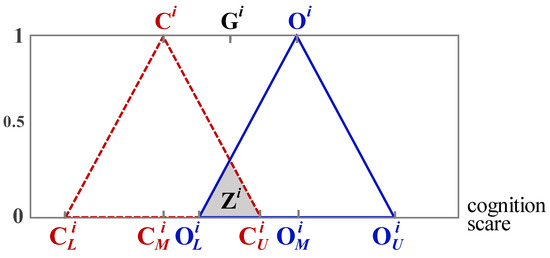
Figure 2.
Double triangular fuzzy numbers obtained with the FDM.
2.3. Analytical Hierarchy Process (AHP)
The analytical hierarchy process (AHP) is a quantitative, multicriteria approach developed to consider the hierarchical structure of decision-making problems [53,54]. The AHP has been employed to determine the weighting coefficients for factors considered in the FDM. The initial step in implementing this technique involves creating a pairwise comparison matrix, which contains entries representing the comparative importance of one factor relative to others. This comparison is assessed using a nine-point scale with importance levels as follows: 1 = equal, 3 = moderately, 5 = strongly, 7 = very strongly, and 9 = extremely important, with 2, 4, 6, and 8 = intermediate levels among those above.
After calculating the weight values, the consistency of each matrix is verified using the consistency ratio (CR), as presented in Equation (1), where RI represents the randomness index, the value of which depends on the matrix order. Equation (2) displays the consistency index (CI), with λmax being the largest eigenvalue of the matrix of order n. The CR is used to identify and avoid potential inconsistencies in the judgment matrix.
CR = CI/RI
CI = λmax − n/n − 1
Saaty argued that if the CR is less than 0.1, the weighting coefficients are appropriate; however, if it is larger than 0.1, the judgments must be re-evaluated to guarantee realistic outcomes [54]. Wang et al. targeted 50 coastal cities in China and, considering factors such as economic and social development, living standards, topography, and natural disasters, utilized the AHP to weigh the relative impact of each factor [52].
3. Hierarchical Structure and the Data
3.1. The Study Site
Taiwan is surrounded by the ocean. In the last decade, the number of people engaging in ORAs and the frequency of these activities have been increasing, leading to a rise in the number of accidents in Taiwan. It has become necessary to assess the risks of ORAs and announce them to the public. The coastline of Taiwan is approximately 2000 km long and has 307 beaches. This study focuses on four different beaches in Taiwan: Wai-Ao beach, Kao-Mei beach, San-Xian-Tai beach, and Nan-Wan beach. Wai-Ao beach (WAB) is located on the northeast coast of Taiwan, facing the Pacific Ocean. The beach spans approximately 1.5 km in length and 168 m in width. Characterized by coarse sand, WAB is renowned for its excellent surfing activities. Kao-Mei beach (KMB), situated on the western coast of Taiwan and facing the Taiwan Strait, features a wetland-style beach with a muddy bottom. It stretches approximately 1 km in both length and width, drawing numerous tourists for sightseeing on holidays. The third beach is San-Xian-Tai beach (SXTB), which is positioned on the eastern coast of Taiwan and faces the Pacific Ocean; it is a gravel beach approximately 2 km long and 50 m wide. The last beach is Nan-Wan beach (NWB), which is located south of Taiwan within a national park and is a bay-type beach with fine sand. It measures approximately 0.6 km in length and 50 m in width, attracting over a million tourists annually. This paper examines these four beaches to exemplify the risk assessment process for ORAs, highlighting their distinct locations and beach attributes, including sandy, gravel, and wetland features.
3.2. Hierarchical Structure
The first step in risk assessment is to perform risk identification, which involves identifying all potential risk factors that could affect ORAs. In this study, a four-level framework is established as shown in Figure 3. The root level (Level 0) is the goal, which is to assess the risk of ORAs. Level 1 is the category of risk, which includes (1) hazard and (2) vulnerability; Level 2 is the criteria of each category for the risk, such as “hazard”, encompassing (1.1) met-ocean conditions, (1.2) geographical features, (1.3) biological and chemical characteristics, and (1.4) historical accidents, and “vulnerability”, encompassing (2.1) social, (2.2) environmental, and (2.3) tourist aspect. The third level includes the factors associated with each criterion. They are (1.1.1) air temperature, (1.1.2) precipitation, (1.1.3) wind, (1.1.4) waves, (1.1.5) current, (1.1.6) tide, (1.1.7) water temperature, (1.1.8) rip current, (1.1.9) storm surge, (1.1.10) rogue wave, (1.1.11) erosion rate, (1.1.12) breaking wave type; (1.2.1) type of coast, (1.2.2) seabed slope, (1.2.3) beach slope, (1.2.4) sand grain size, (1.2.5) sand uniformity, (1.2.6) cleanliness, (1.2.7) coastal structure, (1.2.8) armor block; (1.3.1) toxic organisms, (1.3.2) aggressive marine life, (1.3.3) beach vegetation coverage, (1.3.4) water quality, (1.3.5) air quality; and (1.4.1) number of historical accidents. In addition, (2.1.1) age distribution of the population in nearby towns, (2.1.2) population density, (2.1.3) population education level, (2.1.4) hospital equipment, (2.1.5) number of ambulances, (2.1.6) distance to a coastal guard or lifeguard station, (2.1.7) distance to a hospital, (2.1.8) licensed operator, (2.1.9) average income, (2.2.1) environmental loading capability, (2.2.2) width of sea dyke, (2.2.3) harbor area, (2.2.4) number of trails to shore, (2.2.5) trail conditions, (2.2.6) public transportation, (2.2.7) distance to nearby town/city, (2.2.8) safety and rescue facilities, (2.2.9) public insurance, (2.2.10) infrastructure, (2.2.11) information board; (2.3.1) self-rescue capability, (2.3.2) professional ability when participating in ORAs, (2.3.3) drinking, medication use or other habits, and (2.3.4) equipment preparedness for ORAs are risk factors that fall within the three aspects of vulnerability. In total, the hierarchical structure of the risk assessment in this study covers 2 risk categories, 7 risk criteria and a total of 50 risk factors.
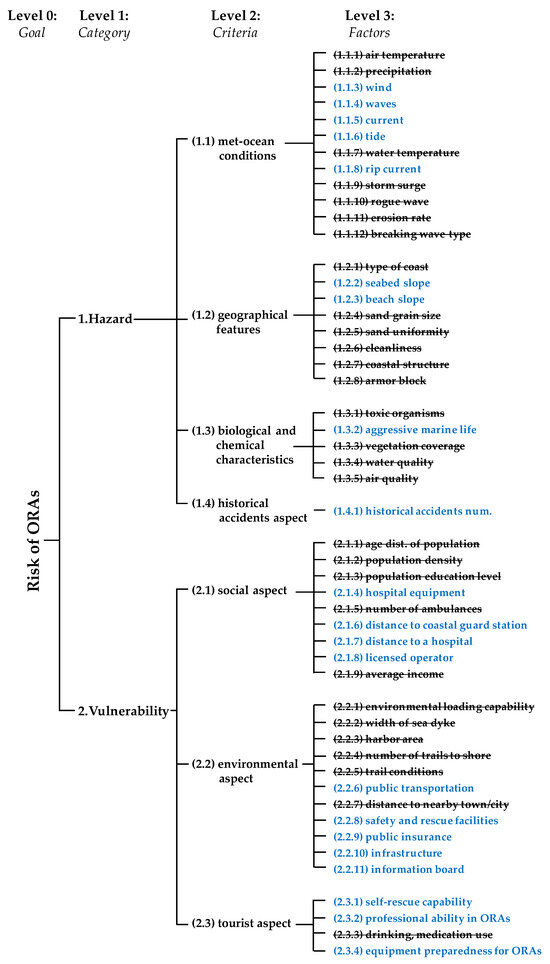
Figure 3.
The hierarchical structure for the risk assessment of ORAs at WAB. This figure shows all 50 factors. The filtered-out factors are marked with strikethrough, and the selected 21 factors marked in blue.
3.3. Data Collection
Data collection for the 50 risk factors highly influences the accuracy of risk assessment. In this study, data are obtained from measurements, numerical modeling, field surveys, existing reports, and official statistics. For example, tidal conditions were obtained from numerous measurements on the Taiwanese coast; however, the wave height and tidal current in nearshore areas were simulated by the WAVEWATCH III and Advanced Circulation Model (ADCIRC) models, respectively. The occurrence probability of rip currents in each coastal town was estimated from the simulations. In addition, many pieces of data, such as accident numbers, public transportation details, and insurance information, were sourced from reports or official statistics provided by various universities or government institutions.
For the beach slope, sand grain size and uniformity, cleanliness, vegetation coverage on the beach, coastal structure, quantity of safety and rescue facilities, number of trails to shore, distance to a coastal guard or lifeguard station, distance to a hospital, infrastructure, information boards, and other environmental and geographic characteristics, data were obtained through field surveys in this study. Information on whether the study area has aggressive marine life and/or toxic organisms was ascertained based on consulting reports issued by coastal management authorities.
Regarding the number of historical accidents, records from water rescue authorities from 2014 to 2020 were reviewed. In terms of social factors, such as the age structure, density and education level of the population and average income in nearby towns, data were obtained upon request from the Ministry of the Interior of Taiwan. Concerning tourist information, data on individuals’ self-rescue capabilities, equipment, and habits were collected through interviews with tourists directly on the beaches.
4. Results and Discussion
4.1. Results of the FDM
A questionnaire survey among stakeholders was conducted to collect data for the FDM. These stakeholders included tourists, coaches, coastal management personnel, professors, lifeguards, and ORA equipment store owners. It was expected that through their experience and understanding of the subject, significant data could be obtained to identify the main factors for assessing the risk of ORAs through the FDM. A total of 25 questionnaires were collected in this study, with each factor scored from 1 to 10, where a higher score indicates greater importance. The consensus importance value (CIV) for each factor was based on the intersection of the maximum number of CPVs and the minimum number of OPVs. A high CIV indicates a high degree of consensus among the stakeholders regarding the importance of a given factor. The threshold consensus value of 6 was used to screen for risk factors, meaning that factors with a CIV of 6 or greater were retained, while those with values below 6 were discarded. Additionally, if the fuzzy numbers for a factor did not converge, indicating no consensus, then that factor was not included in the risk assessment. Table 1 shows the FDM questionnaire analysis results for WAB, revealing that out of 50 risk factors, stakeholders reached a consensus on 9 factors regarding hazard and 12 factors regarding vulnerability, as listed in the table. The hierarchical structure of ORA risk assessment for WAB after factor screening based on the FDM is shown in Figure 3.

Table 1.
Results of factor screening using the fuzzy Delphi method at WAB. The variables in each column of this table are the double triangular fuzzy numbers shown in Figure 1 and the results show whether the factor reaches consensus and is selected.
4.2. AHP Results
To determine the relative importance of various factors, a second phase of stakeholder questionnaire surveys and analysis was performed. In the second phase, the criteria from the previous level were used as a basis for evaluation, comparison and scoring among the factors at the next level. These results were used to not only determine the relative importance of each factor but also establish the weights of the factors.
Overall, 15 questionnaires were completed, of which 11 had a consistency index (CI) value of less than 0.1, qualifying them as valid samples [55]. The weights of the various criteria and risk factors obtained using the AHP method are presented in Table 2. The table shows the relative weight of each factor, together with the overall weight comparison across all factors.
Table 2.
Results of the weight analysis for level 2 and level 3 factors.
From Table 2, it is evident that under the hazard category, “met-ocean conditions” are associated with the highest weight (0.51), followed by “geographic features” (0.22) and “historical accidents” (0.15), with “biological and chemical characteristics” having the lowest weight (0.12). This indicates that stakeholders observe met-ocean conditions as the most significant factor affecting the safety of individuals engaged in ORAs. Among the factors affecting met-ocean conditions, “rip current” is associated with the highest weight (0.28), and for the geographic feature criteria, the “seabed slope” has the highest weight (0.73). In terms of overall weight, the “seabed slope” ranks highest (0.16) among the nine hazard assessment factors, followed by “number of historical accidents” (0.15), “rip currents” (0.14), and “aggressive marine life” (0.12).
Table 2 also presents the analysis of the vulnerability category, where the environmental aspect is associated with the highest weight (0.49), followed by the social (0.27) and tourist (0.24) aspects. Among the influencing factors, “distance to a coastal guard/lifeguard station” has the highest weight (0.33) in the social aspect, “safety and rescue facilities” rank highest (0.35) in the environmental aspect, and “equipment preparedness for ORAs” has the highest weight (0.39) in the tourist aspect. The overall weight is highest for “safety and rescue facilities” (0.17), followed by “information board” (0.14), “equipment preparedness for ORAs” (0.09), and “distance to a coastal guard/lifeguard station” (0.09).
4.3. Risk Assessment
After screening the representative factors through the FDM and obtaining the weight of each factor through the AHP, we conducted a graded scoring of the factors to quantify the risk scores of hazard and vulnerability to understand the extent of each factor’s influence at various beaches. The scoring values range from a maximum of 5 to a minimum of 1.
The scoring standards are introduced in this section. For wind speed, it is assumed that ORAs are suitable when the wind speed is less than Beaufort Scale IV (7.9 m/s). Therefore, the percentage of days on which the mean wind speed exceeds the Beaufort Scale IV is calculated. If the percentage is less than 20% of a year, a score of 1 is assigned, indicating that the beach is minimally affected by wind speed and therefore at low risk. If the wind speed exceeds Beaufort Scale IV on more than 80% of the days in a year, the score is 5. This score is divided into 5 levels (with scores of 2 for 20–40%, 3 for 40–60%, and 4 for 60–80% of days exceeding Beaufort Scale IV, in addition to scores of 1 and 5 described above). A similar approach was used to assess the impact of nearshore currents (mainly tidal currents). A score of 1 is given if the annual average tidal current speed exceeds 1 knot (0.514 m/s) less than 20% of the time; the score progresses similarly up to level 5. The scoring for rip current risk is 1 for a probability of less than 20% of rip current occurrence and 5 for a probability of more than 80%. Additionally, the score is 1 for tidal ranges less than 1 m, 3 for tidal ranges of 1–2 m, and 5 when it is over 2 m. For the impact of wave height, a score of 1 is given when the annual average significant wave height (SWH) is below 0.6 m. Additionally, the impact of extreme waves was considered. If the average SWH is below 0.6 m but extreme waves over 8 m have occurred in the past three years, the score is 2; 3 is given for an average SWH between 0.6 and 1.5 m; finally, a score of 5 is given if the annual average SWH exceeds 1.5 m. A similar approach was applied to other risk factors. Statistical and qualitative results for the 21 screening factors obtained for the four beaches are shown in Table 3. They were used to estimate the scores for both hazard and vulnerability categories. Table 4 shows the final results of the risk assessment for the four beaches explored in this study.
Table 3.
Statistical and qualitative results for the 21 screening factors for the four beaches.
Table 4.
Results of risk assessment for the four beaches.
Figure 4 illustrates the proportions of the contributions of risk factors to the total hazard score for each beach. For example, WAB is categorized as a high-hazard beach with notable contributions from the steep seabed slope (23%), historical accident event (21%), rip current occurrence probability (18%), and occurrence of aggressive marine life (17%) factors. However, the vulnerability level at WAB is very low due to its well-developed infrastructure, leading to the synthetic risk being low. Conversely, although the vulnerability level of KMB is moderate, as shown in Figure 5, the hazard risk level is low; notably, risk is mainly associated with the large tidal range, which accounts for 28% of the total score.
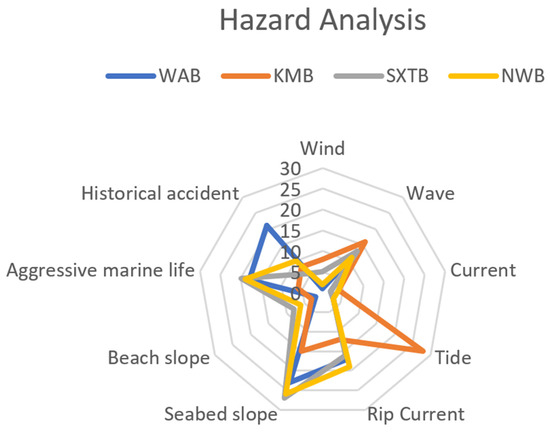
Figure 4.
Proportions of risk factors contributing to the total hazard score at each.
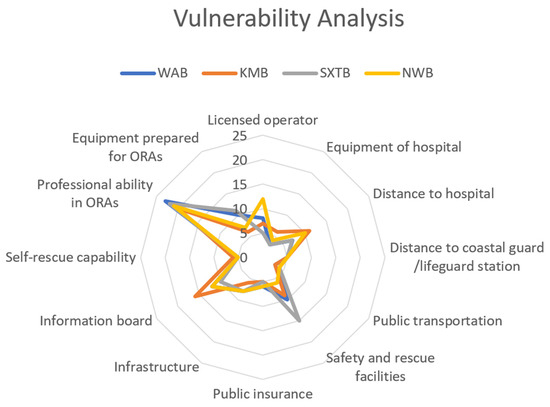
Figure 5.
Proportions of risk factors contributing to the total vulnerability score at each beach.
From Figure 4, it is evident that the primary hazard source for ORAs is the seabed slope. A steeply sloping seabed can cause drowning accidents. Rip currents, which occur without warning, are also a significant risk factor. Moreover, the public’s perception of safety when participating in ORAs is influenced by their awareness of aggressive marine life, such as venomous fish, jellyfish, and toxic algae, as well as the historical occurrence of accidents. Some beaches possess special meteo-ocean conditions that may significantly influence their hazard risk levels. For instance, the large tidal range (4.1 m) at KMB results in a high hazard risk, but this can be moderated by decreasing vulnerability. Similarly, NWB, which is a highly developed tourist area with a comprehensive infrastructure, is assessed as having a moderate hazard risk but an overall low risk due to these mitigating factors. The risk assessment process and corresponding factors proposed in this study consider not only the characteristics of the marine environment but also the development of infrastructure and the preparedness of tourists. They are reflected in the assessments of both hazard risk and vulnerability risk. A risk map for ORAs at the four beaches is shown in Figure 6. The risk assessment for all beaches in Taiwan is depicted in Figure 7. There are 39 (13%) beaches categorized as very low risk, 87 (29%) as low risk, 93 (30%) as medium risk, 62 (20%) as high risk, and 26 (8%) as very high risk for ORAs.
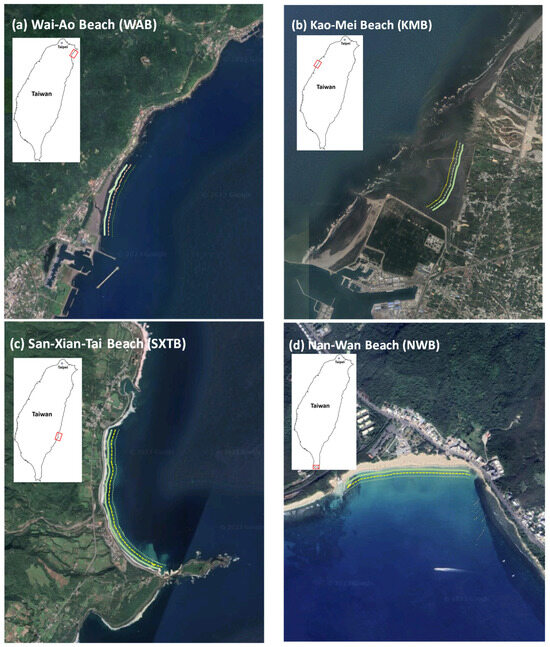
Figure 6.
Results of risk assessment (total risk—bold solid line; hazard risk—dashed line; vulnerability risk—dotted line) at the four beaches explored in this study: (a) Wai-Ao beach; (b) Kao-Mei beach; (c) San-Xian-Tai beach; (d) Nan-Wan beach. (Colors of risk levels: Very low  Low
Low  Medium
  High
High  Very high
  ).
).
Low Medium High Very high ).
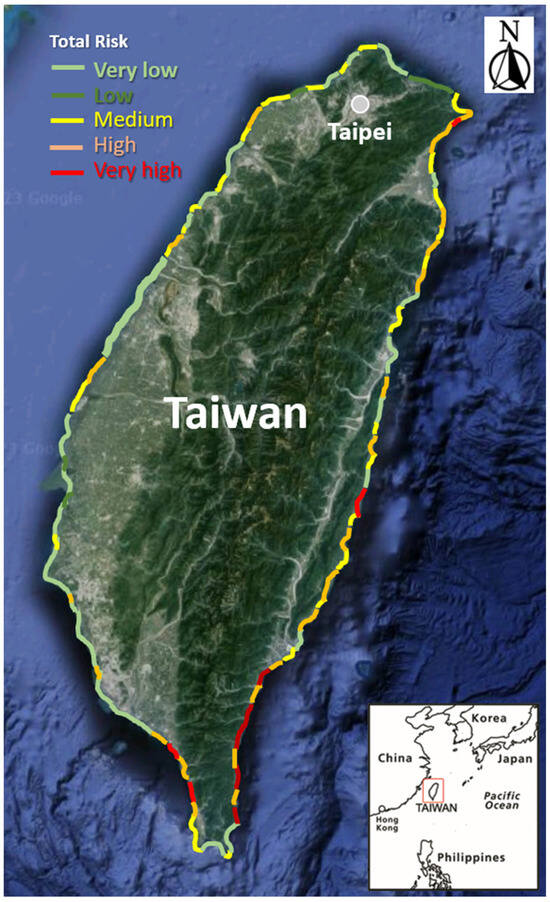
Figure 7.
Total risk distribution at the beaches along the Taiwan coast.
4.4. Discussion
This study assesses the risks that people engaging in recreational activities in the coastal ocean may face based on hazard and vulnerability. It includes 50 factors representing various categories such as potential disasters, beach environment, rescue facilities, and beach location to evaluate the risk levels comprehensively. From this study, it was found that nine hazard factors and twelve vulnerability factors were considered key factors affecting the risk of recreational activities. Previous studies have also focused on multidimensional or multi-hazard risk assessments for beach recreation [56,57]. Risk generation is complex, arising from environmental, ecological, social, and recreational factors. Our study particularly focuses on environmental disasters, such as rogue waves, rip currents, sudden temperature drops, and hazardous organisms, which were less considered in other studies. However, factors like accessibility and infrastructure were also taken into account. Nevertheless, studies like Peña-Alonso et al. focused specifically on water quality, which was not selected as an important factor by the FDM questionnaire respondents in Taiwan, indicating that experts believed there were factors more significant in terms of hazard than water quality [56]. Lozoya et al. emphasized environmental value, stating that environmental services are an integral part of risk assessment and should not be overlooked solely in favor of socioeconomic losses [57]. However, our study did not include environmental services, which could be a direction for future research efforts. Similar to Huang et al. and the studies mentioned earlier, they proposed assessment criteria for sustainable island tourism, which should include governance, economy and finance, socio-culture, and environment dimensions [58]. However, this differs from the direct risk assessment proposed in our study. Our study offers a more direct approach but does not delve into financial aspects. Although we believe that our risk assessment framework covers a broader spectrum, it still has uncertainties and limitations. Firstly, the length of data affects the assessment results, and the resolution of the data significantly impacts the results. The limited water quality data and insufficient bathymetry in our study introduce uncertainties in the analysis results. Additionally, respondents to the questionnaire have local awareness and are influenced by the media, resulting in regional limitations to the results. Nonetheless, even without discussing the analysis results for a specific beach, the risk assessment framework proposed in this paper is still applicable to areas with similar needs. Regardless, this study provides significant assistance to those engaging in ocean recreational activities and coastal managers. The results of beach risk assessments can guide managers in formulating safety regulations and strengthening safety measures. To minimize the impact of the varying characteristics of different beaches on the analysis results, future research could incorporate beach attribute factors that are currently not considered and include assessments of environmental services and ecological values.
5. Conclusions
ORAs such as swimming, snorkeling, diving, surfing, sailing, stand-up paddleboarding (SUP), kiteboarding, and jet or water skiing are becoming increasingly popular worldwide. Any marine activity may involve risks, primarily due to the rapid changes in the marine environment and its unpredictable nature. The risk of ORAs is linked to the characteristics of ocean hydrodynamics, geology, coastal morphology, tourists’ skill levels, and their equipment preparedness. Among these, hydrodynamic characteristics are the most rapidly changing factors, including waves, currents, tides, wind speed, and so on. The main purpose of this study is to evaluate the risks posed by coastal hydrodynamic environments to ORAs, while also considering other objective factors such as tourist behavior and local infrastructure. In this study, the risk level is evaluated according to the joint effects of hazard and vulnerability factors. These factors are extensively listed, and a hierarchical risk assessment framework composed of 4 levels, encompassing 2 risk categories, 7 risk criteria, and 50 risk factors is developed. Through the FDM, 21 representative factors are screened, with 9 hazard factors and 12 vulnerability factors. Then, the AHP is used to analyze the relative weights of these factors, indicating their importance in the overall risk analysis. Data for this study were sourced from field surveys, measurements, numerical simulations, governmental reports, and stakeholder questionnaire responses. The analysis revealed the most important factors affecting hazard risk, such as the seabed slope, the occurrence of rip currents, aggressive marine life, and the frequency and severity of past accidents. The most important factors affecting vulnerability included the skills of tourists participating in aquatic activities, safety and lifesaving equipment, and warning signs. A graphical method is proposed to simultaneously display the levels of hazard risk, vulnerability risk, and overall risk. Finally, 307 beaches in Taiwan were analyzed, with 26 (8%) classified as very high risk, 39 (13%) classified as very low risk, and the remainder classified at intermediate risk levels. These results can provide tourists with quick access to risk information when planning visits to beaches for ORAs.
Author Contributions
Conceptualization, D.-J.D. and C.-R.H.; methodology, H.-C.C.; software, Y.-H.H.; validation, H.-C.C. and Y.-H.H.; formal analysis, H.-C.C.; investigation, H.-C.C.; resources, H.-C.C.; data curation, Y.-H.H.; writing—original draft preparation, H.-C.C.; writing—review and editing, D.-J.D.; visualization, H.-C.C.; supervision, C.-R.H.; project administration, D.-J.D.; funding acquisition, D.-J.D. All authors have read and agreed to the published version of the manuscript.
Funding
This research was funded by National Academy of Marine Research (NAMR) of the Ocean Affairs Council (OAC) in Taiwan grant number NAMR110027 and The APC was funded by National Science and Technology Council of Taiwan.
Institutional Review Board Statement
Not applicable.
Informed Consent Statement
Not applicable.
Data Availability Statement
All data are available upon reasonable request to the corresponding author.
Acknowledgments
The authors would like to express their thanks to the National Academy of Marine Research (NAMR) of the Ocean Affairs Council (OAC) of Taiwan for providing the necessary resources, which were crucial for the realization of the work.
Conflicts of Interest
The authors declare no conflict of interest.
References
- Ghermandi, A.; Nunes, P.A.L.D. A global map of coastal recreation values: Results from a spatially explicit meta-analysis. Ecol. Econ. 2013, 86, 1–15. [Google Scholar] [CrossRef]
- Jennings, G. Water-Based Tourism, Sport, Leisure, and Recreation Experiences; Routledge: London, UK, 2007. [Google Scholar] [CrossRef]
- Hall, C.M. Trends in ocean and coastal tourism: The end of the last frontier? Ocean Coast. Manag. 2001, 44, 601–618. [Google Scholar] [CrossRef]
- Orams, M.B. The Use of the Sea for Recreation and Tourism. In The Oceans: Key Issues in Marine Affairs; Smith, H.D., Ed.; The GeoJournal Library; Springer: Dordrecht, The Netherlands, 2004. [Google Scholar] [CrossRef]
- McManners, H. Water Sports: An Outdoor Adventure Handbook; DK Publishers: New York, NY, USA, 1997; ISBN 9780789410351. [Google Scholar]
- Wilks, J.; Dawes, P.; Pendergast, D.; Williamson, B. Tourists and beach safety in Queensland, Australia. Tour. Mar. Environ. 2005, 1, 121–128. [Google Scholar] [CrossRef]
- Pereira, L.C.C.; Vila-Concejo, A.; da Costa, R.M.; Short, A.D. Managing physical and anthropogenic hazards on macrotidal Amazon beaches. Ocean Coast. Manag. 2014, 96, 149–162. [Google Scholar] [CrossRef]
- Turgut, A.; Turgut, T. A study on rescuer drowning and multiple drowning incidents. J. Saf. Res. 2012, 43, 129–132. [Google Scholar] [CrossRef] [PubMed]
- Morgan, D. Analyzing the risk of drowning at surf beaches. Tour. Rev. Int. 2006, 10, 125–130. [Google Scholar] [CrossRef]
- Fan, S.; Blanco-Davis, E.; Yang, Z.; Zhang, J.; Yan, X. Incorporation of human factors into maritime accident analysis using a data-driven Bayesian network. Reliab. Eng. Syst. Saf. 2020, 203, 107070. [Google Scholar] [CrossRef]
- Castelle, B.; Brander, R.; Tellier, E.; Simonnet, B.; Scott, T.; McCarroll, J.; Lechevrel, P. Surf zone hazards and injuries on beaches in SW France. Nat. Hazards 2018, 93, 1317–1335. [Google Scholar] [CrossRef]
- Haegeli, P.; Pröbstl-Heider, U. Research on personal risk in outdoor recreation and nature-based tourism. Introduction to special issue “Risk in Tourism and outdoor recreation. J. Outdoor Recreat. Tour. 2016, 13, 1–9. [Google Scholar] [CrossRef]
- Dehez, J.; Lyser, S. How ocean beach recreational quality fits with safety issues? An analysis of risky behaviours in France. J. Outdoor Recreat. Tour. 2024, 45, 100711. [Google Scholar] [CrossRef]
- Lee, M.T.; Chang, Y.C.; Yang, H.C.; Lin, Y.J. Assessing risk associated with recreational activities in coastal areas by using a bayesian network. Heliyon 2023, 9, e19827. [Google Scholar] [CrossRef] [PubMed]
- Doong, D.J.; Fan, Y.M.; Chen, J.Y.; Kao, C.C. Analysis of Long-Period Hazardous Waves in the Taiwan Marine Environment Monitoring Service. Front. Mar. Sci. 2021, 8, 657569. [Google Scholar] [CrossRef]
- Boqué Ciurana, A.; Aguilar, E. Which Meteorological and Climatological Information Is Requested for Better Surfing Experiences? A Survey-Based Analysis. Atmosphere 2021, 12, 293. [Google Scholar] [CrossRef]
- Brander, R. Beach safety research. In The Encyclopedia of Coastal Science; Finkl, C., Makowski, C., Eds.; Springer: Berlin/Heidelberg, Germany, 2018. [Google Scholar]
- Didenkulova, E.; Didenkulova, I.; Medvedev, I.P. Freak wave events in 2005–2021: Statistics and analysis of favourable wave and wind conditions. Nat. Hazards Earth Syst. Sci. 2023, 23, 1653–1663. [Google Scholar] [CrossRef]
- Nikolkina, I.; Nikolkina, I.; Didenkulova, I.; Didenkulova, I. Catalogue of rogue waves reported in media in 2006–2010. Nat. Hazards 2012, 61, 989–1006. [Google Scholar] [CrossRef]
- Kalisch, H.; Lagona, F.; Roeber, V. Sudden wave flooding on steep rock shores: A clear but hidden danger. Nat. Hazards 2024, 120, 3105–3125. [Google Scholar] [CrossRef]
- Cavaleri, L.; Bertotti, L.; Torrisi, L.; Bitner-Gregersen, E.; Serio, M.; Onorato, M. Rogue waves in crossing seas: The Louis Majesty accident. J. Geophys. Res. Ocean. 2012, 117. [Google Scholar] [CrossRef]
- Ji, X.; Xu, C.; Ren, Z.; Yan, S.; Wang, D.; Yu, Z. Study on the Formation Characteristics and Disaster Mitigation Mechanisms of Rip Currents on Arc-Shaped Beach. J. Mar. Sci. Eng. 2023, 11, 2381. [Google Scholar] [CrossRef]
- Brewster, B.C.; Gould, R.E.; Brander, R.W. Estimations of rip current rescues and drowning in the United States. Nat. Hazards Earth Syst. Sci. 2019, 19, 389–397. [Google Scholar] [CrossRef]
- Brighton, B.; Sherker, S.; Brander, R.; Thompson, M.; Bradstreet, A. Rip current related drowning deaths and rescues in Australia 2004–2011. Nat. Hazards Earth Syst. Sci. 2013, 13, 1069–1075. [Google Scholar] [CrossRef]
- Castelle, B.; Scott, T.; Brander, R.; McCarroll, R.J. Rip current types, circulation and hazards. Earth-Sci. Rev. 2016, 163, 1–21. [Google Scholar] [CrossRef]
- UNDRO. Natural Disasters and Vulnerability Analysis. Report of Expert Group Meeting; Office of the United Nations Disaster Relief Coordinator (UNDRO): Geneva, Switzerland, 1979. [Google Scholar]
- Almutairi, A.; Mourshed, M.; Ameen, R.F.M. Coastal Community Resilience Frameworks for Disaster Risk Management. Nat Hazards 2020, 101, 595–630. [Google Scholar] [CrossRef]
- Huang, W.P.; Hsu, J.C.; Chen, C.S.; Ye, C.J. The Study of the Coastal Management Criteria Based on Risk Assessment: A Case Study on Yunlin Coast, Taiwan. Water 2018, 10, 988. [Google Scholar] [CrossRef]
- Huang, W.P.; Ye, C.J.; Hsu, J.C. Forecasts of the Compound Coastal Erosion Risks Based on Time-Variant Assessment: A Case Study on Yunlin Coast, Taiwan. Sustainability 2022, 14, 14505. [Google Scholar] [CrossRef]
- Su, Q.; Li, Z.; Li, G.; Zhu, D.; Hu, P. Application of the Coastal Hazard Wheel for Coastal Multi-Hazard Assessment and Management in the Guang-Dong-Hongkong-Macao Greater Bay Area. Sustainability 2021, 13, 12623. [Google Scholar] [CrossRef]
- Imani, M.; Kuo, C.Y.; Chen, P.C.; Tseng, K.H.; Kao, H.C.; Lee, C.M.; Lan, W.H. Risk Assessment of Coastal Flooding under Different Inundation Situations in Southwest of Taiwan (Tainan City). Water 2021, 13, 880. [Google Scholar] [CrossRef]
- Feng, H.; Zhu, L.; Wu, J.; Squires, V.R. A Review of Disaster Risk Assessment and Mitigation in Vulnerable Coastal Communities. J. Coast. Res. 2023, 39, 328–333. [Google Scholar]
- Abraldes, J.A.; Pérez-Gómez, J. Assessment of Risk Factors for Injuries on Beaches. Int. J. Aquat. Res. Educ. 2009, 3, 6. [Google Scholar] [CrossRef]
- Alvarez-Ellacuria, A.; Orfila, A.; Olabarrieta, M.; Gómezpujol, L.; Medina, R.; Tintoré, J. An Alert System for Beach Hazard Management in the Balearic Islands. Coast. Manag. 2009, 37, 569–584. [Google Scholar] [CrossRef]
- Chen, C.L.; Bau, Y.P. Establishing a Multi-criteria Evaluation Structure for Tourist Beaches in Taiwan: A Foundation for Sustainable Beach Tourism. Ocean Coast. Manag. 2016, 121, 88–96. [Google Scholar] [CrossRef]
- Yang, B.; Lee, J.; Hwang, J.S.; Kweon, H.M.; Lee, J.L. Quantitative Risk Assessment for Beach Drowning Management. J. Coast. Res. 2014, 72, 117–121. [Google Scholar] [CrossRef]
- Botero, C.M.; Pereira, C.; Anfuso, G.; Cervantes, O.; Williams, A.T.; Pranzini, E.; Silva, C.P. Recreational Parameters as An Assessment Tool for Beach Quality. J. Coast. Res. 2014, 70, 556–562. [Google Scholar] [CrossRef]
- Rangel-Buitrago, N.; Neal, W.J.; de Jonge, V.N. Risk Assessment as Tool for Coastal Erosion Management. Ocean Coast. Manag. 2020, 186, 105099. [Google Scholar] [CrossRef]
- Bush, D.M.; Neal, W.J.; Young, R.S.; Pilkey, O.H. Utilization of Geoindicators for Rapid Assessment of Coastal-hazard Risk and Mitigation. Ocean Coast. Manag. 1999, 42, 647–670. [Google Scholar] [CrossRef]
- Chen, C.L.; Teng, N. Management Priorities and Carrying Capacity at a High-use Beach from Tourists’ Perspectives: A Way towards Sustainable Beach Tourism. Ocean Policy 2016, 74, 213–219. [Google Scholar] [CrossRef]
- Cervantes, O.; Espejel, I. Design of An Integrated Evaluation Index for Recreational Beaches. Ocean Coast. Manag. 2008, 51, 410–419. [Google Scholar] [CrossRef]
- Ferrari, M.; Carpi, L.; Pepe, G.; Mucerino, L.; Schiaffino, C.F.; Brignone, M.; Cevasco, A. A Geomorphological and Hydrodynamic Approach for Beach Safety and Sea Bathing Risk Estimation. Sci. Total Environ. 2019, 671, 1214–1226. [Google Scholar] [CrossRef]
- Hamid, A.I.A.; Din, A.H.M.; Yusof, N.; Abdullah, N.M.; Omar, A.H.; Abdul Khanan, M.F. Coastal Vulnerability Index Development: A Review. Int. Arch. Photogramm. Remote Sens. 2019, 42, 229–235. [Google Scholar] [CrossRef]
- Yahia Meddah, R.; Ghodbani, T.; Senouci, R.; Rabehi, W.; Duarte, L.; Teodoro, A.C. Estimation of the Coastal Vulnerability Index Using Multi-Criteria Decision Making: The Coastal Social–Ecological System of Rachgoun, Western Algeria. Sustainability 2023, 15, 12838. [Google Scholar] [CrossRef]
- Šimac, Z.; Lončar, N.; Faivre, S. Overview of Coastal Vulnerability Indices with Reference to Physical Characteristics of the Croatian Coast of Istria. Hydrology 2023, 10, 14. [Google Scholar] [CrossRef]
- Chen, J.G.; Zhong, Y.Z.; Chuang, L.Z.H.; Koppe, B.; Chien, H. Risk Management of Coastal Water Safety for Recreational Activities: The Case of Taoyuan Coast. Appl. Geogr. 2020, 117, 102173. [Google Scholar] [CrossRef]
- Mucerino, L.; Carpi, L.; Schiaffino, C.F.; Pranzini, E.; Sessa, E.; Ferrari, M. Rip Current Hazard Assessment on a Sandy Beach in Liguria, NW Mediterranean. Nat. Hazards 2021, 105, 137–156. [Google Scholar] [CrossRef]
- Anfuso, G.; Postacchini, M.; Di Luccio, D.; Benassai, G. Coastal Sensitivity/Vulnerability Characterization and Adaptation Strategies: A Review. J. Mar. Sci. Eng. 2021, 9, 72. [Google Scholar] [CrossRef]
- Garvey, P.R.; Lansdowne, Z.F. Risk Matrix: An Approach for Identifying, Assessing, and Ranking Program Risks. Air Force J. Logist. 1998, 22, 18–21. [Google Scholar]
- Ishikawa, A.; Amagasa, M.; Shiga, T.; Tomizawa, G.; Tatsuta, R.; Mieno, H. The Max-min Delphi Method and Fuzzy Delphi Method via Fuzzy Integration. Fuzzy Sets Syst. 1993, 55, 241–253. [Google Scholar] [CrossRef]
- Lee, G.; Jun, K.S.; Chung, E.S. Integrated Multi-criteria Flood Vulnerability Approach using Fuzzy TOPSIS and Delphi Technique. Nat. Hazards Earth Syst. Sci. 2013, 13, 1293–1312. [Google Scholar] [CrossRef]
- Wang, G.; Liu, Y.; Wang, H.; Wang, X. A Comprehensive Risk Analysis of Coastal Zones in China. Estuar. Coast. Shelf Sci. 2014, 140, 22–31. [Google Scholar] [CrossRef]
- Saaty, R.W. The Analytic Hierarchy Process—What it is and How it is Used. Math. Model. 1987, 9, 161–176. [Google Scholar] [CrossRef]
- Saaty, T.L. The Analytic Hierarchy Process: Planning, Priority Setting, Resources Allocation; McGraw: New York, NY, USA, 1980; ISBN 978-0070543713. [Google Scholar]
- Saaty, T.L. Decision-making with the AHP: Why is the Principal Eigenvector Necessary. Eur. J. Oper. Res. 2003, 145, 85–91. [Google Scholar] [CrossRef]
- Peña-Alonso, C.; Ariza, E.; Hernández-Calvento, L.; Pérez-Chacón, E. Exploring Multi-dimensional Recreational Quality of Beach Socio-ecological Systems in the Canary Islands (Spain). Tour. Manag. 2018, 64, 303–313. [Google Scholar] [CrossRef]
- Lozoya, J.P.; Sardá, R.; Jiménez, J.A. A Methodological Framework for Multi-hazard Risk Assessment in Beaches. Environ. Sci. Policy 2011, 14, 685–696. [Google Scholar] [CrossRef]
- Huang, W.; Chen, C.-Y.; Fu, Y.-K. The Sustainable Island Tourism Evaluation Model Using the FDM-DEMATEL-ANP Method. Sustainability 2022, 14, 7244. [Google Scholar] [CrossRef]
Disclaimer/Publisher’s Note: The statements, opinions and data contained in all publications are solely those of the individual author(s) and contributor(s) and not of MDPI and/or the editor(s). MDPI and/or the editor(s) disclaim responsibility for any injury to people or property resulting from any ideas, methods, instructions or products referred to in the content. |
© 2024 by the authors. Licensee MDPI, Basel, Switzerland. This article is an open access article distributed under the terms and conditions of the Creative Commons Attribution (CC BY) license (https://creativecommons.org/licenses/by/4.0/).