Abstract
In this study, we analyzed the clay mineralogy and geochemistry of surface and drill core samples from the northeastern Beibu Gulf in order to unravel the sediment provenance of, and factors controlling, the sedimentary environment. The main clay mineral assemblage in the surface sediment samples included kaolinite (27–72%), smectite (4–51%), illite (7–20%), and chlorite (8–17%). The study area comprises three major clay distribution zones (from the northeastern coastal area to central Beibu Gulf basin), i.e., the kaolinite-dominated, kaolinite–smectite, and smectite-dominated zones. The zoning of the clay mineralogy and major and trace elements indicated the mixing of coarse terrigenous sediments with distal fine sediments. Early Holocene sea level rise was documented in core B15-1, which had three sedimentary units (divided into Units 1–3 from top to bottom), as revealed by the changes in the dominant clay minerals and geochemical/oxide ratios (SiO2/Al2O3, Rb/Sr, Sr/Ba, and Ti/Ca) in Unit 2. Unit 1 and Unit 3 were likely deposited in the continental and marine environments, respectively. The low sedimentation rate and hydrodynamic disturbance may have influenced the deposition process more than climatic fluctuations.
1. Introduction
Marginal marine basins are key locations for terrigenous materials, which are transported by rivers and/or wind from the adjacent continental areas [1,2]. Terrigenous detrital derived from erosion, as well as the physical and chemical weathering of rock outcrops around drainage basins, will be transported by rivers towards the ocean. Marginal seas are the first stop for these terrestrial-sourced sediments, whilst marine basins are their final sinks [2,3,4].
The Beibu Gulf (BBG, aka. Gulf of Tonkin) is a semi-closed, marginal sea basin in the northwestern South China Sea (SCS). Glacial–interglacial cycles likely have great impacts on the Quaternary sedimentary process in the SCS through changes in sea level and the East Asia Monsoon (EAM) [1,5,6,7,8].
As the largest marginal sea in the northwestern Pacific, the Cenozoic SCS has undergone substantial changes in tectonics, climate, and sea level [1,9]. Over 80% of the sediments on the continental shelf and slope are derived from the surrounding fluvial drainage, which has been active since the Oligocene [10]. The low sea level during the Last Glacial Period may have led to the exposure of a large area of the SCS continental shelf, which was submerged during the subsequent global sea level rise, including the whole BBG. This process may have significantly changed the land–ocean configuration and changed the SCS sediment transport pathway [7,11].
The climate regime has a major controlling effect on the weathering and sediment transport process in drainage basins [12,13]. Rainfall and temperature increased in East Asia with the weakened East Asia Winter Monsoon and intensified Summer Monsoon following the onset of the Holocene [14,15]. Sediments from Huguangyan Maar Lake indicate that climatic vacillation was intense in the early Holocene, gradually weakening in the mid- and late Holocene [16]. The intensity of physical erosion and chemical weathering is controlled by precipitation and temperature [17]. Paleoclimatic environmental events can influence the formation of weathering sediments, as documented in the vertical variation in clay minerals. Differences in clay mineral assemblages between provenances can aid in the tracing of fine-grain inputs, thus reflecting coeval paleoclimatic events (monsoons, ice events, etc.) in the sediment source region [18,19,20,21,22]. Several Holocene paleoclimatic events were identified in the clay mineral assemblages in core B106 and SO-31 (the southern BBG) [23,24]. The kaolinite/smectite ratio of core GC19-28 in the western mouth tidal delta of the Qiongzhou strait was used to study the regional monsoon rains of the past two millennia [25]. Meanwhile, the sea level change also strongly influenced the ocean current pattern, thus controlling the clay mineral compositions in marine sediments.
Fine-grained sediments can be transported by ocean currents over a long distance [26,27,28]. As an important component of fine sediments, clay minerals (usually <2 μm) are widely found in marine muds, which can be used to trace the provenance and disperse pathway of the fine sediment fraction [2,29]. Understanding the clay record can enable the reconstruction of the terrestrial material provenance, depositional environment, monsoon evolution, sea level change, and ocean current circulation [30,31,32].
The BBG has a high modern sedimentation rate (0.1–0.5 cm/a) in its eastern parts [33]. There are few studies focusing on the core sediments in deep-water areas of the NE BBG. In this study, the clay mineralogical and geochemical compositions of both surface and core sediments from the NE BBG were analyzed to reveal their Holocene regional sedimentary provenance and environmental variations and to investigate the following: (1) the modern sedimentary pattern of the study area and the variation in the terrestrial material provenance of the deep-water areas of the BBG; (2) the factors controlling clay mineral characteristics in the study area; and (3) the paleoenvironmental information recorded in the sediments and the ways in which the clay mineralogical and geochemical characteristics respond to paleoenvironmental change.
2. Hydrographic and Geological Settings
The NE BBG is part of the northwestern SCS continental shelf (Figure 1b). The gulf covers an area of ~1.28 × 10⁵ km2, with mean and maximum depths of 38 m and ≤100 m, respectively [34]. The Quaternary BBG basin is tectonically stable, with a low subsidence rate and constant sedimentation rate [35]. The gulf is also alternately affected by winter and summer monsoons, with the winter monsoons being longer and stronger [36,37].
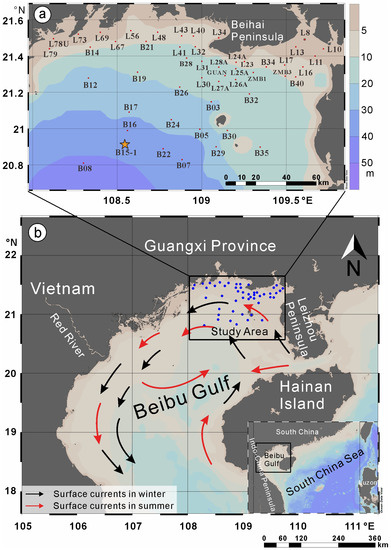
Figure 1.
(a) Sampling stations in the northeastern BBG. Black dots and the orange star denote the seafloor surface sediment sampling sites and core location, respectively. (b) Geographic map of the BBG, showing the modern summer (red arrow) and winter (black arrow) current circulation systems, modified after [38]. Map drawn with Ocean Data View [39]. The legend and references are provided in the web version of this article.
2.1. River Discharge and Sediment Input
Over 300 rivers flow into the BBG, with the major ones including the Nanliu and Qinjiang Rivers in Guangxi Province, the Changhua River on Hainan Island, and the Red River in Vietnam [40]. The Red River runoff contributes the majority of the surface discharge entering the BBG, including 550 km3 of water and 110 million tonnes (Mt) of suspended sediments per annum [41]. The distal transport of suspended fine sediments from the Pearl River also influences the sedimentary process of the BBG [26,28], while the rivers in Guangxi and Hainan contribute 3 Mt/a of suspended sediments [2].
2.2. Ocean Current System
The study area is influenced by the Beibu Gulf circulation. The gulf did not connect with the northern SCS until the Qiongzhou Strait completely opened up at ~8.5 ka BP [42]. The modern circulation pattern was formed after ~7 ka BP [43] and consists of three components: (1) high-salinity SCS water masses entering through the central-eastern parts of the southern bay exit (west of Hainan Island); (2) medium-salinity water masses from the northern SCS, entering through the Qiongzhou Strait; and (3) low-salinity surface runoff from the north-northwest area, mainly from the Red River [44].
The Beibu Gulf circulation is generally counterclockwise throughout the year, and the nested sub-circulation varies in different seasons (as indicated by the black and red arrows in Figure 1b), which is cyclonic in winter and to the north but anticyclonic in summer and to the south (boundary at ~19°30′ N; [45]). In the NE BBG, circulation is co-influenced by thewestward flow through the Qiongzhou Strait and local wind fields [46,47].
2.3. Sea Level Change
During the Last Glacial Maximum, the sea level was probably ~130 m below the modern sea level [48,49,50], and a large area of the SCS continental shelf (incl. the BBG seabed) was likely subaerially exposed to weathering and erosion [11]. Subsequently, the global sea level rose again up to the mid-Holocene in three major episodes (i.e., 15–14.5 ka BP, 13 ka BP, and 11–8 ka BP), reaching 60 m [51]. The BBG seabed may have been inundated again during this period.
3. Sampling and Analytical Methods
3.1. Sampling
Our sediment samples were collected in the summer of 2020 from the NE BBG as part of the “Survey and Assessment of Natural Resources in the Beibu Gulf” project (No. 4 Institute of Oceanography, Ministry of Natural Resources (MNR)). The samples include both surface sediments and core sediments. The former were collected by grab samplers from 50 stations (20°48′37″ N to 21°32′24″ N and 108°05′55″ E to 109°43′09″ E) (Figure 1a). Core B15-1 (108°33′00″ E, 20°54′40″ N) is 87 cm long, and the sampling was conducted at 3 cm intervals. A total of 28 samples were collected (Supplementary Table S1).
3.2. Analytical Methods
Clay mineral analyses were carried out on a <2 μm sediment fraction, which was separated based on Stoke’s settling velocity principle ([52] and references therein). Organic matter and calcite carbonate were removed using 30% H2O2 and 10% HCl, respectively, before the analyses. The clay samples were placed onto glass slides via wet smearing before being air-dried. After a preliminary XRD analysis, the naturally oriented slides were solvated with ethylene glycol in an under-pressurized desiccator (35 °C, 36 h). The clay minerals were analyzed with a PANalytical diffractometer at the MNR Key Laboratory of Submarine Geosciences using CuKα radiation (45 kV, 40 mA), 3–35° 2θ scanning, and a 0.0167° 2θ step size.
The identification and semi-quantitative analyses of the clay minerals were performed via XRD under air-dried and ethylene glycol (EG) solvation conditions. The relative clay mineral contents were determined from the integrated intensity (peak area) of the diagnostic crystalline peaks on the glycolated curve [53], e.g., 15–17 Å for smectite (incl. I/S random mix layer minerals), 10 Å for illite, and 7.2 Å for kaolinite and chlorite. The relative contents of kaolinite and chlorite were obtained from the kaolinite 3.58 Å and chlorite 3.54 Å diffraction peaks, whilst the diffraction pattern data were calculated with the MacDiff software (http://servermac.geologie.unifrankfurt.de/Staff/Homepages/Petschick/RainerE.html, accessed on 27 June 2021).
The illite crystallinity, defined as the full width at half maximum height (FWHM) of the illite 10 Å peak, and the illite chemistry index (the ratio of the illite 5 Å and 10 Å peaks) were determined based on the glycolated curve. Illite crystallinity can be used as an indicator of the fineness of the lattice order and crystalline grain. Lower/higher illite crystallinity implies weaker/stronger hydrolysis in a sediment provenance, respectively [30,54,55]. An illite chemistry index <0.5 represents Fe–Mg-rich illite (e.g., biotite, mica) characterized by physical erosion, suggesting that the illite was formed under weak hydrolysis. In contrast, an illite chemistry index >0.5 is commonly found in Al-rich illite (muscovite) that crystallized under stronger hydrolysis with intense chemical weathering [31].
The sediment samples were dried at 50 °C and then milled to a 200-mesh size for bulk-sediment geochemical analyses at ALS Chemex (Guangzhou, China) Co., Ltd. The powder sample was mixed with a Li3BO3/LiBO2 fluxing agent, fused in crucibles, and then cooled to form glass discs for major element analysis using a PANalytical-PW2424 X-ray fluorescence (XRF) spectrometer, with GBW07105, NCSDC47009, and SARM-4 as the standard reference materials. The relative errors (RE) and relative deviations (RD) were below 5%. For the trace elements, the samples were digested with HNO3-HF-HClO4, subsequently evaporated to near-dryness on a hot plate, and dissolved with 1 M HCl. All the samples were analyzed using an Agilent 7900 ICP-MS, with an RE and RD below 10%. The reference materials, GBM908-10, OREAS-25a, MRGeo08, and OREAS-45h, were employed as standard reference materials. The clay content and elemental distribution maps were drawn with Ocean Data View software (https://odv.awi.de, accessed on 28 August 2021).
Two calcium shell materials from core B15-1-6 (at 17−20 cm depth) and B15-1-12 (at a 38–41 cm depth) were analyzed for their 14C/13C ratios as compared to the standard reference material, NIST-4990C, within one relative standard deviation, using in-house NEC accelerator mass spectrometers (AMS) (Beta Analytic Inc., Miami, FL, USA). The calibration of the materials’ radiocarbon age was carried out using MARINE 20 software [56,57].
The chemical index of alteration (CIA), which defines the relationship between alkali oxides (Na2O, K2O), CaO, and Al2O3 [58], is expressed as:
CIA = [Al2O3/(Al2O3 + CaO* + Na2O* + K2O)] × 100
All the oxides above are in molar proportions, and CaO* and NaO* denote the concentrations of calcium/sodium oxide in the silicate fraction of the sediments, respectively [59]. If the sediment CaO/Na2O molar ratio is <1, then CaO* = CaO; otherwise, the Na2O value is used for the calculation [60]. Na2O* is defined as Na2Ototal – Na2ONaCl. Na2ONaCl is calculated assuming that the Na-Cl concentration ratio is 1:2, which means that Na2ONaCl is equal to 1/2 Cl (in molar proportions) [61,62].
The Index of compositional variability (ICV) is expressed as follows:
ICV = (CaO* + Na2O* + K2O + Fe2O3 + MgO + TiO2)/Al2O3
The oxides above are in mass weight [63].
The Eu anomaly (δEu) and Ce anomaly (δCe) can be expressed as follows: δEu = /; δCe = /, where the subscript N represents chondrite normalization (Xsample/Xchondrite, X represents an element) [64].
4. Results
4.1. Clay Mineralogy
For the surface sediment samples, kaolinite (27–72%, avg. = 51%) and smectite (4–51%, avg. = 23%) are the dominant clay minerals, and minor illite (7–20%, avg. = 13%) and chlorite (8–17%, avg. = 13%) are also present (Supplementary Table S1). Kaolinite is the main clay mineral type in the NE BBG coastal area, whose content decreases rapidly toward the central part of the gulf. Conversely, the highest smectite content occurs in the SW BBG, where the water depth exceeds 30 m. The smectite content is the lowest (<15%) in the NE BBG, around the Beihai peninsula (Figure 2a,c). Illite and chlorite are analogous in terms of mineralogy, but their spatial variation trends are different. Although the illite content increases with water depth, the southeastern study area, which is close to the Qiongzhou Strait, has a higher illite content than the southwestern area (Figure 2b), whereas the chlorite content drops slightly from the northeast to southwest (Figure 2d). For the surface sediment samples, the illite chemistry index and crystallinity range from 0.52 to 0.87 (avg. 0.69) and from 0.23 to 0.31° 2θ (avg. 0.23° 2θ), respectively (Supplementary Table S1).

Figure 2.
Spatial distribution of clay minerals in the study area. Percentage contents of: (a) smectite; (b) illite; (c) kaolinite; (d) chlorite.The clay mineral assemblage of core B15-1 is composed of kaolinite (17–71%), smectite (1–56%), chlorite (8–24%), and illite (3–18%), with a major shift in the relative content of the clay assemblage in the middle part of the core (Figure 3). Remarkably, the kaolinite content rises to ~70% in the upper part of the core, where there is hardly any smectite.


Figure 3.
Lithology and clay mineral variation of core B15-1. Dashed lines represent lithological boundaries.
Figure 3.
Lithology and clay mineral variation of core B15-1. Dashed lines represent lithological boundaries.

4.2. Major and Trace Element Compositions
A total of 79 sediment samples (51 surface sediment and 28 core sediment samples) were analyzed for their major element contents, with the results listed in Supplementary Table S1 and their spatial distribution illustrated in Figure 4. The variation trends of the SiO2 content (surface sample: 55.7–94.6 wt%; B15-1 core sample: 56.2–84.2 wt%) and Al2O3 content (surface sample: 0.27–18.0 wt%; B15-1 core sample: 4.90–23.0 wt%) are highly variable. The contents of the other major element oxides are generally below 6 wt%, and they (except for CaO) show similar spatial and vertical variation trends with Al2O3 (Figure 4 and Figure 5).
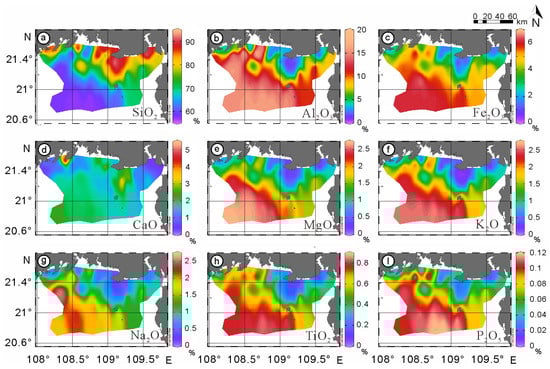
Figure 4.
Major element distribution maps of the study area. Concentrations of: (a) SiO2; (b) Al2O3; (c) Fe2O3; (d) CaO; (e) MgO; (f) K2O; (g) Na2O; (h) TiO2; (I) P2O5.
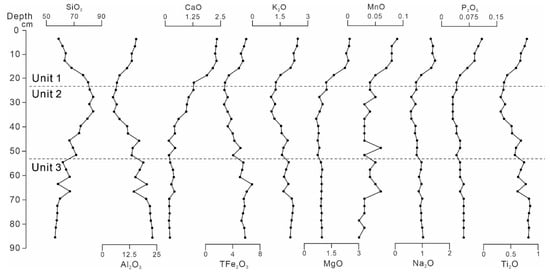
Figure 5.
Sediment major element variations of core B15-1. Dashed lines represent lithological boundaries.
The spatial distribution patterns of many of the trace elements (including Sc, V, Cr, Ni, Rb Nb, and Th) are highly similar to those of major elements like Al2O3, i.e., they are enriched in the surface sediments with greater water depth but depleted in the coastal area with high SiO2 content (Figure 6a–e,h,I). A good correlation between the Sr and CaO concentrations can be observed (Figure 6f). A high Zr concentration only occurs in limited areas close to Zhenzhu Harbor and Tieshan Port, located in the northwestern and northeastern parts of the study area, respectively (Figure 6g). The concentrations of Sc, V, Cr, Ni, Rb, Nb, and Th from core B15-1 largely show the same trend, decreasing in Unit 1 and gradually increasing in Units 2 and 3. Zr and Sr show different distribution patterns: Sr is stable in Unit 2 and 3, increasing in Unit 1, while Zr increases downcore and reaches its maximum near the bottom of Unit 2, while decreasing in Unit 3 (Figure 7).
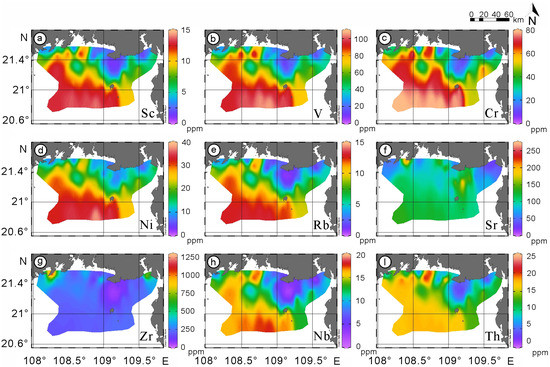
Figure 6.
Trace element distribution maps of the study area. Concentrations of: (a) Sc; (b) V; (c) Cr; (d) Ni; (e) Rb; (f) Sr; (g) Zr; (h) Nb; (I) Th.
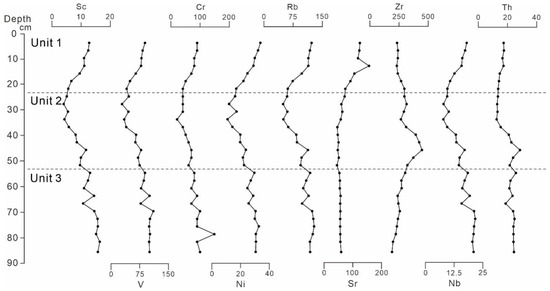
Figure 7.
Sediment trace element variations of core B15-1. Dashed lines represent lithological boundaries.
The rare earth element (REE) data were normalized to the average chondrite, upper continental crust (UCC) compositions and Post-Archaean average Australian sedimentary rock (PAAS) [64,65,66]. After normalization, most of the samples had a flat REE pattern, indicating the similarity between our samples and the average UCC composition, especially in case of the core sediments with slight Eu anomalies (Figure 8c–f).
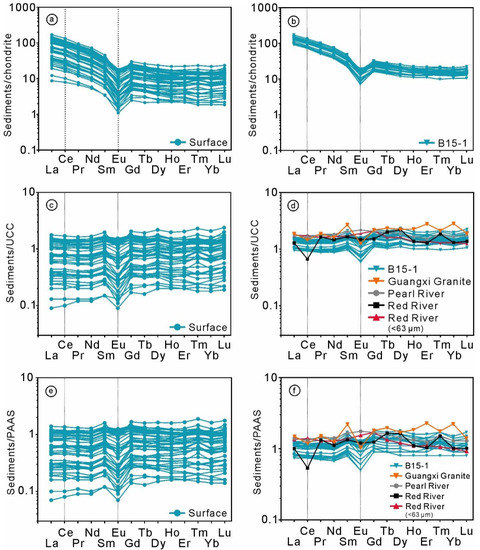
Figure 8.
Chondrite-, upper-continental-crust (UCC)-, and Post-Archaean average Australian sedimentary rock (PAAS)-normalized REE patterns of the sediments from the northeastern BBG. The chondrite-, UCC-, and PAAS-normalized values are from Boynton (1984) [65] and Taylor and Mclennan (1985) [64], respectively. Bulk sediment (<63 μm) REE data source: Guangxi Province, Red River and Pearl River [67,68,69,70]. (a) chondrite-normalized REE patterns of surface sediments; (b) chondrite-normalized REE patterns of core sediments; (c) UCC-normalized REE patterns of surface sediments; (d) UCC-normalized REE patterns of core sediments; (e) PAAS-normalized REE patterns of surface sediments; (f) PAAS-normalized REE patterns of core sediments.
The surface and core sediments in the NE BBG have uniform REE fractionation patterns (Figure 8a,b) Chondrite-normalized REE patterns are characterized by relative LREE (La-Sm) over HREE (Eu-Lu) enrichments and negative Eu and undiscernible (or slightly positive) Ce anomalies. The sediments show flat UCC-normalized patterns with a moderately negative Eu anomaly (Figure 8c,d). This pattern is similar to the PAAS-normalized pattern (Figure 8e,f). The REE patterns of the core B15-1 sediment samples are similar to those of the surface sediments, with a narrower variation range. The δCe (0.99–1.07) results show little change in value, whereas those for δEu (0.36–0.63) have two-stage variation, like the major elements (Supplementary Table S2). Based on the downcore variations in the clay mineral and geochemical compositions, core B15-1 can be subdivided into three units: Unit 1 (0–23 cm), Unit 2 (23–53 cm), and Unit 3 (53–87 cm). Units 1 and 2 mainly consist of dark grey clayey silt, with a greater sand fraction and gravel quartz occurring in Unit 2, while Unit 3 consists of dark brown silty clay.
5. Discussion
5.1. Variations in Clay Mineral Assemblages and Provenance
The BBG is a semi-enclosed sea, and thus, post-depositional diagenesis is considered negligible for its Quaternary unconsolidated sediments. The surface clay mineral distribution observed in this study is consistent with that in previous studies [71,72]. The clay mineral compositions vary at different water depths, especially close to estuaries. The surface sediments are rich in smectite and depleted in kaolinite near the central gulf. A drastic drop in the kaolinite content was observed in the estuaries of the Pearl River and Red River, which could be caused by the differential settlement of the clay minerals (particles with a larger radius will settle first) [2,52,73,74]. The most drastic change is that in the kaolinite content, which drops rapidly from >65% in Lianzhou Bay and Tieshan Port (Beihai peninsula, Guangxi) to <40% in the areas with a water depth above 20 m (Figure 2). The high content of kaolinite around the Beihai peninsula is likely attributed to the kaolin deposits that are widespread in Hepu (Guangxi), where illite is the intermediate product of kaolinite formation in the weathering crust [75,76]. A similar change was also observed in the transect from the Pearl River estuary to the northern SCS continental slope [73]: the highest kaolinite and lowest smectite contents occur in surface sediments from the longshore area. The relative kaolinite content shows a sharp drop, shifting from being the dominant clay mineral to a minor clay mineral toward the continental slope.
Considering the sediment transport capacity and distance from the sediment sink, we considered the Red River, Pearl River, and the rivers in Guangxi and Hainan as the potential surface clay provenance in this region. Every drainage system has its own clay mineral assemblage; thus, the characteristic end-members play a major role in identifying the sediment provenance [25,73,77].
In order to constrain the clay mineral provenance of the study area, the ternary of the smectite-(illite + chlorite)-kaolinite (i.e., S-(I + C)-K) discrimination plot was applied to both our surface and core sediment data (Figure 9). The samples from the coastal stations and Unit 3 fall close to the K-(I + C) line, resembling the clay mineral assemblages of Guangxi, while the other samples gradually deviate from the kaolinite end to the smectite end with increasing water depth. The slope of Luzon and the Gulf of Thailand have the highest smectite contents (>70%) in the SCS [2]. Although smectite can travel long distances via ocean currents, it is unlikely that the present SCS current system could transport much smectite from Luzon and the Gulf of Thailand into the BBG [2,78]. Hence, the high smectite content in the central BBG is likely due to the secondary differential settlement of clay minerals from the current, forming the gradational variation of clay mineral assemblages in the western and central BBG and the western Qiongzhou Strait. The data plot in the S-(I + C)-K diagram indicates that the smectite is mainly supplied by the Red River, and the smectite in the surface sediments is gradually enriched along the summer northern cyclonic gyre [25,38,79].
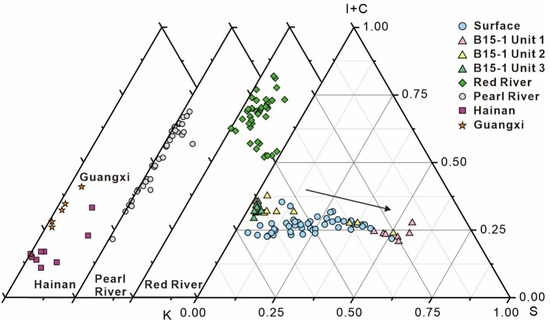
Figure 9.
S-(I + C)-K ternary plots for argillaceous sediments from the study area and surrounding drainage basins. Data source: Pearl River and Red River from Liu et al. (2007b) [80]; Guangxi and Hainan rivers from Liu et al. (2016) [2].
Closely related to the sediment source weathering conditions, the illite crystallinity–illite chemical index can be used to differentiate sediment provenances [7,19,81,82]. In the illite crystallinity vs. illite chemical index discrimination plot for the core B15-1 sediments (Figure 10), most of the Unit 1 and Unit 2 samples fall within the Pearl River and Red River fields, implying a mixed detrital source. Meanwhile, the Unit 3 samples have a higher illite chemical index than those from the Red River, Pearl River, and Hainan, suggesting more intensive sediment source weathering.
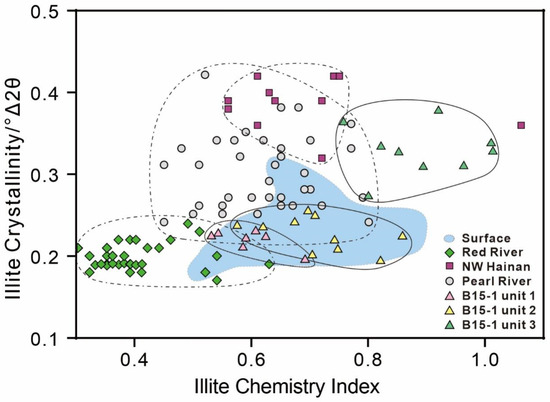
Figure 10.
Illite crystallinity vs. illite chemical index plot. Data source: Pearl River and Red River from Liu et al. (2007b) [80]; NW Hainan Island from Hu et al. (2014) [83].
Considering the current system and fine-grained sediment transport pathways, the S/I, I/(S + K+C), and (K + C)/I ratios can reflect the regional clay mineral assemblages [84]. We considered the sediment transport direction (indicated by the black arrows in Figure 11a–c) and divided the area into four sedimentary zones (I to IV) using Q-mode cluster analysis (Figure 11d): (I) the NE BBG, with a consistently high kaolinite content and illite chemical index; (II) the coastal-offshore depositional transition, with the clay minerals derived from both the adjacent coastal and offshore regions; (III), which is the largest part of the study area, where the distribution of clay minerals and geochemical composition imply little influence of the input from Guangxi on the sediments in this zone (Figure 2, Figure 4 and Figure 6); and (IV), which only includes the B08 station (central BBG), for which the surface sediments consist of the relict deposits of the Red River pro-delta [85].
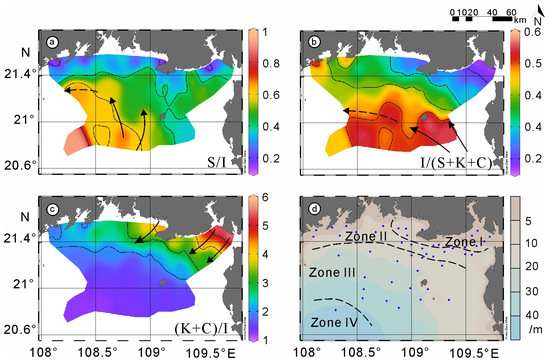
Figure 11.
Clay mineral transport pathways in the study area based on the distribution patterns, current system, and Q-mode cluster zoning. Clay mineral ratios of: (a) smectite/illite; (b) illite/(smectite + kaolinite + chlorite); (c) (kaolinite + chlorite)/illite; and (d) clay mineral provinces according to the Q-mode cluster analysis.
Therefore, we speculated that smectite in the study area was supplied by the Red River through the northern cyclonic gyre. The illite and chlorite were likely transported from the Pearl River via the Guangdong coastal current and westward flow of the Qiongzhou Strait. The kaolinite may have a mixed provenance, including Pearl River and Guangxi local inputs, with the influence of the latter limited within the northeastern tip of the BBG. For the core sediment, the clay mineral assemblages exhibit a strong sea level control, which is indicated by the variation in their relative contents and illite indices (Figure 3, Figure 9 and Figure 10).
The situation is more complicated for the bulk sediments. REEs can be used as an indicator of provenance characteristics, including weathering and erosion patterns [86,87]. A comparison between the REE patterns of our samples and the potential source is presented above (Figure 8d,f). Similar to the clay mineral assemblage, the REE patterns also show that the core sediments have multiple sources. All the data show a flat pattern but are different in detail: of note are the significantly negative Eu anomaly in the intermediate-coarse granular granites from Guangxi (0.34) and negative Ce anomaly of the sands from the Red River (0.48). The δEu values of the upper strata of Unit 1 and Unit 3 are a little lower than those of the rivers but close to the value for Guangxi granite [67,68,69,70]. Taking capacity for current transportation into consideration, it may be that a local sediment supply from Guangxi to the study area was present during the formation of Unit 2. For the upper level of Unit 1, there are similarities in δCe and δEu with the fine-grain sediments of the Pearl River and Red River, indicating the contributions of these two provenances through distal transportation under the modern circulation conditions.
5.2. Weathering of Sediments
Continental chemical weathering is controlled by temperature and moisture [58,88,89]. With stable tectonic settings, the N-NE SCS sediments can provide a record of the Pleistocene–Holocene EAM, as well as the sediment source weathering history [9,90]. Meanwhile, tectonic activity may have played a more important role in sedimentation in the southern SCS. Fresh outcrops were exposed and generated illite and chlorite through rapid physical weathering [77].
Chemical weathering would first break down calcic/sodic feldspars and release their Na and Ca, while K-feldspar (and thus the K within) would remain stable in the early weathering stage. Potassium would be leached from the source rocks under more intensive weathering [91,92]. The Al2O3-(CaO* + Na2O*)-K2O (A-CN-K) plot can be used to explore the degree of silicate weathering [93]. The surface sediments of the NE BBG are nearly parallel to the A-CN line, with few sample points under the plagioclase-orthoclase baseline (Figure 12). The core B15-1 (Unit 3) samples fall close to the Al2O3 apex, indicating that the sediments were formed under intense weathering conditions. This also suggests that the high kaolinite content was due to strong hydrolysis under intense chemical weathering, consistent with the conclusion drawn from the clay mineral compositions.
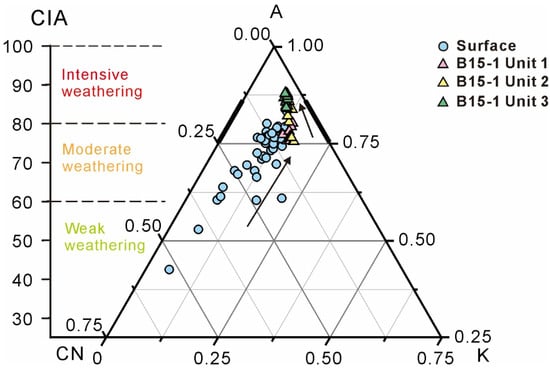
Figure 12.
Diagram of A-CN-K and CIA, showing the siliciclastic weathering trends of sediments in the study area. A-Al2O3; CN-CaO* + Na2O*; K-K2O. Legend and references are provided in the web version of this article.
The chemical weathering history of the sediment source region can be inferred from certain geochemical proxies. The core B15-1 samples have CIA = 75.5–88.0 and ICV = 0.50–1.46 (Supplementary Table S2). A higher CIA indicates that more Na, K, and Ca were leached from silicate minerals in the parent rocks under intense chemical weathering [93]. The Unit 3 sediments of B15-1 have the highest CIA value of 88 (i.e., intensive weathering), whereas the Unit 1 sediments and surface sediments have lower CIA values (i.e., moderate weathering).
However, sediment CIA is insensitive to parent rock type. Considering the bulk Fe, Mg, Ti, and Mn contents, the index of compositional variability (ICV) is a useful proxy for compositional maturity. Rock-forming minerals, such as feldspars, hornblende, and pyroxenes, have ICV > 1, whereas alteration minerals like mica and kaolinite have ICV < 1 [63]. The ICV shows an opposite tendency to the CIA (Figure 13). The fluctuation in the ICV value around 1 indicates the contribution of both rock-forming minerals and alteration minerals in the southwestern of the study area. It is noteworthy that the ICV peak corresponds to the largest grain size, as revealed by the high SiO2/Al2O3 ratio, whereas the lowest CIA value also occurs in the middle of Unit 2. The SiO2/Al2O3 ratio can be used to infer the proportion of coarse sediments (sand-sized quartz) versus fine sediments (clay minerals) [18,94,95,96]. This correspondence of the SiO2/Al2O3 ratio with the ICV in Unit 2 suggests that more unweathered terrigenous materials, instead of alteration minerals (from hydrolysis), were transported and deposited in an active local hydrodynamic environment.
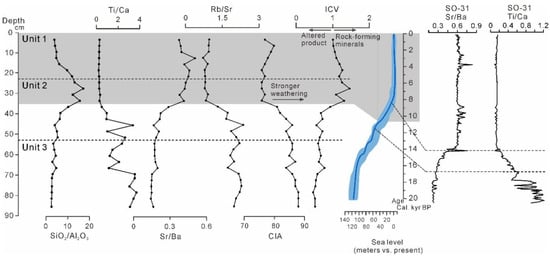
Figure 13.
Variation in elemental ratios with depth for core B15-1. Dashed lines represent lithological boundaries. Data source: SO-31 in southern BBG [97].
5.3. Sea Level Controls on Sediments in Core B15-1
Rubidium and strontium have different geochemical behaviors in hypergene processes, showing affinities with aluminosilicates and carbonates (notably in marine sediments), respectively [98,99]. Such relationships could be observed in the surface sediment geochemical compositions (Figure 4 and Figure 6). The Rb/Sr ratio is highly correlated with the weathering intensity. Weaker chemical weathering equates to a higher Rb/Sr ratio [100,101,102]. In addition to weathering conditions, Rb/Sr can also indicate the lateral clastic supply in a lacustrine environment. Kalugin et al. (2005) [103] found that the Rb/Sr ratio in a suspended load of small tributaries is lower than that in the main stream. For the Rb/Sr ratio of the core B15-1 samples (Figure 13), Unit 3 has a higher Rb/Sr (~2) than Unit 1 and the upper part of Unit 2 (<1). Both the Rb and Ba have lower mobility than Sr in pedogenesis, and the Sr/Ba is sensitive to the degree of weathering in the loess and marine sediments [92,104]. The Sr/Ba ratio mirrors the Rb/Sr ratio, i.e., it is no more than 0.2 in Unit 3 and increases to 0.5 in the middle of Unit 1, followed by a slight decrease to around 0.4.
However, the weathering conditions may not be the main factor controlling these two ratios; sea level change and the sedimentary environment also exert the major influence on the variation in these two ratios. Sr/Ba can also be used to distinguish marine from continental facies in coastal plain areas [105,106]. Sediments formed in freshwater (<0.8) have lower Sr/Ba than those formed in seawater (>1) [107]. Unit 1 was likely deposited in a marine environment, given its clay mineralogical and geochemical similarities to the offshore sediments from the southwestern study area. The higher Sr/Ba ratio in Unit 3 implies that there may be a terrestrial sedimentary environment in this case. Significant low calcium contents of sediments were widely observed in the early Holocene northern SCS, as demonstrated by the continental strata deposited in this period [43,108,109]. The high Ti/Ca ratio in Unit 3 indicates the lack of biogenic content as compared to the terrestrial input (distinct from the surface sediments), implying that Unit 3 is a nonmarine deposit.
The Sr/Ba ratio rose from approximately 0.2 to 0.4 with the enrichment of core ZK1, from the west of the Beihai peninsula, in glauconite (an authigenic mineral existing in marine sediments), formed in response to the transgression event in the mid-Holocene [110]. This correlation between Sr/Ba and glauconite supports the reliability of Sr/Ba as an indicator for distinguishing terrestrial/marine sedimentary environments in the northern BBG. The Sr/Ba variation in B15-1 provides a record of sedimentary environmental changes, with the decreasing Rb/Sr suggesting a lesser supply of clastic materials, instead of increasing weathering intensity. We can thus infer that the mid-Holocene inundation of the study area is recorded in Unit 2 for the reduction in the terrestrial material input, as supported by the sharp fall in the kaolinite content. The changing clay mineral assemblage and environmental indicators (Rb/Sr and Sr/Ba) reveal the change in the sedimentary environment from the land (with a high kaolinite content, Rb/Sr ratio, and low Sr/Ba ratio) to the sea (with a high smectite content, Sr/Ba ratio, and low Rb/Sr ratio). Notably, the post-early-Holocene strata from B15-1 are thinner (<50 cm) than those in cores 0403 and 0404 (thickness: 1.4–1.6 m) from the shallow water zone (<20 m) in the southern part of Guangxi Province, northern BBG [111].
5.4. Impact of Sea Level Change on SCS
Pronounced paleogeographic changes have occurred in the SCS, associated with the last deglacial sea level rise during the last 30 ka [112]. The estuaries of rivers surrounding the SCS have changed during this period; thus, the sedimentary patterns of the terrestrial material have been controlled by sea level fluctuation [113,114].
As the largest river in the NW SCS, the Red River catchment was the primary source region of the Yinggehai-Song Hong Basin and Qiongdongnan Basin. The Beibuwan Basin also received sediments deriving from the Red River [115]. The sea level fluctuation during the glacial–interglacial cycle would have been more than 100 m, resulting in the exposure of the continental shelf of the SCS [113].
The paleo-Red River delta was located on the central northern BBG, with a 50 m water depth, while the Red River delta prograded into the Yinggehai-Song Hong Basin in response to the Holocene inundation, and the modern pro-delta is confined, with a 30 m isobath [85,116,117]. The evolution of the Red River delta provides a record of the sedimentary responses to sea level changes in SCS. As a result of the evolution of the terrestrial supply pattern, the provenance of the NE BBG reflects the sea level changes in the SCS: The local input provided the major sediments of the NE BBG during the last deglacial period, as proved by the similarity between the clay mineral assemblage of Unit 3 of B15-1 and the rivers of Guangxi Province. Rapid sea level rises during the early Holocene led to the shift of the depocenter of the western BBG and the widespread low sedimentation rates of the eastern BBG.
6. Conclusions
- (1)
- The clay mineral assemblage in the surface sediments from the NE BBG consists of kaolinite (dominant), smectite, illite, and chlorite. The study area can be divided into four zones based on the clay mineral Q-clustering analysis, including (away from the shore) (I) kaolinite-rich and smectite–illite-poor, (II) medium kaolinite–smectite–illite contents, and (III) smectite-rich zones.
- (2)
- The clay mineral assemblage changes significantly (from kaolinite-dominant to smectite-dominant assemblages) in the middle of core B15-1 from the NE BBG, suggesting strong sea level (rather than climatic) control. Inundation caused by early Holocene sea level rise is recorded in B15-1, with variations in its geochemical ratios (including Ti/Ca, Rb/Sr, and Sr/Ba), which indicate an increase in the biogenetic composition, turning the terrestrial sedimentary environment into a marine sedimentary environment in the study area.
- (3)
- The significant variation in the clay mineral assemblage also indicates the change in the sedimentary source: from sediments contributed mainly by a local source to sediments of a mixed provenance including the Pearl River, Red River, and rivers of Guangxi Province. REE patterns also support this change of sedimentary source of NE BBG.
- (4)
- The submergence of the continental shelf of the BBG during the Holocene resulted in the three different sedimentary stages corresponding to Units 1–3 of core B15-1, as shown in the three-stage variation in the clay mineral assemblage and geochemical characteristics. Compared to the other cores in the BBG, B15-1 has a lesser thickness of modern marine sediments, indicating a lower terrestrial input since the mid-Holocene sea level stabilization.
Supplementary Materials
The following supporting information can be downloaded at: https://www.mdpi.com/article/10.3390/jmse11071463/s1. Supplementary Table S1. Clay mineral assemblages, major (%) and trace (×10−6) element compositions of samples from the NE BBG. Supplementary Table S2. Elemental ratios of core B15-1 from the NE BBG.
Author Contributions
Conceptualization, Y.G.; methodology, Y.C., D.X., Z.Z. and W.H.; formal analysis, Y.C.; investigation, Y.G.; writing—original draft preparation, Y.G. and Y.C.; writing—review and editing, Y.G., and L.X.; visualization, Y.G., Y.C. and L.X.; supervision, X.S.; project administration, Y.G.; funding acquisition, Y.G. All authors have read and agreed to the published version of the manuscript.
Funding
This work was financially supported by the Guangxi Science and Technology Base and Talent Project (AD19110082) and the Beihai Science & Technology Project (202082022).
Institutional Review Board Statement
Not applicable.
Informed Consent Statement
Not applicable.
Data Availability Statement
The data presented in this study are available on request from the corresponding authors.
Acknowledgments
We thank the Beibu Gulf Natural Resources Survey and Evaluation Project for supplying the samples. We appreciate the Second Institute of Oceanography, Ministry of Natural Resources, for helping with the mineralogical analysis.
Conflicts of Interest
The authors declare no conflict of interest.
References
- Wang, L.; Sarnthein, M.; Erlenkeuser, H.; Grimalt, J.; Grootes, P.; Heilig, S.; Ivanova, E.; Kienast, M.; Pelejero, C.; Pflaumann, U. East Asian Monsoon Climate during the Late Pleistocene: High-Resolution Sediment Records from the South China Sea. Mar. Geol. 1999, 156, 245–284. [Google Scholar] [CrossRef]
- Liu, Z.; Zhao, Y.; Colin, C.; Stattegger, K.; Wiesner, M.G.; Huh, C.A.; Zhang, Y.; Li, X.; Sompongchaiyakul, P.; You, C.F.; et al. Source-to-Sink Transport Processes of Fluvial Sediments in the South China Sea. Earth-Sci. Rev. 2016, 153, 238–273. [Google Scholar] [CrossRef]
- Kuehl, S.A.; Alexander, C.R.; Blair, N.E.; Harris, C.K.; Marsaglia, K.M.; Ogston, A.S.; Orpin, A.R.; Roering, J.J.; Bever, A.J.; Bilderback, E.L.; et al. A Source-to-Sink Perspective of the Waipaoa River Margin. Earth-Sci. Rev. 2016, 153, 301–334. [Google Scholar] [CrossRef]
- Fathy, D.; Wagreich, M.; Fathi, E.; Ahmed, M.S.; Leila, M.; Sami, M. Maastrichtian Anoxia and Its Influence on Organic Matter and Trace Metal Patterns in the Southern Tethys Realm of Egypt during Greenhouse Variability. ACS Omega 2023, 8, 19603–19612. [Google Scholar] [CrossRef]
- Jiwarungrueangkul, T.; Liu, Z. East Asian Monsoon and Sea-Level Controls on Clay Mineral Variations in the Southern South China Sea since the Last Glacial Maximum. Quat. Int. 2021, 592, 1–11. [Google Scholar] [CrossRef]
- Steinke, S.; Chiu, H.Y.; Yu, P.S.; Shen, C.C.; Erlenkeuser, H.; Löwemark, L.; Chen, M. Te On the Influence of Sea Level and Monsoon Climate on the Southern South China Sea Freshwater Budget over the Last 22,000 Years. Quat. Sci. Rev. 2006, 25, 1475–1488. [Google Scholar] [CrossRef]
- Steinke, S.; Hanebuth, T.J.J.; Vogt, C.; Stattegger, K. Sea Level Induced Variations in Clay Mineral Composition in the Southwestern South China Sea over the Past 17,000 Yr. Mar. Geol. 2008, 250, 199–210. [Google Scholar] [CrossRef]
- Zhang, C.; Yang, S.; Huang, X.; Dou, Y.; Li, F.; Xu, X.; Hao, Q.; Gao, J. Sea Level Change and Kuroshio Intrusion Dominated Taiwan Sediment Source-to-Sink Processes in the Northeastern South China Sea over the Past 244 Kyrs. Quat. Sci. Rev. 2022, 287, 107558. [Google Scholar] [CrossRef]
- Wang, P.; Li, Q. The South China Sea: Paleoceanography and Sedimentology; Springer Science & Business Media: Berlin/Heidelberg, Germany, 2009; ISBN 978-1-4020-9744-7. [Google Scholar]
- Wei, H.; Pinxian, W. The Statistics of Sediment Mass in the South China Sea: Method and Result. Adv. Earth Sci. 2006, 21, 465–473. [Google Scholar]
- Yao, Y.T.; Harff, J.; Meyer, M.; Zhan, W.H. Reconstruction of Paleocoastlines for the Northwestern South China Sea since the Last Glacial Maximum. Sci. China, Ser. D Earth Sci. 2009, 52, 1127–1136. [Google Scholar] [CrossRef]
- Zhang, K.; Liu, R.; Bai, E.; Zhao, Z.; Peyrotty, G.; Fathy, D.; Chang, Q.; Liu, Z.; Yang, K.; Xu, C.; et al. Biome Responses to a Hydroclimatic Crisis in an Early Cretaceous (Barremian–Aptian) Subtropical Inland Lake Ecosystem, Northwest China. Palaeogeogr. Palaeoclimatol. Palaeoecol. 2023, 622, 111596. [Google Scholar] [CrossRef]
- Yang, C.; Vigier, N.; Yang, S.; Revel, M.; Bi, L. Clay Li and Nd Isotopes Response to Hydroclimate Changes in the Changjiang (Yangtze) Basin over the Past 14, 000 Years. Earth Planet. Sci. Lett. 2021, 561, 116793. [Google Scholar] [CrossRef]
- Jimin, S.; Zhongli, D.; Tungsheng, L. Desert Distributions during the Glacial Maximum and Climatic Optimum: Example of China. Episodes 1998, 21, 28–30. [Google Scholar] [CrossRef]
- Hou, G.; Fang, X. Characteristics of Holocene Temperature Change in China. Prog. Geopraphy 2011, 30, 1075–1080. [Google Scholar]
- Liu, J.; Lyu, H.; Negendank, J.; Mingram, J.; Luo, X.; Wang, W.; Chu, G. Periodicity of Holocene Climate Fluctuation in Huguangyan Maar Lake. Sci. Bull. 2000, 45, 5. [Google Scholar] [CrossRef]
- Wan, S.; Toucanne, S.; Clift, P.D.; Zhao, D.; Bayon, G.; Yu, Z.; Cai, G.; Yin, X.; Révillon, S.; Wang, D.; et al. Human Impact Overwhelms Long-Term Climate Control of Weathering and Erosion in Southwest China. Geology 2015, 43, 439–442. [Google Scholar] [CrossRef]
- Liu, Z.; Colin, C.; Trentesaux, A.; Blamart, D.; Bassinot, F.; Siani, G.; Sicre, M.A. Erosional History of the Eastern Tibetan Plateau since 190 Kyr Ago: Clay Mineralogical and Geochemical Investigations from the Southwestern South China Sea. Mar. Geol. 2004, 209, 1–18. [Google Scholar] [CrossRef]
- Liu, Z.; Colin, C.; Huang, W.; Chen, Z.; Trentesaux, A.; Chen, J. Clay Minerals in Surface Sediments of the Pearl River Drainage Basin and Their Contribution to the South China Sea. Chinese Sci. Bull. 2007, 52, 1101–1111. [Google Scholar] [CrossRef]
- Wan, S.; Li, A.; Clift, P.D.; Stuut, J.B.W. Development of the East Asian Monsoon: Mineralogical and Sedimentologic Records in the Northern South China Sea since 20 Ma. Palaeogeogr. Palaeoclimatol. Palaeoecol. 2007, 254, 561–582. [Google Scholar] [CrossRef]
- Yu, Z.; Wan, S.; Colin, C.; Yan, H.; Bonneau, L.; Liu, Z.; Song, L.; Sun, H.; Xu, Z.; Jiang, X.; et al. Co-Evolution of Monsoonal Precipitation in East Asia and the Tropical Pacific ENSO System since 2.36 Ma: New Insights from High-Resolution Clay Mineral Records in the West Philippine Sea. Earth Planet. Sci. Lett. 2016, 446, 45–55. [Google Scholar] [CrossRef]
- Ye, L.; Zhang, W.; Wang, R.; Yu, X.; Jin, L. Ice Events along the East Siberian Continental Margin during the Last Two Glaciations: Evidence from Clay Minerals. Mar. Geol. 2020, 428, 106289. [Google Scholar] [CrossRef]
- Wu, M.; Li, S.; Chu, F.; Long, J.; Yang, H.; Tan, W.; Zhou, W. Paleoclimate Environmental Significance of Clay Mineral Analysis of Core B106 at Offshore Hainan Island. J. Huaihai Inst. Technol. Sci. Ed. 2011, 20, 85–91. [Google Scholar] [CrossRef]
- He, H.; Gan, H.; Shi, Y.; Liu, W. Distribution Features of Clay Minerals in Sediments of the Beibu Gulf and Their Environmental Significance. Geol. Explor. 2016, 52, 584–593. [Google Scholar] [CrossRef]
- Zhou, S.; Liu, Z.; Zhao, Y.; Stattegger, K.; Wiesner, M.G. A High-Resolution Clay Mineralogical Record and Its Paleoenvironmental Significance in the Northeastern Gulf of Tonkin over the Past 2000 Years. Quat. Sci. 2014, 34, 600–610. [Google Scholar] [CrossRef]
- Liu, J.P.; Xue, Z.; Ross, K.; Wang, H.J.; Yang, Z.S.; Li, A.C.; Gao, S. Fate of Sediments Delivered to the Sea by Asian Large Rivers: Long-Distance Transport and Formation of Remote Alongshore Clinothems. Sediment. Rec. 2009, 7, 4–9. [Google Scholar] [CrossRef]
- Liu, Y.; Gao, S.; Wang, Y.P.; Yang, Y.; Long, J.; Zhang, Y.; Wu, X. Distal Mud Deposits Associated with the Pearl River over the Northwestern Continental Shelf of the South China Sea. Mar. Geol. 2014, 347, 43–57. [Google Scholar] [CrossRef]
- Ge, Q.; Liu, J.P.; Xue, Z.; Chu, F. Dispersal of the Zhujiang River (Pearl River) Derived Sediment in the Holocene. Acta Oceanol. Sin. 2014, 33, 1–9. [Google Scholar] [CrossRef]
- Liu, J.; Chen, M.; Xiang, R.; Lu, J.; Zhang, L. Abrupt Change of Sediment Records in the Southern South China Sea during the Last Glacial Period and Its Environment Signi Fi Cance. Quat. Int. 2011, 237, 109–122. [Google Scholar] [CrossRef]
- Chamley, H. Sedimentology Clay, 1st ed.; Springer: Berlin/Heidelberg, Germany, 1989; ISBN 978-3-642-85918-2. [Google Scholar]
- Petschick, R.; Kuhn, G.; Gingele, F. Clay Mineral Distribution in Surface Sediments of the South Atlantic: Sources, Transport, and Relation to Oceanography. Mar. Geol. 1996, 130, 203–229. [Google Scholar] [CrossRef]
- Boulay, S.; Colin, C.; Trentesaux, A.; Frank, N.; Liu, Z. Sediment Sources and East Asian Monsoon Intensity over the Last 450 Ky. Mineralogical and Geochemical Investigations on South China Sea Sediments. Palaeogeogr. Palaeoclimatol. Palaeoecol. 2005, 228, 260–277. [Google Scholar] [CrossRef]
- Xu, D.; Chu, F.; Yang, H.; Chen, L.; Li, T. Modern Sedimentation Rates in the Beibu Gulf. Mar. Geol. Quat. Geol. 2012, 32, 17–26. [Google Scholar] [CrossRef]
- Chen, Z.; Xu, S.; Qiu, Y.; Lin, Z.; Jia, X. Modeling the Effects of Fishery Management and Marine Protected Areas on the Beibu Gulf Using Spatial Ecosystem Simulation. Fish. Res. 2009, 100, 222–229. [Google Scholar] [CrossRef]
- Liu, Y.; Wu, Z.; Liu, L.; Yan, S.; Hu, L.; Ping, M.; Zhang, M. Cenozoic Structure and Tectonics of North Subbasins in Beibu Gulf Basin, Northern South China Sea. Tectonophysics 2021, 812, 228912. [Google Scholar] [CrossRef]
- Manh, D.-V.; Yanagi, T. A Study on Residual Flow in the Gulf of Tongking. J. Oceanogr. 2000, 56, 59–68. [Google Scholar] [CrossRef]
- Chu, P.C.; Wang, G. Seasonal Variability of Thermohaline Front in the Central South China Sea. J. Oceanogr. 2003, 59, 65–78. [Google Scholar] [CrossRef]
- Xia, H.; Li, S.; Shi, M. Three-D Numerical Simulation of Wind-Driven Current and Density Current in the Beibu Gulf. Acta Oeanologica Sin. 2001, 20, 455–472. [Google Scholar]
- Schlitzer, R. Interactive Analysis and Visualization of Geoscience Data with Ocean Data View. Comput. Geosci. 2002, 28, 1211–1218. [Google Scholar] [CrossRef]
- Chen, B.; Xu, G.; Ya, H.; Chen, X.; Xu, Z.; Shi, M. Effect of the Runoff Diffusion on the Circulation in the Northern Beibu Gulf. Trans. Oceanol. Limnol. 2020, 43–54. [Google Scholar] [CrossRef]
- Milliman, J.D.; Farnsworth, K.L. River Discharge to the Coastal Ocean: A Global Synthesis; Cambridge University Press: Cambridge, UK, 2011; ISBN 9781107612181. [Google Scholar]
- Li, Z.; Zhang, Y.; Li, Y.; Zhao, J. Palynological Records of Holocene Monsoon Change from the Gulf of Tonkin (Beibuwan), Northwestern South China Sea. Quat. Res. 2010, 74, 8–14. [Google Scholar] [CrossRef]
- Xu, D.; Li, J.; Chu, F.; Long, J.; Ye, L.; Han, X. The Response of Sedimentary Records in Eastern BeibuGulf to the Last Postglacial Transgression and Circulation. Earth Sci. -J. China Univ. Geosci. 2013, 38, 70–82. [Google Scholar]
- Chen, B.; Shi, M. Advances in Study of Beibu Gulf Circulation. Guangxi Sci. 2019, 26, 9. [Google Scholar] [CrossRef]
- Shi, M. Study Comments on Circulation in Beibu Gulf. Guangxi Sci. 2014, 21, 313–324. [Google Scholar] [CrossRef]
- Gao, J.; Chen, B. Analysis on Characteristics and Formation Mechanismof the Winter Boreal Circulation in the Beibu Gulf. Guangxi Sci. 2014, 21, 64–72. [Google Scholar] [CrossRef]
- Gao, J.; Wu, G.; Ya, H. Review of the Circulation in the Beibu Gulf, South China Sea. Cont. Shelf Res. 2017, 138, 106–119. [Google Scholar] [CrossRef]
- Clark, P.U.; Dyke, A.S.; Shakun, J.D.; Carlson, A.E.; Clark, J.; Wohlfarth, B.; Mitrovica, J.X.; Hostetler, S.W.; McCabe, A.M. The Last Glacial Maximum. Science 2009, 325, 710–714. [Google Scholar] [CrossRef]
- Lambeck, K.; Rouby, H.; Purcell, A.; Sun, Y.Y.; Sambridge, M. Sea Level and Global Ice Volumes from the Last Glacial Maximum to the Holocene. Proc. Natl. Acad. Sci. USA 2014, 111, 15296–15303. [Google Scholar] [CrossRef]
- Chen, Y.; Deng, B.; Chen, Y.; Wang, D.; Zhang, J. Holocene Sedimentary Evolution of a Subaqueous Delta off a Typical Tropical River, Hainan Island, South China. Mar. Geol. 2021, 442, 106664. [Google Scholar] [CrossRef]
- Tanabe, S.; Hori, K.; Saito, Y.; Haruyama, S.; Van Vu, P.; Kitamura, A. Song Hong (Red River) Delta Evolution Related to Millennium-Scale Holocene Sea-Level Changes. Quat. Sci. Rev. 2003, 22, 2345–2361. [Google Scholar] [CrossRef]
- Liu, J.; Chen, M.; Chen, Z.; Yan, W. Clay Mineral Distribution in Surface Sediments of the South China Sea and Its Significance for in Sediment Sources and Transport. Chinese J. Oceanol. Limnol. 2010, 28, 407–415. [Google Scholar] [CrossRef]
- Holtzapffel, T. Les Minéraux Argileux. Préparation. Analyse Diffractométrique et Détermination. Société Géologique Du Nord. 1985, 1–36. [Google Scholar]
- Krumm, S.; Buggisch, W. Sample Preparation Effects on Illite Crystallinity Measurement: Grain-Size Gradation and Particle Orientation. J. Metamorph. Geol. 1991, 9, 671–677. [Google Scholar] [CrossRef]
- Ehrmann, W. Implications of Late Eocene to Early Miocene Clay Mineral Assemblages in McMurdo Sound (Ross Sea, Antarctica) on Paleoclimate and Ice Dynamics. Palaeogeogr. Palaeoclimatol. Palaeoecol. 1998, 139, 213–231. [Google Scholar] [CrossRef]
- Talma, A.S.; Vogel, J.C. A Simplified Approach to Calibrating 14C Dates. Radiocarbon 1993, 35, 317–322. [Google Scholar] [CrossRef]
- Heaton, T.J.; Blaauw, M.; Blackwell, P.G.; Ramsey, C.B.; Reimer, P.J.; Scott, E.M. The IntCal20 Approach to Radiocarbon Calibration Curve Construction: A New Methodology Using Bayesian Splines and Errors-in-Variables. Radiocarbon 2020. [Google Scholar] [CrossRef]
- Nesbitt, H.W.; Young, G.M. Early Proterozoic Climates and Plate Motions Inferred from Major Element Chemistry of Lutites. Nature 1982, 299, 715–717. [Google Scholar] [CrossRef]
- Fedo, C.M.; Nesbitt, H.W.; Young, G.M. Unravelling the Effects of Potassium Metasomatism in Sedimentary Rocks and Paleosols, with Implications for Paleoweathering Conditions and Provenance. Geology 1995, 23, 921–924. [Google Scholar] [CrossRef]
- McLennan, S.M. Weathering and Global Denudation. J. Geol. 1993, 101, 295–303. [Google Scholar] [CrossRef]
- Johnson, K.S.; Pytkowicz, R.M. Ion Association of Chloride and Sulphate with Sodium, Potassium, Magnesium and Calcium in Seawater at 25°C. Mar. Chem. 1979, 8, 87–93. [Google Scholar] [CrossRef]
- McLennan, S.M.; Taylor, S.R.; McCulloch, M.T.; Maynard, J.B. Geochemical and NdSr Isotopic Composition of Deep-Sea Turbidites: Crustal Evolution and Plate Tectonic Associations. Geochim. Cosmochim. Acta 1990, 54, 2015–2050. [Google Scholar] [CrossRef]
- Cox, R.; Lowe, D.R.; Cullers, R.L. The Influence of Sediment Recycling and Basement Composition on Evolution of Mudrock Chemistry in the Southwestern United States. Geochim. Cosmochim. Acta 1995, 59, 2919–2940. [Google Scholar] [CrossRef]
- Taylor, S.R.; Mclennan, S.M. The Continental Crust: Its Composition and Evolution; U.S. Department of Energy Office of Scientific and Technical Information: Oak Ridge, TN, USA, 1985; Volume 312.
- Boynton, W.V. Chapter 3 - Cosmochemistry of the Rare Earth Elements: Meteorite Studies. In Rare Earth Element Geochemistry; Developments in Geochemistry; Henderson, P., Ed.; Elsevier: Amsterdam, The Netherlands, 1984; Volume 2, pp. 63–114. [Google Scholar]
- Taylor, S.R.; Mclennan, S.M. The Geochemical the Continental Evolution Crust. Rev. Mineral. Geochem. 1995, 33, 241–265. [Google Scholar] [CrossRef]
- Zhao, Z.; Wang, D.; Pan, H.; Qu, W. REE Geochemistry of a Weathering Profile in Guangxi, Southern China, and Genesis of Ion-Adsorption Type REE Deposit. Earth Sci. 2017, 42, 1697–1706. [Google Scholar] [CrossRef]
- Clift, P.D.; Van Long, H.; Hinton, R.; Ellam, R.M.; Hannigan, R.; Tan, M.T.; Blusztajn, J.; Duc, N.A. Evolving East Asian River Systems Reconstructed by Trace Element and Pb and Nd Isotope Variations in Modern and Ancient Red River-Song Hong Sediments. Geochem. Geophys. Geosystems 2008, 9. [Google Scholar] [CrossRef]
- Tong, S. Element Geochemistry for Surface Sediments of Pearl, Red and Mekong Rivers. Master’s Thesis, Tongji University, Shanghai, China, 2007. [Google Scholar]
- Xu, Z.; Han, G. Rare Earth Elements (REE) of Dissolved and Suspended Loads in the Xijiang River, South China. Appl. Geochem. 2009, 24, 1803–1816. [Google Scholar] [CrossRef]
- He, L. Clay Minerals in the China Sea and Adjacent Seas. Sci. China Serise B 1989, 122–130. [Google Scholar]
- Li, J.; Gao, J.; Wang, Y.; Li, Y.; Bai, F.; Cees, L. Distribution and Dispersal Pattern of Clay Minerals in Surface Sediments, Eastern Beibu Gulf, South China Sea. Acta Oceanol. Sin. 2012, 31, 78–87. [Google Scholar] [CrossRef]
- Liu, Z.; Colin, C.; Li, X.; Zhao, Y.; Tuo, S.; Chen, Z.; Siringan, F.P.; Liu, J.T.; Huang, C.Y.; You, C.F.; et al. Clay Mineral Distribution in Surface Sediments of the Northeastern South China Sea and Surrounding Fluvial Drainage Basins: Source and Transport. Mar. Geol. 2010, 277, 48–60. [Google Scholar] [CrossRef]
- Jin, H.; Wan, S.; Zhang, J.; Song, Z.; Zhao, D.; Huang, J.; Yu, Z.; Li, A. Distribution and Provenance of Clay Minerals in Surfacesediments of the Beibu Gulf, the South China Sea. Mar. Sci. 2019, 43, 75–84. [Google Scholar]
- Wang, Y.; Zhou, H.; Zeng, W.; Liao, J.; Yang, Z. Mineralogical Characterization of Qingshuijiang Kaolin Deposit in Hepu, Guangxi. Geoloqical Sci. Technoloqy Inf. 2008, 27, 42–46. [Google Scholar] [CrossRef]
- Wan, H.; Fu, W.; Luo, P.; Wang, X.; Qin, D.; Li, C.; Gao, S. Classification and Mineralization of Intermediate -Acid Magmatic Rocks-Related Weathering Deposits in Guangxi. Geol. Explor. 2020, 56, 2–16. [Google Scholar] [CrossRef]
- Liu, Z.; Wang, H.; Hantoro, W.S.; Sathiamurthy, E.; Colin, C.; Zhao, Y.; Li, J. Climatic and Tectonic Controls on Chemical Weathering in Tropical Southeast Asia (Malay Peninsula, Borneo, and Sumatra). Chem. Geol. 2012, 291, 1–12. [Google Scholar] [CrossRef]
- Hu, J.; Kawamura, H.; Hong, H.; Qi, Y. A Review on the Currents in the SCS Seasonal Circulation, SCS Warm Current & Kuroshio Intrusion. J. Oceanogr. 2000, 56, 607–624. [Google Scholar] [CrossRef]
- Ding, Y.; Chen, C.; Beardsley, R.C.; Bao, X.; Shi, M.; Zhang, Y.; Lai, Z.; Li, R.; Lin, H.; Viet, N.T. Observational and Model Studies of the Circulation in the Gulf of Tonkin, South China Sea. J. Geophys. Res. Ocean. 2013, 118, 6495–6510. [Google Scholar] [CrossRef]
- Liu, Z.; Colin, C.; Huang, W.; Phon Le, K.; Tong, S.; Chen, Z.; Trentesaux, A. Climatic and Tectonic Controls on Weathering in South China and Indochina Peninsula: Clay Mineralogical and Geochemical Investigations from the Pearl, Red, and Mekong Drainage Basins. Geochem. Geophys. Geosyst. 2007, 8, 1–18. [Google Scholar] [CrossRef]
- Liu, Z.; Tuo, S.; Colin, C.; Liu, J.T.; Huang, C.Y.; Selvaraj, K.; Chen, C.T.A.; Zhao, Y.; Siringan, F.P.; Boulay, S.; et al. Detrital Fine-Grained Sediment Contribution from Taiwan to the Northern South China Sea and Its Relation to Regional Ocean Circulation. Mar. Geol. 2008, 255, 149–155. [Google Scholar] [CrossRef]
- Jiwarungrueangkul, T.; Liu, Z.; Stattegger, K.; Sang, P.N. Reconstructing Chemical Weathering Intensity in the Mekong River Basin Since the Last Glacial Maximum. Paleoceanogr. Paleoclimatol. 2019, 34, 1710–1725. [Google Scholar] [CrossRef]
- Hu, B.; Li, J.; Cui, R.; Wei, H.; Zhao, J.; Li, G.; Fang, X.; Ding, X.; Zou, L.; Bai, F. Clay Mineralogy of the Riverine Sediments of Hainan Island, South China Sea: Implications for Weathering and Provenance. J. Asian Earth Sci. 2014, 96, 84–92. [Google Scholar] [CrossRef]
- Shi, X.; Liu, S.; Fang, X.; Qiao, S.; Khokiattiwong, S.; Kornkanitnan, N. Distribution of Clay Minerals in Surface Sediments of the Western Gulf of Thailand: Sources and Transport Patterns. J. Asian Earth Sci. 2015, 105, 390–398. [Google Scholar] [CrossRef]
- Chen, L.; Zhang, X. Characteristics of Mineral Assemblage and Distribution in Sediments from Beibu Gulf. Acta Oceanol. Sin. 1986, 8, 340–346. [Google Scholar]
- Yang, S.; Wei, G.; Shi, X. Geochemical Approaches of Tracing Source-to-Sink Sediment Processesand Environmental Changes at the East Asian Continental Margin. Bull. Mineral. Geochem. 2015, 34, 902–910. [Google Scholar] [CrossRef]
- Wang, C.; Zeng, L.; Lei, Y.; He, J.; Cui, H.; Su, M. Geochemical Record of the Sediments in the Continental Shelf of the Northwestern South China Sea: Implications for the Provenance and Sedimentary Evolution. Mar. Geol. 2021, 440, 106582. [Google Scholar] [CrossRef]
- Johnsson, M.J. The System Controlling the Composition of Clastic Sediments. Spec. Pap. Geol. Soc. Am. 1993, 284, 1–19. [Google Scholar] [CrossRef]
- Fathy, D.; Abart, R.; Wagreich, M.; Gier, S.; Ahmed, M.S.; Sami, M. Late Campanian Climatic-Continental Weathering Assessment and Its Influence on Source Rocks Deposition in Southern Tethys, Egypt. Minerals 2023, 13, 160. [Google Scholar] [CrossRef]
- Clift, P.D.; Plumb, R.A. The Asian Monsoon: Causes, History and Effects; Cambridge University Press: Cambridge, UK, 2008; ISBN 9781107630192. [Google Scholar]
- Nesbitt, H.W.; Young, G.M.; McLennan, S.M.; Keays, R.R. Effects of Chemical Weathering and Sorting on the Petrogenesis of Siliciclastic Sediments, with Implications for Provenance Studies. J. Geol. 1996, 104, 525–542. [Google Scholar] [CrossRef]
- Yang, S.; Jung, H.S.; Li, C. Two Unique Weathering Regimes in the Changjiang and Huanghe Drainage Basins: Geochemical Evidence from River Sediments. Sediment. Geol. 2004, 164, 19–34. [Google Scholar] [CrossRef]
- Nesbitt, H.W.; Young, G.M. Prediction of Some Weathering Trends of Plutonic and Volcanic Rocks Based on Thermodynamic and Kinetic Considerations. Geochim. Cosmochim. Acta 1984, 48, 1523–1534. [Google Scholar] [CrossRef]
- Biscaye, P.E. Mineralogy and Sedimentation of Recent Deep-Sea Clay in the Atlantic Ocean and Adjacent Seas and Oceans. Bull. Geol. Soc. Am. 1965, 76, 803–832. [Google Scholar] [CrossRef]
- Jiwarungrueangkul, T.; Liu, Z.; Zhao, Y. Terrigenous Sediment Input Responding to Sea Level Change and East Asian Monsoon Evolution since the Last Deglaciation in the Southern South China Sea. Glob. Planet. Change 2019, 174, 127–137. [Google Scholar] [CrossRef]
- Sang, P.N.; Liu, Z.; Stattegger, K. Weathering and Erosion in Central Vietnam over the Holocene and Younger Dryas: Clay Mineralogy and Elemental Geochemistry from the Vietnam Shelf, Western South China Sea. J. Asian Earth Sci. 2019, 179, 1–10. [Google Scholar] [CrossRef]
- Ni, Y.; Harff, J.; Xia, Z.; Waniek, J.J.; Endler, M. Post-Glacial Mud Depocentre in the Southern Beibu Gulf: Acoustic Features and Sedimentary Environment Evolution. Geol. Soc. Lond. Spec. Publ. 2016, 429, 87–98. [Google Scholar] [CrossRef]
- Goldberg, E.D.; Arrhenius, G.O.S. Chemistry of Pacific Pelagic Sediments. Geochim. Cosmochim. Acta 1958, 13. [Google Scholar] [CrossRef]
- Dasch, E.J. Strontium Isotopes in Weathering Profiles, Deep-Sea Sediments, and Sedimentary Rocks. Geochim. Cosmochim. Acta 1969, 33, 1521–1552. [Google Scholar] [CrossRef]
- Chen, L.; Shen, H.; Jia, Y.; Wu, J.; Li, X.; Wei, L.; Wang, P. Environmental Change Inferred from Rb and Sr of Lacustrine Sediments in Huangqihai Lake, Inner Mongolia. J. Geogr. Sci. 2008, 18, 373–384. [Google Scholar] [CrossRef]
- Jin, Z.; An, Z.; Yu, J.; Li, F.; Zhang, F. Lake Qinghai Sediment Geochemistry Linked to Hydroclimate Variability since the Last Glacial. Quat. Sci. Rev. 2015, 122, 63–73. [Google Scholar] [CrossRef]
- Gao, F.; Jia, J.; Xia, D.; Lu, C.; Lu, H.; Wang, Y.; Liu, H.; Ma, Y.; Li, K. Asynchronous Holocene Climate Optimum across Mid-Latitude Asia. Palaeogeogr. Palaeoclimatol. Palaeoecol. 2019, 518, 206–214. [Google Scholar] [CrossRef]
- Kalugin, I.; Selegei, V.; Goldberg, E.; Seret, G. Rhythmic Fine-Grained Sediment Deposition in Lake Teletskoye, Altai, Siberia, in Relation to Regional Climate Change. Quat. Int. 2005, 136, 5–13. [Google Scholar] [CrossRef]
- Ding, Z.L.; Sun, J.M.; Yang, S.L.; Liu, T.S. Geochemistry of the Pliocene Red Clay Formation in the Chinese Loess Plateau and Implication for Its Origin, Source Provenance and Paleochlimate Change. Geochim. Cosmochim. Acta 2001, 65, 901–913. [Google Scholar] [CrossRef]
- Wei, W.; Algeo, T.J. Elemental Proxies for Paleosalinity Analysis of Ancient Shales and Mudrocks. Geochim. Cosmochim. Acta 2020, 287, 341–366. [Google Scholar] [CrossRef]
- Shu, Q.; Zhao, Y.; Hu, Z.; Yang, P.; Liu, Y.; Chen, Y.; Zhao, Z.; Zhang, M. Multi-Proxy Reconstruction of the Holocene Transition from a Transgressive to Regressive Coastal Evolution in the Northern Jiangsu Plain, East China. Palaeogeogr. Palaeoclimatol. Palaeoecol. 2021, 572, 110405. [Google Scholar] [CrossRef]
- Wei, W.; Algeo, T.J.; Lu, Y.; Lu, Y.C.; Liu, H.; Zhang, S.; Peng, L.; Zhang, J.; Chen, L. Identifying Marine Incursions into the Paleogene Bohai Bay Basin Lake System in Northeastern China. Int. J. Coal Geol. 2018, 200, 1–17. [Google Scholar] [CrossRef]
- Ge, Q.; Chu, F.; Xue, Z.; Liu, J.P.; Du, Y.; Fang, Y. Paleoenvironmental Records from the Northern South China Sea since the Last Glacial Maximum. Acta Oceanol. Sin. 2010, 29, 46–62. [Google Scholar] [CrossRef]
- Wang, R.; Xu, D.; Ge, Q. Modern Modes of Sediment Distribution and the Anthropogenic Heavy Metal Pollution Record in Northeastern Beibu Gulf, South China Sea. Mar. Pollut. Bull. 2020, 150, 110694. [Google Scholar] [CrossRef] [PubMed]
- Huang, X.; Liang, K.; Zhang, L.; Zhang, S.; Pan, Y.; Huo, Z.; Liu, X. The Significant Transgression during Middle Holoceneand the Climatic Characteristics in Western Coast of Guangxi. Guangxi Sci. 2017, 24, 316–322. [Google Scholar] [CrossRef]
- Li, G.; Bian, Y.; Wang, P. Holocene Marine Transgression and Its Micropaleontological Characteristics in the North-Eastern Waters of Beibu Gulf. Trop. Oceanol. 1988, 2, 63–70. [Google Scholar]
- Pelejero, C.; Kienast, M.; Wang, L.; Grimalt, J.O. The Flooding of Sundaland during the Last Deglaciation: Imprints in Hemipelagic Sediments from the Southern South China Sea. Earth Planet. Sci. Lett. 1999, 171, 661–671. [Google Scholar] [CrossRef]
- Voris, H.K. Maps of Pleistocene Sea Levels in Southeast Asia: Shorelines, River Systems and Time Durations. J. Biogeogr. 2000, 27, 1153–1167. [Google Scholar] [CrossRef]
- Hiscott, R.N. Depositional Sequences Controlled by High Rates of Sediment Supply, Sea-Level Variations, and Growth Faulting: The Quaternary Baram Delta of Northwestern Borneo. Mar. Geol. 2001, 175, 67–102. [Google Scholar] [CrossRef]
- Ge, Q.; Xue, G.Z.; Ye, L.; Xu, D.; Zhao, J.; Chu, F. The Spatial Distribution of Major and Trace Elements of Surface Sediments in the Northeastern Beibu Gulf of the South China Sea. Acta Oceanol. Sin. 2019, 38, 93–102. [Google Scholar] [CrossRef]
- Funabiki, A.; Haruyama, S.; Van Quy, N.; Van Hai, P.; Thai, D.H. Holocene Delta Plain Development in the Song Hong (Red River) Delta, Vietnam. J. Asian Earth Sci. 2007, 30, 518–529. [Google Scholar] [CrossRef]
- van den Bergh, G.D.; Boer, W.; Schaapveld, M.A.S.; Duc, D.M.; van Weering, T.C.E. Recent Sedimentation and Sediment Accumulation Rates of the Ba Lat Prodelta (Red River, Vietnam). J. Asian Earth Sci. 2007, 29, 545–557. [Google Scholar] [CrossRef]


Disclaimer/Publisher’s Note: The statements, opinions and data contained in all publications are solely those of the individual author(s) and contributor(s) and not of MDPI and/or the editor(s). MDPI and/or the editor(s) disclaim responsibility for any injury to people or property resulting from any ideas, methods, instructions or products referred to in the content. |
© 2023 by the authors. Licensee MDPI, Basel, Switzerland. This article is an open access article distributed under the terms and conditions of the Creative Commons Attribution (CC BY) license (https://creativecommons.org/licenses/by/4.0/).