Article

Influence of Excavation Pits on the Wave Hydrodynamics of Fringing Reefs under Regular Waves

1
School of Hydraulic and Environmental Engineering, Changsha University of Science & Technology, Changsha 410114, China
2
Key Laboratory of Water-Sediment Sciences and Water Disaster Prevention of Hunan Province, Changsha 410114, China
3
Key Laboratory of Dongting Lake Aquatic Eco-Environmental Control and Restoration of Hunan Province, Changsha 410114, China
*
Author to whom correspondence should be addressed.
J. Mar. Sci. Eng. 2023, 11(7), 1464; https://doi.org/10.3390/jmse11071464
Submission received: 14 June 2023 / Revised: 16 July 2023 / Accepted: 21 July 2023 / Published: 23 July 2023
(This article belongs to the Section Ocean Engineering)

Abstract

:
Dredging materials from reef flats have become an important source of sand and aggregates for meeting the infrastructure needs of coral-lined shores in subtropical and tropical regions, especially for low-lying atoll islands. Dredging at the reef flats can generate artificial excavation pits, which not only have profound influences on coral ecological stability but also deeply affect the hydrodynamic characteristics of coral reefs. To deepen the understanding of the influence of excavation on the wave hydrodynamics of fringing reefs, the wave propagation, wave transformation, wave setup, and wave runup processes of regular waves on fringing reefs with artificial pits have been systematically analyzed using a non-hydrostatic numerical wave solver (NHWAVE). The effects of some significant factors have been carefully investigated. According to the study findings, the existence of artificial pits can result in a slight decrease in the wave height around the artificial pit. The time-mean maximum of wave runup height at the backreef slope can be reduced to some extent when the artificial pit is present. When placed close to the reef edge, the artificial pit can have noticeable effects on the hydrodynamic characteristics of fringing reefs, particularly the wave setup along the reef flat. It is hoped that the study findings can provide further reference for evaluation of the influences of artificial pits on the wave hydrodynamics of fringing reefs.

1. Introduction

Due to the unique topography of coral reefs, they can successfully protect low-lying atoll islands in subtropical and tropical regions from the enormous surges and waves produced in severe weather [1]. Wave breaking usually occurs around the reef edge or reef crest, which can dissipate the majority of incident wave energy [2,3,4]. In recent years, human engineering practices on the reef islands, such as building seawalls [5,6,7] and dredging materials from reef flats [8], have significantly reshaped the wave hydrodynamic environment of reefs. The extent to which these human engineering activities affect the wave hydrodynamics of reef islands is not yet clear. To meet the needs of infrastructure construction, dredging materials at the reef flats have gradually become an important source of building materials in many atoll island nations [8,9], such as the Marshall Islands. Dredging materials at the reef flats generate many artificial excavation pits, which may have profound influences on the wave hydrodynamics of coral reefs. Hence, it becomes necessarily important to study the effects of topographic changes on the wave hydrodynamics of reef islands.
Most of the existing studies primarily focus on analyzing the wave hydrodynamics of fringing reefs under regular waves [6,10], irregular waves [11,12,13], extreme waves [14,15], and tsunami-like waves [16]. Based on the field data, scholars systematically analyzed the wave breaking [17], wave setup, wave-induced current [18,19], and infragravity wave properties [20,21] of fringing reefs. For instance, Lowe et al. [22] investigated the wave-driven circulations in Kaneohe Bay, Hawaii, using field data recorded during an observation period of 10 months. They found that the gradient of water elevation works as the main driving force for the current circulations on the reef flat, and the main influencing factors are the reef morphology and the reef-bed roughness. Kench et al. [23] studied the spatial variations in wave energy around reef islands using the data collected from field observations. Recently, Duce et al. [24] investigated wave hydrodynamics on spurs and grooves (SAG) topography through field observations, reporting that a SAG topography can exhibit highly efficient wave energy dissipation. Moreover, some theoretical models have been proposed based on observation data. Longuet-Higgins et al. [25] proposed a radiation stress theory to predict the wave setup due to the wave breaking around the reef edge or reef crest. Later, using field-observed data [26], Tait et al. [27] utilized the hypothesized radiation stress theory to determine the link between wave setup and water depth at the reef flat. In order to derive analytical solutions for the wave-induced setup and wave-driven currents, Symonds et al. [28] used the radiation stress theory and a linearized one-dimensional shallow-water equation model. Gourlay et al. [29] conducted theoretical analyses to discuss the influences of different coral reef morphologies and roughness on the wave hydrodynamics of fringing reefs. In addition, Astorga-Moar and Baldock [30] optimized the empirical formulas for wave runup on beaches fronted by fringing reefs. Since the 1980s, extensive physical laboratories have been established based on many different idealized reef models. Using a smooth reef model, Seelig [31] analyzed the spatial distributions of time-mean water level along a reef flat and a lagoon. In most of the physical experiments that followed, Betsy et al. [32] used higher-order spectral methods to study the wave breaking properties. Yao et al. [33,34,35] discussed the spatial distributions of wave setup under different coral reef topographies, revealing the physical mechanisms of wave-induced currents in nearshore areas. They also investigated wave runup on the back-reef slopes for like-tsunami waves [36]. Hwung et al. [37] conducted a large-scale tank experiment to study infragravity wave hydrodynamics. Furthermore, the effects of the presence of reef crests [38], large bottom roughness [36,39] and onshore wind [40] on the hydrodynamic characteristics of fringing reefs have also been experimentally investigated. Meanwhile, different types of numerical wave models have also been applied to investigate the hydrodynamic characteristics of fringing reefs under complex wave–current interactions. Torres-Freyermuth et al. [41] and Rijnsdorp et al. [42] applied a shallow-water wave model to investigate the wave-driven setup phenomenon on fringing reef lagoons. Wang et al. [43] investigated the propagation and deformation processes of waves at complex coastlines using a potential flow model. By utilizing a non-hydrostatic wave model [44,45], a two-phase wave model [46], and a smoothed particle hydrodynamics model (SPH) [47], the researchers extensively discussed the influences of the main factors, i.e., wave height, wave period, water depth, and reef configurations, etc., on the hydrodynamics of fringing reefs [45,46,47]. Recently, the influences of onshore wind [48] and the permeability of reef flats [49] on the wave hydrodynamics of fringing reefs were also numerically investigated.
However, there are few studies focusing on the influences of manmade engineering practices on the wave hydrodynamic properties of fringing reefs, despite the fact that the present scientific effort has significantly advanced our understanding of the wave hydrodynamics of coral reefs [50]. According to the field observations of Ford et al. [8] at Majuro Atoll in the Marshall Islands, the presence of an artificial pit can noticeably alter the distribution of infragravity wave energy, resulting in a decrease in wave height at the shoreline next to the pit. This research finding was also reported in the experimental study of Yao et al. [51]. Yao et al. [52] mainly analyzed the influences of irregular wave parameters and geometric dimensions and positions of the pit model on infragravity wave properties at reef flats. Klaver et al. [53] carried out research along similar lines and used the non-hydrostatic wave model XBeach. The impacts of artificial pits on the wave transformation and wave-breaking processes of tsunami-like waves on fringing reefs were recently numerically studied by Qu et al. [46]. According to their findings, the existence of a pit can both effectively lower the wave runup height at the backreef slope and also somewhat enhance the wave height around the pit. In order to improve the previous research work, this study employs the non-hydrostatic numerical wave solver (NHWAVE) to comprehensively examine the influences of artificial pits on the wave hydrodynamics of fringing reefs under regular waves. The effects of some major factors, i.e., wave height, wave period, water depth, forereef and backreef slopes, geometric dimensions of the pit, and reef-flat length, have been extensively investigated.
The rest of this paper is structured as follows: Section 2 introduces the numerical wave solver. Model validations are demonstrated in Section 3. Section 4 presents the research results. Section 5 summarizes the research findings.

2. Numerical Wave Solver

This study applies NHWAVE [44] to simulate the complex flow field of a wave–reef system. The governing equations are described in a σ -coordinate grid system, as
D t + D u x + D v y + ω σ = 0
U t + E x + F y + G σ = S h + S p + S τ
where U = D u , D v , D w , and the convective fluxes are read as
E = D u u + 1 2 g ζ 2 + g h ζ D u v D u w ,   F = D u v D v v + 1 2 g ζ 2 + g h η D v w ,   G = u ω v ω w ω
and the three terms on the right can be read as
S h = g D h x g D h y 0 ,   S p = D ρ p x + p σ σ x D ρ p y + p σ σ y 1 ρ p σ ,   S τ = D S τ x D S τ y D S τ z
In these equations, t is time. ρ is density. u , v , and w are velocities in the x , y , and z directions. ω is the velocity in σ -coordinate, and σ = ( z + h ) / D . u represents the magnitude of total velocity, and u = u 2 + v 2 + w 2 . h is water depth. ζ is water elevation. The net water depth is D and D = h + ζ . p is the dynamic pressure. D S τ x , D S τ y , and D S τ z are defined as turbulent diffusion terms. The bottom friction forces can be calculated as S c = D F c , and F c = 1 2 C f u u . C f is the coefficient of friction forces.
The classical two-equation k ε turbulence model is used to calculate the turbulence viscosity, and the governing equations are read as
D k t + · D u k = · D ν + v t σ k k + D P s ε
D ε t + · D u ε = · D ν + v t σ ε ε + ε k D C 1 ε P s C 2 ε ε
The turbulent viscosity is calculated as v t = C μ k 2 ε . σ k , σ ε , C μ ,   C 1 ε , and C 2 ε are empirical coefficients. According to Rodi [54], σ k = 1.0, σ ε = 1.3, C 1 ε = 1.44, C 2 ε = 1.92 and C μ = 0.09. P s represents the production of shear stress.
If readers are interested in the details of numerical methods of NWHAVE, please refer to Ma et al. [44,55].
In this study, wave energy fluxes [56] are determined to reveal the spatial variation in wave energy, which is calculated as
E f = h ζ p · u d z

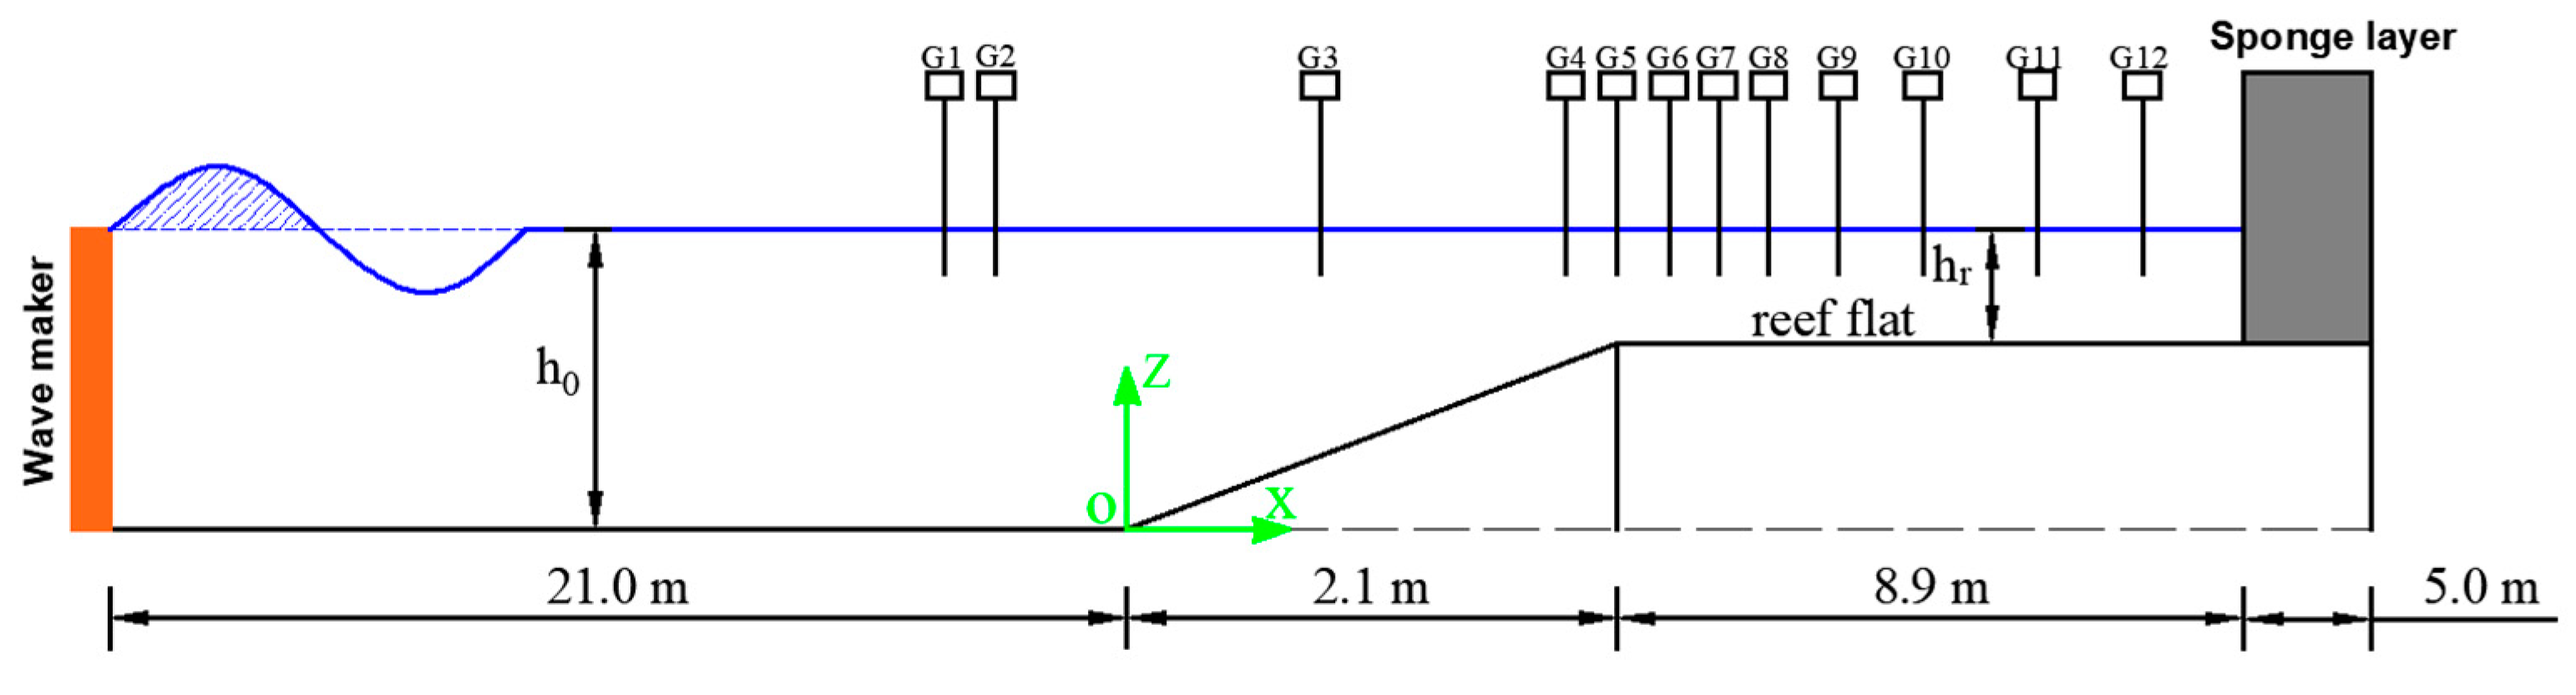
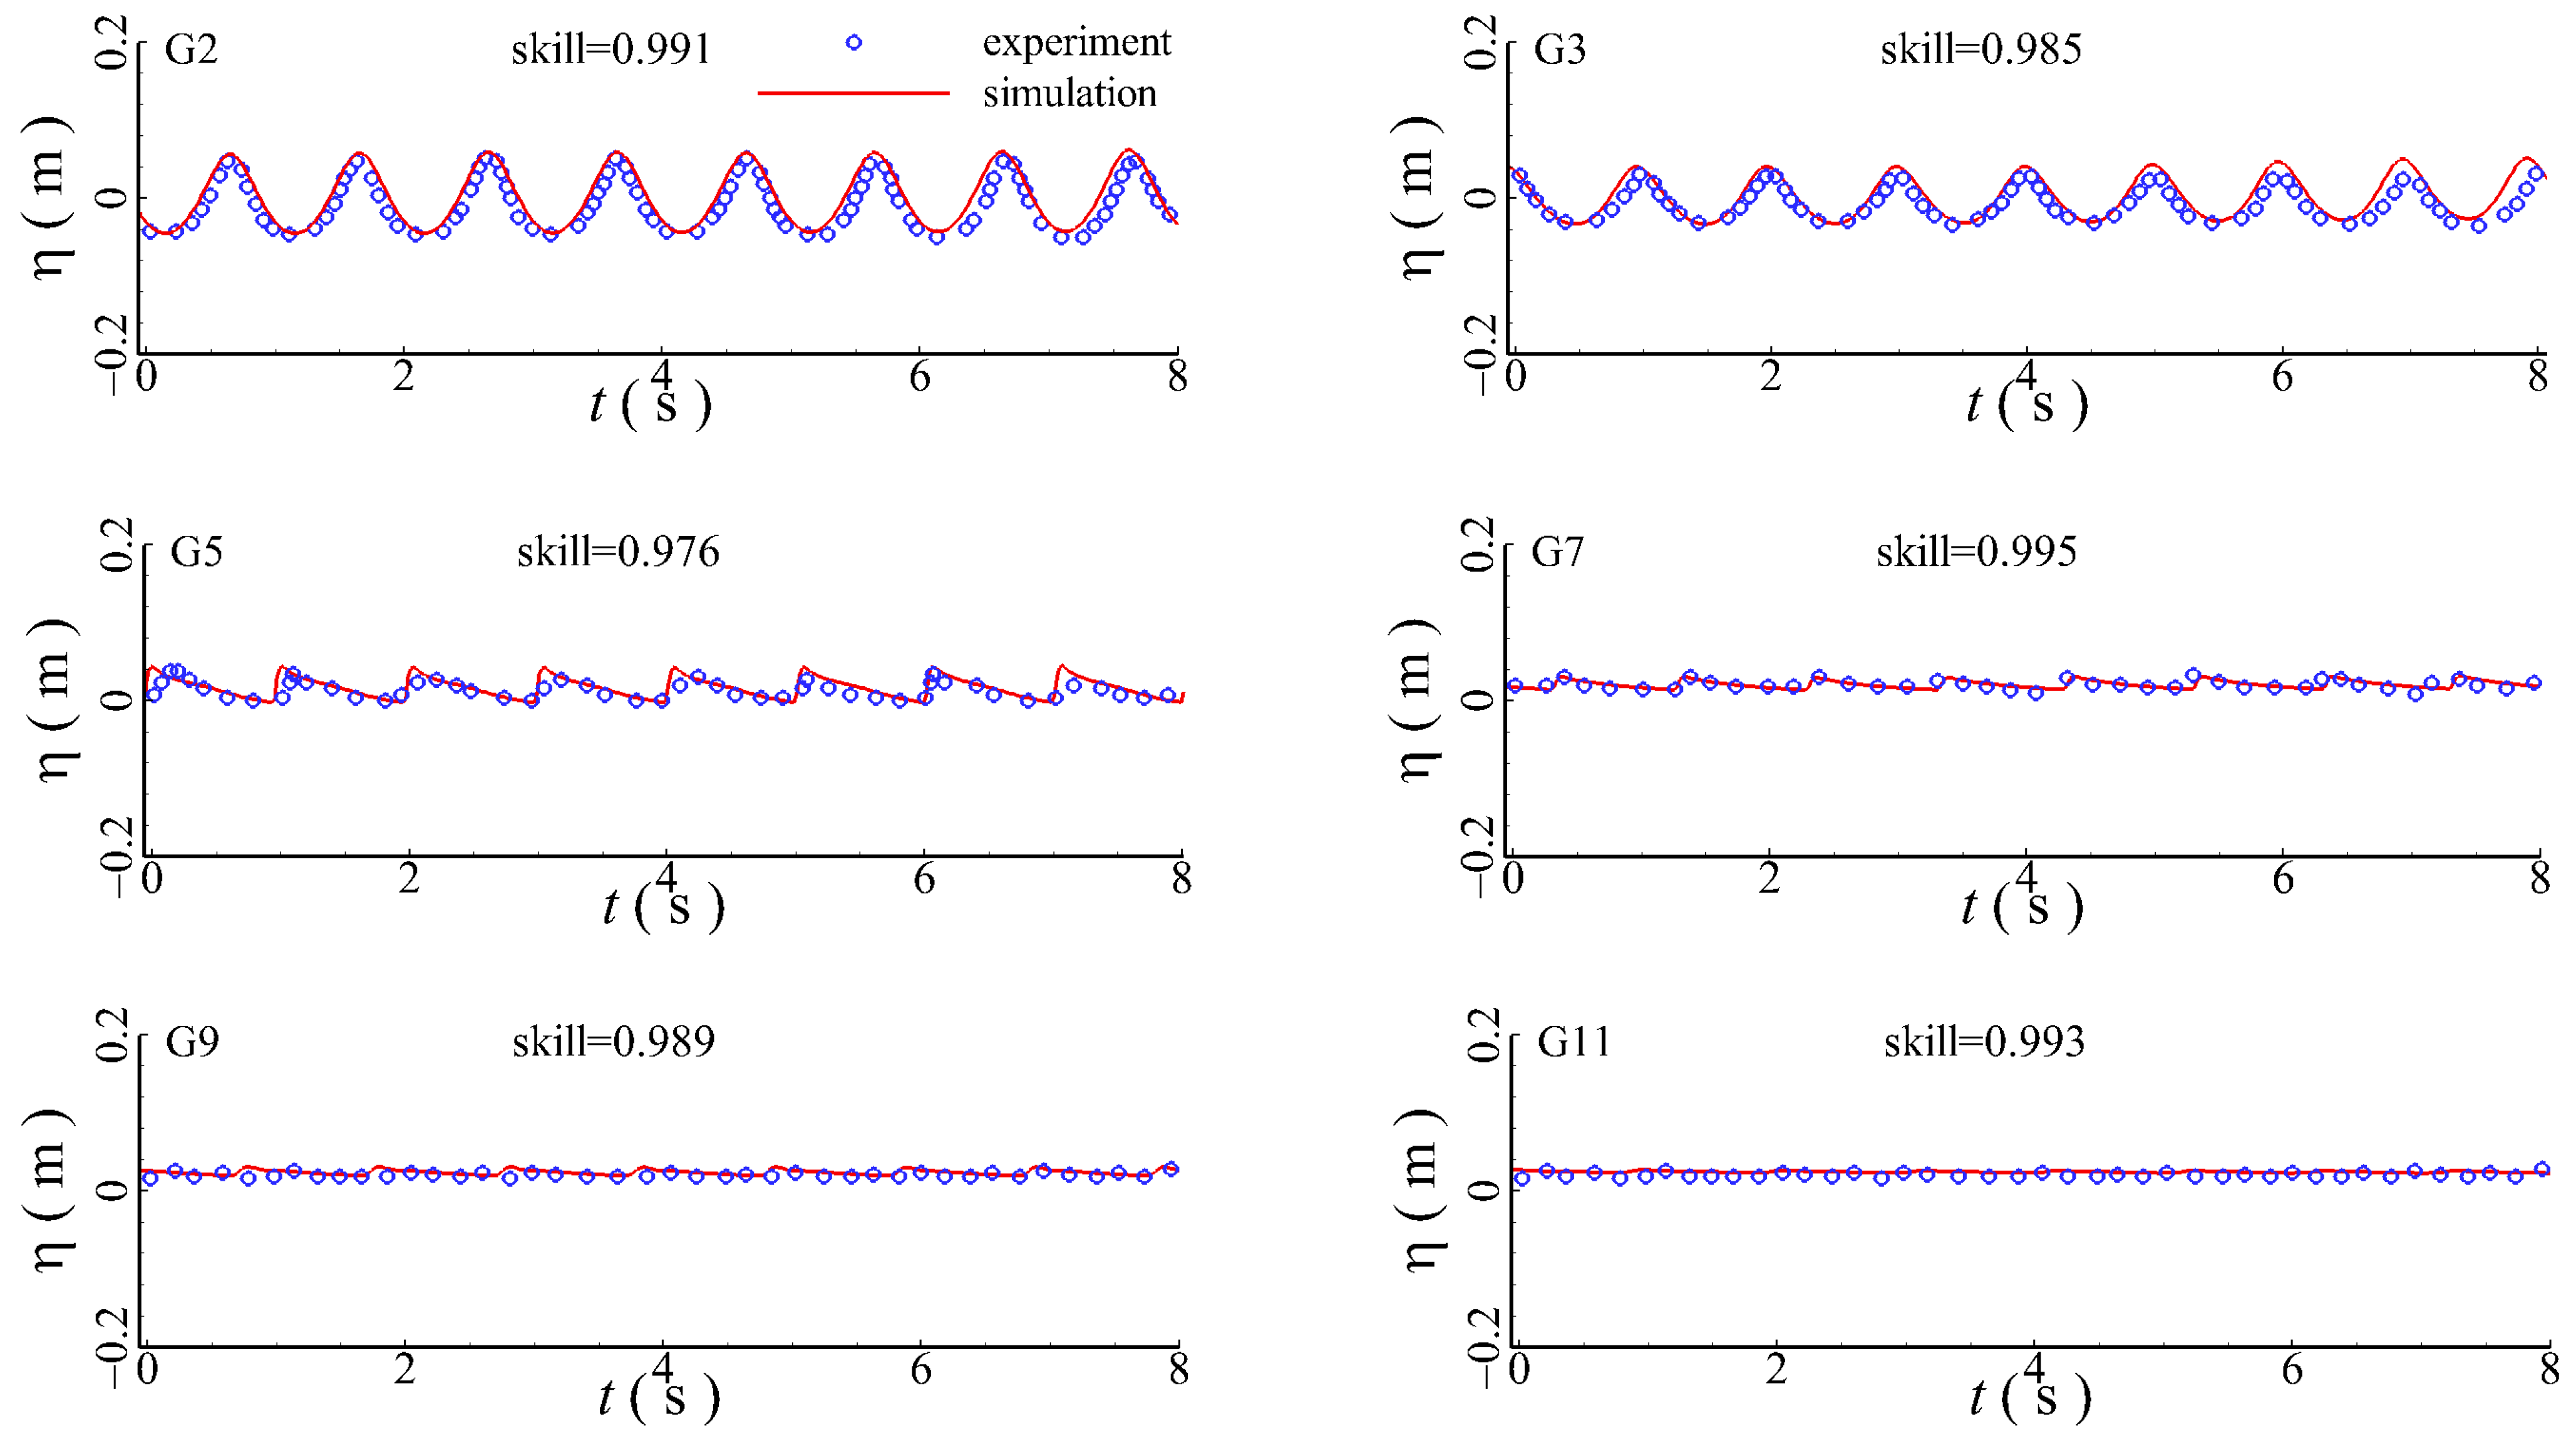
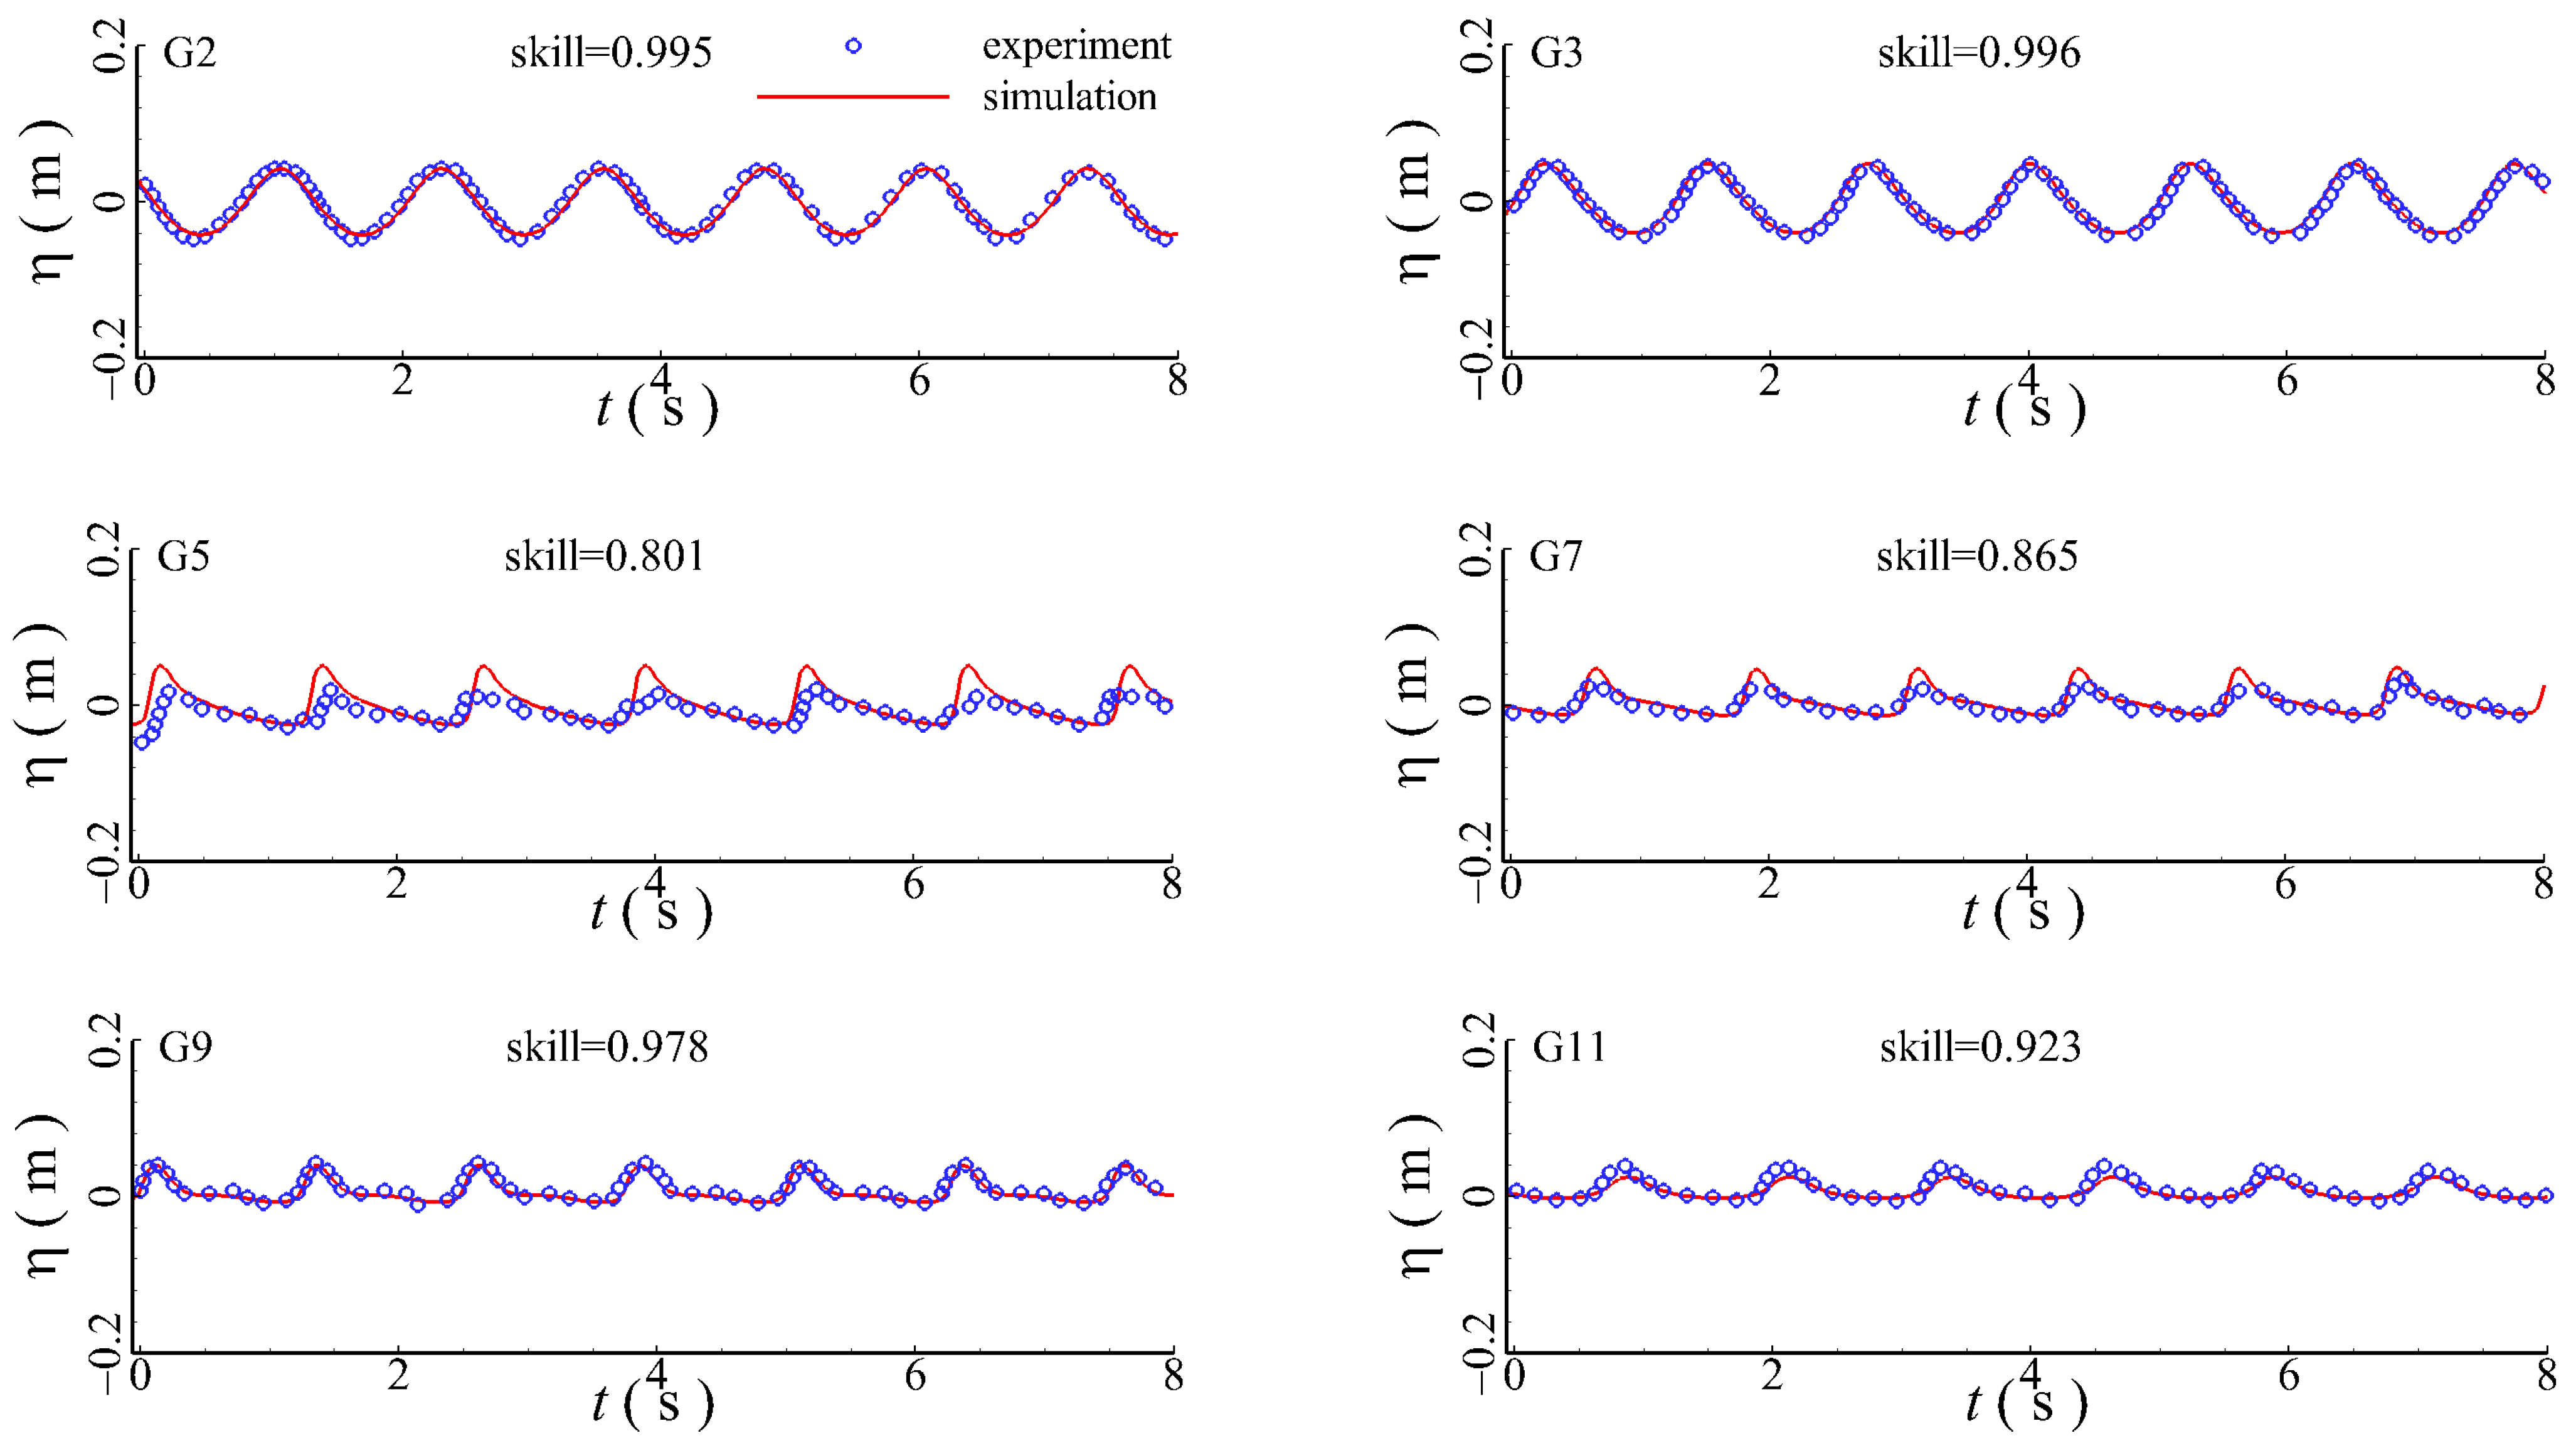
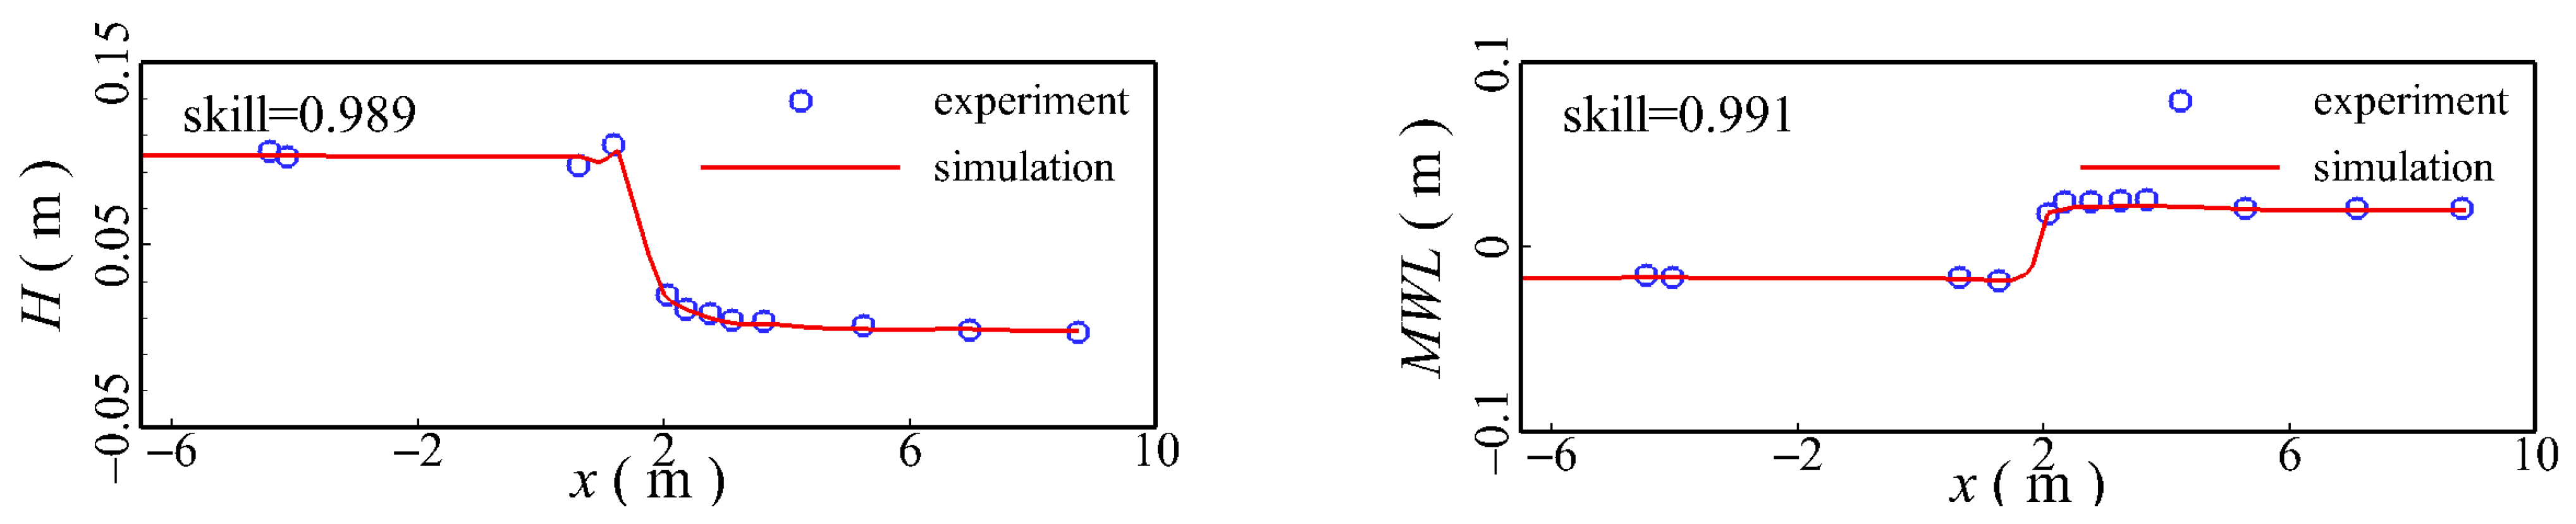
3. Model Calibration

This section numerically computes the hydrodynamic processes of regular waves using a fringing reef model. The computed results were analyzed against the experimental data of Yao et al. [38]. The experiment was conducted at the Hydraulics Laboratory of Nanyang Technological University, Singapore. The computational layout is depicted in Figure 1. The simulation domain is 37 m in length. The wave-maker is located at 21 m upstream of the toe of the 1:6 slope. The reef flat is 8.9 m in length and 0.35 m in height. Along the computational domain, 12 wave gauges are placed laterally. A sponge wave damping layer is installed at the right side of water tank. The horizontal mesh spacing ( d x ) is set as 0.02 m. In the σ -coordinate, 20 mesh layers are used. Two runs of the experiments are simulated as listed in Table 1. Table 2 lists the positions of wave gauges. Figure 2 and Figure 3 compare the time series of water levels at different positions for Runs 1 and 2, respectively. The computed water elevations are in good agreement with the measured data. Figure 4 and Figure 5 compare the spatial distributions of the time-mean wave height and time-mean water level for Run 1 and Run 2, respectively. The calculated mean wave height and mean water level both match the experimental data quite well. As observed in Figure 4 and Figure 5, wave heights can be substantially reduced once wave breaking occurs at the reef edge. By contrast, the time-mean water level increases along the reef.
The skill numbers suggested by Wilmott et al. [57] are calculated to evaluate the computational accuracy. In the Equation (6), X m o d e l and X o b s represent the predicted value and the experimental data, respectively. The closer the skill number is to 1, the more accurate the computation is. As shown in Figure 2, Figure 3, Figure 4 and Figure 5, the skill number is overall greater than 0.9, verifying the reliability of the present numerical wave solver.
S k i l l = 1 X m o d e l X o b s 2 X m o d e l X ¯ o b s + X o b s X ¯ o b s 2

4. Discussions on Research Findings

The remainder of this study employs numerical analysis to examine how a pit may affect the wave setup, wave runup, wave propagation, and wave transformation of incident regular waves. The influences of some main factors, i.e., wave height ( H ), submergence water depths ( h r ), wave period ( T ), reef-flat length ( L p ), forereef slope ( c o t α ), backreef slope ( c o t β ), pit center location ( x p ), pit depth ( H p ), pit width ( W p ) are explored. According to Figure 6, the computational structure is comparable to that in Yao et al. [51]. Based on Ford et al. [8]’s measurement using a 1:20 geometric scale ratio, the dimensions of the pit are established. For the basic run, the foreshore slope’s toe is situated 21 m downstream of the inlet, as depicted in Figure 6. The reef-flat length ( L p ) is 5 m. The pit center location ( x p ) is 2.5 m away for the fundamental numerical run. The pit depth ( H p ) is 0.2 m, and the pit width ( W p ) is 0.8 m. The forereef slope ( c o t α ) and backreef slope ( c o t β ) are set as 6:1 and 12:1, respectively. To assure the computational stability of NHWAVE, d w = 0.08 m is set in the mesh generation. Moreover, 90 wave gauges are positioned in the wave flume to monitor the time series of water elevations. The horizontal mesh resolution is d x = 0.02 m. Twenty σ -mesh layers are applied in the vertical direction. Fringing reefs with and without a pit are compared in this study for their differences in wave hydrodynamics. Table 3 lists the parameter setups for all the computational runs.

4.1. Complex Wave Hydrodynamics

The complex hydrodynamic phenomena of the wave propagation, wave transformation, and wave runup of regular wave at the fringing reef are investigated based on the basic run (Run 3). The water velocity contours on the fringing reef with and without the artificial pit at different time moments are shown in Figure 7. When the waves propagate from the open sea to the nearshore region, the wave steepness tends to increase due to the decrease in water depth. According to Figure 7a,e, most of the waves are to break at the reef edge. The breaking surge wave will continue to propagate and transform at the reef flat. However, the bottom friction of the reef flat causes the wave height of the breaking surge wave to continuously decrease (Figure 7b,f). Once the breaking surge wave propagates over the artificial pit, wave height and flow velocity will both be sharply reduced by a sudden rise in water depth (Figure 7g). When compared to the fringing reef without an artificial pit, the wave runup height is lower (Figure 7d,h) due to the complex vortices within the artificial pit that may further dampen some of the incident wave energy. Figure 8 shows the water elevations at different positions. Before the waves approach the artificial pit, it appears that there are no discernible differences in the water elevations between the fringing reefs with and without an artificial pit (Figure 8a,b). The artificial pit can have some blocking effects on the wave propagation, which can increase the water level at the left side of the artificial pit to some extent (Figure 8c). However, the water level at the right side of the artificial pit becomes lower than that at the fringing reef without an artificial pit (Figure 8d) since the strong vortices within the artificial pit can further dampen some wave energy. The spatial distributions of the time-mean wave height are shown in Figure 9, which demonstrates that the artificial pit can cause a reduction in the time-mean wave height in the vicinity of the artificial pit, particularly near its center (Figure 9a). However, the artificial pit has negligible impacts on the spatial distributions of the time-mean water level, as depicted in Figure 9b. The time series of energy fluxes at the left and right sides of the artificial pit is shown in Figure 10. As seen in Figure 10, before the incident waves interact with the artificial pit, the peak value of the energy flux at the fringing reef with an artificial pit is quite close to that without an artificial pit (Figure 10a). However, the peak values of the energy flux at the fringing reef with an artificial pit becomes much smaller than that without an artificial pit (Figure 10b) once the breaking surge waves interact with the water body within the artificial pit, because some wave energy can be dampened by the strong vortices in the artificial pit. Comparisons of the spatial variations in maximum depth-averaged velocity are shown in Figure 11. The artificial pit can amplify the intensity of wave breaking at the reef edge, resulting in an increase in the flow velocity. The flow velocity within the range of the artificial pit can be greatly reduced by the increased water depth in the pit. The time series of the wave runup height of regular waves is plotted in Figure 12. It appears that the peak values of the wave runup height of regular waves at the fringing reef with an artificial pit are on average 7.23% less than those of the reef without an artificial pit.

4.2. Effects of Wave Height

This section performs numerical analysis to analyze the influences of an artificial pit on the wave hydrodynamics of fringing reefs under different incidence wave heights based on Run 1, 2, 3, 4, and 5. Spatial variations in the time-mean wave height at the fringing reef are compared in Figure 13. Overall, the artificial pit can reduce the time-mean wave height around the artificial pit. The size of the water region where the time-mean wave height can be decreased by the presence of an artificial pit gradually increases as the incident wave height increases. The variations in wave setup with the wave height are shown in Figure 14. Although the wave setup grows linearly with incident wave height, the differences in the wave setups at the fringing reefs with and without an artificial pit are negligible. Figure 15 shows the changes in the wave reflection coefficient with the wave height. The wave reflection coefficient tends to grow linearly with the wave height. Because the artificial pit can produce some blocking impacts on the wave propagation, the wave reflection coefficient of regular waves at the fringing reef with an artificial pit is always larger than that of the reef without an artificial pit—11.6% larger on average. Figure 16 depicts the variation in the time-mean maximum of wave runup height with the incident wave height. Obviously, the time-mean maximum of wave runup height increases monotonically with the wave height. Because the artificial pit can dampen some incident wave energy, the time-mean maximum of the wave runup height of regular waves at the fringing reef with an artificial pit becomes lower than that of the reef without the artificial pit—13.3% lower on average.

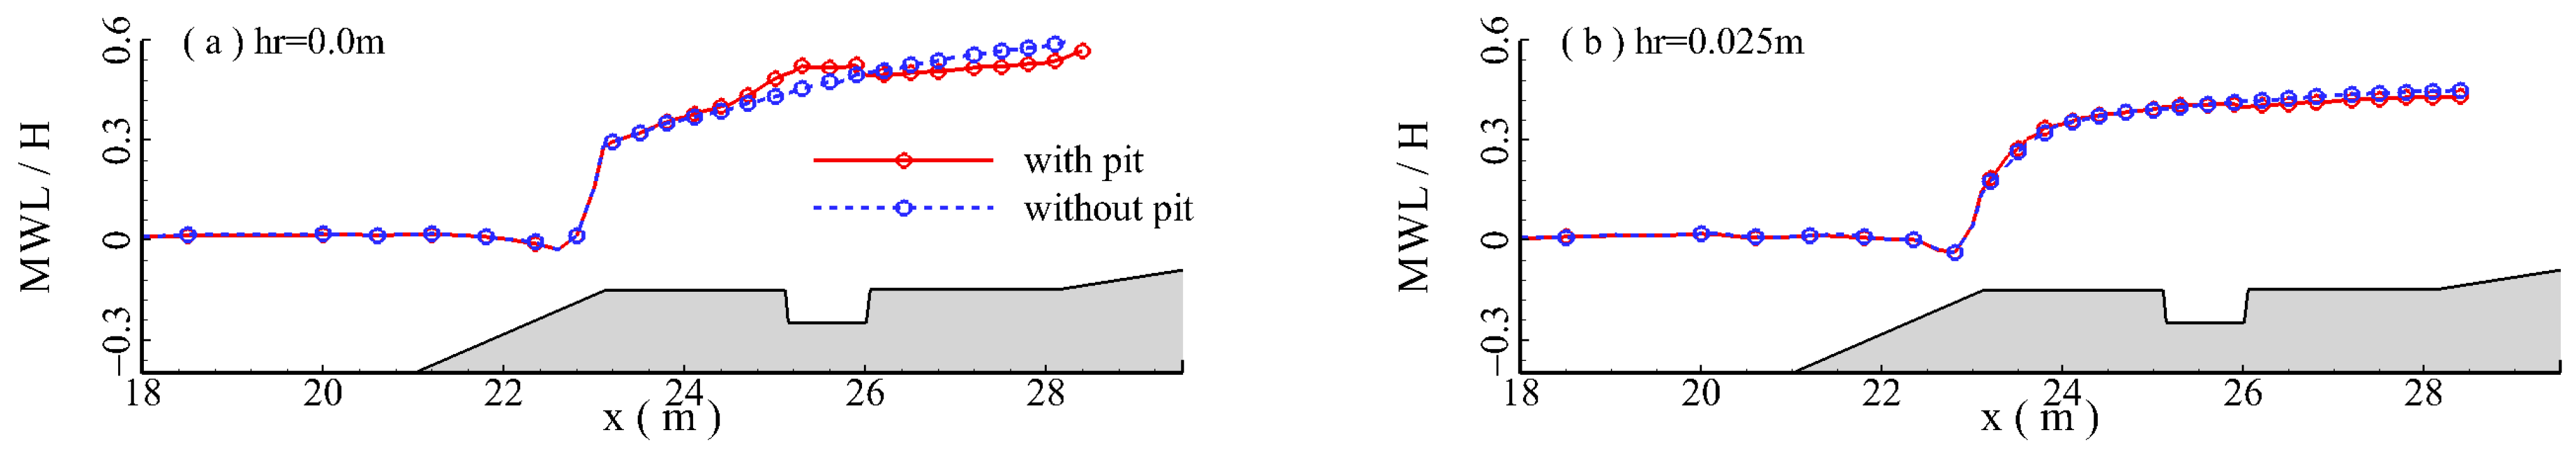
4.3. Effects of Submergence Water Depth

This section analyzes the impacts of submergence water depth on the wave hydrodynamics of the fringing reef with the artificial pit based on Run 3, 6, 7, 8, and 9. Figure 17 compares the spatial distributions of the time-mean wave height under different submergence water depths. It appears that the artificial pit has no discernible effects on the distribution of time-mean wave height when the submergence water depth is small (Figure 17a). When the submergence water depth is greater than 0 m, the effects of the artificial pit on the spatial variation in the time-mean wave height will be enhanced, and the corresponding influence range will gradually increase with the submergence water depth. As can be seen in Figure 18a, when the reef flat is dry, the artificial pit can increase the time-mean water level around the pit and decrease the time-mean water level at the downstream of the pit. However, when the submergence water depth is larger than zero, the impacts of the artificial pit on the time-mean water level become negligible (Figure 18b). The wave setup monotonically decreases with the submergence water depth, as seen in Figure 19. Only when the submergence water depth is less than 0.025 m are the discrepancies in the wave setups of fringing reefs with and without an artificial pit apparent. The wave setup can be reduced by 68.8% and 71.2% for the fringing reefs with and without an artificial pit, respectively, when the submergence water depth increases from 0 m to 0.1 m. Figure 20 plots the spatial variations in maximum depth-averaged velocity along the fringing reefs with and without an artificial pit. As depicted in Figure 20, when the submergence water depth is low, such as h r = 0 m, the artificial pit can decrease the flow velocity at the pit and downstream. As the submergence water depth increases, the influence degree of the artificial pit on flow velocity gradually decreases. According to Figure 21, the wave reflection coefficient of the regular waves tends to decrease with the submergence water depth. Regular waves can produce comparatively greater wave reflection coefficients at the fringing reef without the pit while the reef flat is dry. Once the submergence water depth is nonzero, the wave reflection coefficient of the regular waves at the fringing reef with an artificial pit becomes greater than that at the reef without an artificial pit. The wave reflection coefficients of the regular waves at the fringing reefs with and without an artificial pit can be reduced by 69.5% and 80.1%, respectively, when the submergence water depth increases from 0 m to 0.1 m. However, the variation in submergence water depth has negligible impacts on the time-mean maximum of wave runup height (Figure 22).

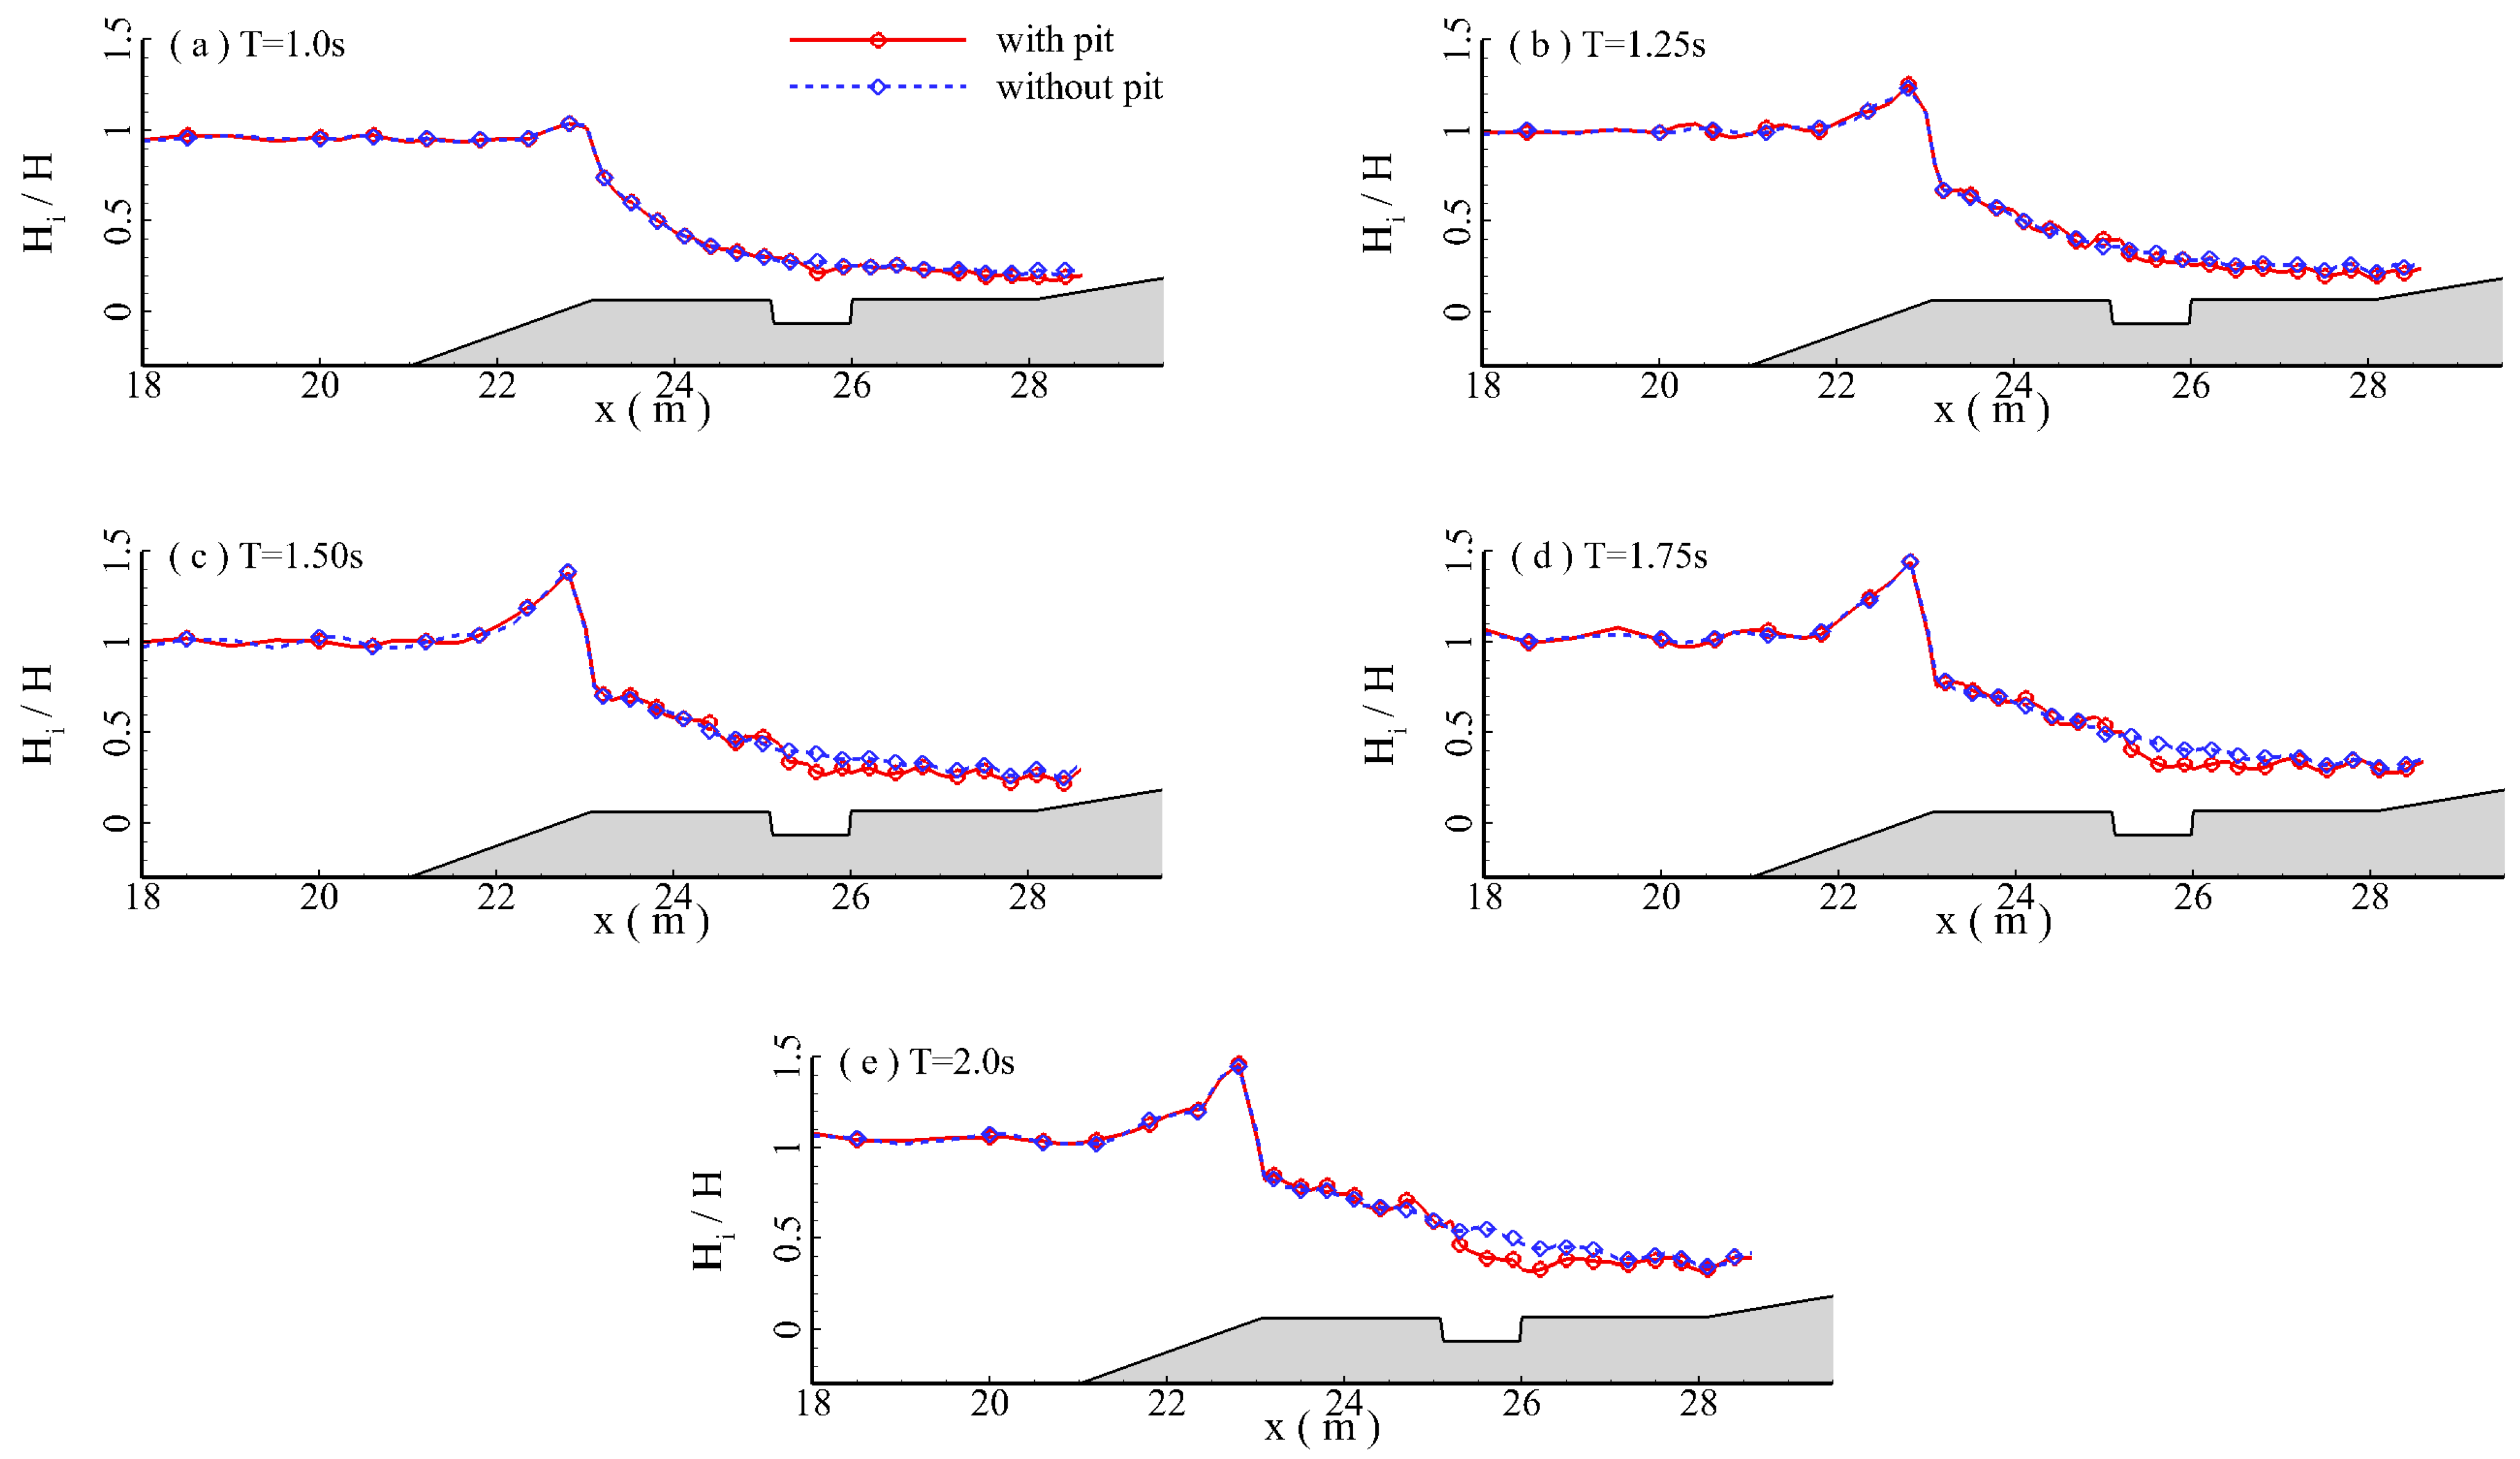
4.4. Effects of Wave Period

This section carries out numerical analysis to investigate the influences of the artificial pit on the wave hydrodynamics of the fringing reef under different wave periods based on Run 3, 10, 11,12, and 13. As depicted in Figure 23, when the wave period is small ( T < 1.50 s), the influences of the artificial pit on the spatial variation in the time-mean wave height, especially upstream of the pit, are negligible. The time-mean wave height around the artificial pit and downstream can be gradually reduced as the wave period increases gradually. Therefore, this indicates that the artificial pit has more obvious influences on the wave hydrodynamics of long waves. The wave setup increases with the wave period in almost a linear mode (Figure 24). Meanwhile, the influences of the artificial pit on the wave setup under different wave periods can be ignored. Figure 25 illustrates the nonlinear relationship between the wave period and wave reflection coefficient. At T = 1.25 s, the wave reflection coefficients of regular waves approach their peak values for the fringing reefs with and without the artificial pit. When the wave period is greater than 1 s, the wave reflection coefficient of the regular waves at the fringing reef with an artificial pit is always greater than that at the reef without the artificial pit—51% greater on average. As demonstrated in Figure 26, the time-mean maximum of wave runup height increases with the wave period at a given submergence water depth and wave height, indicating that a longer wavelength has a higher wave runup height. As the wave period increases from 1 s to 2 s, the time-mean maximum of wave runup height increases by 56.9% and 80% at the fringing reefs with and without the artificial pit, respectively. The time-mean maximum of the wave runup height of regular waves at the fringing reef without an artificial pit is consistently higher than that of the reef with the pit—10.9% higher on average when the wave period is larger than 1.0 s.

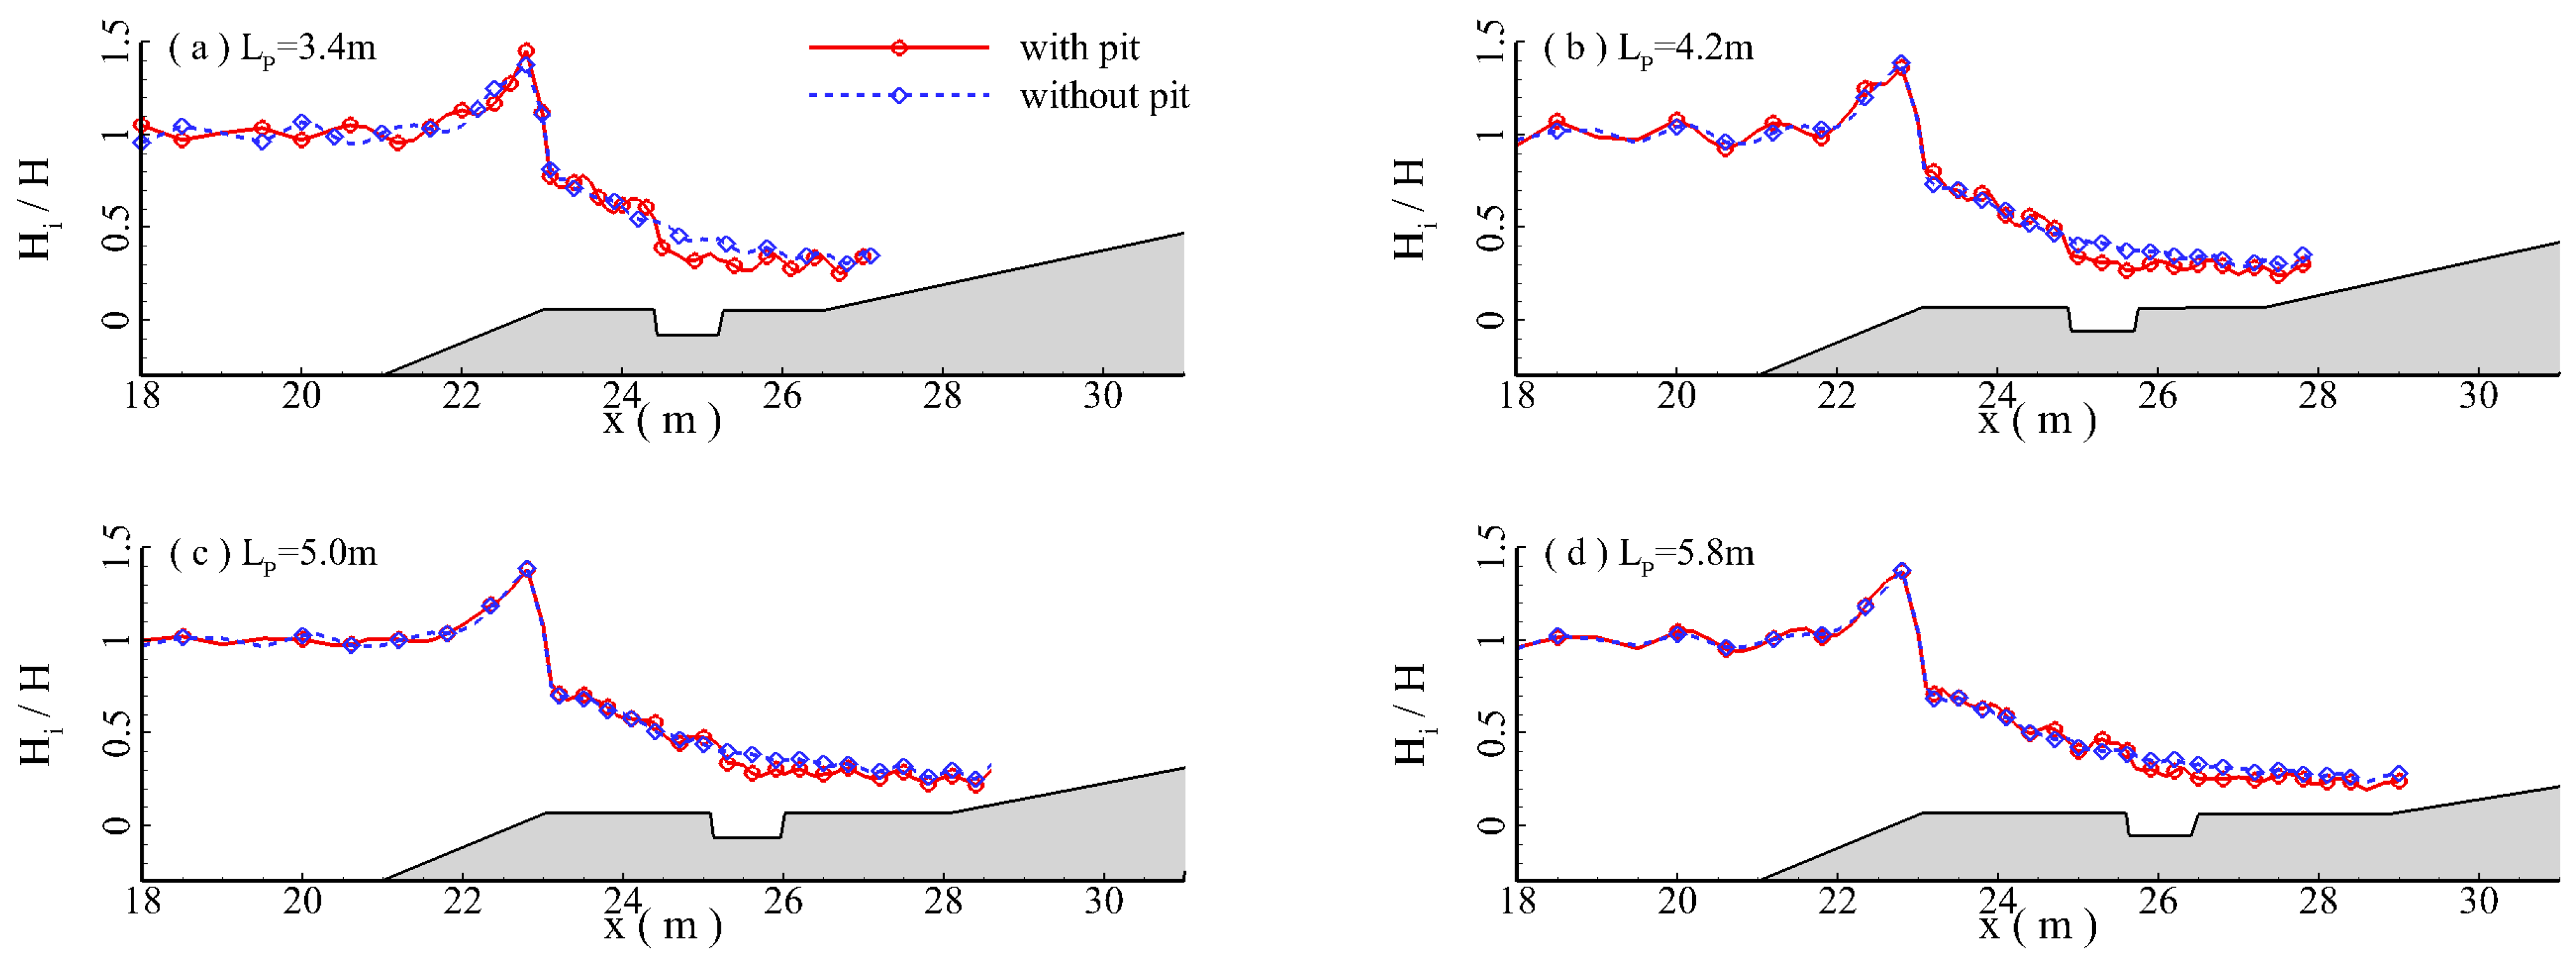
4.5. Effects of Reef-Flat Length

The influences of the artificial pit on the wave hydrodynamics of regular waves at the fringing reef under different reef-flat lengths are analyzed based on Run 3, 14, 15, 16, and 17. In the computation, the artificial pit is always located at the center of the reef flat under different reef-flat lengths. Figure 27 compares the spatial distributions of the time-mean wave height at the fringing reef. As depicted in Figure 27, when the L P is small ( L p 5   m ), the artificial pit can substantially reduce the time-mean wave height around the artificial pit and downstream (Figure 27a). The influences of the artificial pit on the distribution in wave height may gradually diminish as the reef-flat length increases. The wave setup gradually increases with the reef-flat length in a monotonical mode (Figure 28). When the reef-flat length gradually increases from L p = 3.4 m to 6.6 m, the wave setups of regular waves at the fringing reefs with and without the artificial pit can increase by 8.6% and 9.2%, respectively. Figure 29 shows that the wave reflection coefficient gradually decreases with the reef-flat length, except at L p = 4.2   m for the fringing reef with the artificial pit. As seen in Figure 30, as the reef-flat length increases, the time-mean maximum of the wave runup height of regular waves at the fringing reef slightly decreases. Regular waves at the fringing reef with an artificial pit always have a lower time-mean maximum of wave runup height than those at the reef without an artificial pit—12.1% lower on average. The time-mean maximum of the wave runup heights of regular waves at fringing reefs with and without an artificial pit can be reduced by 11.1% and 14.8%, respectively, when the reef-flat length increases from L p = 3.4 m to 6.6 m.

4.6. Effects of Forereef Slope and Backreef Slope

This section performs numerical analysis to analyze the impacts of the forereef slope and backreef slope on the wave hydrodynamics of the fringing reef with the pit. Run 3, 18, 19, 20, and 21 are designed to investigate the influences of the forereef slope. As depicted in Figure 31, a large breaking-wave height can be observed when the forereef slope is relatively steep (Figure 31a). As the forereef slope gradually becomes more and more mild, relatively smaller breaking-wave heights can be observed. Meanwhile, the time-mean wave heights are found to change noticeably along the fringing reef when the forereef slope is steep. As the forereef slope gets smaller, the discrepancies in the time-mean wave heights between the fringing reefs with and without an artificial pit can be reduced. Figure 32 shows that the wave setup gradually increases with the forereef slope. As the forereef slope increases from c o t α = 10 to c o t α = 2, the wave reflection coefficient of the regular waves can be increased by 32.8%. The discrepancies in the wave reflection coefficients at the fringing reefs with and without an artificial pit are negligible. As depicted in Figure 33, when forereef slope gradually increases from c o t α = 10 to c o t α = 8, the wave reflection coefficients at the fringing reefs with and without an artificial pit can be decreased by 21.4% and 7.5%, respectively. When forereef slope increases from c o t α = 8 to c o t α = 2, the wave reflection coefficient of the regular waves increases with the forereef slope at a high rate. The wave reflection coefficients of the regular waves at the fringing reefs with and without an artificial pit can be increased by 186% and 289%, respectively. The wave reflection coefficient of the regular waves at the fringing reef with an artificial pit is always larger than that at the reef without an artificial pit, except at c o t α = 2. When the forereef slope is very steep, the blocking effects of the forereef slope become much stronger than those at the reef with an artificial pit. As depicted in Figure 34, the time-mean maximum of wave runup height can only slightly increase with forereef slope. As the forereef slope increases from c o t α = 10 to c o t α = 2, the time-mean maximum of the wave runup height of regular waves could be increased by 17.0%.
Runs 3, 22, 23, 24, 25 are designed to analyze the influences of the backreef slope. As can be seen in Figure 35a,b, a change in the backreef slope has very little impact on the variations in the spatial distributions of wave height between the fringing reefs with and without a pit. When the backreef is large, oscillation behavior in the spatial distribution of wave height can be observed. With the decrease in backreef slope, this kind of oscillation behavior can be gradually weakened (Figure 35c,e). Apparently, variation in the backreef slope has negligible influences on the wave setup, which remains around 0.025, as depicted in Figure 36. The variations in wave reflection coefficients with the c o t β are plotted in Figure 37. This demonstrates that the c o t β has little effect on the wave reflection coefficients’ variations, which remain at around 0.1. Additionally, it has been noted that when the c o t β is less than 8, the pit always results in larger wave reflection coefficients for regular waves at the fringing reef than it would have without it. However, once the backreef slope ( c o t β ) is greater than 8, regular waves at the fringing reef have lower wave reflection coefficients with the pit than they would have without it. As depicted in Figure 38, the mean maximum wave runup height steadily increases with the backreef slope ( c o t β ) in a linear mode. The time-mean maximum of the wave runup heights of regular waves at the fringing reefs with and without a pit can be increased by 40.4% and 49.1%, respectively, as the backreef slope ( c o t β ) increases from c o t β = 20 to c o t β = 4 . Regular waves at the fringing reef had higher mean maximum wave runup heights without the pit than with it, by an average of 14.4%.

4.7. Effects of Pit Location

The influences of the pit location on the hydrodynamics of regular waves at the fringing reef are numerically analyzed based on Run 3, 26, 27, 28, and 29. In this study, the pit position is defined as the spacing distance between the reef edge and the center of the artificial pit. When the artificial pit is located at the reef edge, there are strong interactions between the incident waves and the water body within the artificial pit (Figure 39a). Meanwhile, breaking-wave heights can be increased to some extent. In addition, strong wave reflections can be observed. In this case, the time-mean wave height at the fringing reef with the artificial pit can increase more significantly than that at the reef without the artificial pit. More kinetic wave energy can be converted into potential wave energy as a result of the blocking effects of the artificial pit. The time-mean wave height around the pit can become lower than that without the pit if the artificial pit moves downstream a little bit. Hence, the influences of the artificial pit on the time-mean wave height decrease as it moves further downstream (Figure 39c–e). The time-mean water level can be substantially reduced if the artificial pit is located at the reef edge (Figure 40a). However, the artificial pit has very little impact on the spatial distribution of the time-mean water level once the pit moves downstream a little bit (Figure 40b). The wave setup approaches its minimum value at x p = 0.4 m since the local mean water level can be greatly reduced if the pit is located at the reef edge (Figure 41). Once the pit center location ( x p ) is greater than 1.45 m, there are no discernible effects of the pit center location on the wave setup. If the artificial pit is located at the reef edge, a high wave reflection coefficient can be observed, attributed to the strong interactions between the water body within the artificial pit and the incident waves (Figure 42). When the artificial pit moves downstream, the wave reflection coefficient can be substantially decreased. For instance, when the pit center location ( x p ) moves from x p = 0.4   m   t o   x p = 4.6   m , the wave reflection coefficient of the regular waves can be decreased by 49.3%. The time-mean maximum of wave runup height is relatively marginally influenced by the variation in pit center location (Figure 43). Despite the fact that the variation in pit center location ( x p ) has a great impact on the wave reflection coefficient, the time-mean maximum of wave runup height can be only slightly affected by the variation in pit center location ( x p ). The time-mean maximum of wave runup height approaches its peak value at x p = 1.45 m.

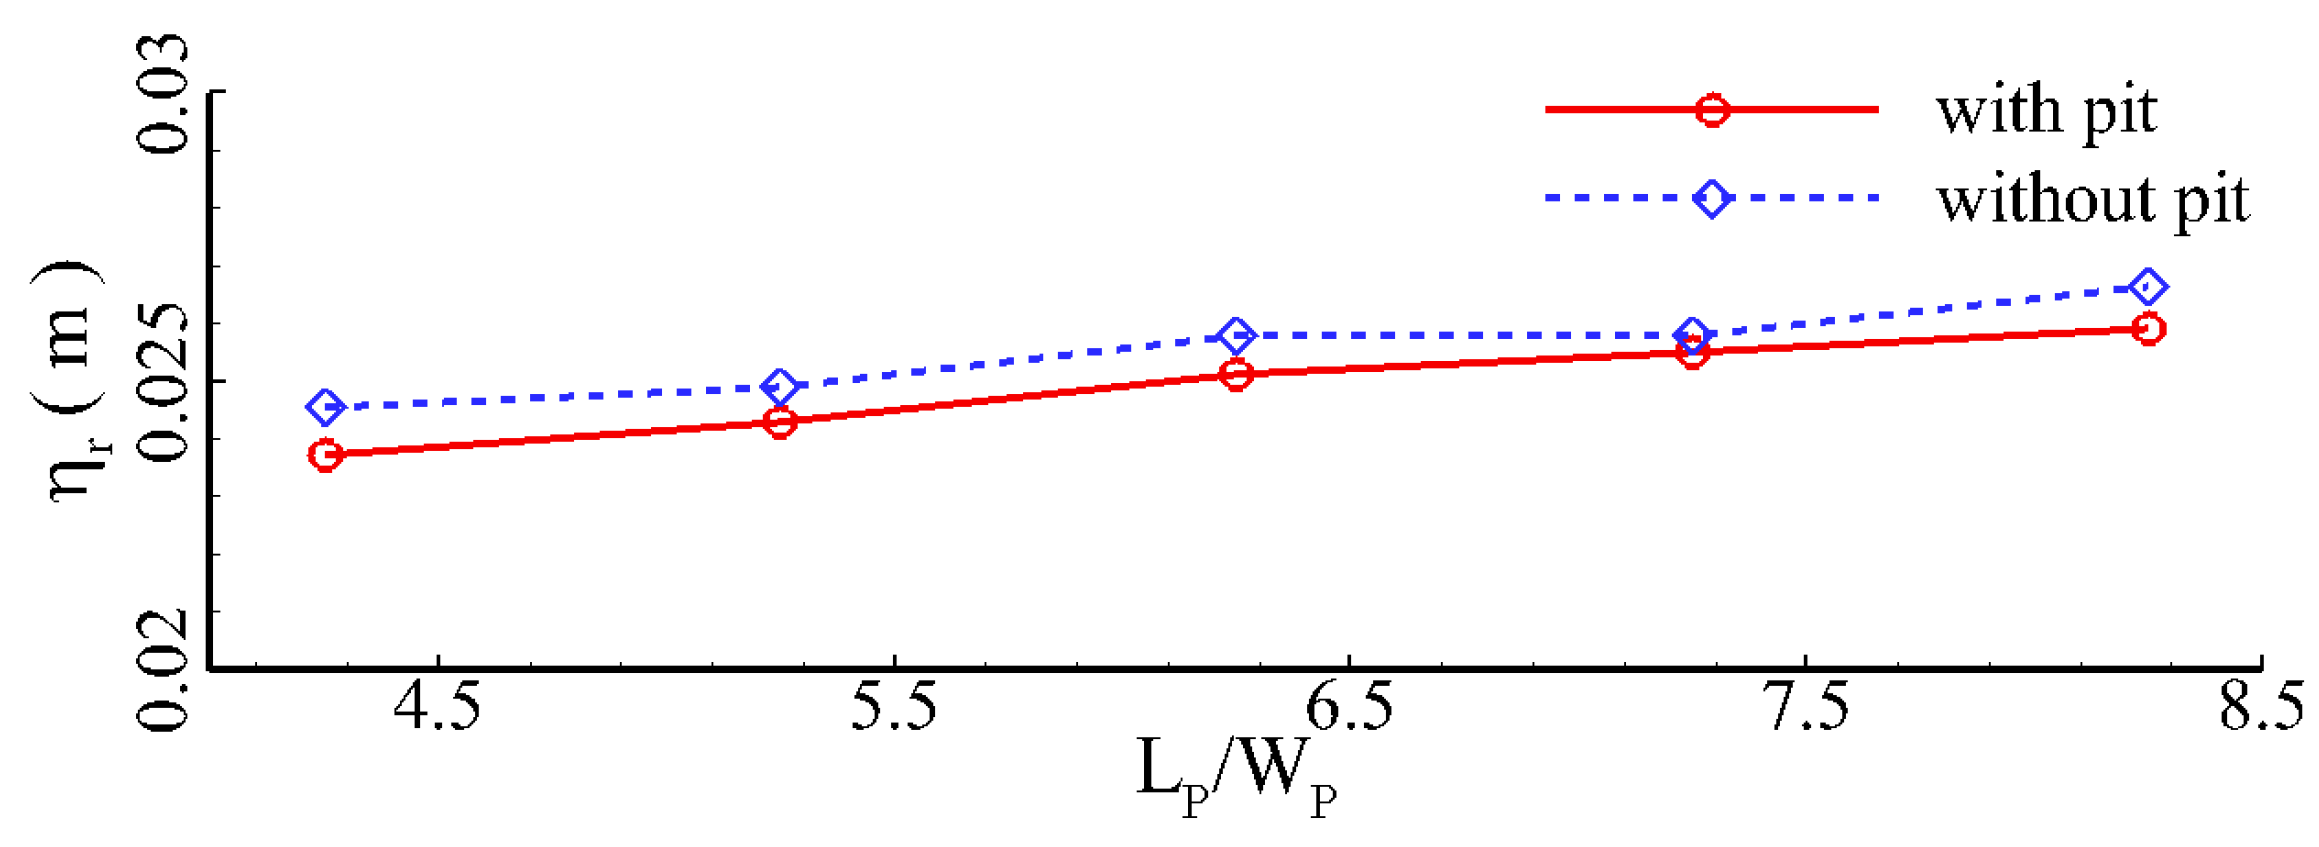
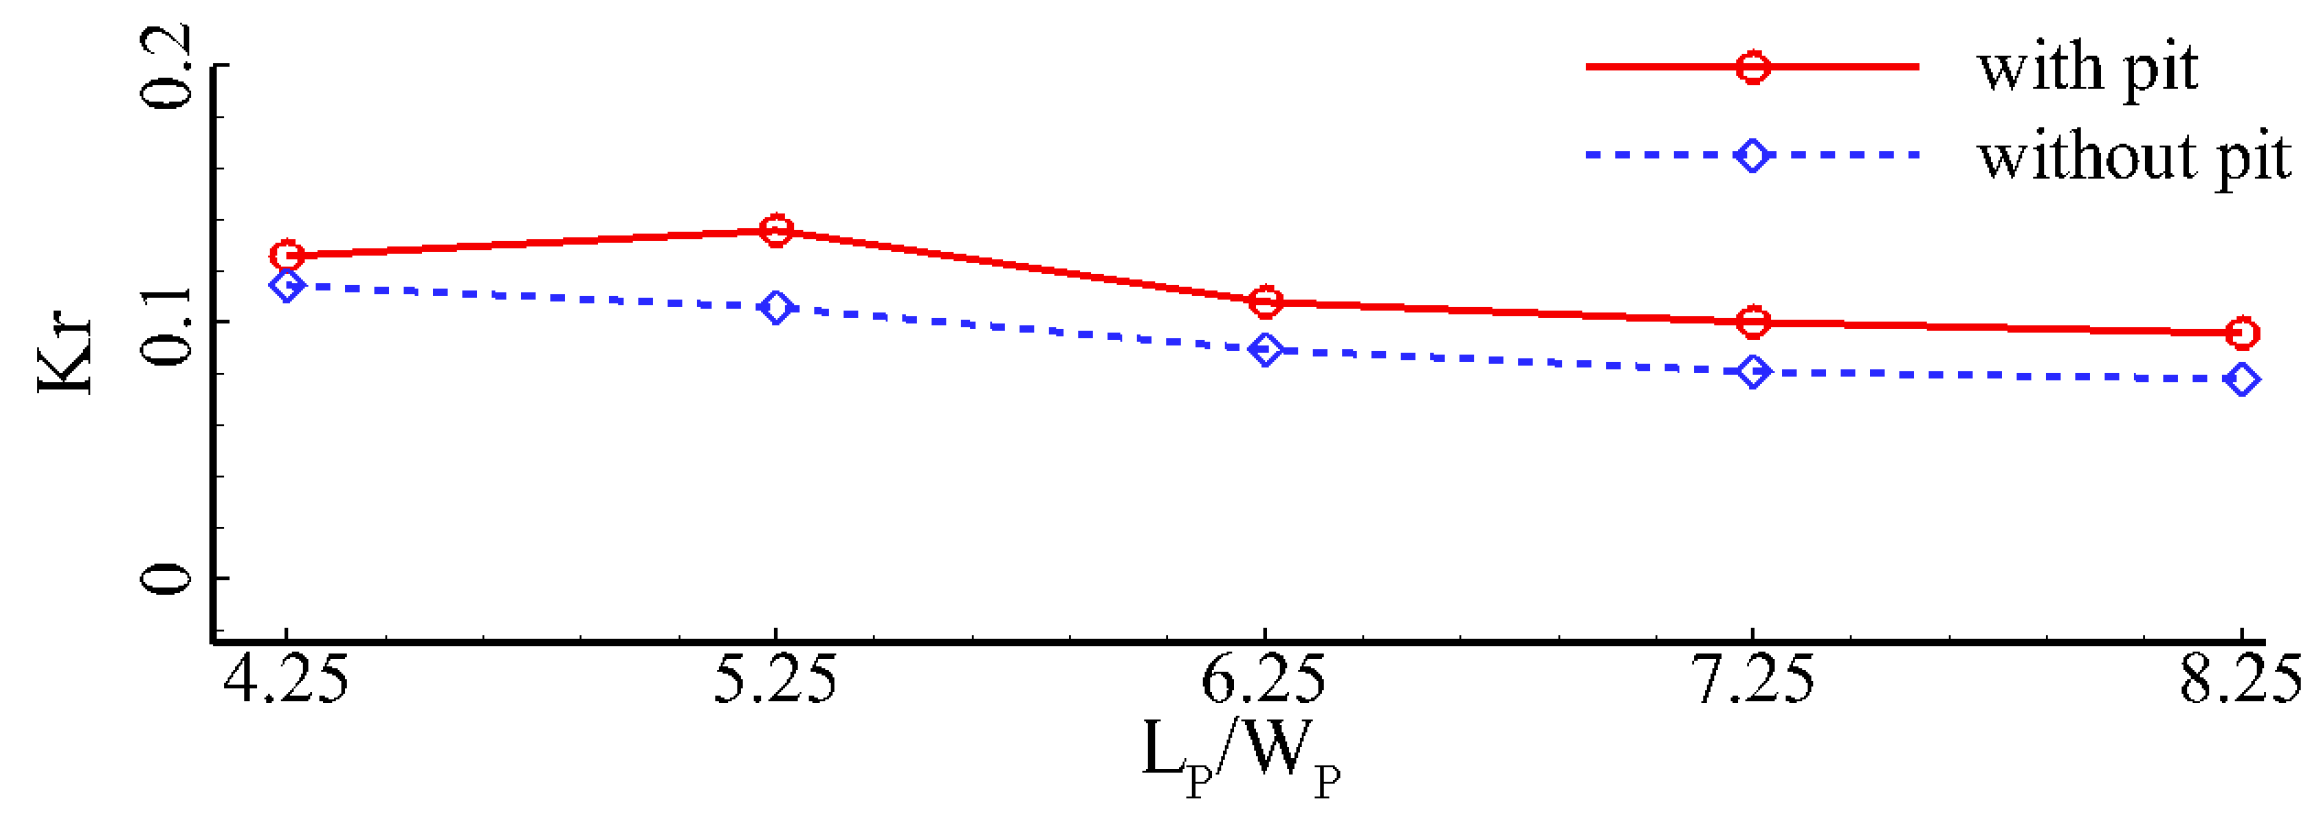
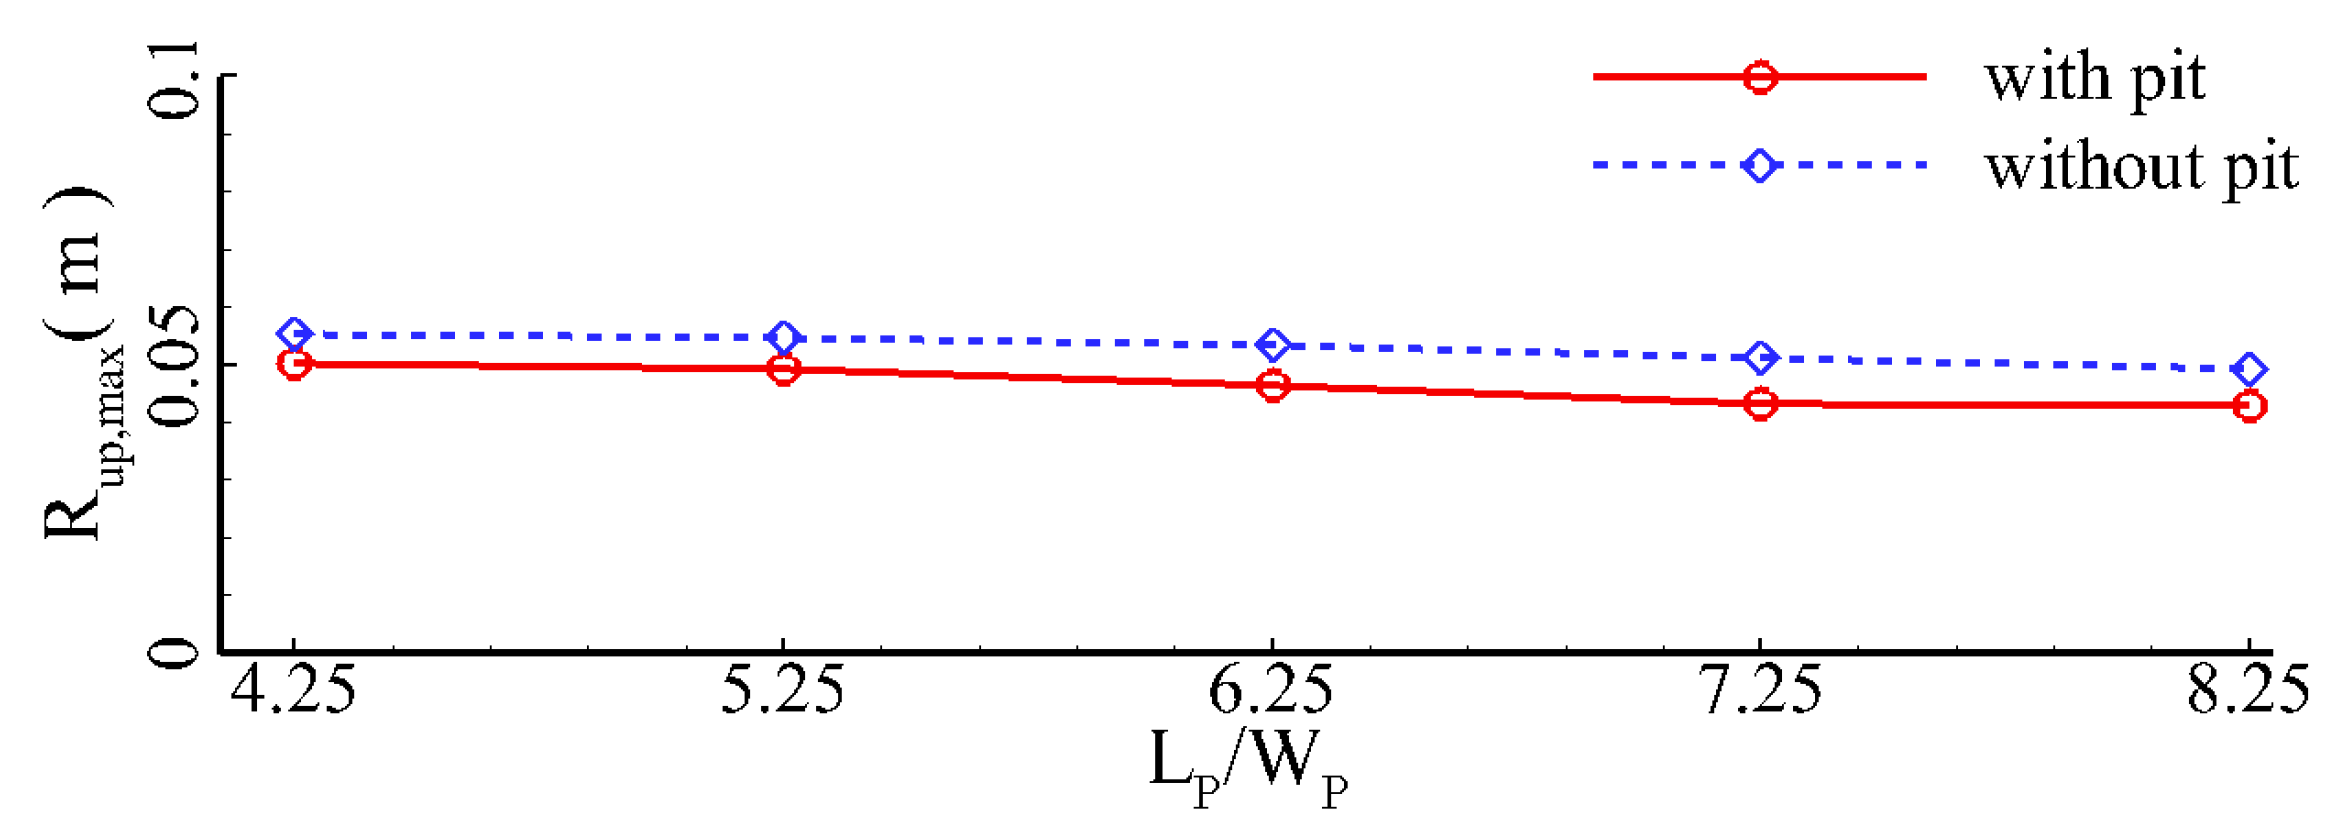
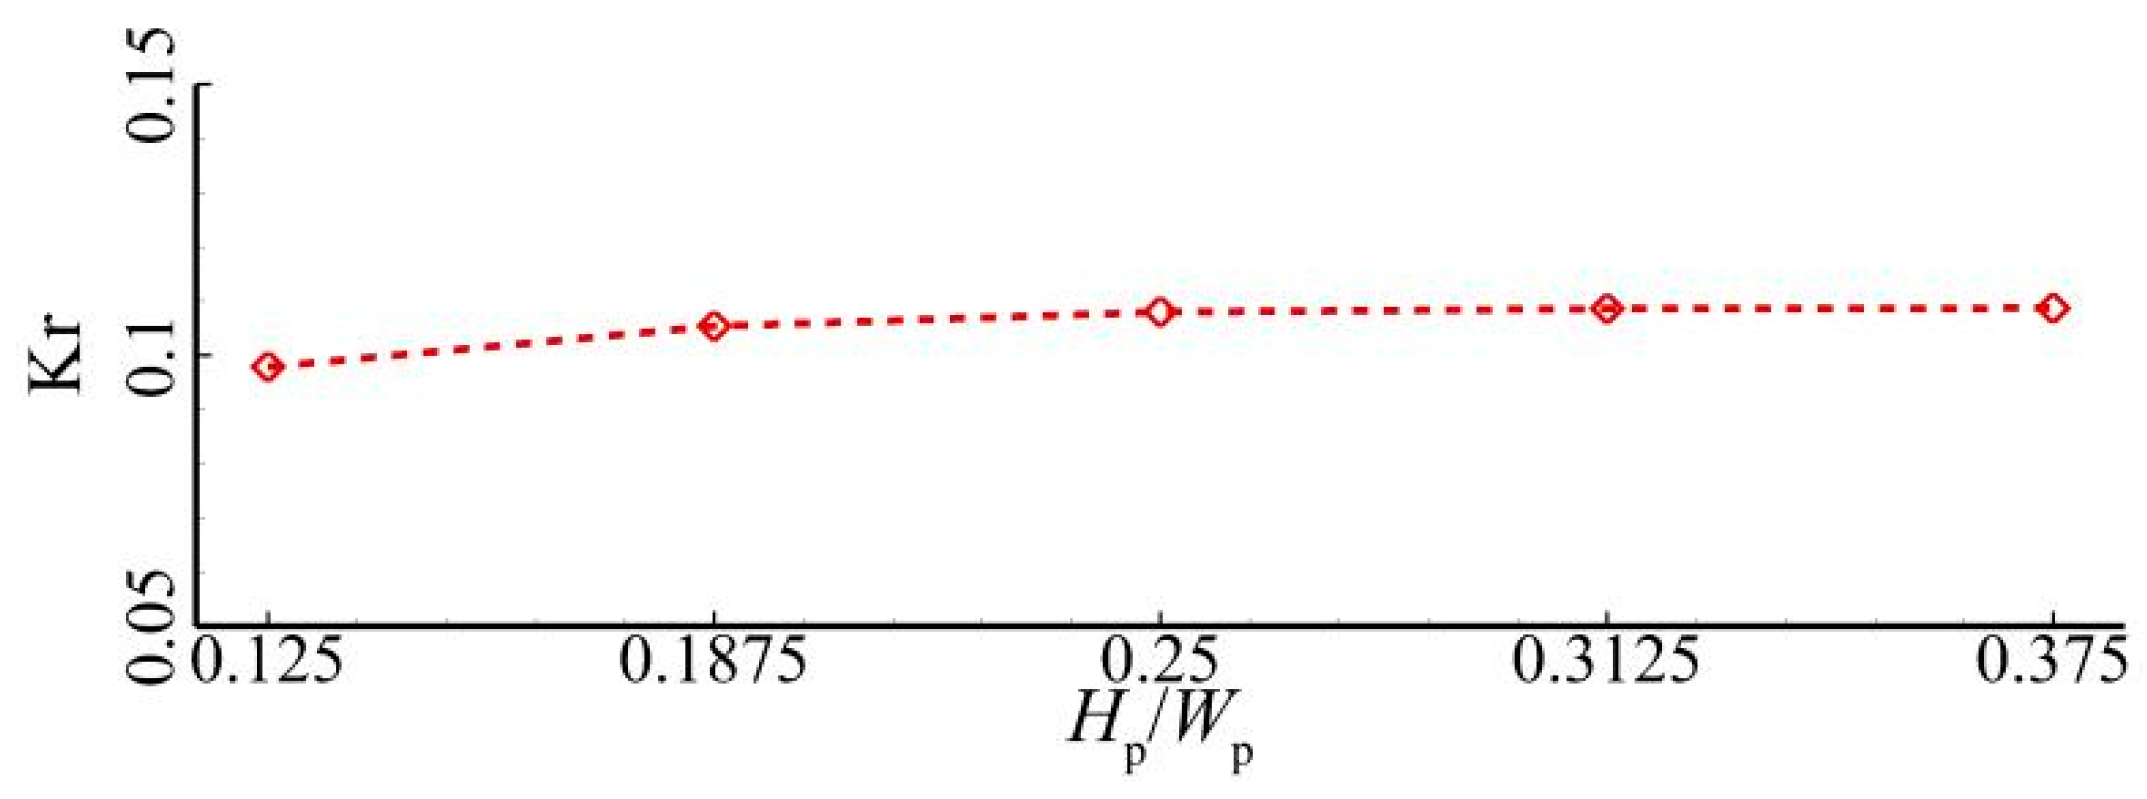
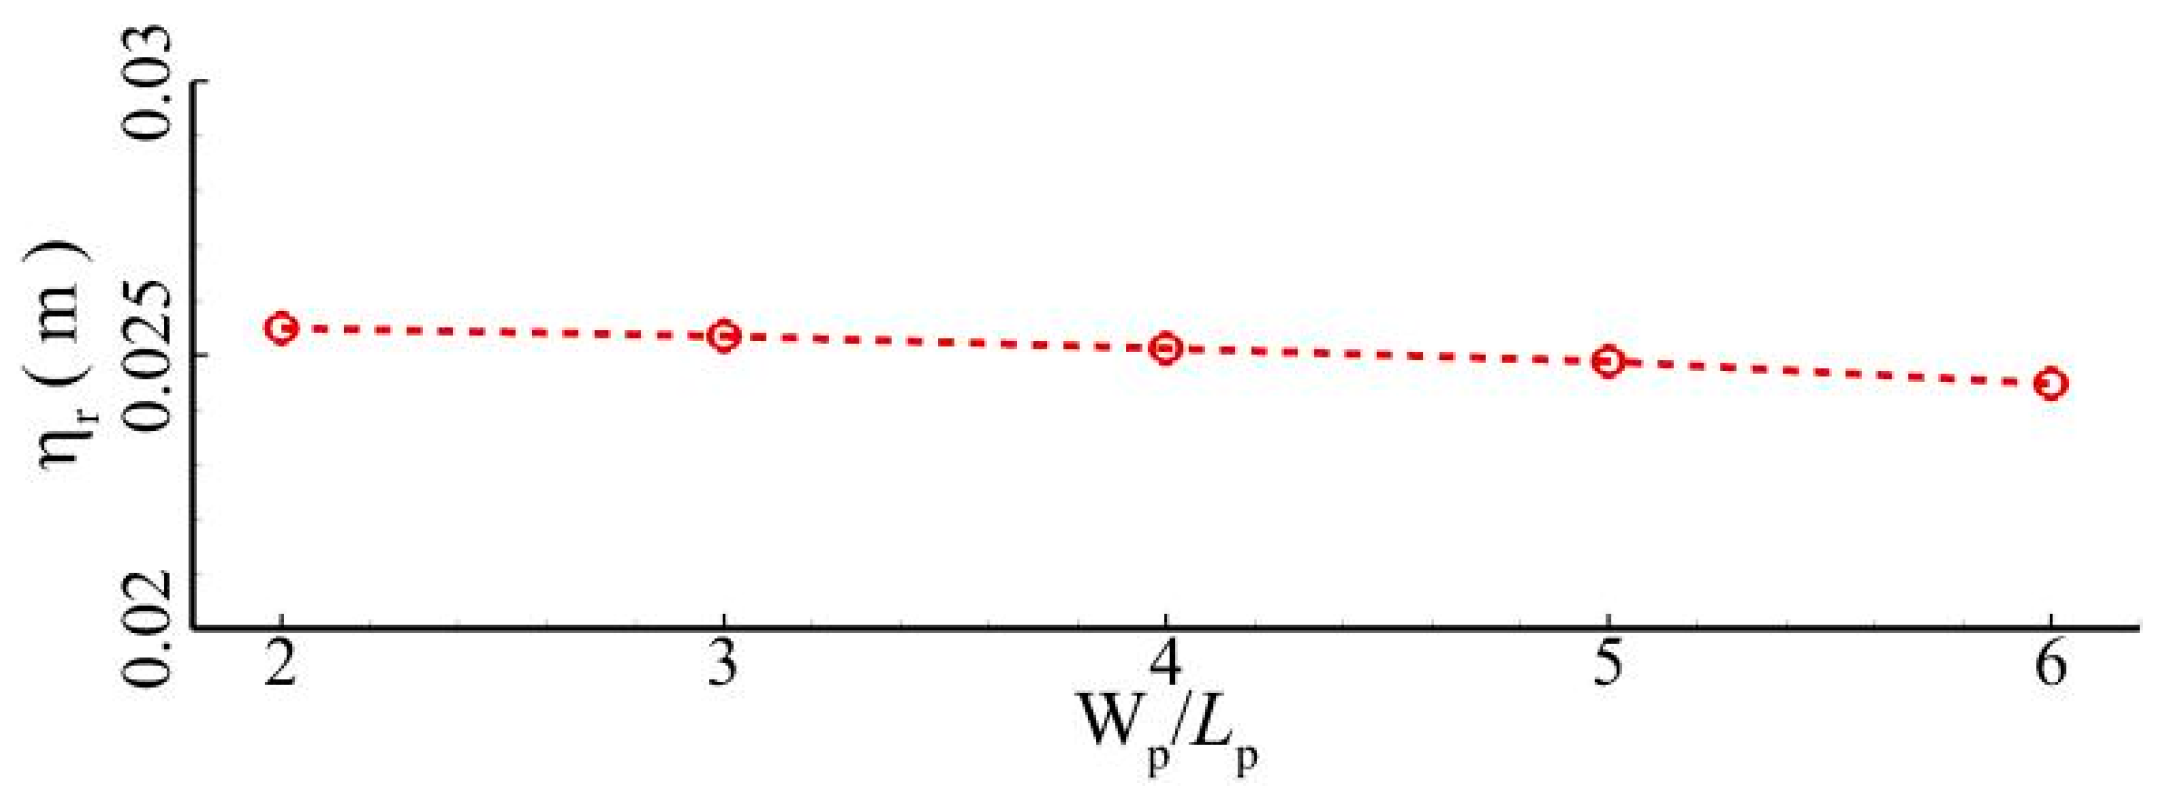
4.8. Effects of Artificial Pit Depth and Width

The influences of artificial pit depth and width on the hydrodynamics of regular waves on the fringing reef with a pit are analyzed in this section. Runs 3, 30, 31, 32, and 33 are designed to investigate the influences of artificial pit depth. Figure 44 compares the space distributions of time-mean wave height on the reef flats with and without the artificial pit under different artificial pit depths. It is shown that when the artificial pit depth is shallow, the artificial pit has limited influence on the spatial distribution of time-mean wave height. At the center of the pit, the time-mean wave height can be lowered to some extent (Figure 44a). With the increase in artificial pit depth, both the influence degree and the influence range of the artificial pit on the spatial distribution of time-mean wave height increase. As shown in Figure 45, a variation in the artificial pit depth can limitedly influence the wave setup, which remains around 0.025. With the increase in artificial pit depth, the blocking effects of the artificial pit on the breaking surge waves can be gradually intensified. Hence, the wave reflection coefficient tends to increase with the artificial pit depth (Figure 46). However, once the artificial pit depth exceeds 0.2 m, the variation in artificial pit depth has negligible influences on the wave reflection. Figure 47 shows that the time-mean maximum of wave runup height slightly decreases with the artificial pit depth. As the artificial pit depth increases from 0.1 m to 0.3 m, the time-mean maximum of wave runup height can be only decreased by 10.6%.
Runs 3, 34, 35, 36, and 37 are designed to analyze the effects of artificial pit width. As seen in Figure 48, spatial distributions of the time-mean wave height at the fringing reef are compared under different artificial pit widths. This shows that the change in artificial pit width can limitedly affect the distribution of time-mean wave height before the breaking surge waves interact with the water within the artificial pit. The existence of an artificial pit will reduce the time-mean wave height around the pit. The reduction region of time-mean wave height increases with the artificial pit width. However, the reduction region of the time-mean wave height is confined within the vicinity of the artificial pit if the artificial pit width is greater than 1 m (Figure 48e). Figure 49 shows that the wave setup decreases with the artificial pit width in a linear mode. When the artificial pit width increases from 0.4 m to 1.2 m, the wave setup can be decreased by 3.98%. The change in artificial pit width has no apparent impacts on the wave reflection coefficient, which remains around 0.1, as depicted in Figure 50. As observed in Figure 51, the change in artificial pit width has little influence on the time-mean maximum of wave runup height, which remains around 0.05 m.

5. Concluding Remarks

Based on the non-hydrostatic wave solver NHWAVE, this study numerically investigates the hydrodynamics of fringing reefs with an artificial pit. The effects of some major factors on the variations in wave setup, wave runup, and wave transformation processes of regular waves are thoroughly analyzed. The following is a summary of major research findings:
(1)
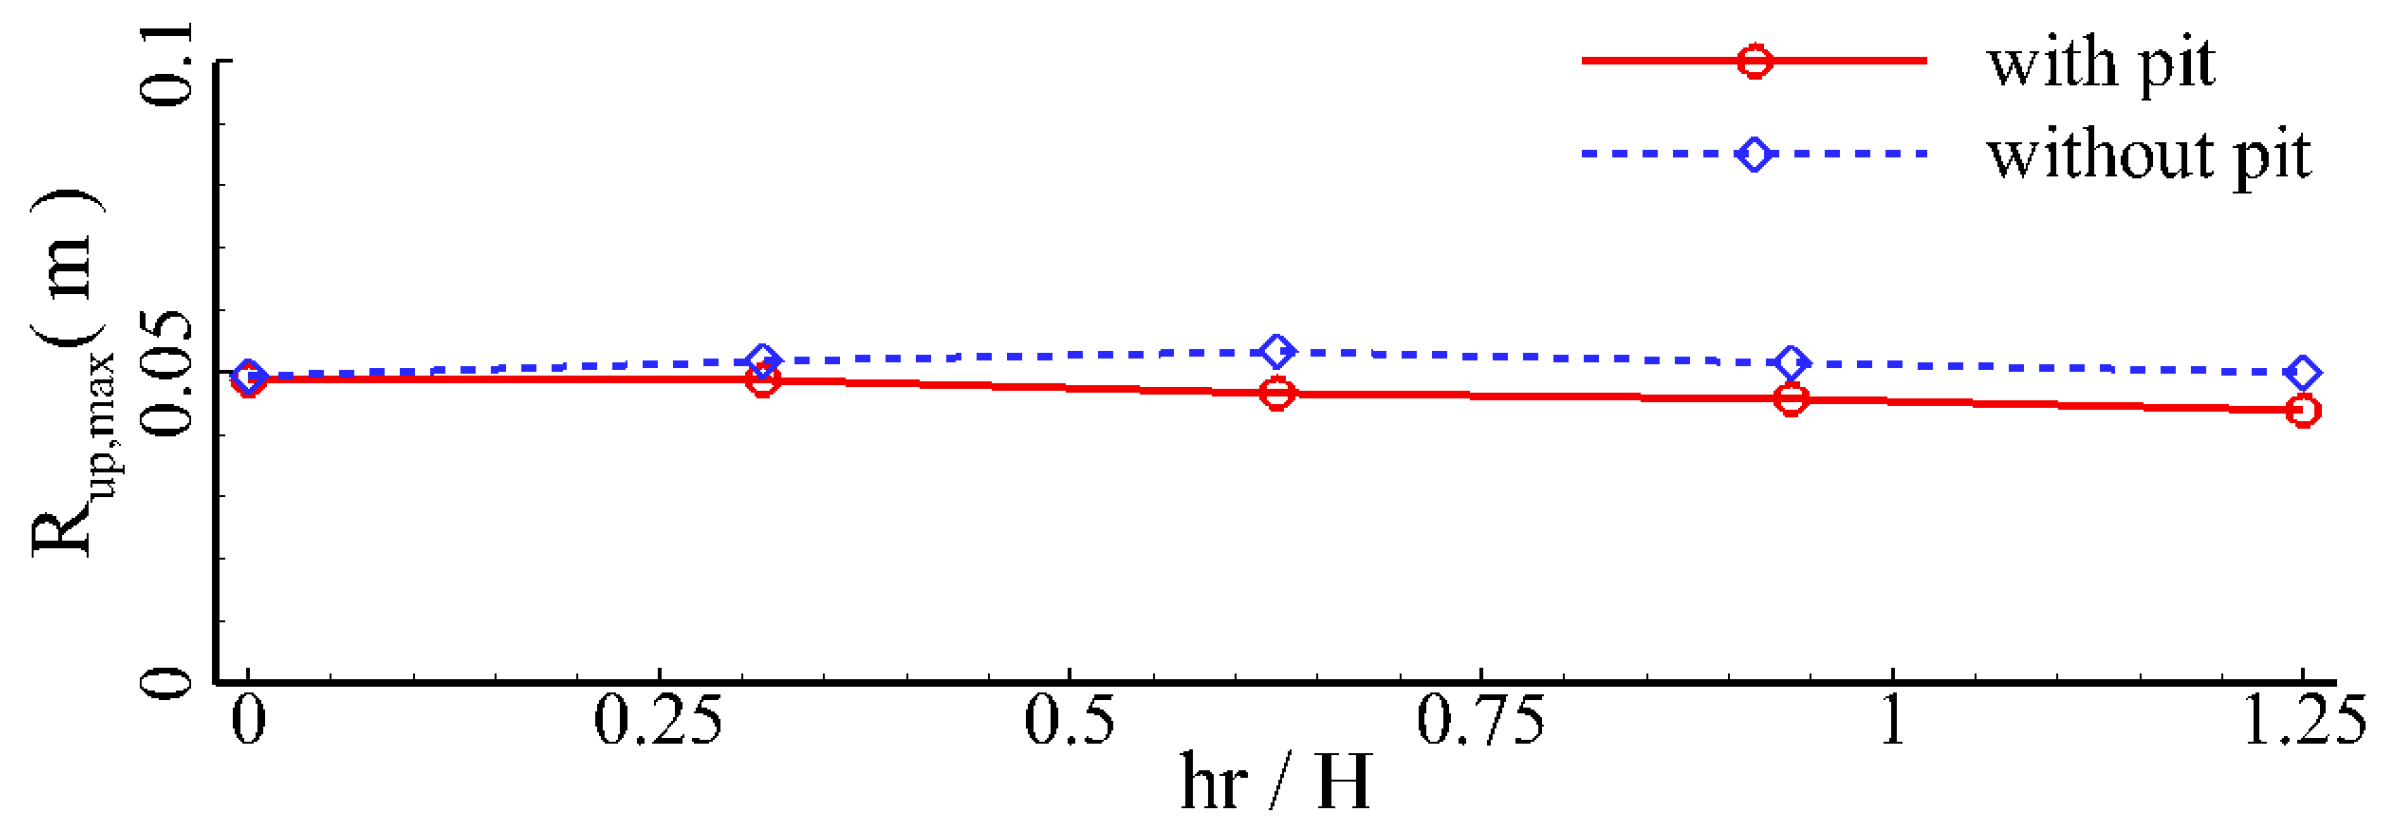
The artificial pit can impose additional blocking impacts on the breaking surge waves, which results in an increase in the wave reflection coefficient. The time-mean maximum of the wave runup height of regular waves at fringing reefs with an artificial pit can be somewhat increased. Meanwhile, the time-mean wave height around the artificial pit decreases. However, the artificial pit has negligible influences on the spatial distribution of the time-mean water level.
(2)
The decreasing range of time-mean wave height upstream of the artificial pit gradually grows with the wave height. Within the range of wave heights considered, the time-mean maximum of wave runup height at the fringing reef with the artificial pit is 13.3% lower on average than that at the reef without the pit. Only when the h r is relatively small can the artificial pit increase the wave setup to some extent. As the wave period gradually increases, the decreasing rate of the time-mean maximum of wave runup height at the fringing reef with the artificial pit increases as well, indicating that the artificial pit tends to have greater impact on the wave hydrodynamics of long waves.
(3)
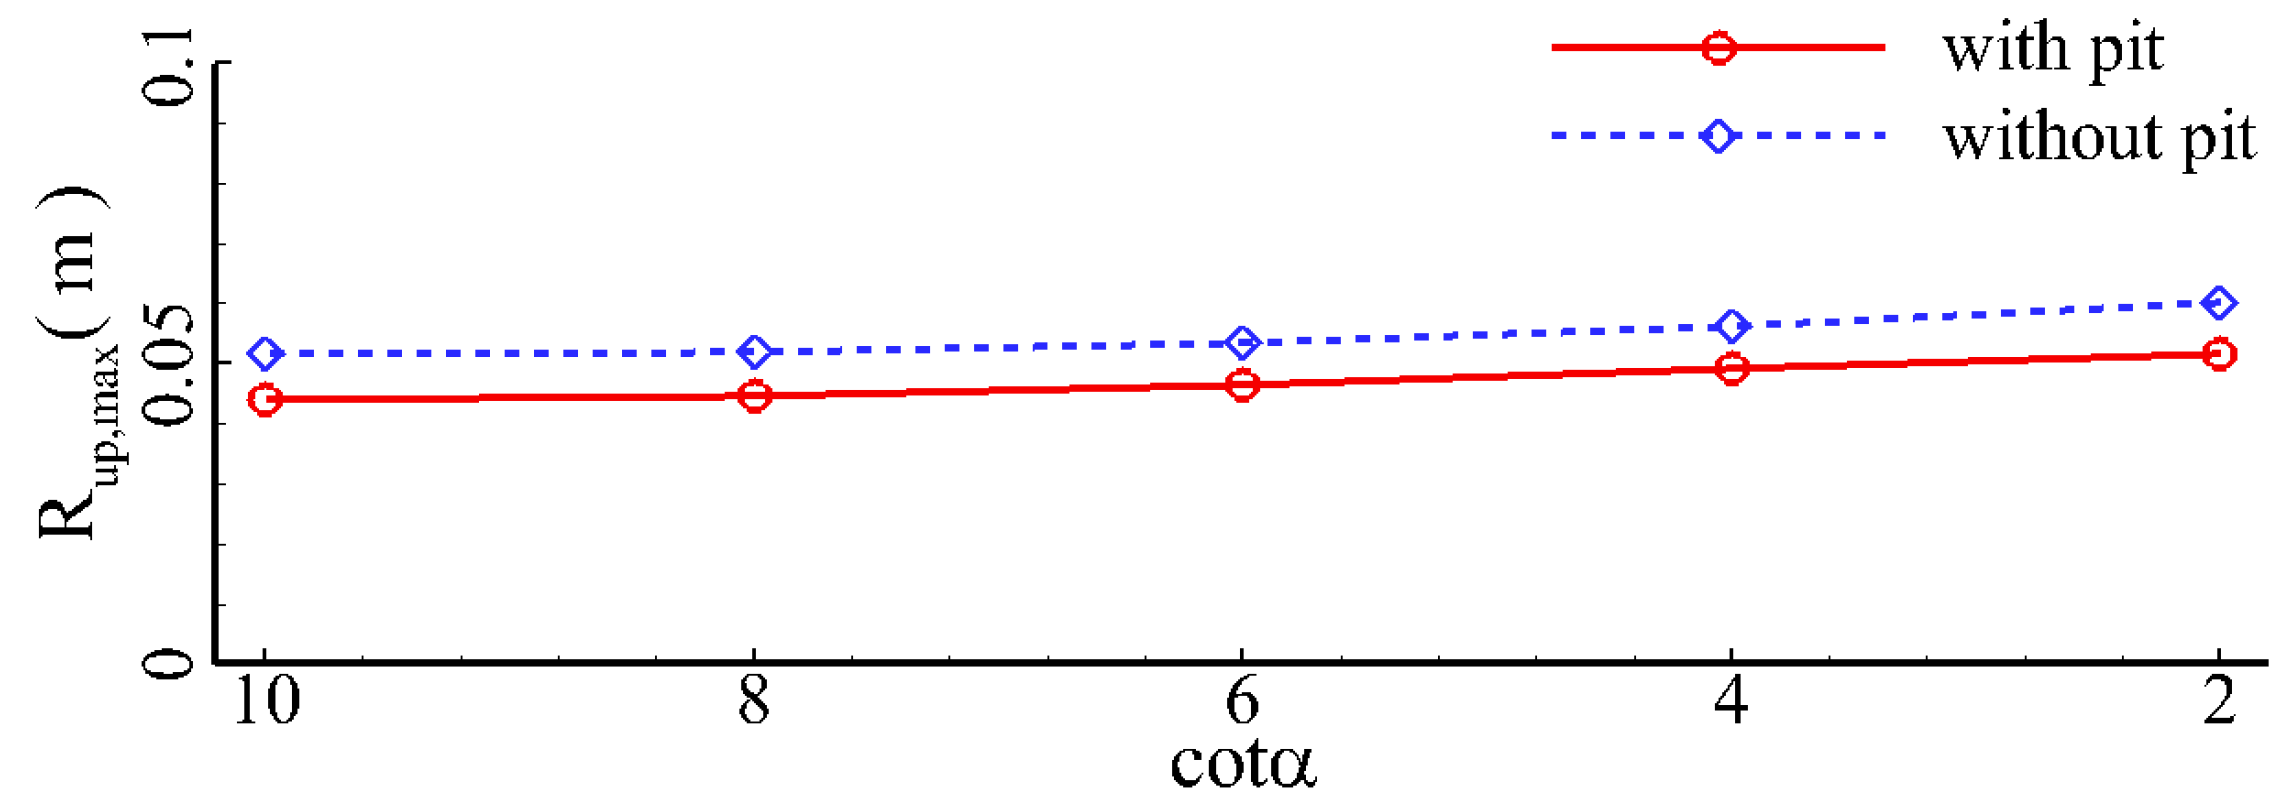
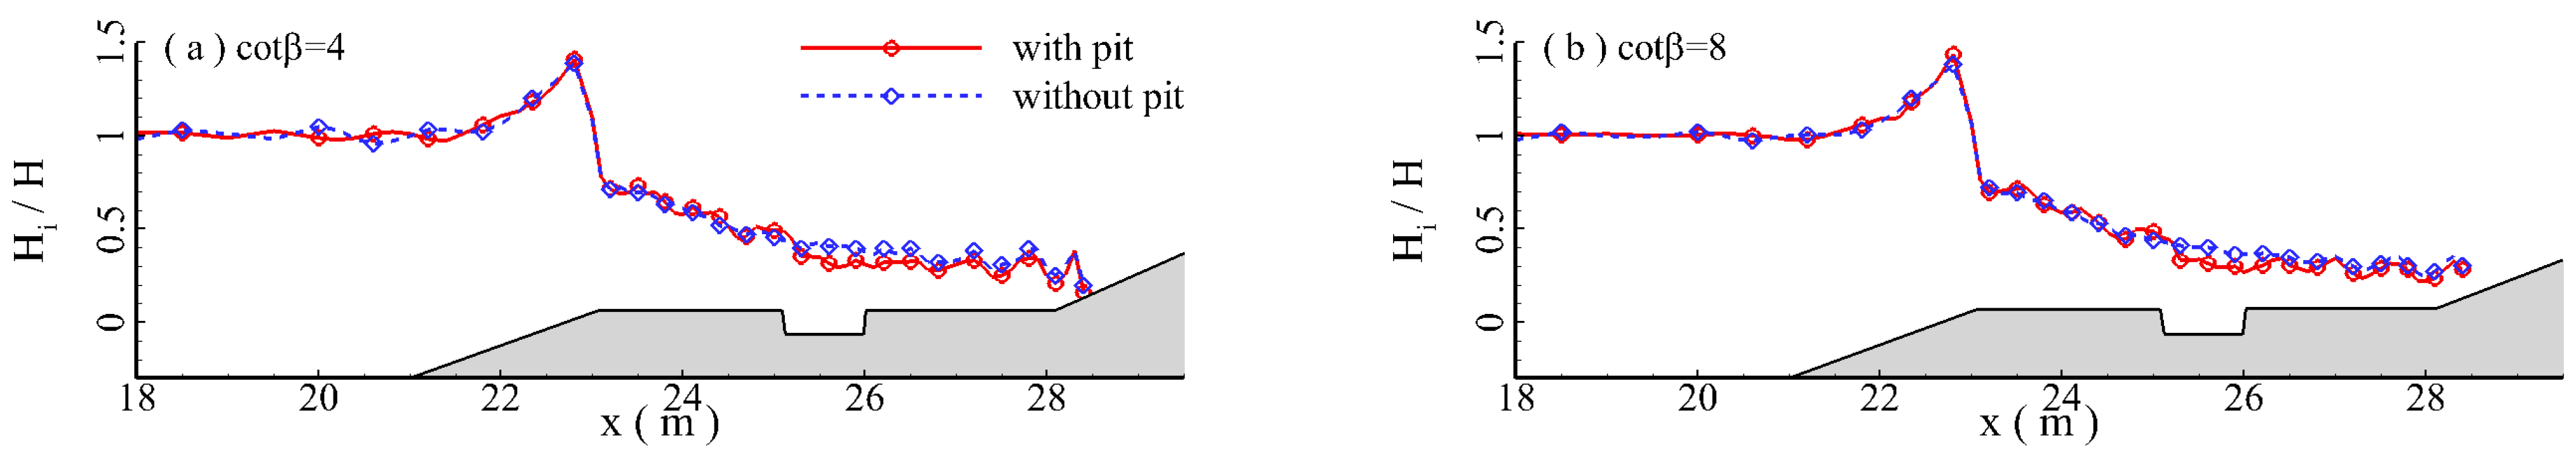
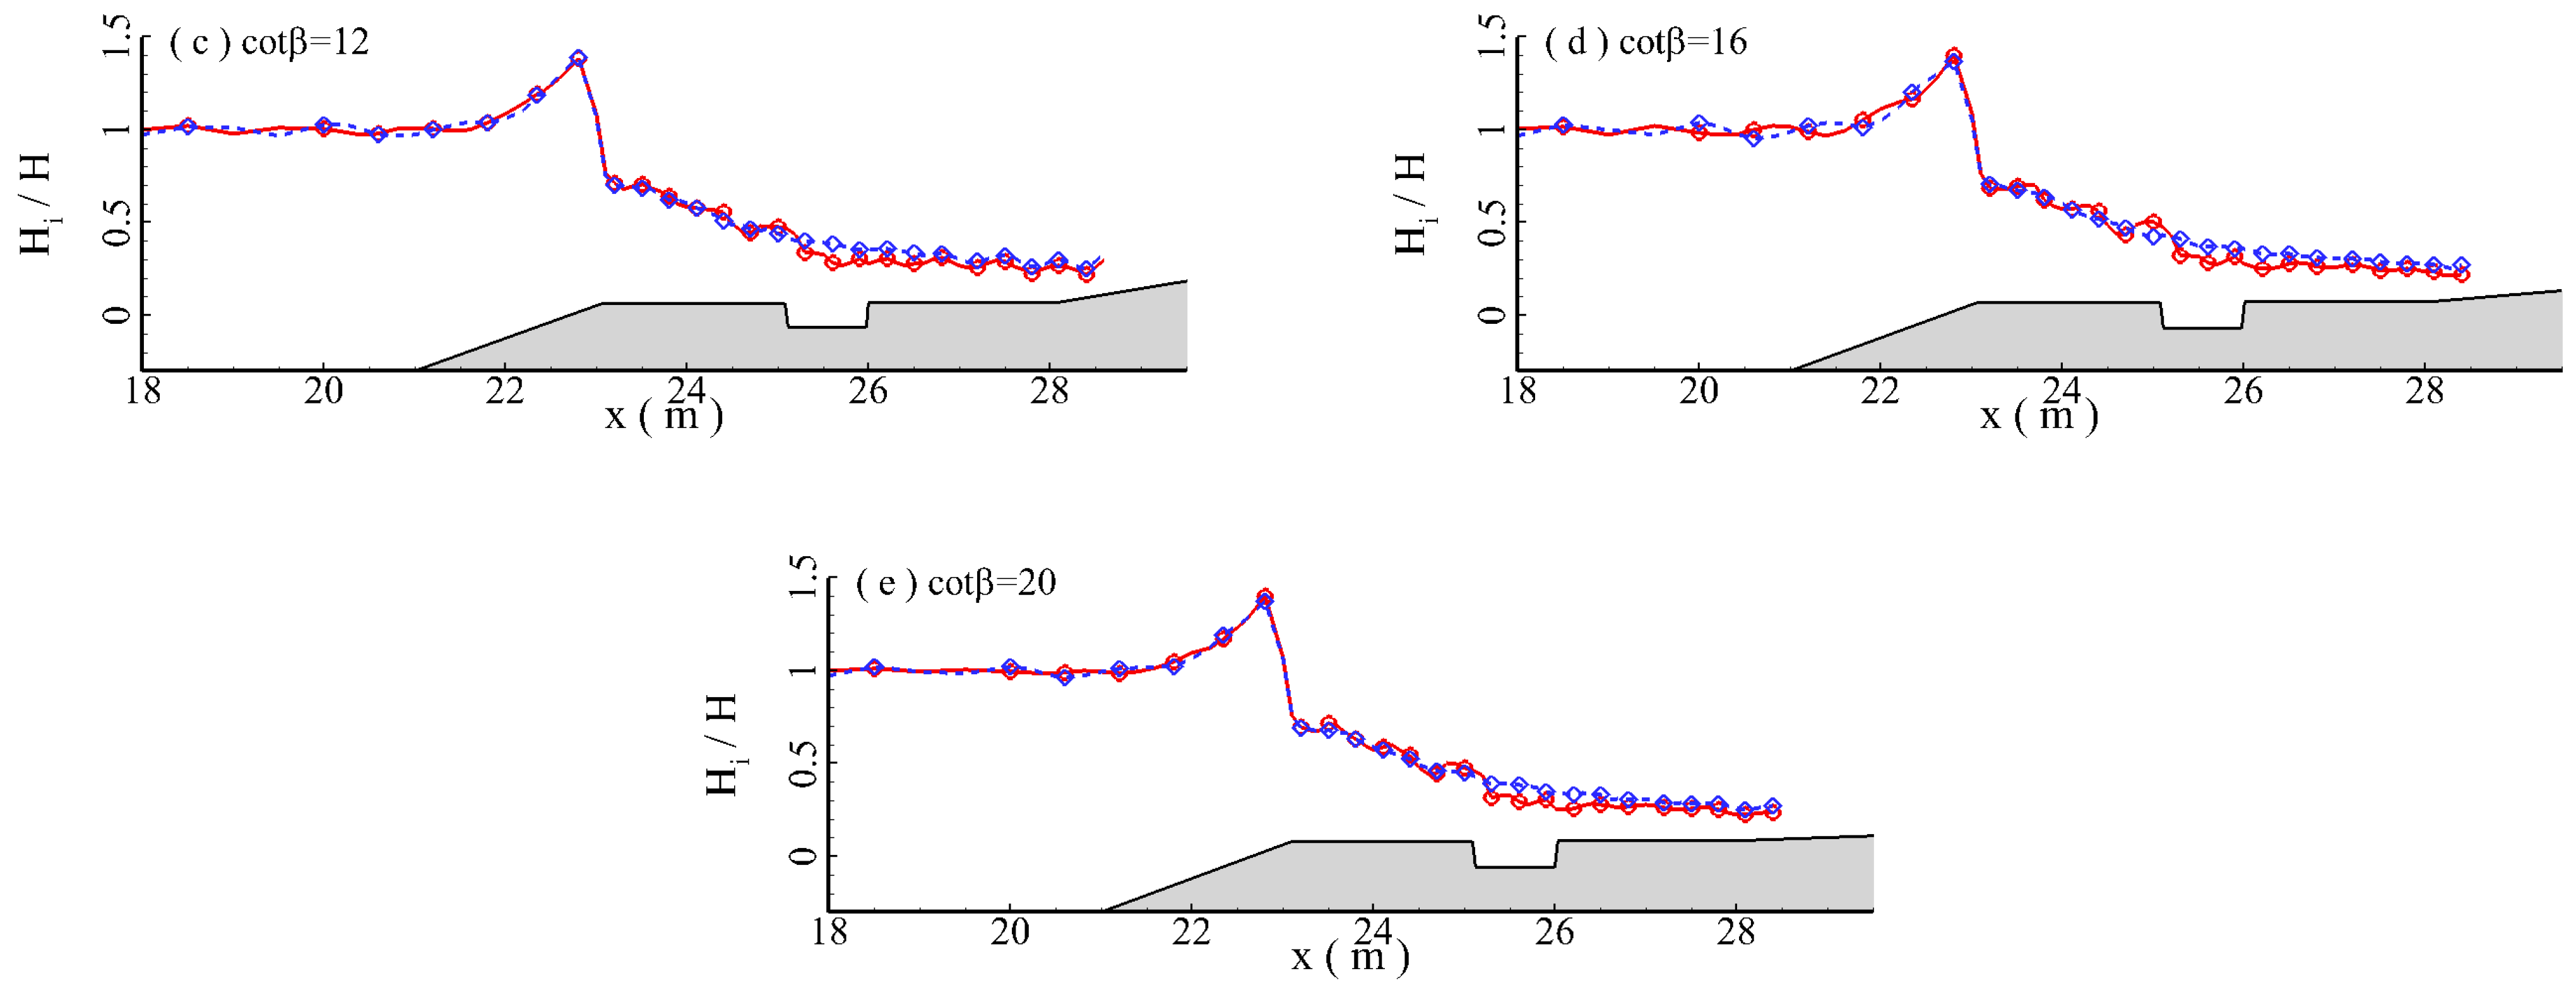
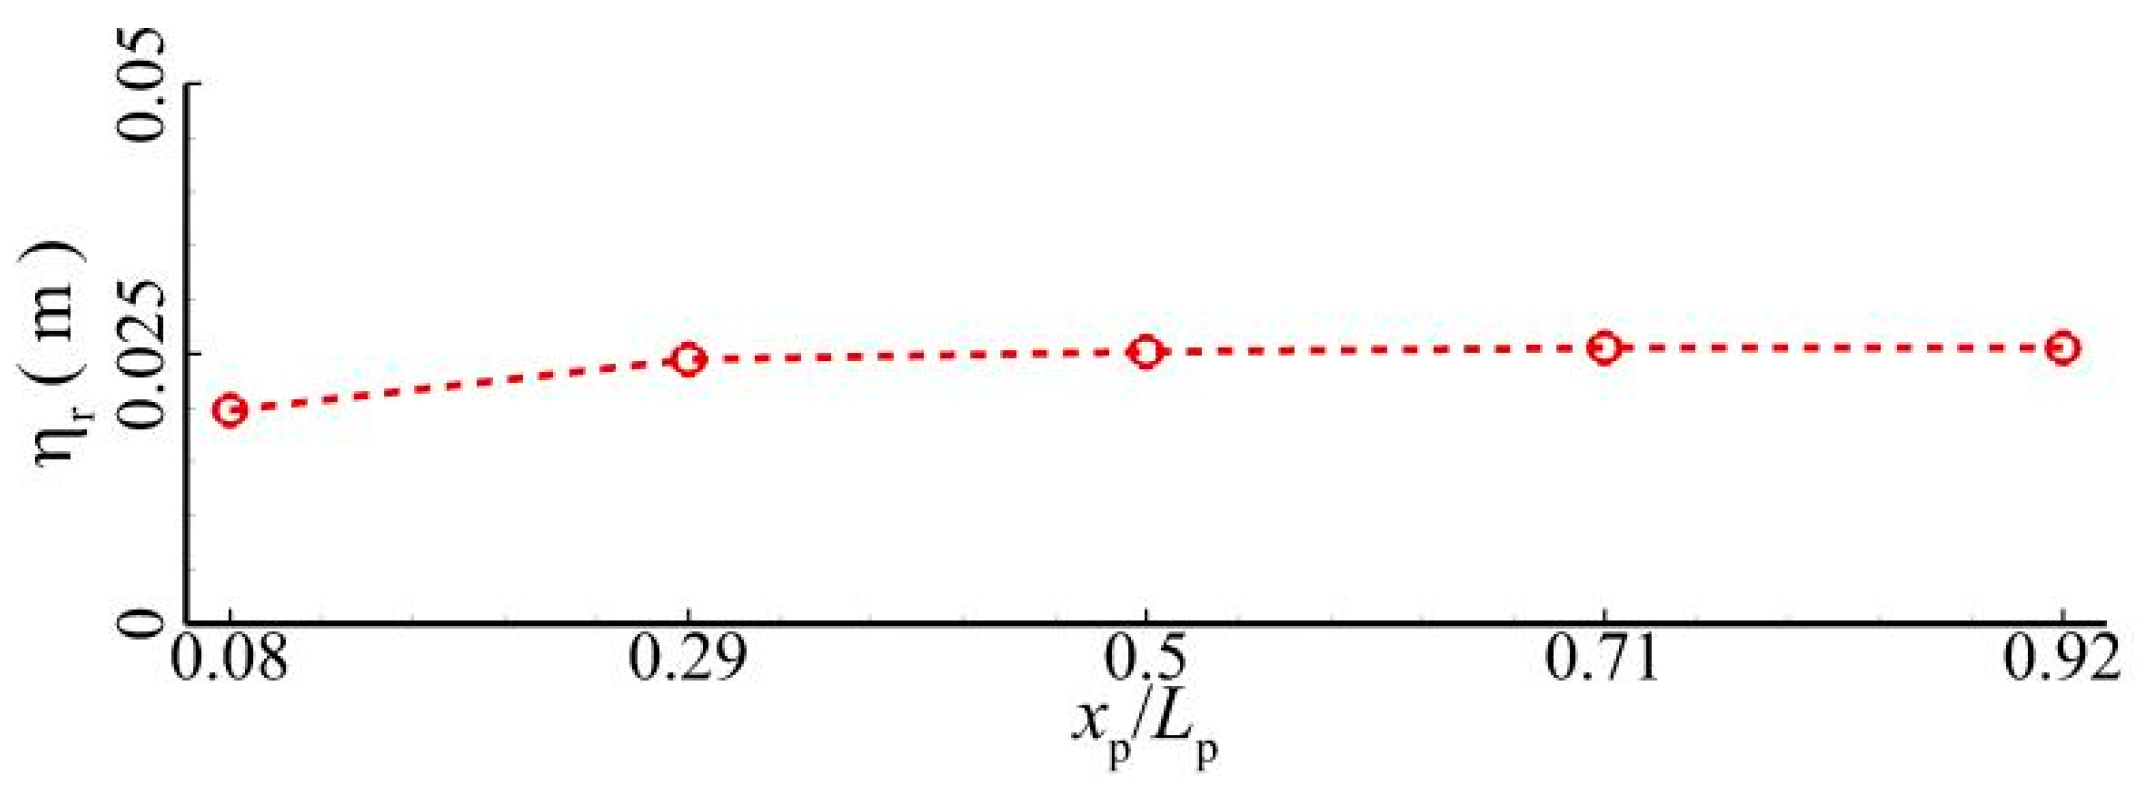
The influences of the artificial pit on the wave setup under different forereef slopes and backreef slopes can be ignored. When the forereef slope and backreef slope are relatively mild, the influences of the artificial pit on the wave reflection can become more apparent. Within the range of the forereef slopes and backreef slopes considered, the time-mean maximum of the wave runup heights of regular waves at the fringing reef with the artificial pit can be decreased by 13.5% and 12.5%, respectively. The distribution of time-mean wave height and wave reflection can be significantly impacted by the artificial pit when it is located at the reef edge. When the artificial pit is located at the reef edge, the time-mean wave height can be reduced significantly, and the wave reflection coefficient can be significantly increased. Once the artificial pit is moved downstream a little bit, the impact of the artificial pit on the hydrodynamics of the fringing reef becomes negligible.
(4)
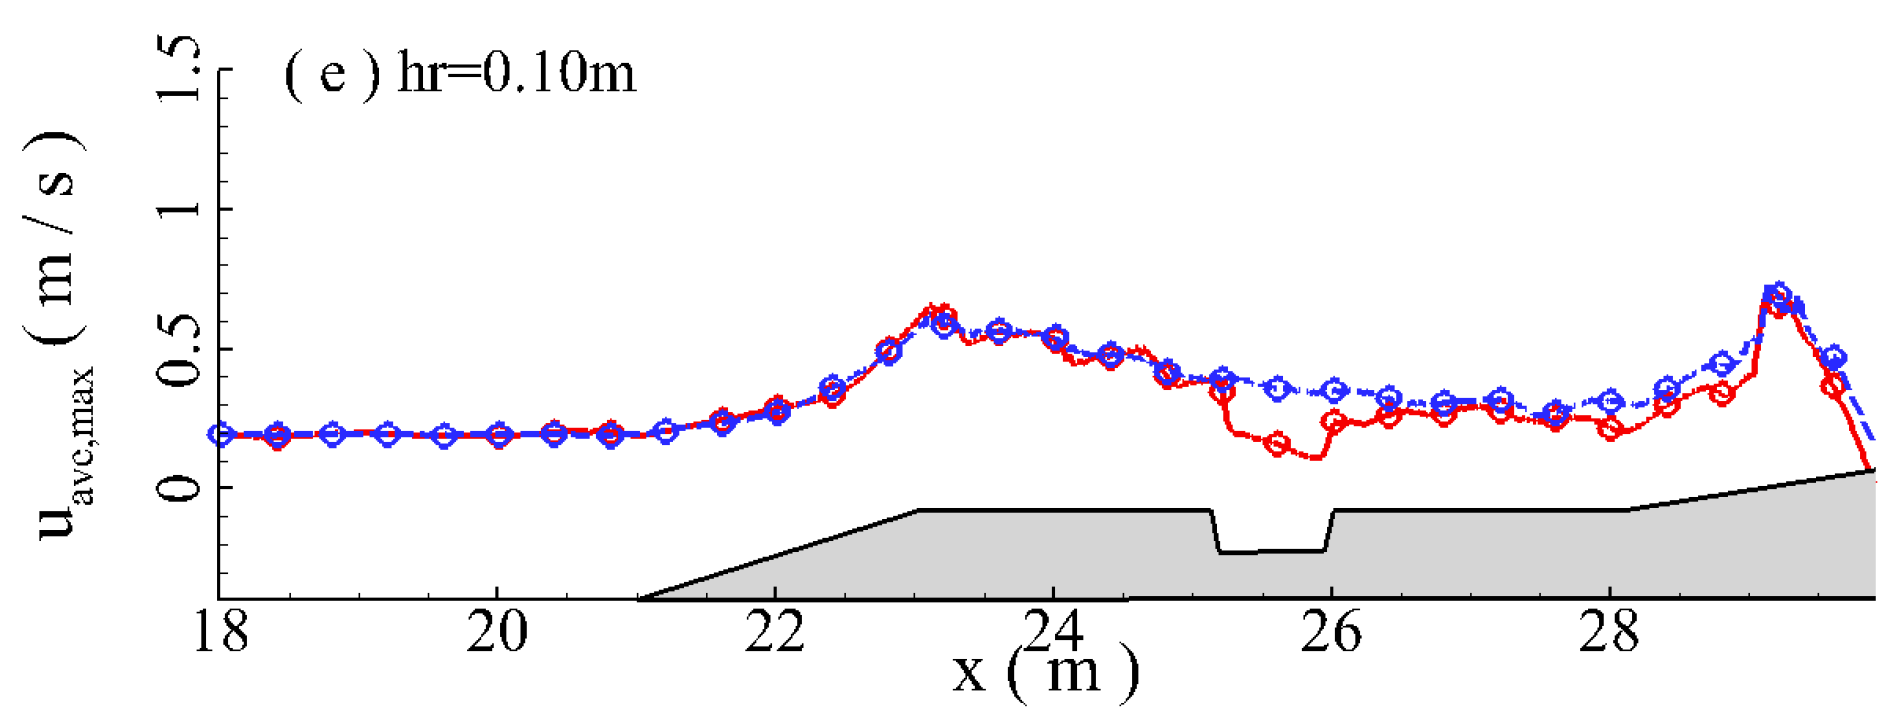
The geometric dimensions of the artificial pit have some influence on the hydrodynamics of the fringing reef. When the artificial pit is shallow, the artificial pit has limited influence on the spatial distribution of the time-mean wave height. The time-mean wave height can be reduced only a little bit at the central region of the artificial pit. As artificial pit depth increases gradually, the influence degree of the artificial pit depth on the space distribution of the time-mean wave height also gradually increases, and the influence range gradually increases as well. The same findings can also be applied for artificial pit width. Variations in the artificial pit depth and artificial pit width have very limited impact on the wave reflection coefficient and wave setup. Although the time-mean maximum of wave runup will somewhat decrease with artificial pit depth, a change in artificial pit width has no apparent impact on the time-mean maximum of wave runup height.

Author Contributions

Conceptualization was done by K.Q., X.W. and J.M.; methodology was done by K.Q. and R.G.; validation was done by K.Q., X.W. and J.L.; formal analysis was done by X.W., L.Z. and J.M.; writing was done by K.Q., X.W. and K.Q.; writing was done by K.Q. All authors have read and agreed to the published version of the manuscript.

Funding

This work is sponsored by the National Key Research and Development Program Project (# 2022YFC3103601), the National Natural Science Foundation of China (# 51839002) and Natural Science Foundation of Hunan Province, China (# 2021JJ20043). Partial support comes from the 2022 Graduate Research and Innovation Project at Changsha University of Science and Technology (# CXCLY2022071). We would especially like to thank the anonymous reviewers for their thorough reading of the article and insightful remarks.

Institutional Review Board Statement

Not applicable.

Informed Consent Statement

Not applicable.

Data Availability Statement

Not applicable.

Conflicts of Interest

The authors declare no conflict of interest.

References

  1. Gourlay, M.R. Wave set-up on coral reefs. 1. Set-up and wave-generated flow on an idealised two-dimensional reef. Coast. Eng. 1996, 27, 161–193. [Google Scholar] [CrossRef]
  2. Hardy, T.A.; Young, I.R. Field study of wave attenuation on an offshore coral reef. J. Geophys. Res. 1996, 101, 14311–14326. [Google Scholar] [CrossRef]
  3. Lowe, R.J.; Falter, J.L.; Bandet, M.D.; Pawlak, G.; Atkinson, M.J.; Monismith, S.G.; Koseff, J.R. Spectral wave dissipation over a barrier reef. J. Geophys. Res. Ocean. 2005, 110, C04001. [Google Scholar] [CrossRef]
  4. Fang, K.Z.; Xiao, L.; Liu, Z.B.; Sun, J.W.; Dong, P.; Wu, H. Experiment and RANS modeling of solitary wave impact on a vertical wall mounted on a reef-flat. Ocean Eng. 2022, 244, 110384. [Google Scholar] [CrossRef]
  5. Liu, Y.; Li, S.W.; Chen, S.G.; Hu, C.Y.; Fan, Z.F.; Jin, R.J. Random wave overtopping of vertical seawalls on coral reefs. Appl. Ocean. Res. 2020, 100, 102166. [Google Scholar] [CrossRef]
  6. Chen, S.G.; Yao, Y.; Guo, H.; Jia, M. Numerical investigation of monochromatic wave interaction with a vertical seawall located on a reef flat. Ocean Eng. 2020, 214, 107847. [Google Scholar] [CrossRef]
  7. Gao, Y.; Ren, L.; Wang, L. Experimental Investigation of Wave Propagation and Overtopping over Seawalls on a Reef Flat. J. Mar. Sci. Eng. 2023, 11, 836. [Google Scholar] [CrossRef]
  8. Ford, M.R.; Becker, J.M.; Merrifield, M.A. Reef-flat wave processes and excavation pits: Observations and implications for Majuro Atoll, Marshall Islands. J. Coast. Res. 2013, 29, 545–554. [Google Scholar] [CrossRef]
  9. Ford, M. Shoreline changes on an urban atoll in the central Pacific Ocean: Majuro Atoll, Marshall Islands. J. Coast. Res. 2012, 28, 11–22. [Google Scholar] [CrossRef]
  10. Liu, W.; Liu, Y.; Zhao, X. Numerical study of Bragg reflection of regular water waves over fringing reefs based on a Boussinesq model. Ocean Eng. 2019, 190, 106415. [Google Scholar] [CrossRef]
  11. Ning, Y.; Liu, W.; Zhao, X.; Zhang, Y.; Sun, Z. Study of irregular wave run-up over fringing reefs based on a shock-capturing Boussinesq model. Appl. Ocean Res. 2019, 84, 216–224. [Google Scholar] [CrossRef]
  12. Chen, H.; Jiang, D.; Tang, X.; Mao, H. Evolution of irregular wave shape over a fringing reef flat. Ocean Eng. 2019, 192, 106544. [Google Scholar] [CrossRef]
  13. Gao, J.L.; Zhou, X.J.; Li, Z.; Zang, J.; Chen, H.Z. Numerical investigation on effects of fringing reefs on low-frequency oscillations within a harbor. Ocean Eng. 2019, 172, 86–95. [Google Scholar] [CrossRef]
  14. Ye, J.; He, K.; Ji, P.S. Experimental study on stability of revetment breakwater built on reclaimed coral reef islands in South China Sea under extreme wave impact. Blasting 2019, 36, 13–23. [Google Scholar]
  15. Qu, K.; Men, J.; Wang, X.; Li, X.H. Numerical Investigation on Hydrodynamic Processes of Extreme Wave Groups on Fringing Reef. J. Mar. Sci. Eng. 2023, 11, 63. [Google Scholar] [CrossRef]
  16. Gao, J.; Ma, X.; Dong, G.; Zang, J.; Ma, Y.; Zhou, L. Effects of offshore fringing reefs on the transient harbor resonance excited by solitary waves. Ocean Eng. 2019, 190, 106422. [Google Scholar] [CrossRef]
  17. Young, I.R. Wave transformation over coral reefs. J. Geophys. Res. Ocean. 1989, 94, 9779–9789. [Google Scholar] [CrossRef]
  18. Roberts, H.H.; Murray, S.P.; Suhayda, J.N. Physical processes in fringing reef system. J. Mar. Res. 1975, 33, 233–260. [Google Scholar]
  19. Jago, O.; Kench, P.; Brander, R. Field observations of wave-driven water-level gradients across a coral reef flat. J. Geophys. Res. Ocean. 2007, 112. [Google Scholar] [CrossRef] [Green Version]
  20. Brander, R.W.; Kench, P.S.; Hart, D. Spatial and temporal variations in wave characteristics across a reef platform, warraber island, torres strait, Australia. Mar. Geol. 2004, 207, 169–184. [Google Scholar] [CrossRef]
  21. Lugo-Fernandez, A.; Roberts, H.; Wiseman, W., Jr.; Carter, B. Water level and currents of tidal and infragravity periods at tague reef, st. Croix (usvi). Coral Reefs 1998, 17, 343–349. [Google Scholar] [CrossRef]
  22. Lowe, R.J.; Falter, J.L.; Monismith, S.G.; Atkinson, M.J. Wave-driven circulation of a coastal reef–lagoon system. J. Phys. Oceanogr. 2009, 39, 873–893. [Google Scholar] [CrossRef]
  23. Kench, P.S.; Brander, R.W.; Parnell, K.E.; O’Callaghan, J.M. Seasonal variations in wave characteristics around a coral reef island, South Maalhosmadulu atoll, Maldives. Mar. Geol. 2009, 262, 116–129. [Google Scholar] [CrossRef]
  24. Duce, S.; Vila-Concejo, A.; McCarroll, R.J.; Yiu, B.; Perris, L.A.; Webster, J.M. Field measurements show rough fore reefs with spurs and grooves can dissipate more wave energy than the reef crest. Geomorphology 2022, 413, 108365. [Google Scholar] [CrossRef]
  25. Longuet-Higgins, M.S.; Stewart, R.W. Radiation stress in water waves, a physical discussion with applications. Deep-Sea Res. 1964, 11, 529–562. [Google Scholar]
  26. Munk, W.H.; Sargent, M.C. Adjustment of Bikini Atoll to ocean waves. Eos Trans. Am. Geophys. Union 1948, 29, 855–860. [Google Scholar] [CrossRef]
  27. Tait, R.J. Wave set-up on coral reefs. J. Geophys. Res. 1972, 77, 2207–2211. [Google Scholar] [CrossRef]
  28. Symonds, G.; Black, K.P.; Young, I.R. Wave-driven flow over shallow reefs. J. Geophys. Res. Ocean. 1995, 100, 2639–2648. [Google Scholar] [CrossRef] [Green Version]
  29. Gourlay, M.R.; Colleter, G. Wave-generated flow on coral reefs: An analysis for two-dimensional horizontal reef-flats with steep faces. Coast. Eng. 2005, 52, 353–387. [Google Scholar] [CrossRef]
  30. Astorga-Moar, A.; Baldock, T.E. Assessment and optimisation of runup formulae for beaches fronted by fringing reefs based on physical experiments. Coast. Eng. 2022, 176, 104163. [Google Scholar] [CrossRef]
  31. Seelig, W.N. Laboratory study of reef-lagoon system hydraulics. J. Waterw. Port Coast. Ocean Eng. 1983, 109, 380–391. [Google Scholar] [CrossRef]
  32. Betsy, R.; Seiffert, G.D.; Félicien, B. Simulation of breaking waves using the high-order spectral method with laboratory experiments: Wave-breaking onset. Ocean Model. 2017, 119, 1463–5003. [Google Scholar]
  33. Yao, Y.; He, W.R.; Du, R.C.; Jiang, C.B. Study on wave-induced setup over fringing reefs in the presence of a reef crest. Appl. Ocean Res. 2017, 66, 164–177. [Google Scholar] [CrossRef]
  34. Yao, Y.; Huang, Z.H.; He, W.R.; Monismith, S.G. Wave-induced setup and wave-driven current over quasi-2DH reef-lagoon-channel systems. Coast. Eng. 2018, 138, 113–125. [Google Scholar] [CrossRef]
  35. Yao, Y.; Lo, E.Y.; Huang, Z.H.; Monismith, S.G. An experimental study of wave-induced set-up over a horizontal reef with an idealized ridge. In Proceedings of the International Conference on Offshore Mechanics and Arctic Engineering, Honolulu, HI, USA, 31 May–5 June 2009; Volume 43468, pp. 383–389. [Google Scholar]
  36. Yao, Y.; Chen, X.J.; Xu, C.H.; Jia, M.J.; Jiang, C.B. Modeling solitary wave transformation and run-up over fringing reefs with large bottom roughness. Ocean Eng. 2020, 218, 108208. [Google Scholar] [CrossRef]
  37. Hwung, H.H.; Lin, Y.H.; Hsiao, S.C. The experimental study on infra-gravity wave. Ocean Eng. 2007, 34, 1481–1495. [Google Scholar] [CrossRef]
  38. Yao, Y.; Huang, Z.H.; Monismith, S.G.; Lo, E.Y. 1DH Boussinesq modeling of wave transformation over fringing reefs. Ocean Eng. 2012, 47, 30–42. [Google Scholar] [CrossRef]
  39. Buckley, M.L.; Lowe, R.J.; Hansen, J.E.; Van Dongeren, A.R. Wave setup over a fringing reef with large bottom roughness. J. Phys. Oceanogr. 2016, 46, 2317–2333. [Google Scholar] [CrossRef]
  40. Jiang, C.B.; Yang, Y.; Deng, B. Study on the nearshore evolution of regular waves under steady wind. Water 2020, 12, 686. [Google Scholar] [CrossRef] [Green Version]
  41. Torres-Freyermuth, A.; Mariño-Tapia, I.; Coronado, C.; Salles, P.; Medellín, G.; Pedrozo-Acuña, A.; Silva, R.; Candela, J.; Iglesias-Prieto, R. Wave-induced extreme water levels in the Puerto Morelos fringing reef lagoon. Nat. Hazards Earth Sys. 2012, 12, 3765–3773. [Google Scholar] [CrossRef] [Green Version]
  42. Rijnsdorp, D.P.; Buckley, M.L.; da Silva, R.F.; Cuttler, M.V.; Hansen, J.E.; Lowe, R.J.; Green, R.H.; Storlazzi, C.D. A numerical study of wave-driven mean flows and setup dynamics at a coral reef-lagoon system. J. Geophys. Res. Ocean. 2021, 126, e2020JC016811. [Google Scholar] [CrossRef]
  43. Wang, W.; Pákozdi, C.; Kamath, A.; Fouques, S.; Bihs, H. A flexible fully nonlinear potential flow model for wave propagation over the complex topography of the Norwegian coast. Appl. Ocean Res. 2022, 122, 103103. [Google Scholar] [CrossRef]
  44. Ma, G.F.; Shi, F.Y.; Kirby, J.T. Shock-capturing non-hydrostatic model for fully dispersive surface wave processes. Ocean Model. 2012, 43, 22–35. [Google Scholar] [CrossRef]
  45. Qu, K.; Lie, Y.C.; Wang, X.; Li, X.H. Numerical Analysis on Influences of Emergent Vegetation Patch on Runup Processes of Focused Wave Groups. J. Mar. Sci. Eng. 2022, 11, 8. [Google Scholar] [CrossRef]
  46. Qu, K.; Huang, J.X.; Yao, Y.; Guo, L.; Wang, X.; Li, X.H.; Jiang, C.B. Numerical investigation of effects of artificial excavation pit on transformation and runup processes of tsunami-like wave over fringing reef. Ocean Eng. 2023, 270, 113553. [Google Scholar] [CrossRef]
  47. Wen, H.J.; Ren, B.; Dong, P.; Zhu, G.C. Numerical analysis of wave-induced current within the inhomogeneous coral reef using a refined SPH model. Coast. Eng. 2020, 156, 103616. [Google Scholar] [CrossRef]
  48. Qu, K.; Zhang, L.B.; Yao, Y.; Jiang, C.B. Numerical evaluation of influences of onshore wind on overtopping characteristics of coastal seawall under solitary wave. Ocean Eng. 2022, 266, 112860. [Google Scholar] [CrossRef]
  49. Qu, K.; Liu, T.W.; Chen, L.; Yao, Y.; Kraatz, S.; Huang, J.X. Study on transformation and runup processes of tsunami-like wave over permeable fringing reef using a nonhydrostatic numerical wave model. Ocean Eng. 2022, 243, 110228. [Google Scholar] [CrossRef]
  50. Chen, S.G.; Zhang, H.Q.; Chen, H.B.; Zheng, J.H. Experimental study on the propagation of irregular waves on a coral reef on a dike in a large water tank. Mar. Bull. 2018, 37, 576–582. [Google Scholar]
  51. Yao, Y.; Becker, J.M.; Ford, M.R.; Merrifield, M.A. Modeling wave processes over fringing reefs with an excavation pit. Coast. Eng. 2016, 109, 9–19. [Google Scholar] [CrossRef] [Green Version]
  52. Yao, Y.; Jia, M.J.; Jiang, C.B.; Zhang, Q.M.; Tang, Z.J. Laboratory study of wave processes over fringing reefs with a reef-flat excavation pit. Coast. Eng. 2020, 158, 103700. [Google Scholar] [CrossRef]
  53. Klaver, S.; Nederhoff, C.M.; Giardino, A.; Tissier, M.F.S.; Van Dongeren, A.R.; van der Spek, A.J.F. Impact of coral reef mining pits on nearshore hydrodynamics and wave runup during extreme wave events. J. Geophys. Res. Ocean. 2019, 124, 2824–2841. [Google Scholar] [CrossRef] [Green Version]
  54. Rodi, W. Examples of calculation methods for flow and mixing in stratified fluids. J. Geophys. Res. Ocean. 1987, 92, 5305–5328. [Google Scholar] [CrossRef]
  55. Ma, G.F.; Kirby, J.T.; Shi, F.Y. Numerical simulation of tsunami waves generated by deformable submarine landslides. Ocean Model. 2013, 69, 146–165. [Google Scholar] [CrossRef]
  56. Jonathan, D.N.; Matthew, H.A.; Eric, K. Estimating Internal Wave Energy Fluxes in the Ocean. J. Atmos. Ocean. Technol. 2005, 22, 1551–1570. [Google Scholar]
  57. Willmott, C.J. On the validation of models. Phys. Geogr. 1981, 2, 184–194. [Google Scholar] [CrossRef]
Figure 1. Computational layout.
Jmse 11 01464 g001
Figure 2. Water surface elevations at different positions (Run 1).
Jmse 11 01464 g002
Figure 3. Water surface elevations at different positions (Run 2).
Jmse 11 01464 g003
Figure 4. Spatial distributions of the time-mean wave height and time-mean water level ( M W L ) (Run 1).
Jmse 11 01464 g004
Figure 5. Spatial distributions of the time-mean wave height and time-mean water level ( M W L ) (Run 2).
Jmse 11 01464 g005
Figure 6. Computational configuration.
Jmse 11 01464 g006
Figure 7. Velocity contours of the water body at different time moments; left side: fringing reef without pit; right side: fringing reef with pit.
Jmse 11 01464 g007aJmse 11 01464 g007b
Figure 8. Time series of the water elevation at different locations.
Jmse 11 01464 g008
Figure 9. Spatial distributions of the time-mean wave height and time-mean water level; (a) time-mean wave height; (b) time-mean water level.
Jmse 11 01464 g009
Figure 10. Time series of the energy flux at different locations.
Jmse 11 01464 g010
Figure 11. Spatial distribution of the maximum depth-averaged velocity.
Jmse 11 01464 g011
Figure 12. Time series of the wave runup height.
Jmse 11 01464 g012
Figure 13. Spatial distribution of the time-mean wave height versus wave height.
Jmse 11 01464 g013aJmse 11 01464 g013b
Figure 14. Wave setup versus wave height.
Jmse 11 01464 g014
Figure 15. Wave reflection coefficient versus wave height.
Jmse 11 01464 g015
Figure 16. Time-mean maximum of wave runup height versus wave height.
Jmse 11 01464 g016
Figure 17. Spatial distribution of the time-mean wave height versus submergence water depth.
Jmse 11 01464 g017aJmse 11 01464 g017b
Figure 18. Spatial distribution of the time-mean water level versus submergence water depth.
Jmse 11 01464 g018
Figure 19. Wave setup versus submergence water depth.
Jmse 11 01464 g019
Figure 20. Spatial distribution of the maximum depth-averaged velocity versus submergence water depth.
Jmse 11 01464 g020aJmse 11 01464 g020b
Figure 21. Wave reflection coefficient versus submergence water depth.
Jmse 11 01464 g021
Figure 22. Time-mean maximum of wave runup height versus submergence water depth.
Jmse 11 01464 g022
Figure 23. Space distribution of the time-mean wave height versus wave period.
Jmse 11 01464 g023
Figure 24. Wave setup versus wave period.
Jmse 11 01464 g024
Figure 25. Wave reflection coefficient versus wave period.
Jmse 11 01464 g025
Figure 26. Time-mean maximum of wave runup height versus wave period.
Jmse 11 01464 g026
Figure 27. Space distribution of the time-mean wave height versus reef-flat length.
Jmse 11 01464 g027aJmse 11 01464 g027b
Figure 28. Wave setup versus reef-flat length.
Jmse 11 01464 g028
Figure 29. Wave reflection coefficient versus reef-flat length.
Jmse 11 01464 g029
Figure 30. Time-mean maximum of wave runup height versus reef-flat length.
Jmse 11 01464 g030
Figure 31. Space distribution of the time-mean wave height versus forereef slope.
Jmse 11 01464 g031
Figure 32. Wave setup versus forereef slope.
Jmse 11 01464 g032
Figure 33. Changes of wave reflection coefficient with forereef slope.
Jmse 11 01464 g033
Figure 34. Time-mean maximum of wave runup height versus forereef slope.
Jmse 11 01464 g034
Figure 35. Space distribution of time-mean wave height versus backreef slope.
Jmse 11 01464 g035aJmse 11 01464 g035b
Figure 36. Wave setup versus backreef slope.
Jmse 11 01464 g036
Figure 37. Wave reflection coefficient versus backreef slope.
Jmse 11 01464 g037
Figure 38. Time-mean maximum of wave runup height versus backreef slope.
Jmse 11 01464 g038
Figure 39. Space distribution of the time-mean wave height versus pit center location.
Jmse 11 01464 g039
Figure 40. Space distribution of the time-mean water level versus pit center location.
Jmse 11 01464 g040
Figure 41. Wave setup versus pit center location.
Jmse 11 01464 g041
Figure 42. Change in wave reflection coefficient with pit center location.
Jmse 11 01464 g042
Figure 43. Time-mean maximum of wave runup height versus pit center location.
Jmse 11 01464 g043
Figure 44. Space distribution of time-mean wave height versus pit depths.
Jmse 11 01464 g044
Figure 45. Wave setup versus pit depth.
Jmse 11 01464 g045
Figure 46. Wave reflection coefficient versus pit depth.
Jmse 11 01464 g046
Figure 47. Time-mean maximum of wave runup height versus pit depth.
Jmse 11 01464 g047
Figure 48. Space distribution of time-mean wave height versus pit widths.
Jmse 11 01464 g048
Figure 49. Wave setup versus pit width.
Jmse 11 01464 g049
Figure 50. Change in wave reflection coefficient with pit width.
Jmse 11 01464 g050
Figure 51. Time-mean maximum of wave runup height versus pit width.
Jmse 11 01464 g051
Table 1. Parameters setup.
Run H ( m ) h r ( m ) T ( s )
10.1010.001.0
20.0950.101.25
Table 2. Positions of the wave gauges (unit: m).
CaseG1G2G3G4G5G6G7G8G9G10G11G12
1−4.35−4.10.952.002.352.652.953.253.655.256.958.75
2−4.35−4.10.651.252.002.352.753.153.655.256.958.75
Table 3. Parameter setups for all computational runs.
Run H   ( m ) h r   ( m ) T   ( s ) L p   ( m ) c o t α c o t β x p   ( m ) H p   ( m ) W p   ( m )
10.040.051.556122.50.20.8
20.060.051.556122.50.20.8
30.080.051.556122.50.20.8
40.100.051.556122.50.20.8
50.120.051.556122.50.20.8
60.0801.556122.50.20.8
70.080.0251.556122.50.20.8
80.080.0751.556122.50.20.8
90.080.101.556122.50.20.8
100.080.051.056122.50.20.8
110.080.051.2556122.50.20.8
120.080.051.7556122.50.20.8
130.080.052.056122.50.20.8
140.080.051.53.46121.70.20.8
150.080.051.54.26122.10.20.8
160.080.051.55.86122.90.20.8
170.080.051.56.66123.30.20.8
180.080.051.552122.50.20.8
190.080.051.554122.50.20.8
200.080.051.558122.50.20.8
210.080.051.5510122.50.20.8
220.080.051.55642.50.20.8
230.080.051.55682.50.20.8
240.080.051.556162.50.20.8
250.080.051.556202.50.20.8
260.080.051.556120.40.20.8
270.080.051.556121.450.20.8
280.080.051.556123.550.20.8
290.080.051.556124.60.20.8
300.080.051.556122.50.10.8
310.080.051.556122.50.150.8
320.080.051.556122.50.250.8
330.080.051.556122.50.30.8
340.080.051.556122.50.20.4
350.080.051.556122.50.20.6
360.080.051.556122.50.21.0
370.080.051.556122.50.21.2
Disclaimer/Publisher’s Note: The statements, opinions and data contained in all publications are solely those of the individual author(s) and contributor(s) and not of MDPI and/or the editor(s). MDPI and/or the editor(s) disclaim responsibility for any injury to people or property resulting from any ideas, methods, instructions or products referred to in the content.

