Article

Properties and Model of a Lacustrine Shale Oil Reservoir: A Case Study of the Upper Fourth Member and Lower Third Member of the Shahejie Formation in Dongying Sag and Zhanhua Sag, Jiyang Depression

1
School of Geosciences, China University of Petroleum (East China), Qingdao 266580, China
2
No. 5 Oil Production Plant, Dagang Oilfield Company of CNPC, Tianjin 300280, China
3
Shengli Oilfield Company of SINOPEC, Dongying 257015, China
4
No. 3 Oil Production Plant, Daqing Oilfield CompanyLimited, Daqing 163453, China
*
Author to whom correspondence should be addressed.
J. Mar. Sci. Eng. 2023, 11(7), 1441; https://doi.org/10.3390/jmse11071441
Submission received: 31 May 2023 / Revised: 13 July 2023 / Accepted: 14 July 2023 / Published: 19 July 2023
(This article belongs to the Special Issue High-Efficient Exploration and Development of Oil & Gas from Ocean)

Abstract

:
By combining thermal simulation experiments with core data, thin sections, scanning electron microscopy (SEM), source rock, and high-pressure mercury and gas adsorption analysis, this paper evaluates the properties and models of shale reservoirs in the upper fourth member and the lower third member of the Shahejie Formation in Dongying Sag and Zhanhua Sag. The results show that the oil shale is a high-quality source rock with petroleum generation potential. Inorganic mineral pores, organic pores, and fractures have developed with petroleum storage capacity. Clay and organic-rich soft shale lithofacies are interbedded with carbonate-rich hard shale lithofacies to form sandwich-type source–reservoir–caprock assemblages with internal sealing properties. Bitumen occurs mostly in the free state, and to a lesser extent is adsorbed, and shows flow characteristics. The migration resistance of the bitumen is displacement pressure, including capillary force and adsorption resistance, and the main force is pore fluid pressure. The migration modes of the bitumen include both subcritical flow and instantaneous flow, which are controlled by pore fluid pressure, displacement pressure, and the rock’s fracture strength. Owing to the multi-scale characteristics of the shale reservoir space, a vein-type model of a multi-scale progressive transport network is developed that obeys Murray’s law with a dominant migration pathway in the shale reservoir. The shale oil reservoir is a special lithologic reservoir controlled by the sedimentary environment and has self-generation, self-storage, and self-sealing characteristics with developed pore fluid overpressure and a multi-scale transport network.

1. Introduction

Owing to increased difficulties in the exploration and production of conventional reservoirs in China, unconventional reservoirs have gained increasing attention. Abundant lacustrine shales developed in the Cenozoic in China [1,2], and these shales have become an important unconventional oil and gas resource [3,4,5]. Some oil has been produced from lacustrine shales in the Jiyang Depression and Cangdong Depression of the Bohai Bay Basin [6,7,8], the Biyang Depression [9,10], the Songliao Basin [11,12], the Santanghu Basin [13,14,15] and the Jimusar Depression of the Junggar Basin [16,17].
Lacustrine shale is commonly rich in type I kerogen, which makes it an excellent source rock [18,19,20]. Shales are characterized by abundant organic matter with nano-scale pores and pore throats. Shale oil consists of hydrocarbons that exist in pores in free, adsorbed, and dissolved states. Furthermore, like all fine-grained rocks, lacustrine shales have good sealing capacities for oil and gas [21]. In order to characterize the pore structure of shales, a series of advanced technologies has been introduced based on microscopy, including high-resolution field emission scanning electron microscopy (FE-SEM), atomic force microscopy (AFM), small-angle and ultra-small-angle neutron scattering (SANS and USANS, respectively), and transmission electron microscopy (TEM) [22,23,24,25,26,27]. For three-dimensional non-destructive observation of shale pores, X-ray microscopy and computed tomography (CT), nano-CT, and focused ion beam (FIB)-SEM have been used [28,29]. In addition, the 3D distribution of the various rock components and pores can be obtained by a digital core technique that combines energy dispersive spectroscopy (EDS) with backscattered electron imaging (BEI) [30,31,32]. These technologies have shown that the pore structure of lacustrine shale reservoir rock consists of multi-scale pore throats and fractures [33].
Controlled by the geometry and topological characteristics of the pore structure, oil and gas follows the multi-scale seepage law in shale reservoirs [34,35]. The pore throat size is a key factor in controlling the migration of oil and gas. When the pore throat diameter is ~5 nm, the migration of oil and gas is dominated by desorption and diffusion; at ~50 nm, it is dominated by diffusion-slip flow and low-speed non-Darcy flow [36]. Mathematical methods and numerical simulation have been used [37,38] for migration analysis after direct observation using SEM or CT of the generation, migration and accumulation of oil droplets in shale samples in thermal simulation experiments [39,40].
Owing to a lack of economically successful examples of lacustrine shale oil reservoirs, continuous lacustrine reservoir models have been established by analogy with properties of marine shale reservoirs, such as the Bakken Shale, Spraberry–Wolfcamp Shale, Eagle Ford Shale, Niobrara Shale, and Utica Shale in North America [13,41,42,43,44]. However, compared with marine shales which cover large areas with relatively consistent properties, lacustrine shales tend to cover small areas and undergo rapid lithofacies change [45,46]. This suggests that a marine shale oil reservoir model is not suitable for most lacustrine shale oil reservoirs because it neglects the strong lateral and vertical heterogeneity of lacustrine shale reservoirs and leads to optimistic resource evaluation and hence exploration failure. In addition, the production characteristics of lacustrine shale reservoirs, such as low initial production, fast production decline, and low recovery, highlight the inadequacy of the marine reservoir model. According to public reports, the recovery of marine shale oil in North America is low, generally at 5–10%, including 2–20% in the Bakken Shale, 8–15% in the Spraberry–Wolfcamp Shale, 6% in the Eagle Ford Shale, and 3% in the Utica Shale. Lacustrine shale oil reservoirs in China have even lower initial production, faster production decline, and lower total recovery. For example, the Paleogene Shahejie Formation in the Bohai Bay Basin and the Triassic Yanchang Formation in the Ordos Basin have less than 5% recovery, which is similar to the Eagle Ford Shale and Utica Shale. Thus, there is a need for further work on lacustrine shales as unconventional reservoirs.
In this study, we used core samples from the upper fourth member and the lower third member of the Shahejie Formation shale oil reservoir from the Dongying Sag and Zhanhua Sag in Jiyang Depression as an example of an unconventional lacustrine system. Core samples were analyzed by systematic testing technology combined with thermal simulation experiments. We report on the properties of the source–reservoir–caprock system and hydrocarbon migration within it, analyze the control of the lacustrine environment on the accumulation of the shale oil and finally build a lacustrine shale oil model. Finally, we offer guidance on the exploration and production of lacustrine shale oil.

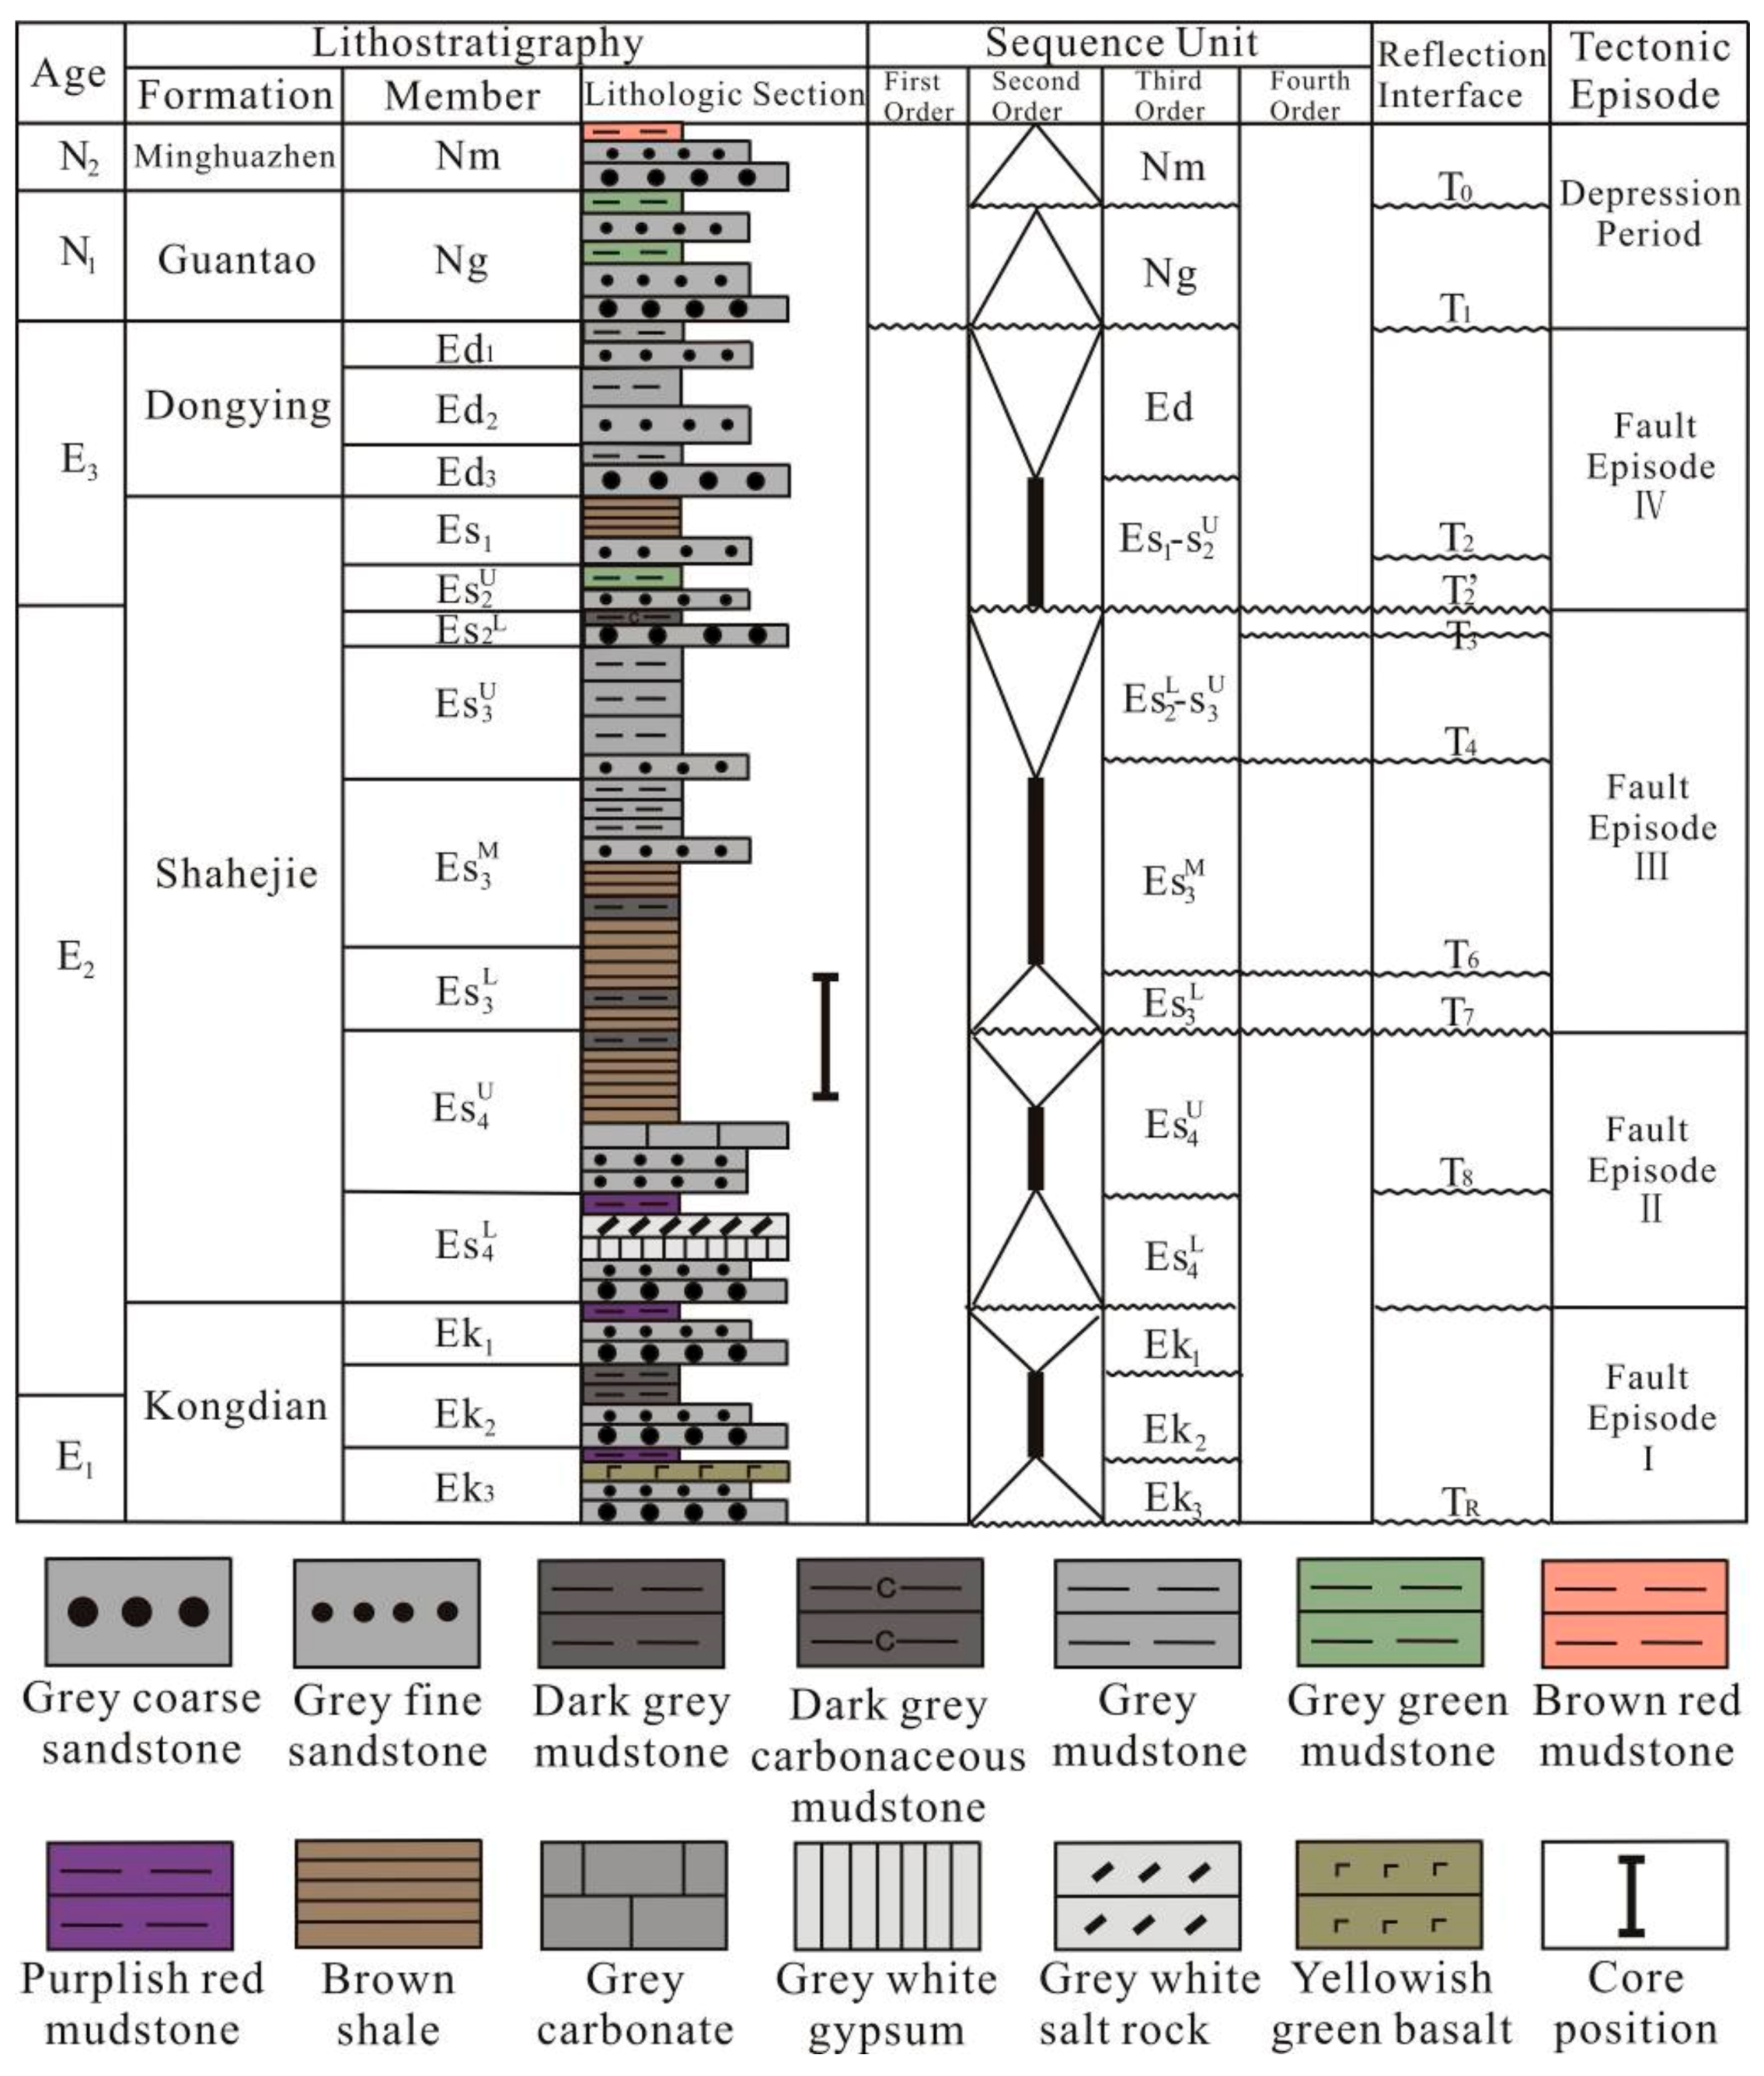
2. Overview of Study Area

Jiyang Depression is part of the first-order tectonic unit of the Bohai Bay Basin in East China, which is located west of the Tan-lu fault zone, south of the Chengning uplift and north of the Luxi uplift (Figure 1). The depression is 240 km long and 130 km at its widest point and covers about 26,000 km2. Jiyang Depression, a typical structure with sags and uplifts, is a Mesozoic–Cenozoic rift–depression composite basin composed of four negative secondary tectonic units, including Dongying, Huimin, Zhanhua, and Chezhen Sags as well as several positive secondary tectonic units including the Gudao, Yihezhuang, Chenjiazhuang, Wudi, Binxian, and Kendong Qingtuozi uplifts (Figure 1). Dongying and Zhanhua Sags are the richest hydrocarbon accumulation areas in the Jiyang Depression, from which about 30 shale oil wells have obtained good oil production. For example, Y183 well produced more than 11,138.8 t of shale oil from November 2013 to the present.
The upper fourth member and the lower third member of the Paleocene Shahejie Formation were deposited in a lacustrine transgression systems tract (LTST) or a lacustrine highstand systems tract (LHST) of second-order sequence (Figure 2) [47]. Especially during the active fault depression stage, thick dark shale strata developed under multiple semi-deep or deep lakes, brackish or saline water under alkaline and reducing conditions, and were then transformed in the subsequent early and middle diagenesis stages [1,48,49].
Because shales in the Shahejie Formation in the Jiyang Depression were mainly deposited under brackish-saline water columns [1,48], the lithofacies are mostly clayey limestone and calcareous shale (Table 1). Compared with marine shale reservoirs such as Wolfcamp, Bakken and Eagle Ford in North America, carbonate rocks and shale of Shahejie Formation in Jiyang Depression are rich in clay minerals and develop mud texture, which is similar to Uteland Butte shale reservoirs in North America (Table 1). Shales of the Shahejie Formation in the Jiyang Depression have a present-day depth of 2000–3900 m and a cumulative thickness of 200–400 m. Toc, vitrinite reflectance (Ro) and porosity fall into the range of 1.2–16%, 0.5–1.3%, 3–16%, respectively, with permeability less than 0.1 mD (Table 1). Except for the lithofacies types, reservoir properties are not significantly different from other lacustrine shales in China and North America (Table 1). However, due to the high gas-oil ratio, the crude oil density and viscosity of marine shale oil are smaller than that of lacustrine shale oil (Table 1). The upper fourth member and the lower third member of the Shahejie Formation is the most important shale oil reservoir in the study area.

3. Materials and Methods

Core samples from wells NY1, FY1, LY1, and L69 (Figure 1) were analyzed by a complete set of rock-mineral analysis and thermal simulation experiments. In addition, wells HX4, HX28, and A6 were used for supplementary research. Careful observation and description of the core was carried out to identify the lithofacies, fracture development, and source–reservoir–caprock assemblage of the shale. As a result, 305 representative samples covering the main types of lithofacies were analyzed by thin section, optical microscopy, field emission scanning electron microscope (FE-SEM) with energy dispersion spectrum (EDS), high-pressure mercury, gas adsorption, and source rock pyrolysis analysis, as described in the following section.
Thin sections of shale samples were made to observe the petrological characteristics including the rock component type and distribution, the laminae type and the macro reservoir space type under an optical microscope. Observation and identification of the shale microstructure included mineralogy and reservoir space based on FE-SEM using an FEI Quanta 650. Bitumen in the shale reservoir space was directly observed under low-vacuum FE-SEM. Two-dimensional (2D) scanning of the samples was performed combining FE-SEM with EDS to show pore type distributions, mineral compositions and plane distributions and contact relationships.
The quantitative distribution of macro- to micro-scale reservoir space was determined by the combined application of high-pressure mercury and CO2 and N2 gas adsorption methods. The high-pressure mercury intrusion method is used to investigate the distribution of macropores; the N2 adsorption method is used to analyze the distribution of mesopores and the CO2 adsorption method is used to quantify the distribution of micropores in the sample.
In this study, the total organic carbon (TOC) content, volatile (free) hydrocarbon content (S1), pyrolysis yield (S2) and hydrocarbon generation potential (S1 + S2) of the shale were obtained using source rock pyrolysis analysis.
Fresh and low-maturity shale samples were selected for thermal simulation experiments. The experimental facilities include an autoclave, a temperature control system and a pressure control system. The autoclave is composed of Hastelloy alloy with a maximum volume of 1000 mL, maximum tolerable temperature of 600 °C and maximum tolerable pressure of 50 MPa. The temperature control system is composed of a thermocouple, a temperature sensor and an AI-518P artificial intelligence temperature controller that precisely controls the heating process. The pressure control system is composed of a pressure sensor and a GBS-STA100 gas-supercharging system.
Prior to the thermal simulation experiment, fresh shale samples were cut into regular lumpy sections along the direction perpendicular to the surface of the laminae; 200 mL distilled water was added to the sample before being placed into the autoclave. Samples were heated to temperatures of 150–600 °C at high pressures of 15–30 MPa for 48 h. Changes occurring in the samples before and after the experiment were evaluated by optical microscopy and FE-SEM to determine the occurrence and migration of the bitumen.

4. Results

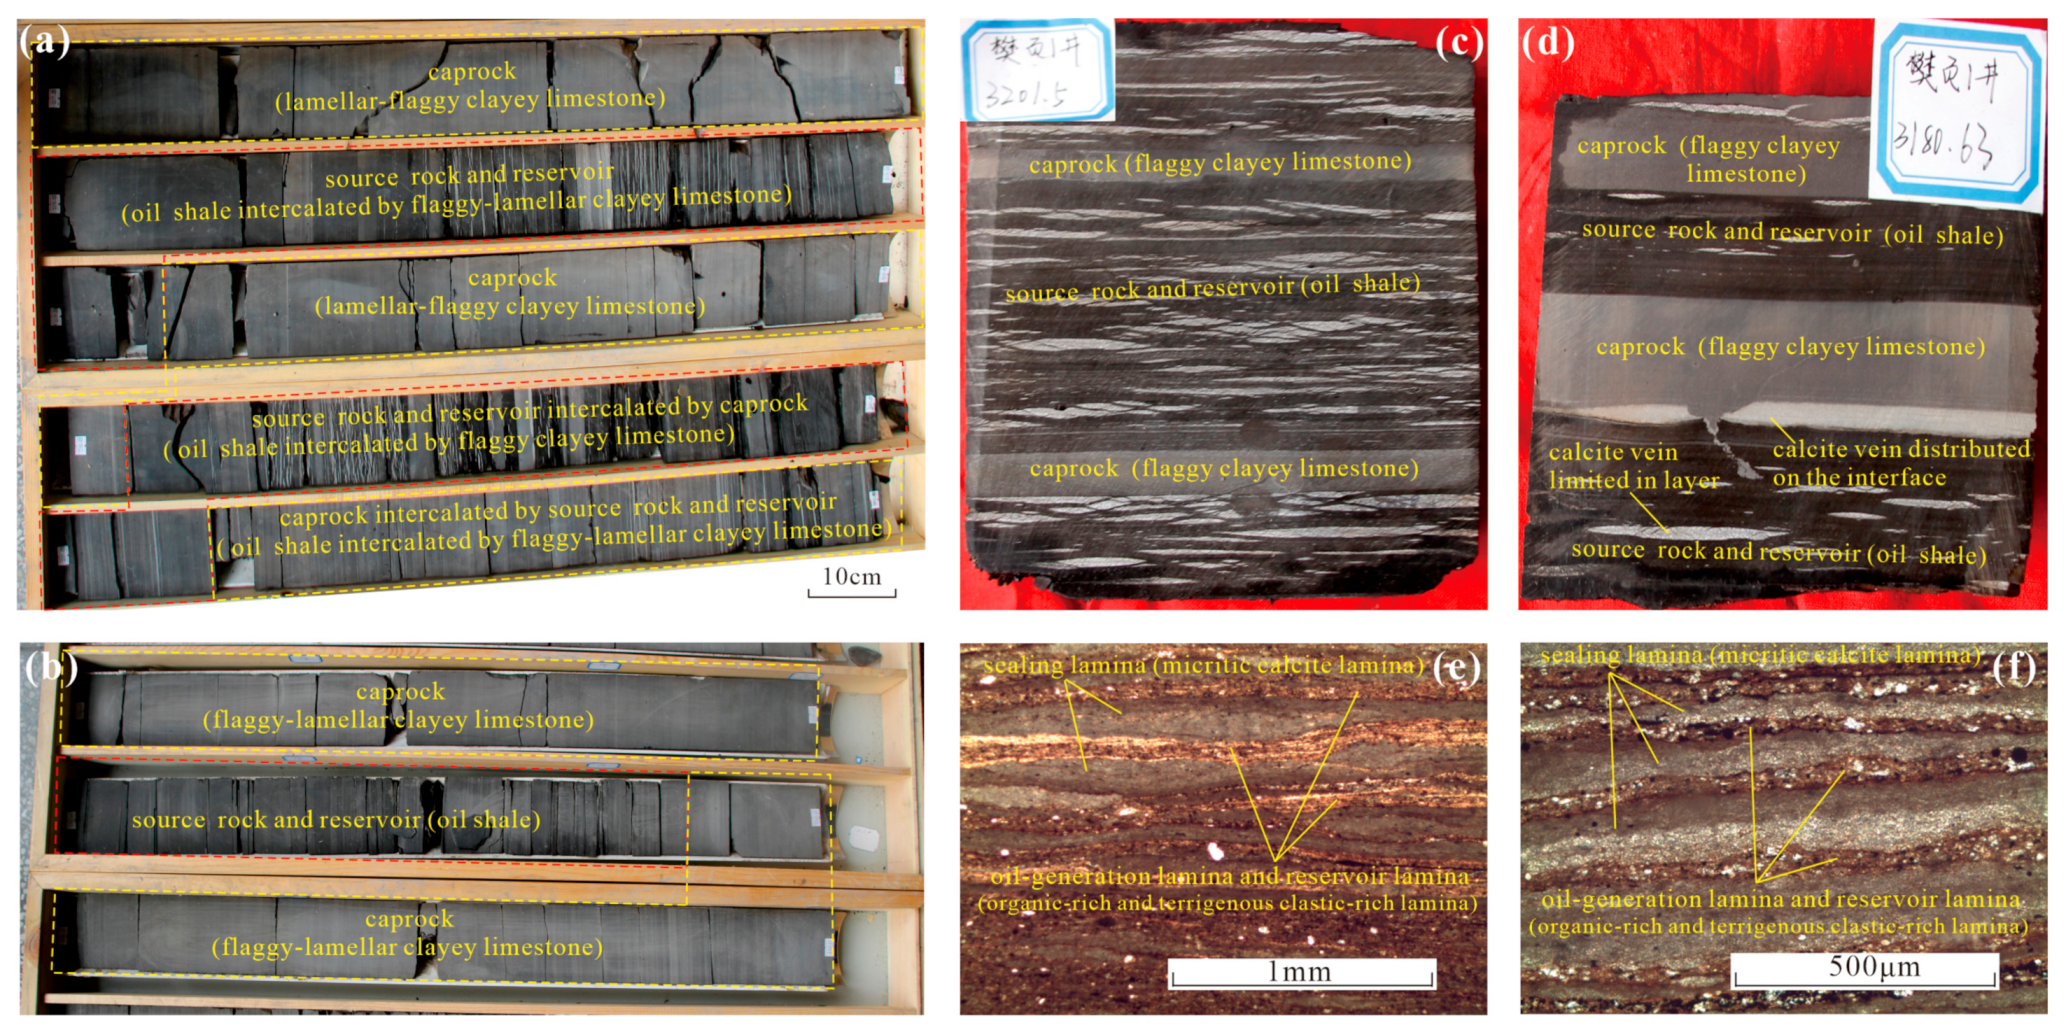
4.1. Source–Reservoir–Caprock Characteristics of Shale Oil Reservoir

4.1.1. Oil-Generation Potential

Previous geochemical research has focused on the hydrocarbon potential of the upper fourth member and the lower third member of the Shahejie Formation in the Jiyang Depression [56,57], where the high-quality source rock was deposited mainly in brackish and saline lacustrine environments [58,59,60,61,62,63,64]. The kerogen types derived from aquatic plankton are mainly I and II1 (Table 2). The vitrinite reflectance (Ro) shows that the source rock is located in an oil-generation window (Table 2). The source potential differs considerably owing to the diversity of the lithofacies.
The contents of felsic minerals, clay minerals and carbonate minerals show large variation. Generally, carbonate minerals are the most abundant component, at more than 50%, and felsic minerals are 0–33.33%, which is higher than the clay mineral content. Oil shale has a dark color owing to the rich organic matter, displaying lamellar or oriented microscopic stratifications, and always develops calcite veins (Figure 3a,b). The content of carbonate minerals in the oil shale is about 81.4%, with calcite at 77%, followed by felsic minerals at about 10% distributed in the carbonate minerals (Figure 3c). Therefore, oil shale in the reservoir is probably a high-quality source rock because it is rich in organic matter and carbonate minerals, which usually means high oil-generation potential with authigenic attributes.

4.1.2. Reservoir Properties

Shale reservoir space can be divided into pores and fractures (Table 3). Pores were further subdivided into two types: pores in inorganic minerals and pores in organic matter (Table 3). Inorganic mineral pores include intercrystalline (or intergranular) in felsic minerals, carbonates and pyrite, and intracrystalline (or intragranular) pores in felsic and clay minerals, and carbonates (Table 3). These pore types were all further subdivided into primary and secondary pores resulting mainly from the dissolution of felsic minerals, the recrystallization of carbonate minerals and the transformation of clay minerals (Table 3). Organic pores include internal, marginal and boundary pores in organic matter (Table 3) [65]. Fractures include structural, bedding, shrinkage, dissolved and natural fluid pressure fractures based on the origin (Table 3).
Pores in the upper fourth member and the lower third member of the Shahejie Formation are mainly discretely distributed in a carbonate matrix based on FE-SEM (Figure 4a). The whole-mineral analysis indicated that carbonate minerals are mostly in contact with quartz, followed by illite (Figure 4b), and the pores are mainly closed to calcite, followed by quartz (Figure 4b). Therefore, the pores are strongly related to the formation of carbonate minerals and quartz, and, to a lesser extent, other minerals. The pore types are mainly primary or secondary intercrystalline (intergranular) pores, including intercrystalline (dissolved) pores of carbonate mineral, intergranular dissolved pores of felsic mineral, intracrystalline (dissolved) pores of clay mineral, and intergranular (dissolved) pores among carbonate, felsic and clay mineral (Figure 4c). Different from Bakken Shale, Barnett Shale and Marcellus Shale, the organic matter in the upper fourth member and lower third member of the Shahejie Formation has developed few internal and marginal pores but abundant boundary pores of organic matter (Figure 4c).
Despite enormous numbers and various types of shale reservoir spaces, pores in actual shale samples and samples after thermal simulation experiments are not all bitumen-filled. Examples are as follows: Organic pore developed in the kerogen of the sample after performing the thermal simulation experiment (Figure 5a); intracrystalline pore developed in the illite–smectite mixed layer of the sample after the thermal simulation experiment (Figure 5b); intergranular pore developed in the framework of feldspar and the illite–smectite mixed layer of the sample after the thermal simulation experiment (Figure 5c); intergranular dissolved pore developed in the framework of feldspar and calcite of the sample after the thermal simulation experiment (Figure 5d); intergranular pore developed in the framework of minerals (Figure 5e); intercrystalline pore developed in the framework of micritic dolomite (Figure 5f); intercrystalline pore developed in the framework of microfossils (Figure 5g); bedding-parallel vein fracture filled with calcite and bitumen (Figure 5h); bedding-parallel vein fracture filled with calcite and bitumen (Figure 5i); expulsion fracture filled with bitumen (Figure 5j); expulsion fracture filled with bitumen (Figure 5k); bedding and structural fractures filled with bitumen (Figure 5l). As mentioned above, all show filled-in effective reservoir space including organic pores (Figure 5a), large-scale intercrystalline (intergranular) pores close to organic matter (Figure 5b–g) and fractures (Figure 5h–l), especially in hydrocarbon expulsion fractures and bedding-parallel vein fractures (Figure 5h–k). The oil shale contains enormous amounts of intercrystalline (intergranular) pores and boundary pores of organic matter and has developed bedding-parallel vein fractures and hydrocarbon expulsion fractures. Hence, the shale has self-storage properties.

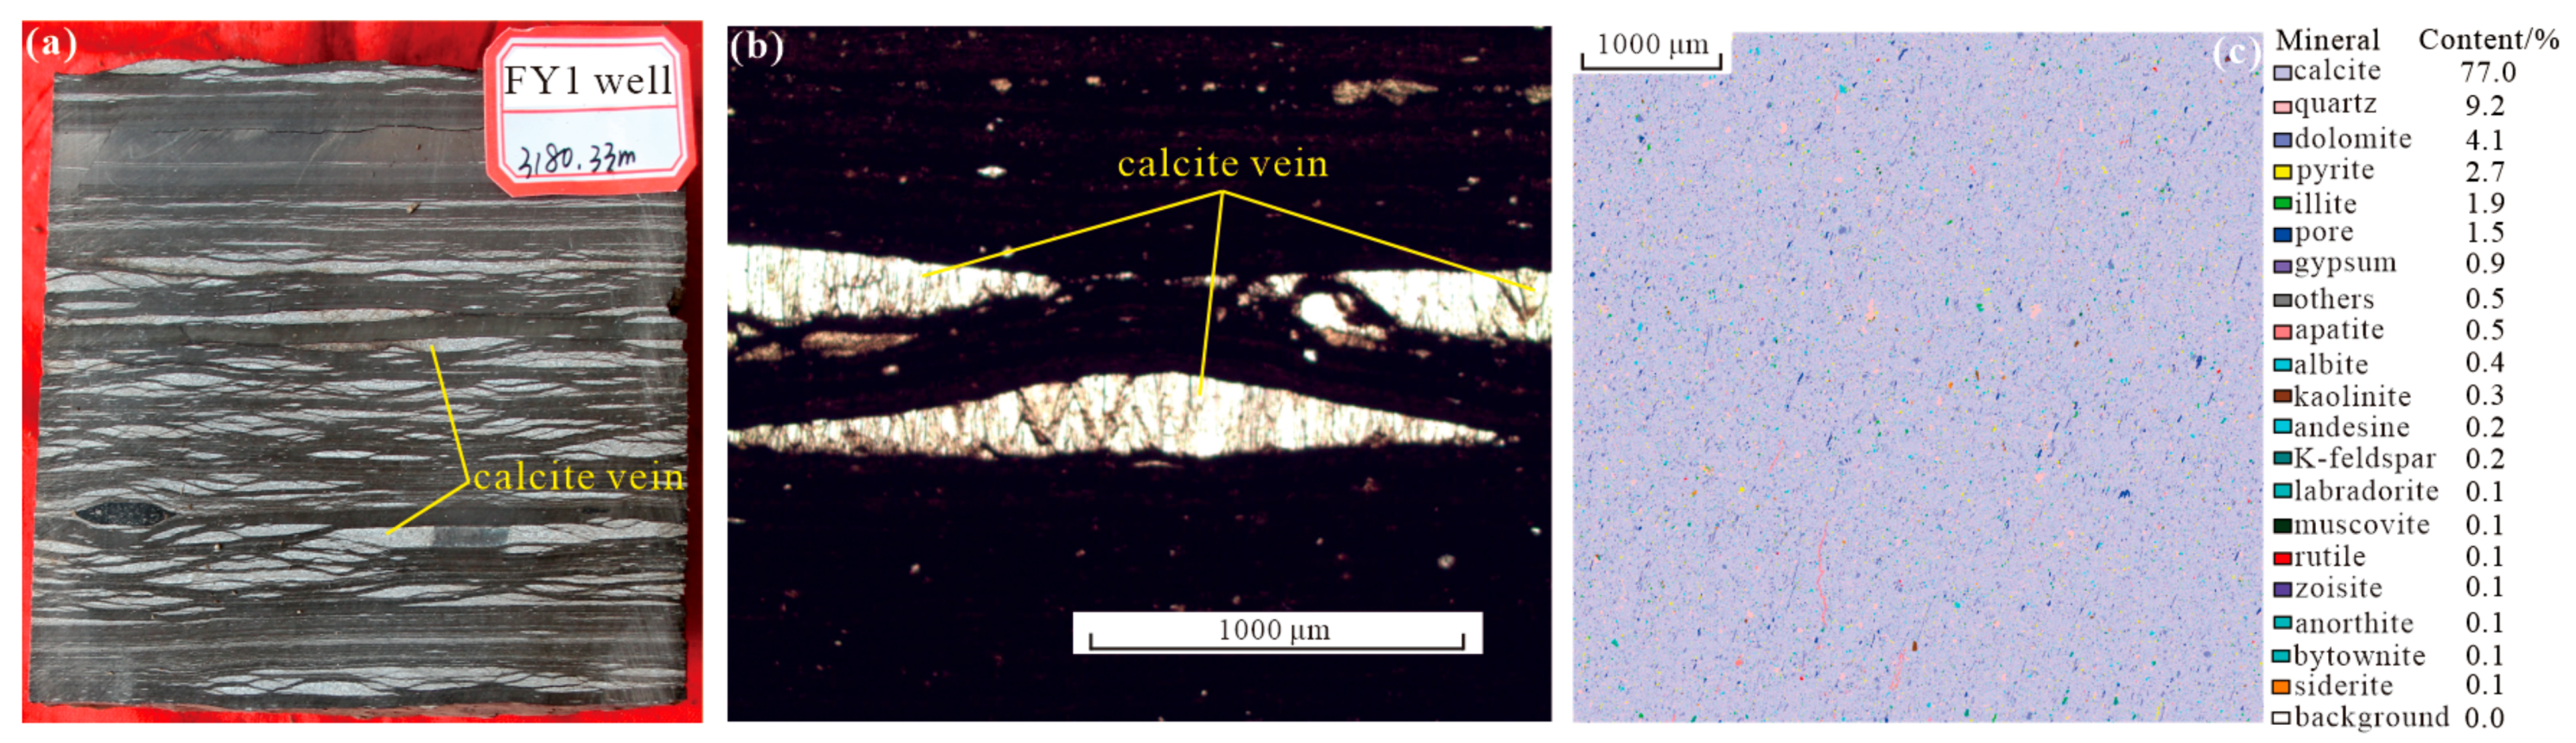
4.1.3. Sealing Capacity

Different lithofacies in shale have varying mechanical strengths and physical properties due to differences in the composition of both inorganic minerals and organic matter [66]. The carbonate-rich lithofacies have high mechanical strength, poor physical properties such as low permeability and good sealing ability, whereas low maturity clay-rich or organic-rich lithofacies have weak mechanical strength and can easily be fractured by overpressure fluid [65]. The evolution of the continental lacustrine sedimentary environment in the study area caused the carbonate-rich lithofacies and the clay-rich or organic-rich facies to develop alternately, which formed sets of sandwich-type strata at different scales (Figure 6): Interbedded clayey limestone and oil shale form alternating source rock, reservoir, and caprock (Figure 6a), and clayey limestone acts as caprock, and oil shale acts as source rock and reservoir (Figure 6b), and the calcite veins are limited in the oil shale layer or are distributed on the interface between oil shale and clayey limestone (Figure 6c,d); micritic calcite laminae acts as sealing laminae alternating with organic-rich and terrigenous clastic-rich laminae as oil-generation and reservoir laminae under a polarizing microscope, i.e., sealing laminae alternating with oil-generation and reservoir laminae forms a small-scale source–reservoir–caprock assemblage (Figure 6e,f). The typical pattern has two sets of clayey limestone strata as the roof and the floor with oil shale in the middle (Figure 6a,b). The caprock roof has good mechanical strength and poor physical properties, and oil shale with porosity as the source and reservoir. This type of arrangement can easily form a closed system in which bitumen is continuously generated and accumulated to create pore fluid overpressure [44]. In addition, the calcite veins are limited in the oil shale layer or are distributed on the interface between oil shale and clayey limestone, and are almost absent in the clayey limestone, which means that the clayey limestone (the caprock) is dense enough for fluid to flow. It serves as strong evidence for the sealing ability (Figure 6c,d). Moreover, the sandwich-type strata structure composed of strong and weak lithofacies resists strong external tectonic stress and has self-regulation against deformation to preserve overpressure liquid for long periods, which could help to preserve the shale oil and gas. The production sections of the upper fourth member and the lower third member of the Shahejie Formation in Zhanhua Sag have both a roof and floor. Therefore, the sandwich-type structure of a shale oil reservoir determines its self-sealing ability.

4.2. Reservoir Space Structure

The type, size and distribution of reservoir space vary among shales. Conventional qualitative and quantitative methods for measuring reservoir space types and structures include thin-section optical microscopy, SEM, mercury intrusion porosimetry and gas adsorption analyses. The maximum magnification of an optical microscope is usually 500–3000 times, which could be adequate for observing micro-scale pores and fractures. Microfractures are distributed discretely, whilst intercrystalline pores are continuous under the optical microscope. The microfractures effectively connect the intercrystalline micropores. The observation scale of SEM covers the high magnification end of the optical microscope and extends down to the nanopore scale. Hence, SEM is a powerful method for studying shale reservoir pores because it clearly displays their properties at different scales. The fractures are distributed discretely under low magnification, although more hydrocarbon expulsion fractures and intercrystalline pores connected by smaller ones appear as the magnification increases. The intercrystalline pores are connected to form a pore network with the organic matter pores. Pore size is a key parameter regarding the rock’s physical properties in shale reservoirs. High-pressure mercury intrusion, N2 adsorption and CO2 adsorption methods are used to measure macropores, mesopores and micropores, with pore diameters of >50 nm, 2–50 nm, and <2 nm, respectively [67]. According to the pore volumes of these pores, the shale reservoir space of the upper fourth member and lower third member of the Shahejie Formation is multi-scale and mainly nano–micro scale. The pore volume of the macro pores is larger than that of the mesopores, and that of the mesopores is larger than the pore volume of the micropores.

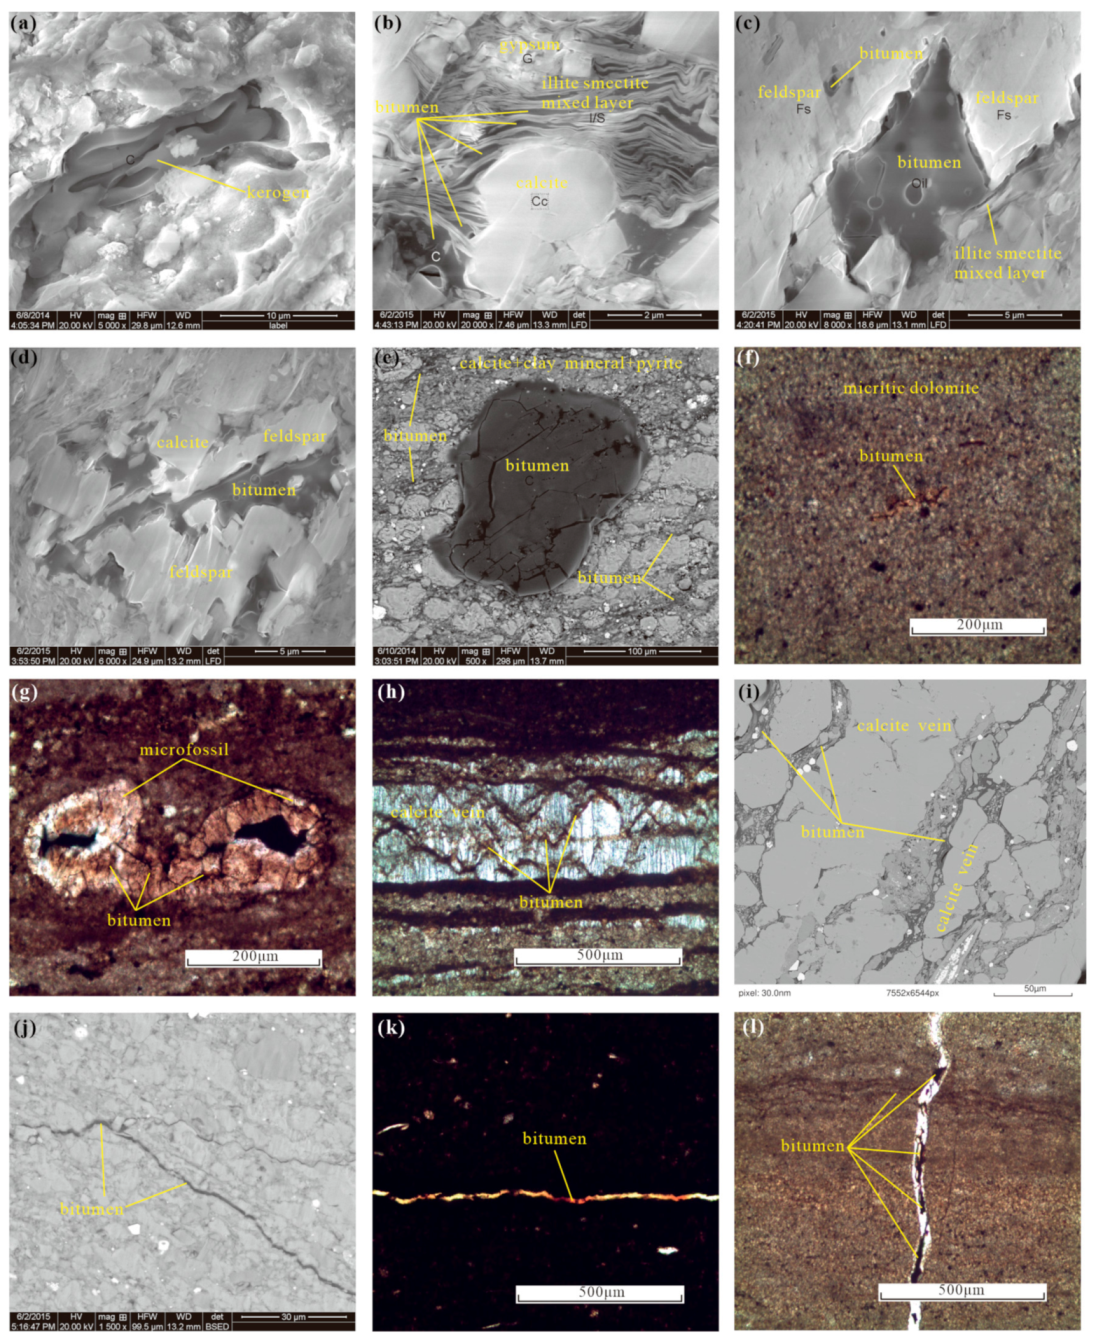
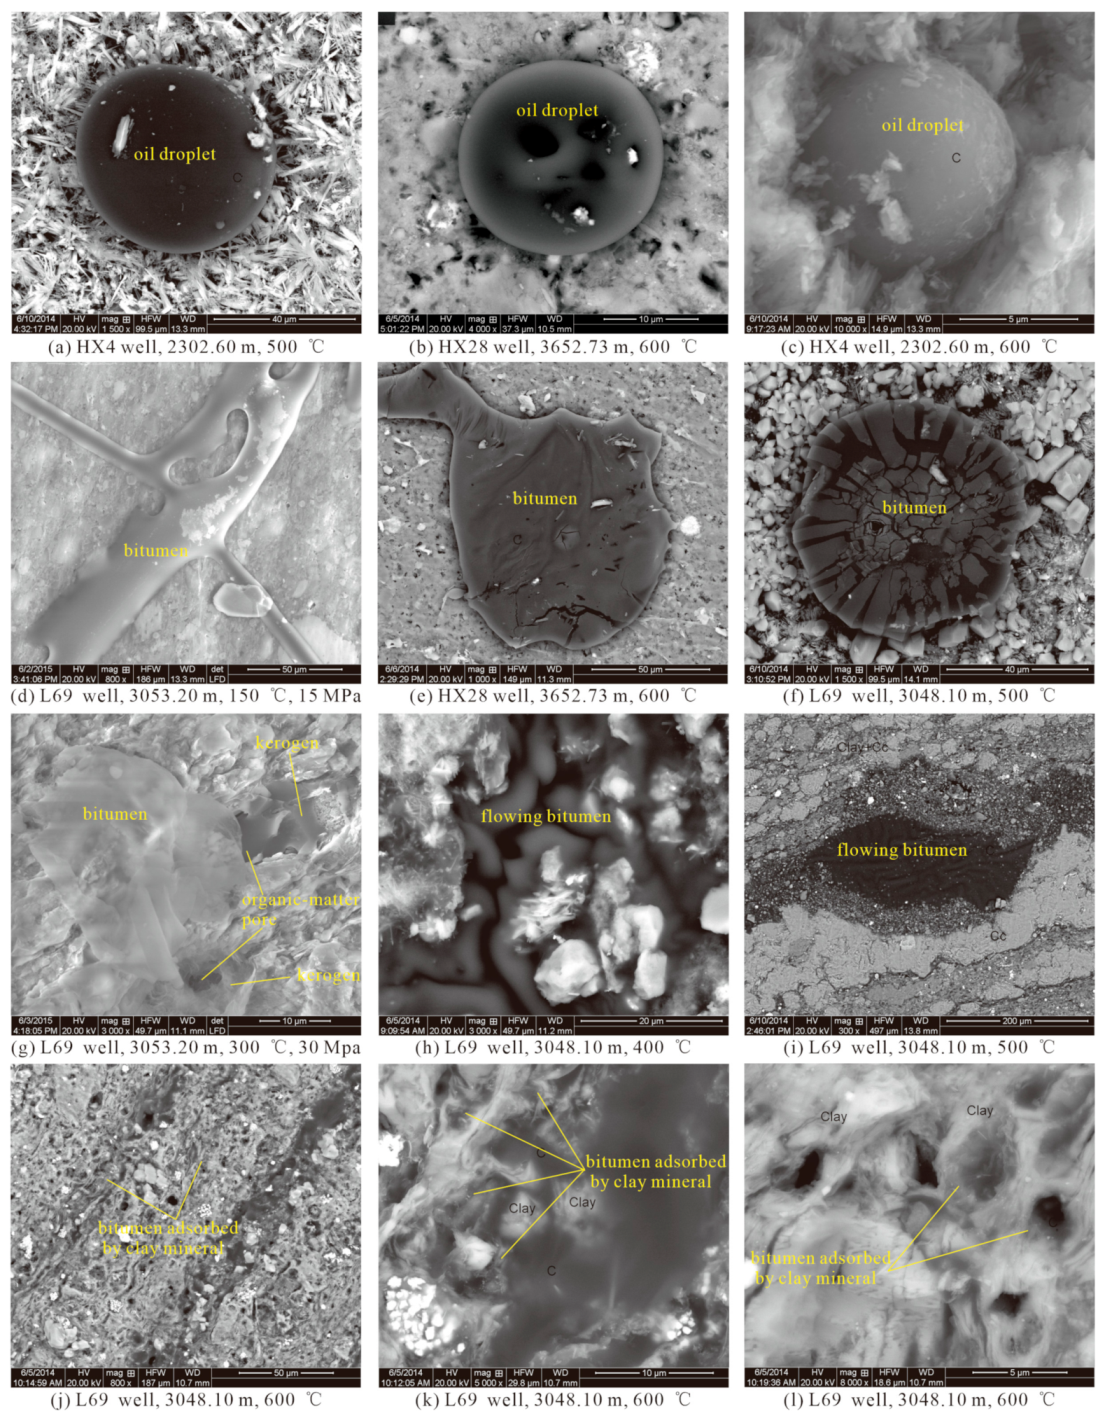
4.3. Occurrence of Shale Oil

The occurrence of oil and gas in shale reservoirs has been investigated by many groups [68,69]. The three states for bitumen include free, adsorbed and dissolved states [70]. In this study, we utilized ESEM to observe the original shale samples and post-thermal simulation samples and determined that the bitumen occurs mainly in the free state (Figure 7a–i), followed by the adsorbed state (Figure 7j–l). These results are in agreement with those of O’Brien et al. (2002) [40], who also conducted a thermal simulation experiment on organic-rich shale. The bitumen in the free state is distributed mainly in the organic pores, large-scale intercrystalline (intergranular) pores, hydrocarbon expulsion fractures, bedding-parallel vein fractures, bedding fractures and structural fractures, and shows obvious flow traces (Figure 7g–i). The adsorbed bitumen is distributed mainly in the intracrystalline pores of the clay mineral (Figure 7j–l).

5. Discussion

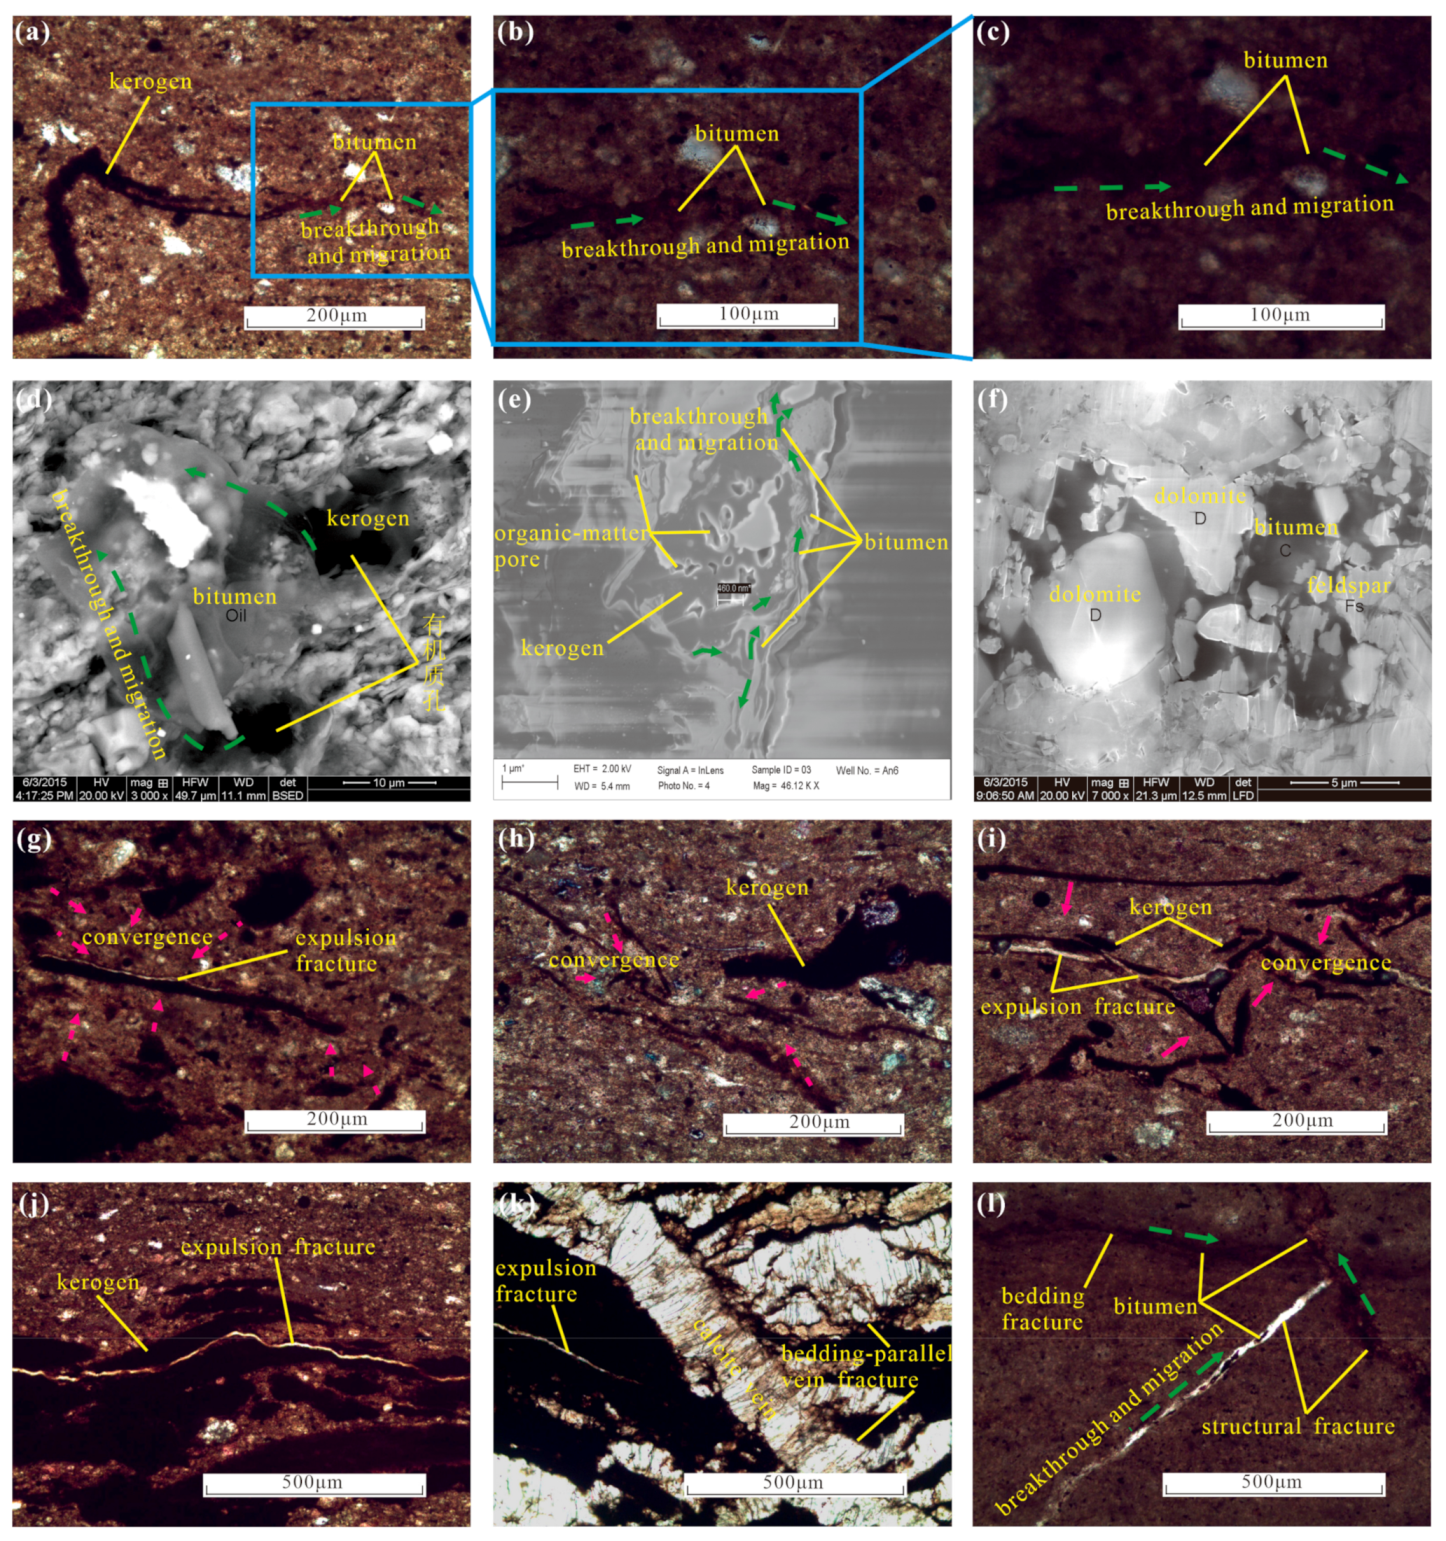
5.1. Migration Resistance and Dynamics of Shale Oil

Bitumen is displaced from kerogen into nearby reservoir space and migrates in a horizontal direction, which displaces pore water in an oil–water two-phase flow process. Owing to the original hydrophilic conditions of the inorganic mineral surfaces in the shale, capillary pressure creates resistance to water displacement. Felsic and carbonate minerals in shale are extremely small, mainly at the fine-silt scale. However, clay minerals and organic matter are abundant and have large specific surface areas and high adsorption capacities. The shale develops a micro–nano-scale pore and throat network in which the throat is composed of intracrystalline pores of clay mineral or intergranular pores between clay mineral clusters and clastic grains. The fluid in the pores and throats of shale is affected by adsorption resistance owing to a large pore curvature, weak connectivity, high irreducible water saturation and poor physical properties [71,72,73]. Therefore, the migration of bitumen displacing water overcomes the capillary pressure and adsorption resistance. We thus define the displacement pressure of shale as the sum of capillary pressure and adsorption resistance (Figure 8). According to the equilibrium relationship between the dynamic force and resistance, the fluid pressure of bitumen is the main driving force of the migration, although buoyancy should also be considered for the vertical migration of the bitumen.

5.2. Migration Patterns of Shale oil

The main mechanism of pore fluid pressurization is hydrocarbon generation. Fluid displacement is hampered by extremely small pore throats and low permeability. Hence, the volume and, to a greater extent, the rate of hydrocarbon generation are important factors in the buildup of pore fluid pressure [74]. Generally, a rock’s fracture strength is larger than its fluid displacement pressure. At low hydrocarbon generation rates, the generated hydrocarbon volume is insufficient to generate a pore fluid pressure that reaches the rock’s fracture strength, and the hydrocarbon will be retained in the pore (Figure 9(Aa,Ba) and Figure 10a). If the hydrocarbon generation rate is moderate and the pore fluid pressure is larger than the displacement pressure but smaller than the rock’s fracture strength, the hydrocarbon will break through into the adjacent pores according to the migration model of subcritical flow until reaching a balance between hydrocarbon generation and seepage (Figure 9(Ab) and Figure 10b). However, if the hydrocarbon generation rate is high and its quantity is larger than the seepage discharge, hydrocarbons will accumulate and the pore fluid pressure will increase continuously until overcoming the displacement pressure as well as the rock’s fracture strength to generate hydrocarbon expulsion fractures; then, the fluid will migrate in the model of instantaneous flow (Figure 9(Ac) and Figure 10c) [75,76,77]. In particular, when the shale has a high content of organic matter, abundant laminae develop and the rock matrix is very dense but brittle. In this case, the rock’s fracture strength is smaller than the displacement pressure and the pore fluid pressure quickly reaches the rock’s fracture strength. Then, hydrocarbon expulsion fractures easily form, which enables the migration of instantaneous flow (Figure 9(Bb,Bc) and Figure 10c).

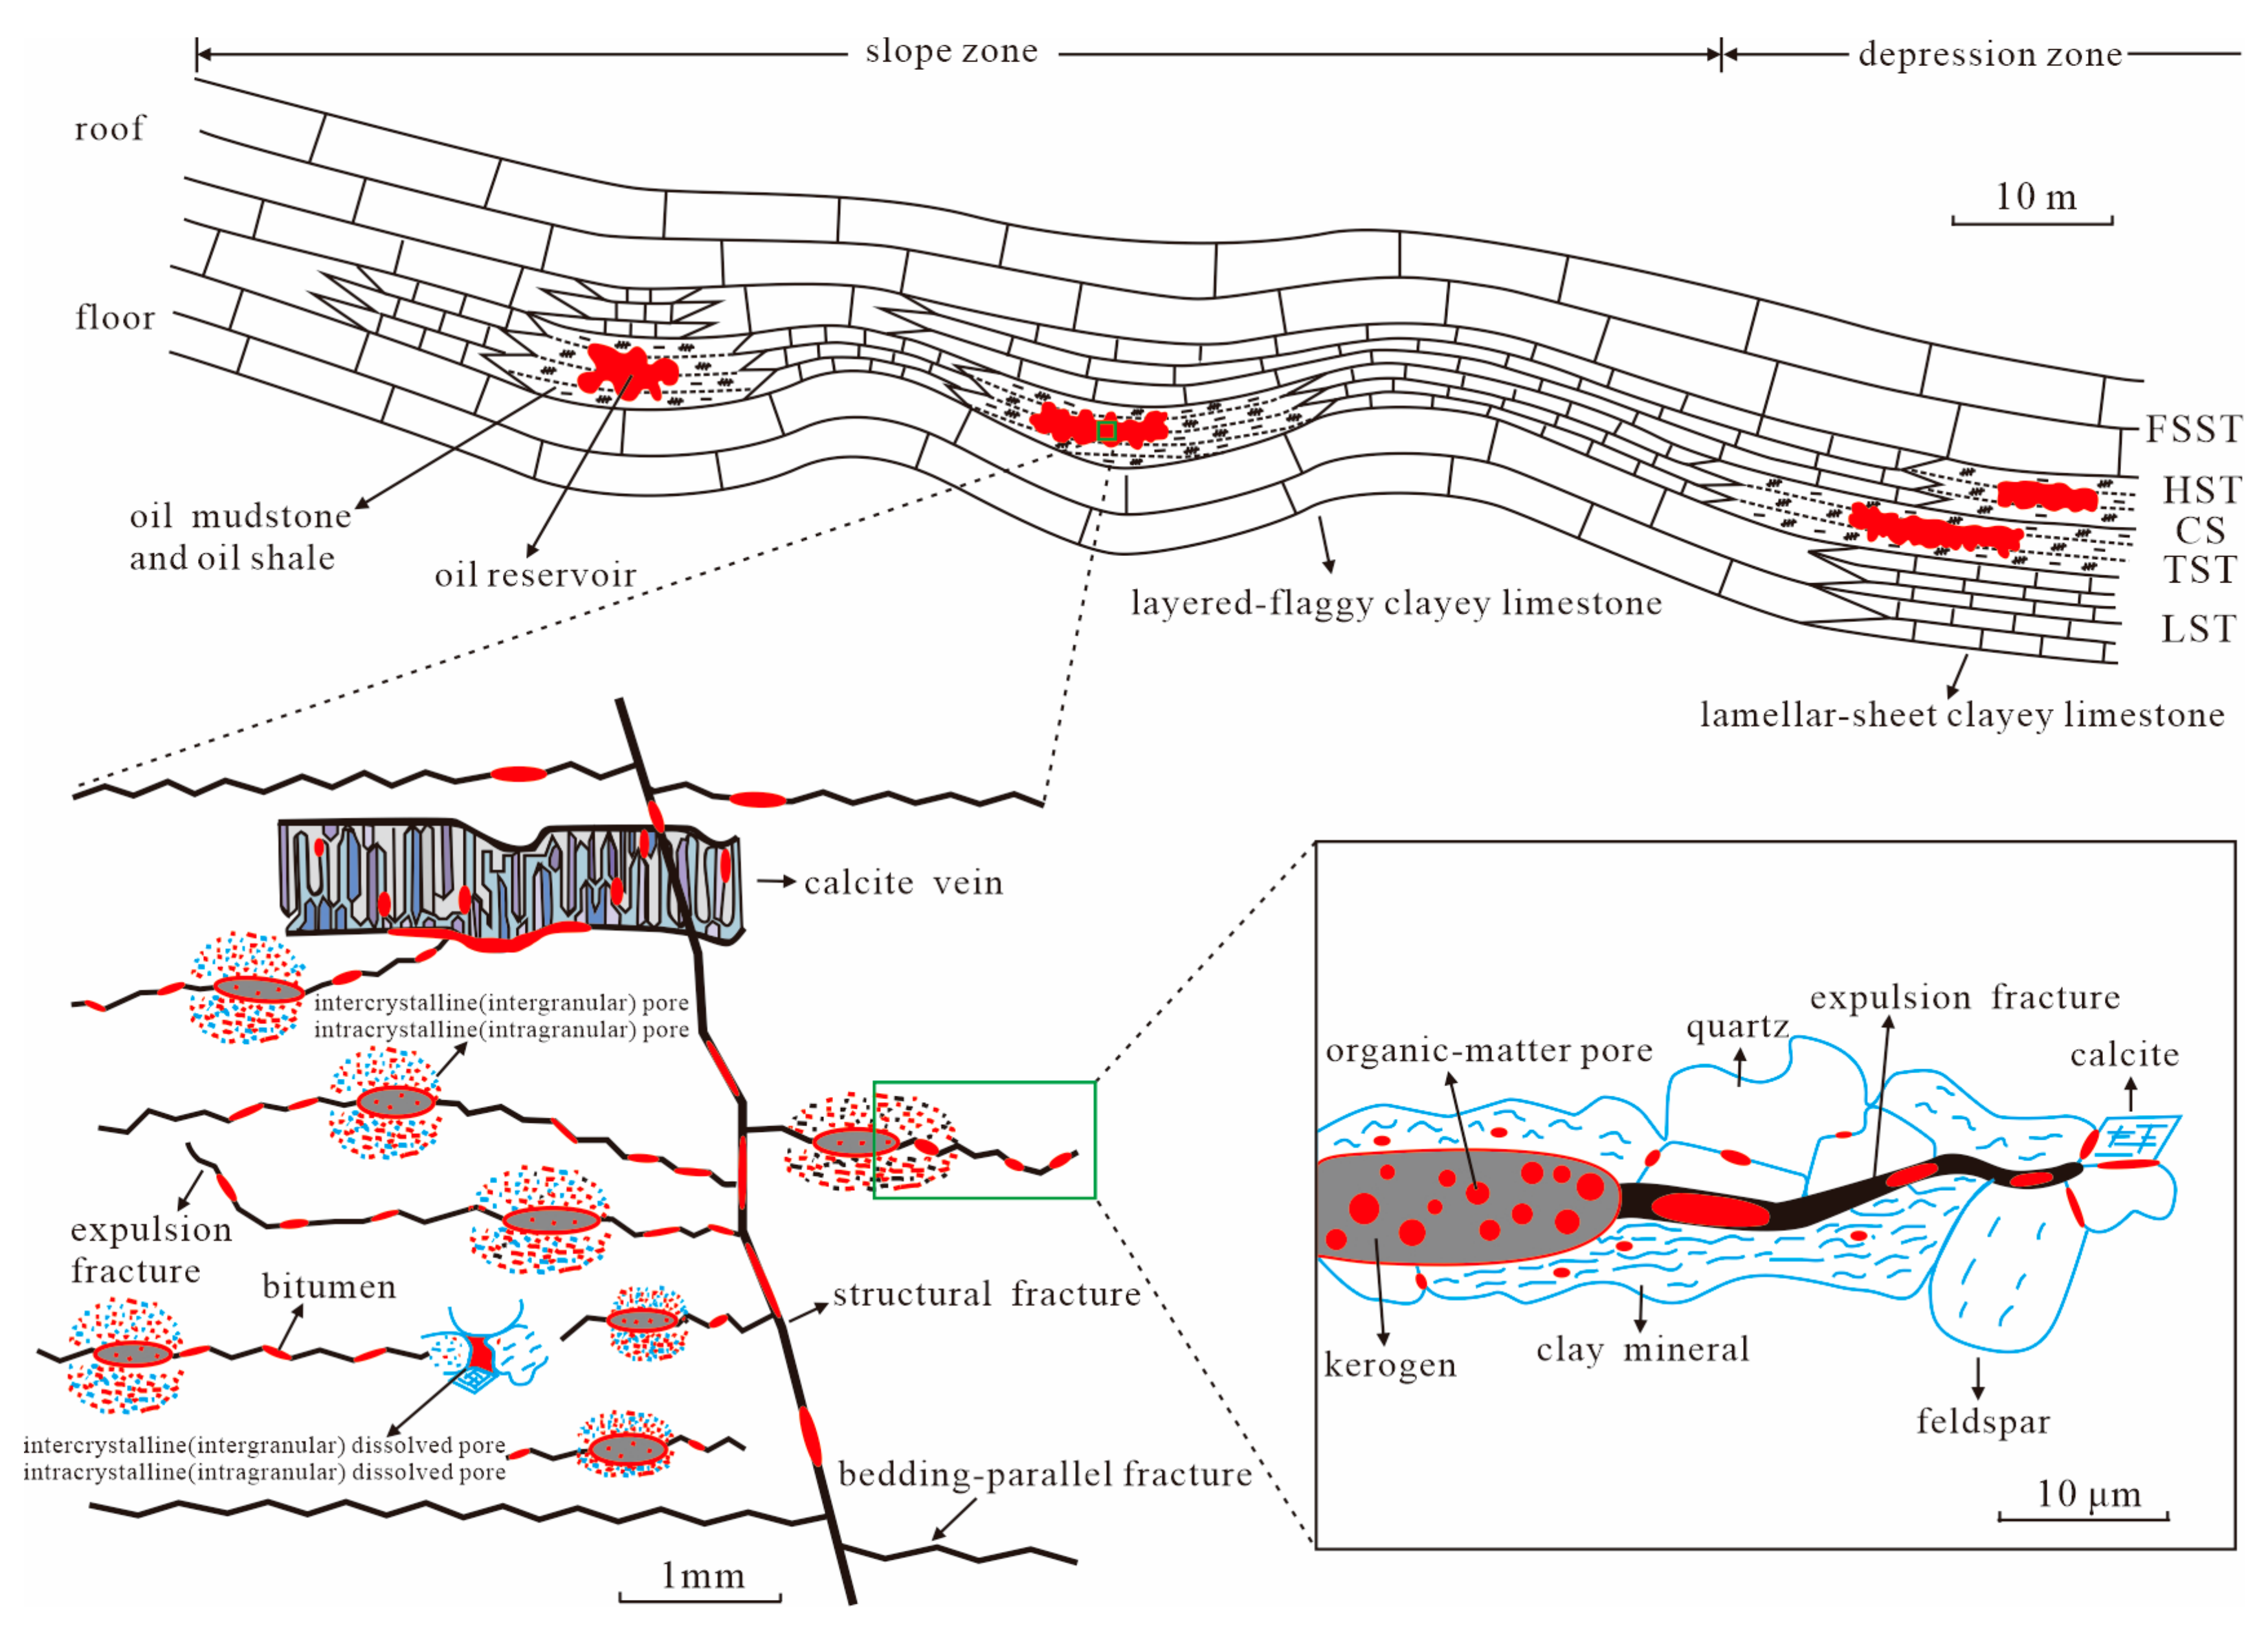
5.3. Accumulation Model of Shale Oil

The results of shale reservoir pore structure indicate multi-scale properties and a gradually connected network. The large-scale reservoir space is connected with the small-scale one, which determines the multi-scale migration of bitumen and eventually the accumulation in the large-scale reservoir space. The bitumen migrates away from the source kerogen, breaks through into nearby intercrystalline (intergranular) pores and then continues to migrate outside (Figure 11a–c), as indicated by optical microscopy. This phenomenon is observed more clearly under FE-SEM, where free-state bitumen migrates from kerogen organic pores (Figure 11d), enters nearby nano–micro-scale intercrystalline (intergranular) pores with the flow sign (Figure 11e), and accumulates in the micro-scale intergranular dissolved pores (Figure 11f). Especially in organic-rich shale, kerogen gradually accumulates to form an organic-matter network under pressure (Figure 11g–j) [78,79] and is usually connected by hydrocarbon expulsion fractures (Figure 11h–j). Bitumen migrates from the organic-matter network and hydrocarbon expulsion fractures (Figure 11g–k) and eventually accumulates into the larger scale bedding-parallel vein fractures, bedding fractures or structural fractures (Figure 11k,l).
The study of shale gas indicates that the diversity and multiple scales of the reservoir space determine the occurrence, flow pattern and flow mechanism [36,80,81]. The organic pores and intracrystalline (intragranular) pores are mainly at the nanoscale, in which natural gas is in the dissolved and adsorbed states, and the flow type includes Brownian motion, desorption and Knudsen diffusion. The intercrystalline (intergranular) pores are at the micro-scale, in which natural gas is in the adsorbed and free states, and the flow type includes Knudsen diffusion, slippage, bulk diffusion and non-Darcy flow. The scale of natural fractures and hydraulic fractures is larger than that of pores, in which the occurrence of natural gas is in the free state and the flow types are mainly Darcy flow and pipe flow (Figure 12).
Similar to the seepage characteristics of shale gas, shale oil of the upper fourth member and the lower third member of the Shahejie Formation also has modes of multi-scale migration and accumulation (Figure 13). For shale in the oil-generation window, the pyrolysis of kerogen generates bitumen under high temperatures and pressures (Figure 13a), which exists in organic pores in the free state or the dissolved state (Figure 13b). The pore fluid pressure generated by hydrocarbon generation drives bitumen in the free state to migrate into the boundary pores of organic matter and intercrystalline (intergranular) pores mainly according to the migration model of subcritical flow or into hydrocarbon expulsion fractures according to the migration model of instantaneous flow. Secondly, it migrates into nearby reservoir space from the inside of the kerogen by diffusion and is then absorbed on the surfaces of kerogen or inorganic minerals. The bitumen in the free state overcomes the displacement pressure (the sum of capillary pressure and adsorption resistance) as a result of the pore fluid pressure and migrates into the intercrystalline pores by the non-Darcy flow. Intercrystalline pores are found in quartz, calcite and pyrite, clay, feldspar and dolomite (Figure 13c–h). Alternatively, it accumulates in hydrocarbon expulsion fractures by Darcy flow (Figure 13i). The bitumen gradually migrates into the larger-scale intercrystalline pores or fractures and eventually accumulates in bedding and structural fractures (Figure 13j–l); then, it follows the vein-type model of the multi-scale progressive transport network (Figure 13). The displacement pressure of the bitumen shows anisotropy owing to the heterogeneity of the shale fabric. The bitumen always migrates along the path of minimum resistance driven by pore fluid pressure. Although not all of the reservoir space is filled with oil in the pore network, a dominant migration pathway is present with the optimal transport structure obeying Murray’s law [82]. That is, at least one pore and throat network at a certain scale forms the most connected pathway. This indicates that the minimum resistance needs to be overcome during the migration and accumulation of bitumen in the optimal pathway, which is key for high-efficiency fluid seepage.

5.4. Reservoir Model of Shale Oil

Different lithofacies within the studied sections have different potentials for oil generation, reservoir and sealing, and play different roles in the source–reservoir–caprock unit. Lithofacies in the early–middle diagenesis stage are determined mainly by the sedimentary environment; therefore, this is the basis of the shale oil reservoir. Hydrocarbon generation potential is key for the presence of shale oil, for which organic matter quantity, quality and maturity are all requirements. Usually, organic-rich lithofacies develop mainly in the condensed section (CS) of an LTST and an LHST in a humid climate or during transition periods between dry hot and humid climates. Then, they are deposited in still, brackish, strong reducing and stratified water [83,84,85] and are distributed in low-lying areas of paleotopography adjoining carbonate-rich lithofacies such as clayey limestone. Owing to the uneven paleotopography of the continental lacustrine basin, many local sags and salients have formed several microenvironments, which led to a dispersed distribution of oil shale showing quick lateral phase changes and strong plain heterogeneity.
When the lake level changes, the microenvironments migrate to cause oil shale evolution into carbonate-rich lithofacies. In addition, a lacustrine area with a relatively small area and relatively shallow water depth is sensitively affected by fault activity, climate change and catastrophic flood, and results in thin layers and vertical heterogeneity of the oil shale. Oil shale is spatially surrounded by carbonate-rich lithofacies because of the diversity of the sedimentary environment, which manifests as a sandwich-type strata structure on the profile and a banded shape (or potato type) in the plane view. This structure forms a self-sealing trap environment similar to a lenticular sand trap. Therefore, a shale oil reservoir belongs to a special lithologic trap dominated by shale lithofacies (Figure 14). Because the caprock of the trap is mainly constructed and supported by carbonate-rich lithofacies with high strength and poor physical properties, a shale oil reservoir has strong resistance to tectonic stress and excellent sealing capability, which is favorable for the preservation of shale oil.
Kerogen generates a large amount of organic acid and hydrocarbon from oil shale in the trap, which not only forms organic pores, intercrystalline (intergranular) dissolved pores and intracrystalline (intragranular) dissolved pores but also generates fluid overpressure to form hydrocarbon expulsion fractures or bedding-parallel vein fractures filled with calcite by coupling with diagenesis. Both the pores and fractures can reserve bitumen. Moreover, the sealing trap prevents bitumen in the free state from migrating outside. Then, the bitumen in the trap can choose the pathway with minimum displacement pressure to gradually migrate and accumulate according to the migration pattern of subcritical flow and instantaneous flow driven by the pore fluid pressure (Figure 14).
Pore fluid overpressure is formed by hydrocarbon generation in the sealing trap, which provides the driving force for bitumen to enter nearby boundary pores of organic matter, intercrystalline (intergranular) pores and hydrocarbon expulsion fractures, and then gradually migrate into the larger scale of the reservoir space including intercrystalline (intergranular) pores, bedding-parallel vein fractures, bedding fractures, and structural fractures. Excessive pore fluid pressure will cause cracking in the sealing caprock, such as clayey limestone. This massive dissipation of bitumen prevents accumulation of the shale oil.
Overall, the shale reservoir is a special lithologic reservoir controlled by a sedimentary environment and has self-generation, self-storage and self-sealing characteristics with developed pore fluid overpressure and a multi-scale transport network (Figure 14). This model presents a positive guide for exploring shale oil in continental lacustrine basins according to five aspects. First, the paleoclimate origin analysis of the oil shale indicates that shale formed mainly in the CS of the LTST and LHST. Second, the sedimentary environment analysis shows that lacustrine shale was deposited in low-lying areas of paleotopography in slope zones and depression zones. Variations in the sedimentary environment led to the development of complex lithofacies and quick phase change with strong macroscopic heterogeneity, which resulted in thin oil layers with quick horizontal change, limited oil accumulation and discrete distribution in the plane. Third, sedimentary evolution created a series of sandwich-type source–reservoir–caprock assemblages with interbedded hard and soft lithofacies. These assemblages have resisted tectonic stress to form a stable sealing trap, which is favorable for the accumulation and storage of bitumen and the development of pore fluid overpressure, which perfectly matches the overpressure characteristics of the shale reservoir of the upper fourth member and the lower third member of the Shahejie Formation in Dongying and Zhanhua Sags. Fourth, the characteristics of the vein-type model of the multi-scale progressive transport network of shale oil indicate strong microscopic heterogeneity and the existence of an optimal migration pathway inside the reservoir. In addition, the maximum connected pore throat radius is key for the seepage of bitumen in the free state in the optimal migration pathway. The large scale of intercrystalline (intergranular) pores and fractures is important for creating reservoir space. In particular, hydrocarbon expulsion fractures formed by hydrocarbon generation and pressurization of kerogen pyrolysis are filled with bitumen near kerogen, which is a particularly favorable reservoir space of continental lacustrine shale. Fifth, based on the self-generation, self-storage and self-sealing characteristics as well as the multi-scale transport network, shale lithofacies are key elements of shale oil reservoirs. When a favorable target evaluation of a shale oil reservoir is conducted, shale lithofacies should be taken as the basic evaluation unit and evaluation of the source qualities, reservoir properties, alteration, fluidity and preservation should be considered to fully reflect the characteristics of the shale oil reservoir. Through systematic analysis of the influencing factors including source quality, reservoir property, alteration, fluidity and preservation in different shale lithofacies, sensitive parameters are optimally selected, and the gray–fuzzy mathematic method is used for comprehensive classification evaluation, which is an effective study method based on the geological understanding of the shale oil reservoir.
A discrete shale oil reservoir model can better explain the single well development characteristics of lacustrine shale oil reservoirs with low initial production, fast decline, and low recovery. The initial monthly oil production of the Y176 vertical well was 24 t. After four months, the production decreased rapidly to 2 t. LYP1-2 horizontal well had similar results, although the decline in the production was lower. Both showed the production characteristics of fractured reservoirs (Figure 15). Hydraulic fracturing can increase the volume of hydraulic fractures in shale reservoirs, connect natural fractures, increase the contact area between fractures and matrix pores, and help the oil in the matrix pores to enter the fractures, thereby increasing production. For example, the initial monthly production of the Y183 vertical well was 7.4 t; after hydraulic fracturing, the monthly production increased to 249.3 t. After fracturing, shale reservoirs showed characteristics of gradual decline as production proceeded, which is similar to that exhibited by fractured reservoirs. For example, the monthly oil production of the Y183 vertical well decreased to 58.9 t after four years of production.

6. Conclusions

(1) The shale oil reservoir has self-generation, self-storage and self-sealing characteristics. The oil shale is rich in organic matter and carbonate minerals, which indicates an excellent hydrocarbon generation index, belongs to high-quality source rock, and has self-generation attributes. Many types of reservoir space are developed including organic pores, inorganic-mineral pores and fractures, which indicate self-storage capacity. Clayey limestone as the roof and floor with interbedded oil shale forms a sandwich-type source–reservoir–caprock assemblage and relatively good sealing space. This assemblage has strong resistance to tectonic stress and is favorable for bitumen storage, which results in the development of pore fluid overpressure.
(2) The shale oil reservoir has characteristics of a multi-scale progressive transport and accumulation network. Bitumen in the free state is stored mainly in organic pores, intercrystalline (intergranular) pores and fractures, and is secondarily distributed in intragranular pores of clay minerals by adsorption. The resistances of bitumen migration include capillary pressure and adsorption resistance, whereas the driving force is mainly pore fluid pressure. The migration patterns of bitumen include subcritical flow and instantaneous flow. Similar to the multi-scale seepage law of shale gas, the vein-type model of the multi-scale progressive transport network is developed because of the multi-scale characteristics of the reservoir space in the shale oil reservoir, where a dominant migration pathway exists.
(3) The shale oil reservoir is a special lithologic reservoir controlled by a sedimentary environment and has self-generation, self-storage and self-sealing characteristics with developed pore fluid overpressure and a multi-scale transport and accumulation network. Shale lithofacies are the main component of the shale oil reservoir, and the sedimentary environment forms the formation foundation. Lacustrine shale lithofacies have different oil potential, reservoir and sealing properties as well as a thin interbedded strata structure caused by sedimentary environment and sedimentary evolution. These conditions generated a sandwich-type source–reservoir–caprock assemblage and formed a special lithologic trap similar to a sandstone lens. In the closed trap environment, a certain pore fluid pressure will drive the multi-scale migration and accumulation of bitumen, but excessive pore fluid pressure will destroy the roof and floor of the shale oil reservoir, which interferes with the bitumen enrichment.

Author Contributions

Conceptualization, C.M. and X.F.; methodology, C.M.; software, X.F.; validation, C.M. and X.F.; formal analysis, X.M.; investigation, X.M.; resources, X.L.; data curation, B.X.; writing—original draft preparation, C.M.; writing—review and editing, X.F.; visualization, X.G.; supervision, C.M.; project administration, C.M.; funding acquisition, C.M. All authors have read and agreed to the published version of the manuscript.

Funding

This research was funded by Natural Science Foundation of China (Grant No. 42172153).

Institutional Review Board Statement

Not applicable.

Informed Consent Statement

Not applicable.

Data Availability Statement

The data presented in this study are available on request from the corresponding author. The data are not publicly available because some of the data involves trade secrets of oilfield companies and cannot be widely disclosed.

Acknowledgments

The authors thank Qiang Jin of China University of Petroleum (East China) for his constructive suggestions on the design of the thermal simulation experiments.

Conflicts of Interest

The authors declare no conflict of interest.

References

  1. Jin, Q.; Zhu, G. Progress in research of deposition of oil source rocks in saline lakes and their hydrocarbon generation. Geol. J. China Univ. 2006, 12, 483–492. [Google Scholar] [CrossRef]
  2. Shi, J.; Jin, Z.; Liu, Q.; Huang, Z. Depositional process and astronomical forcing model of lacustrine fine-grained sedimentary rocks: A case study of the early Paleogene in the Dongying Sag, Bohai Bay Basin. Mar. Pet. Geol. 2020, 113, 103995. [Google Scholar] [CrossRef]
  3. Zou, C.; Tao, S.; Hou, L. Unconventional Petroleum Geology; Geological Publishing House: Beijing, China, 2011; pp. 1–374. [Google Scholar]
  4. Zou, C.; Zhu, R.; Bai, B.; Yang, Z.; Hou, L.; Zha, M.; Fu, J.; Shao, Y.; Liu, K.; Cao, H.; et al. Significance, geologic characteristics, resource potential and future challenges of tight oil and shale oil. Bull. Mineral. Petrol. Geochem. 2015, 34, 3–17. [Google Scholar] [CrossRef]
  5. Montgomery, S.L.; Jarvie, D.M.; Bowker, K.A.; Pollastro, R.M. Mississippian Barnett Shale, Fort Worth Basin, north-central Texas: Gas-shale play with multi-trillion cubic foot potential. AAPG Bull. 2005, 89, 155–175. [Google Scholar] [CrossRef]
  6. Liu, H.; Yu, B.; Xie, Z.; Han, S.; Shen, Z.; Bai, C. Characteristics and implications of micro-lithofacies in lacustrine-basin organic-rich shale: A case study of Jiyang Depression, Bohai Bay Basin. Acta Pet. Sin. 2018, 39, 1328–1343. [Google Scholar] [CrossRef]
  7. Zhao, X.Z.; Zhou, L.H.; Pu, X.G.; Jin, F.M.; Han, W.Z.; Xiao, D.Q.; Chen, S.Y.; Shi, Z.N.; Zhang, W.; Yang, F. Geological characteristics of shale rock system and shale oil exploration breakthrough in a lacustrine basin: A case study from the Paleogene 1st Sub-member of Kong 2 Member in Cangdong Sag, Bohai Bay Basin, China. Pet. Explor. Dev. 2018, 45, 3–14. [Google Scholar] [CrossRef]
  8. Zhou, L.; Pu, X.; Xiao, D.; Li, H.; Guan, Q.; Lin, L.; Qu, N. Geological conditions for shale oil formation and the main controlling factors for the enrichment of the 2nd Member of Kongdian Formation in the Cangdong Sag, Bohai Bay Basin. Nat. Gas Geosci. 2018, 29, 1323–1332. [Google Scholar] [CrossRef]
  9. Chen, X.; Yan, Y.; Zhang, X.; Liu, H.; Xue, X.; Luo, X. Generation conditions of continental shale gas in Biyang sag, Nanxiang Basin. Pet. Geol. Exp. 2011, 33, 137–142. [Google Scholar] [CrossRef] [Green Version]
  10. Li, J.; Shi, Y.; Zhang, X.; Chen, X.; Yan, Y.; Zhu, J.; Lu, S.; Wang, M. Control factors of enrichment and producibility of shale oil: A case study of Biyang Depression. Earth Sci. 2014, 39, 848–857. [Google Scholar] [CrossRef]
  11. Liu, B.; Lv, Y.; Ran, Q.; Dai, C.; Li, M.; Wang, M. Geological conditions and exploration potential of shale oil in Qingshankou Formation, northern Songliao Basin. Oil Gas Geol. 2014, 35, 280–285. [Google Scholar]
  12. Huang, W.; Deng, S.; Lu, S.; Yu, L.; Hu, S.; Zhang, J. Shale organic heterogeneity evaluation method and its application to shale oil resource evaluation—A case study from Qingshankou Formation, southern Songliao Basin. Oil Gas Geol. 2014, 35, 704–711. [Google Scholar] [CrossRef]
  13. Liu, B.; Lv, Y.; Zhao, R.; Tu, X.; Guo, X.; Shen, Y. Formation overpressure and shale oil enrichment in the shale system of Lucaogou Formation, Malang Sag, Santanghu Basin, nw China. Pet. Explor. Dev. 2012, 39, 744–750. [Google Scholar] [CrossRef]
  14. Liu, B.; Chi, Y.; Huang, Z.; Luo, Q.; Wu, H.; Chen, X.; Shen, Y. Migration mechanism of the Permian hydrocarbon and shale oil accumulation in Malang Sag, the Santanghu Basin. Oil Gas Geol. 2013, 34, 725–730. [Google Scholar] [CrossRef]
  15. Liu, B.; Lv, Y.; Meng, Y.; Li, X.; Guo, X.; Ma, Q.; Zhao, W. Petrologic characteristics and genetic model of lacustrine lamellar fine-grained rock and its significance for shale oil exploration: A case study of Permian Lucaogou Formation in Malang Sag, Santanghu Basin, nw China. Pet. Explor. Dev. 2015, 42, 656–666. [Google Scholar] [CrossRef]
  16. Qiu, Z.; Shi, Z.; Dong, D.; Lu, B.; Zhang, C.; Zhou, J.; Wang, H.; Xiong, B.; Pang, Z.; Guo, H. Geological characteristics of source rock and reservoir of tight oil and its accumulation mechanism: A case study of Permian Lucaogou Formation in Jimusar Sag, Junggar Basin. Pet. Explor. Dev. 2016, 43, 1013–1024. [Google Scholar] [CrossRef]
  17. Song, Y.; Zhou, L.; Guo, X.; Chang, Q.S.; Wang, X. Characteristics and occurrence of lacustrine dolomitic tight-oil reservoir in the middle Permian Lucaogou Formation, Jimusaer Sag, southeastern Junggar Basin. Acta Petrol. Sin. 2017, 33, 1159–1170. [Google Scholar]
  18. Li, S.; Pang, X.; Li, M.; Jin, Z. Geochemistry of petroleum systems in the Niuzhuang south slope of Bohai Bay Basin—Part 1: Source rock characterization. Org. Geochem. 2003, 34, 389–412. [Google Scholar] [CrossRef]
  19. Lewan, M.D.; Roy, S. Role of water in hydrocarbon generation from type-I kerogen in mahogany oil shale of the Green River Formation. Org. Geochem. 2011, 42, 31–41. [Google Scholar] [CrossRef]
  20. Wang, M.; Lu, S.; Xue, H. Kinetic simulation of hydrocarbon generation from lacustrine type I kerogen from the Songliao Basin: Model comparison and geological application. Mar. Pet. Geol. 2011, 28, 1714–1726. [Google Scholar]
  21. Burton, D.; Woolf, K.; Sullivan, B. Lacustrine depositional environments in the Green River Formation, Uinta Basin: Expression in outcrop and wireline logs lacustrine depositional environments, Uinta Basin. AAPG Bull. 2014, 98, 1699–1715. [Google Scholar] [CrossRef]
  22. Loucks, R.G.; Reed, R.M.; Ruppel, S.C.; Jarvie, D.M. Morphology, genesis, and distribution of nanometer-scale pores in siliceous mudstones of the Mississippian Barnett Shale. J. Sediment. Res. 2009, 79, 848–861. [Google Scholar] [CrossRef] [Green Version]
  23. Loucks, R.G.; Reed, R.M.; Ruppel, S.C.; Hammes, U. Spectrum of pore types and networks in mudrocks and a descriptive classification for matrix-related mudrock pores. AAPG Bull. 2012, 96, 1071–1098. [Google Scholar] [CrossRef] [Green Version]
  24. Slatt, R.M.; O’Brien, N.R. Pore types in the Barnett and Woodford gas shales: Contribution to understanding gas storage and migration pathways in fine-grained rocks. AAPG Bull. 2011, 95, 2017–2030. [Google Scholar] [CrossRef]
  25. Chalmers, G.R.; Bustin, R.M.; Power, I.M. Characterization of gas shale pore systems by porosimetry, pycnometry, surface area, and field emission scanning electron microscopy/transmission electron microscopy image analyses: Examples from the Barnett, Woodford, Haynesville, Marcellus, and Doig units. AAPG Bull. 2012, 96, 1099–1119. [Google Scholar] [CrossRef]
  26. Javadpour, F.; Moravvej Farshi, M.; Amrein, M. Atomic-force microscopy: A new tool for gas-shale characterization. J. Can. Pet. Technol. 2012, 51, 236–243. [Google Scholar] [CrossRef]
  27. Clarkson, C.R.; Solano, N.; Bustin, R.M.; Bustin, A.M.M.; Chalmers, G.R.L.; He, L.; Melnichenko, Y.B.; Radliński, A.P.; Blach, T.P. Pore structure characterization of North American shale gas reservoirs using USANS/SANS, gas adsorption, and mercury intrusion. Fuel 2013, 103, 606–616. [Google Scholar] [CrossRef]
  28. Wang, Y.; Pu, J.; Wang, L.; Wang, J.; Jiang, Z.; Song, Y.; Wang, C.; Wang, Y.; Jin, C. Characterization of typical 3D pore networks of Jiulaodong formation shale using nano-transmission X-ray microscopy. Fuel 2016, 170, 84–91. [Google Scholar] [CrossRef]
  29. Liu, S.; Sang, S.; Wang, G.; Ma, J.; Wang, X.; Wang, W.; Du, Y.; Wang, T. FIB-SEM and X-ray CT characterization of interconnected pores in high-rank coal formed from regional metamorphism. J. Pet. Sci. Eng. 2017, 148, 21–31. [Google Scholar] [CrossRef] [Green Version]
  30. Desbois, G.; Urai, J.L.; Kukla, P.A.; Konstanty, J.; Baerle, C. High-resolution 3D fabric and porosity model in a tight gas sandstone reservoir: A new approach to investigate microstructures from mm-to nm-scale combining argon beam cross-sectioning and SEM imaging. J. Pet. Sci. Eng. 2011, 78, 243–257. [Google Scholar] [CrossRef]
  31. Golab, A.; Ward, C.R.; Permana, A.; Lennox, P.; Botha, P. High-resolution three-dimensional imaging of coal using microfocus X-ray computed tomography, with special reference to modes of mineral occurrence. Int. J. Coal Geol. 2013, 113, 97–108. [Google Scholar] [CrossRef]
  32. Tang, X.; Jiang, Z.; Jiang, S.; Li, Z. Heterogeneous nanoporosity of the Silurian Longmaxi Formation shale gas reservoir in the Sichuan Basin using the QEMSCAN, FIB-SEM, and nano-CT methods. Mar. Pet. Geol. 2016, 78, 99–109. [Google Scholar] [CrossRef]
  33. Takbiri-Borujeni, A.; Fathi, E.; Kazemi, M.; Belyadi, F. An integrated multiscale model for gas storage and transport in shale reservoirs. Fuel 2019, 237, 1228–1243. [Google Scholar] [CrossRef]
  34. Hu, Q.; Ewing, R.P.; Rowe, H.D. Low nanopore connectivity limits gas production in Barnett Formation. J. Geophys. Res. Solid Earth 2015, 120, 8073–8087. [Google Scholar] [CrossRef]
  35. Ghanbarian, B.; Javadpour, F. Upscaling pore pressure-dependent gas permeability in shales. J. Geophys. Res. Solid Earth 2017, 122, 2541–2552. [Google Scholar] [CrossRef]
  36. Javadpour, F.; Fisher, D.; Unsworth, M. Nanoscale gas flow in shale gas sediments. J. Can. Pet. Technol. 2007, 46, 55–61. [Google Scholar] [CrossRef]
  37. Deng, J.; Zhu, W.; Ma, Q. A new seepage model for shale gas reservoir and productivity analysis of fractured well. Fuel 2014, 124, 232–240. [Google Scholar] [CrossRef]
  38. Li, Y.; Jiang, Y.; Zhao, J.; Liu, C.; Zhang, L. Extended finite element method for analysis of multi-scale flow in fractured shale gas reservoirs. Environ. Earth Sci. 2015, 73, 6035–6045. [Google Scholar] [CrossRef]
  39. Figueroa Pilz, F.; Dowey, P.J.; Fauchille, A.L.; Courtois, L.; Bay, B.; Ma, L.; Lee, P.D. Synchrotron tomographic quantification of strain and fracture during simulated thermal maturation of an organic-rich shale UK Kimmeridge Clay: Journal of Geophysical Research. Solid Earth 2017, 122, 2553–2564. [Google Scholar] [CrossRef] [Green Version]
  40. O’Brien, N.R.; Cremer, M.D.; Canales, D.G. The role of argillaceous rock fabric in primary migration of oil. Gulf Coast Assoc. Geol. Soc. Trans. 2002, 52, 1103–1112. [Google Scholar]
  41. Martin, R.; Baihly, J.; Malpani, R.; Lindsay, G.; Atwood, W.K. Understanding production from Eagle Ford-Austin chalk system. In Proceedings of the SPE Annual Technical Conference and Exhibition, Denver, CO, USA, 30 October–2 November 2011. [Google Scholar]
  42. Jarvie, D.M. Shale resource systems for oil and gas: Part 2—Shale-oil resource systems. In Shale Reservoirs–Giant Resources for the 21st Century; AAPG: Tulsa, OK, USA, 2012; pp. 89–119. [Google Scholar] [CrossRef]
  43. Gong, X.; Tian, Y.; McVay, D.A.; Ayers, W.B.; Lee, W.J. Assessment of Eagle Ford Shale oil and gas resources. In SPE Unconventional Resources Conference Canada; Society of Petroleum Engineers: Calgary, AB, Canada, 2013. [Google Scholar]
  44. Ning, F. The main control factors of shale oil enrichment in Jiyang depression. Acta Pet. Sin. 2015, 36, 905–914. [Google Scholar] [CrossRef]
  45. Shao, L.; Zhang, P.; Hilton, J.; Gayer, R.; Wang, Y.; Zhao, C.; Luo, Z. Paleoenvironments and paleogeography of the Lower and lower Middle Jurassic coal measures in the Turpan-Hami oil-prone coal basin, northwestern China. AAPG Bull. 2003, 87, 335–355. [Google Scholar] [CrossRef]
  46. Meng, M.; Ge, H.; Shen, Y.; Ji, W.; Li, Z. Insight into water occurrence and pore size distribution by nuclear magnetic resonance in marine shale reservoirs, southern China. Energy Fuels 2023, 37, 319–327. [Google Scholar] [CrossRef]
  47. Cao, Y.; Jiang, Z. Relationship between hydrocarbon reservoir and genetic types of sequence boundary in rift lacustrine basin. J. China Univ. Pet. 2004, 28, 1–6. [Google Scholar]
  48. Yang, W.; Jiang, Y.; Wang, Y. Study on shale facies sedimentary environment of lower Es3-upper Es4 in Dongying sag. J. China Univ. Pet. 2015, 39, 19–26. [Google Scholar] [CrossRef]
  49. Ma, C.; Dong, C.; Luan, G.; Lin, C.; Liu, X.; Elsworth, D. Type, characteristics and effect of natural fluid pressure fractures in shale: A case study of the Paleogene strata in Eastern China. Pet. Explor. Dev. 2016, 44, 580–589. [Google Scholar] [CrossRef]
  50. Chu, W. Research on the development of shale oil and the fluctuation of international crude oil price. In Proceedings of the 2nd International Conference on Shale Oil Resources and Development Technologies, Beijing, China, 28 April 2019. [Google Scholar]
  51. Li, D.; Liu, Z.; Zhang, G.; Zheng, Z.; Jia, J.; Gao, Y.; Zan, X. Comparison and revelation of tight oil accumulation conditions, distribution characteristics and development status between China and U.S. Nat. Gas Geosci. 2017, 28, 1126–1138. [Google Scholar]
  52. Birdwell, J.E.; Vanden Berg, M.D.; Johnson, R.C.; Mercier, T.J.; Boehlke, A.; Brownfield, M.E. Geological, geochemical and reservoir characterization of the Uteland Butte member of the Green River Formation, Uinta Basin, Utah. In Hydrocarbon Source Rocks in Unconventional Plays, Rocky Mountain Region; Dolan, M.P., Higley, D.K., Lillis, P.G., Eds.; Rocky Mountain Association of Geologists: Denver, CO, USA, 2016; Chapter 12; pp. 352–378. [Google Scholar]
  53. Li, M.Y.; Zhu, R.K.; Hu, S.Y. Geological characteristics and resource potential of overseas terrestrial shale oil. Lithol. Reserv. 2022, 34, 163–174. [Google Scholar] [CrossRef]
  54. Meng, M.; Peng, J.; Ge, H.; Ji, W.; Li, X.; Wang, Q. Rock fabric of lacustrine shale and its influence on residual oil distribution in the Upper Cretaceous Qingshankou Formation, Songliao Basin. Energy Fuels 2023, 37, 7151–7160. [Google Scholar] [CrossRef]
  55. Gall, R.D.; Birdwell, J.E.; Brinkerhoff, R.; Vanden Berg, M.D. Geologic characterization and depositional history of the Uteland Butte Member, Green River Formation, southwestern Uinta Basin, Utah in The lacustrine Green River Formation: Hydrocarbon potential and Eocene climate record. Utah Geol. Assoc. 2022, 50, 37–62. [Google Scholar] [CrossRef]
  56. Hou, D.; Zhang, S.; Xiao, J. The excellent source rocks and accumulation of stratigraphic and lithologic traps in the Jiyang depression, Bohai bay basin, China. Earth Sci. Front. 2008, 15, 137–146. [Google Scholar]
  57. Zhu, G.; Jin, Q. Geochemical characteristics of two sets of excellent source rocks in Dongying Depression. Acta Sedimentol. Sinica 2003, 21, 506–512. [Google Scholar] [CrossRef]
  58. Kirkland, D.W.; Evans, R. Source-rock potential of evaporitic environment. AAPG Bull. 1981, 65, 181–190. [Google Scholar] [CrossRef]
  59. Katz, B.J.; Bissada, K.K.; Wood, J.W. Factors limiting potential of evaporites ashydrocarbon source rocks. SEG Tech. Program Expand. Abstr. 1987, 6, 923. [Google Scholar] [CrossRef]
  60. Sun, Z.C.; Yang, F.; Zhang, Z.H.; Li, S.J.; Li, D.M.; Peng, L.C.; Zeng, X.L.; Xu, Y.L.; Mao, S.Z.; Wang, Q. Sedimentary Environment and Oil-Gas Generation of CenozoicSaline Lakes in China; Petroleum Industry Press: Beijing, China, 1997; pp. 1–338. [Google Scholar]
  61. Jin, Q.; Zhu, G.Y.; Wang, J. Deposition and distribution of high-potential sourcerocks in saline lacustrine environments. J. China Univ. Pet. 2008, 32, 19–23. [Google Scholar]
  62. Liu, C.Y.; Zhao, J.F.; Ma, Y.P.; Xiong, L.F.; Chen, J.J.; Mao, G.Z.; Zhang, D.D.; Deng, Y. The advances and problems in the study of the characteristics and formation ofhydrocarbon-rich sag. Earth Sci. Front. 2014, 21, 75–88. [Google Scholar]
  63. Guo, P.; Liu, C.Y.; Gibert, L.; Huang, L.; Zhang, D.W.; Dai, J. How to find high-quality petroleum source rocks in saline lacustrine basins: A case study from the Cenozoic Qaidam Basin, NW China. Mar. Pet. Geol. 2020, 111, 603–623. [Google Scholar] [CrossRef]
  64. Tang, L.; Song, Y.; Pang, X.P.; Jiang, Z.X.; Guo, Y.C.; Zhang, H.G.; Pan, Z.H.; Jiang, H. Effects of paleo sedimentary environment in saline lacustrine basin on organic matter accumulation and preservation: A case study from the Dongpu Depression, Bohai Bay Basin, China. J. Pet. Sci. Eng. 2020, 185, 106669. [Google Scholar] [CrossRef]
  65. Ma, C.; Dong, C.; Luan, G.; Lin, C.; Liu, X.; Duan, H.; Liu, S. Characteristics and influencing factors of organic matter pores in paleogene shale, Subei Basin. J. China Univ. Pet. 2017, 41, 1–13. [Google Scholar] [CrossRef]
  66. Wang, G.; Liu, H.; Xiong, Z.; Wang, J. Control condition of felsic on brittleness of lacustrine shales. J. China Univ. Pet. 2016, 40, 1–8. [Google Scholar] [CrossRef]
  67. Tian, H.; Zhang, S.; Liu, S.; Zhang, H. Determination of organic-rich shale pore features by mercury injection and gas adsorption methods. Acta Pet. Sin. 2012, 33, 419–427. [Google Scholar] [CrossRef]
  68. Cardott, B.J.; Landis, C.R.; Curtis, M.E. Post-oil solid bitumen network in the Woodford Shale, USA—A potential primary migration pathway. Int. J. Coal Geol. 2015, 139, 106–113. [Google Scholar] [CrossRef]
  69. Zhang, X.; Lu, X.; Zhang, L.; Liu, Q. Occurrences of shale gas and their petroleum geological significance. Adv. Earth Sci. 2010, 25, 597–604. [Google Scholar] [CrossRef]
  70. Zhang, J.; Lin, L.; Li, Y.; Tang, X.; Zhu, L.; Xing, Y.; Jiang, S.; Jing, T.; Yang, S. Classification and evaluation of shale oil. Earth Sci. Front. 2012, 19, 322–331. [Google Scholar]
  71. Lv, Y.; Zhang, S.; Wang, Y. Research of quantitative relations between sealing ability and thickness of cap rock. Acta Pet. Sin. 2000, 21, 27–30. [Google Scholar] [CrossRef]
  72. Zhang, L.; Bao, Y.; Liu, Q.; Zhang, S.; Zhu, R.; Zhang, L. Effects of hydrocarbon physical properties on caprock’s capillary sealing ability. Sci. China Earth Sci. 2010, 53, 665–671. [Google Scholar] [CrossRef]
  73. Meng, M.; Ge, H.; Shen, Y.; Ji, W.; Wang, Q. Rock fabric of tight sandstone and its influence on irreducible water saturation in Eastern Ordos Basin. Energy Fuels 2023, 37, 3685–3696. [Google Scholar] [CrossRef]
  74. Bredehoeft, J.D.; Wesley, J.B.; Fouch, T.D. Simulations of the origin of fluid pressure, fracture generation, and the movement of fluids in the Uinta Basin, Utah. AAPG Bull. 1994, 78, 1729–1747. [Google Scholar] [CrossRef]
  75. Hao, S.; Liu, G.; Huang, Z.; Gao, Y. Simulation models for primary hydrocarbon migration. Acta Pet. Sin. 1994, 15, 21–31. [Google Scholar] [CrossRef]
  76. Wang, X.; Zhou, D.; Wang, X. Intermittent fracturing migration of pore fluids-one of the major regime of primary migration of petroleum. Pet. Explor. Dev. 1994, 21, 20–26. [Google Scholar]
  77. Kobchenko, M.; Panahi, H.; Renard, F.; Dysthe, D.K.; Malthe-Sørenssen, A.; Mazzini, A.; Scheibert, J.; Jamtveit, B.; Meakin, P. 4D imaging of fracturing in organic-rich shales during heating: Journal of Geophysical Research. Solid Earth 2011, 116, 1–9. [Google Scholar] [CrossRef]
  78. Durand, B. Understanding of HC migration in sedimentary basins (present state of knowledge). Org. Geochem. 1988, 13, 445–459. [Google Scholar] [CrossRef]
  79. Loucks, R.G.; Ruppel, S.C. Mississippian Barnett Shale: Lithofacies and depositional setting of a deep-water shale-gas succession in the Fort Worth Basin, Texas. AAPG Bull. 2007, 91, 579–601. [Google Scholar] [CrossRef] [Green Version]
  80. Javadpour, F. Nanopores and apparent permeability of gas flow in mudrocks (shales and siltstone). J. Can. Pet. Technol. 2009, 48, 16–21. [Google Scholar] [CrossRef]
  81. Sondergeld, C.H.; Newsham, K.E.; Comisky, J.T.; Rice, M.C.; Rai, C.S. Petrophysical considerations in evaluating and producing shale gas resources. In SPE Unconventional Gas Conference; SPE: Pittsburgh, PA, USA, 2010; p. 131768. [Google Scholar]
  82. Murray, C.D. The physiological principle of minimum work I. The vascular system and the cost of blood volume. Proc. Natl. Acad. Sci. USA 1926, 12, 207–214. [Google Scholar] [CrossRef]
  83. Deng, H.; Qian, K. Analysis on Sedimentary Geochemistry and Environment; Science Technology Press: Lanzhou, China, 1993; p. 154. [Google Scholar]
  84. Loucks, R.G.; Reed, R.M. Scanning-electron-microscope petrographic evidence for distinguishing organic-matter pores associated with depositional organic matter versus migrated organic matter in mudrock. Gulf Coast Assoc. Geol. Soc. J. 2014, 3, 51–60. [Google Scholar]
  85. Shao, L.; Xiao, Z.; Lu, J.; He, Z.; Wang, H.; Zhang, P. Permo-Carboniferous coal measures in the Qinshui Basin: Lithofacies paleogeography and its control on coal accumulation. Front. Earth Sci. China 2007, 1, 106–115. [Google Scholar] [CrossRef]
Figure 1. Overview of research area.
Jmse 11 01441 g001
Figure 2. Sequence stratigraphic column for the Dongying Sag (the data was from [1,47,48,49]).
Jmse 11 01441 g002
Figure 3. Petrological characteristics of oil shale. (a) Parallel calcite veins in core; FY1 well, 3180.33 m. (b) Parallel calcite veins under a polarizing microscope, 50×(−); FY1 well, 3181.88 m. (c) Calcite (the main mineral) and quartz (second most abundant mineral) in the 2D whole-mineral scan by FE-SEM; L69 well, 3027.30 m.
Jmse 11 01441 g003
Figure 4. Distribution of rock components in the shale. The images were obtained by FE-SEM. (a) Pores distributed in the mineral matrix; L69 well, 3027.30 m. (b) Associated minerals and pores in different proportions as shown by the whole-mineral scan; well L69, 3027.30 m. (c) Associated minerals and pores; well L69, 3048.10 m.
Jmse 11 01441 g004
Figure 5. Types of effective reservoir spaces in shale oil reservoir. (ae,i,j) were obtained by FE-SEM; (fh,k,l) are polarizing microscope images. (a) Organic pore; L69 well, 3059.35 m. The experimental temperature and pressure of the sample were 200 °C and 1 MPa, respectively. (b) Intracrystalline pore; L69 well, 3053.20 m. The experimental temperature and pressure of the sample were 200 °C and 20 MPa, respectively. (c) Intergranular pore; L69 well, 3053.20 m. The experimental temperature and pressure of the sample were 150 °C and 15 MPa, respectively. (d) Intergranular dissolved pore; L69 well, 3053.20 m. The experimental temperature and pressure of the sample were 150 °C and 15 MPa, respectively. (e) Intergranular pore developed; L69 well, 3048.10 m. (f) Intercrystalline pore, 200×(−); FY1 well, 3168.03 m. (g) Intercrystalline pore, 200×(−); FY1 well, 3143.98 m. (h) Bedding-parallel vein fracture, 100×(−); NY1 well, 3432.17 m. (i) Bedding-parallel vein fracture; L69 well, 3048.10 m. (j) Expulsion fracture; L69 well, 3053.20 m. The experimental temperature and pressure of the sample were 200 °C and 20 MPa, respectively. (k) Expulsion fracture, 100×(−); FY1 well, 3209.09 m. (l) Bedding and structural fractures, 100×(−); FY1 well, 3168.03 m.
Jmse 11 01441 g005
Figure 6. Source–reservoir–caprock assemblage of multi-scale sandwich-type structure in shale oil reservoir. (a) Interbedded clayey limestone and oil shale; FY1 well, 3177.03–3182.03 m. (b) Clayey limestone intercalated with oil shale interlayer; LY1 well, 3766.61–3769.61 m. (c) Flaggy clayey limestone and oil shale; FY1 well, 3201.50 m. (d) Calcite veins limited in layers or distributed on the interface in the assemblage; FY1 well, 3180.63 m. (e) Micritic calcite laminae alternating with organic-rich and terrigenous clastic-rich laminae under a polarizing microscope, 25×(−); NY1 well, 3345.29 m. (f) Sealing laminae alternating with oil-generation and reservoir laminae under a polarizing microscope, 50×(−); NY1 well, 3390.10 m.
Jmse 11 01441 g006
Figure 7. Occurrence of bitumen in the shale samples after thermal simulation experiments shown in FE-SEM images. (ac) Oil drop formed in the sample. (a) The experimental temperature and pressure of the sample were 500 °C and 1 MPa, respectively; HX4 well, 2302.60 m. (b) The experimental temperature and pressure of the sample were 600 °C and 1 MPa, respectively; X28 well, 3652.73 m. (c) The experimental temperature and pressure of the sample were 600 °C and 1 MPa, respectively; HX4 well, 2302.60 m. (df) Bitumen migrating from the samples. (d) The experimental temperature and pressure of the sample were 150 °C and 15 MPa, respectively; L69 well, 3053.20 m. (e) The experimental temperature and pressure of the sample were 600 °C and 1 MPa, respectively; HX28 well, 3652.73 m. (f) The experimental temperature and pressure of the sample were 500 °C and 1 MPa, respectively; L69 well, 3048.10 m. (gi) Bitumen generated from kerogen and migrating into the pore. (g) The experimental temperature and pressure of the sample were 300 °C and 30 MPa, respectively; L69 well, 3053.20 m. (h) The experimental temperature and pressure of the sample were 400 °C and 1 MPa; L69 well, 3048.10 m. (i) The experimental temperature and pressure of the sample were 500 °C and 1 MPa, respectively; L69 well, 3048.10 m. (jl) Bitumen adsorbed by clay minerals. The experimental temperature and pressure of the sample were 600 °C and 1 MPa, respectively; L69 well, 3048.10 m.
Jmse 11 01441 g007
Figure 8. Schematic diagram of dynamic force and resistance in the process of bitumen migration. (a) Bitumen is displaced from kerogen into nearby reservoir space and migrates in a hor-izontal direction. (b) The migration of bitumen displacing water overcomes adsorption resistance of bitumen. (c) The migration of bitumen displacing water overcomes capillary pressure. (d) The migration of bitumen displacing water overcomes adsorption resistance of water.
Jmse 11 01441 g008
Figure 9. Relationship between the hydrocarbon generation rate and the migration pattern. (Aa) The pore fluid pressure is smaller than the displacement pressure and the rock’s fracture strength. (Ab) The pore fluid pressure is larger than the displacement pressure but smaller than the rock’s fracture strength. (Ac) The pore fluid pressure is larger than the displacement pressure and the rock’s fracture strength. (Ba) The pore fluid pressure is smaller than the displacement pressure and the rock’s fracture strength. (Bb) The pore fluid pressure is larger than the rock’s fracture strength. (Bc) The pore fluid pressure is larger than the rock’s fracture strength.
Jmse 11 01441 g009
Figure 10. Migration patterns of shale oil in the original or thermal simulated samples by FE-SEM. (a) Bitumen detained in an intracrystalline pore of clay mineral; L69 well, 3053.20 m. The experimental temperature and pressure of the sample were 200 °C and 20 MPa, respectively. (b) Bitumen breaking through and migrating in an intracrystalline pore of calcite; L69 well, 3048.10 m. (c) Expulsion fractures formed with the core of kerogen extending in the parallel direction; L69 well, 3053.20 m. The experimental temperature and pressure of the sample were 200 °C and 20 MPa, respectively.
Jmse 11 01441 g010
Figure 11. Characteristics of multi-scale migration and accumulation of bitumen in shale reservoir. (ac,gl) are polarizing microscope images; (df) are FE-SEM images. (a) Bitumen migration from kerogen, 100×(−); FY1 well, 3116.48 m. (b) Bitumen entering intercrystalline (intergranular) pore next to kerogen, 200×(−); FY1 well, 3116.48 m. (c) Bitumen breaking through intercrystalline (intergranular) pore and migrating farther outside; 500×(−); FY1 well, 3116.48 m. (d) Bitumen migrating from kerogen through organic pore; L69 well, 3053.20 m. The experimental temperature and pressure of the sample were 300 °C and 30 MPa, respectively. (e) Bitumen migrating from organic pore and breaking through adjacent nano-scale intergranular pore; A6 well, 3060.50 m. (f) Bitumen accumulation in macro-scale intercrystalline (intergranular) pore; L69 well, 3053.20 m. The experimental temperature and pressure of the sample were 250 °C and 25 MPa, respectively. (g) Kerogen converging to an expulsion fracture to form an organic-matter network, 100×(−); FY1 well, 3040.26 m. (h) Kerogen mutual attraction forming an organic-matter network, 100×(−); FY1 well, 3046.53 m. (i) Kerogen converging to an expulsion fracture to form an organic-matter network, 100×(−); FY1 well, 3045.23 m. (j) Expulsion fracture filled with bitumen in the organic-matter network, 50×(−); FY1 well, 3040.26 m. (k) Intercrystalline pore of calcite vein filled with bitumen in bedding-parallel vein fracture, 50×(−); FY1 well, 3183.08 m. (l) Bitumen breaking through and migrating in bedding and structural fractures, converging to larger scale of structural fractures, 50×(−); FY1 well, 3168.03 m.
Jmse 11 01441 g011
Figure 12. Different reservoir space types and flow characteristics of the shale gas reservoir (the figure was modified after [81]).
Jmse 11 01441 g012
Figure 13. Vein-type model of multi-scale progressive transport network in shale oil reservoir. Except for (l), the images were obtained by FE-SEM. (a) Bitumen is formed by hydrocarbon generation and migrates from the sample; L69 well, 3053.20 m. The experimental temperature and pressure of the sample were 200 °C and 20 MPa, respectively. (b) Organic pores developed in the kerogen; L69 well, 3053.20 m. (c) Intergranular pores located in the framework of quartz; L69 well, 3053.20 m. (d) Intercrystalline pores located in the framework of calcite; L69 well, 3694.03.60 m. (e) Intercrystalline pores located in the framework of pyrite; L69 well, 3048.10 m. (f) Intracrystalline pores developed in the clay minerals; L69 well, 3053.20 m. (g) Dissolved pores developed in the feldspar; L69 well, 3053.20 m. The experimental temperature and pressure of the sample were 200 °C and 20 MPa, respectively. (h) Intracrystalline dissolved pores developed in the dolomite; L69 well, 3059.35 m. The experimental temperature and pressure of the sample were 600 °C and 1 MPa, respectively. (i) Expulsion fracture connected with kerogen; L69 well, 3053.20 m. (j) Bedding-parallel vein fractures filled with calcite developed in the shale; L69 well, 3048.10 m. (k) Bedding fractures developed in the shale; well L69, 3059.35 m. (l) Structural fractures filled with bitumen in the shale in polarizing microscopy image; 25×(−), FY1 well, 3168.99 m.
Jmse 11 01441 g013
Figure 14. Discrete model of lacustrine shale oil reservoir. FSST: Falling-stage systems tract; HST: Highstand systems tract; CS: Condensed section; TST: Transgressive systems tract; LST: Lowstand systems tract.
Jmse 11 01441 g014
Figure 15. Single well development characteristics of lacustrine shale oil reservoir.
Jmse 11 01441 g015
Table 1. Comparison of geological parameters of main shale oil reservoirs in North America and China [50,51,52,53,54,55].
Contrast ParameterNorth AmericaChina
Reservoir propertiesShale setWolfcamp
(Permian Basin)
BakkenEagle FordUteland Butte Member, Lower Green River Formation (Uinta Basin)Shahejie Formation (Jiyang Depression)Yanchang Formation (Ordos Basin)Kongdian Formation
(Huanghua Depression)
Sedimentary environmentmarine faciesmarine faciesmarine facieslacustrine faciessalinized lacustrine facieslacustrine facieslacustrine facies
Lithologycarbonate rocks, shalecarbonate rocks, siltstone, shalecarbonate rocks, calcareous shaleclayey limestone, clayey dolostone, calcareous shaleclayey limestone, calcareous shalefine sandstone, siltstone, shalesiltstone, shale
Depth/m2500–31002400–30001200–37001000–30002000–39001600–29003200–3600
Thickness/m20–1505–127515–13020–4005–15200–400
Toc/%2–95–102–122–51.2–162–10>2
Ro/%0.7–0.90.5–1.30.45–1.40.55–1.100.5–1.30.9–1.10.6–1.1
Porosity/%4–124–108–123–203–162–125–10
Permeability/mD0.01–1.00.01–0.10.01–1.00.004–0.337<0.10.01–0.20.12
Fluid
properties
Formation pressure coefficient1.1–1.21.2–1.51.35–1.81.0–1.81.1–2.00.77–0.840.9–1.2
Crude oil density/(g/cm3)0.71–0.810.78–0.830.77–0.870.82–0.880.82–0.920.80–0.860.86–0.89
Crude oil viscosity/mPa·s149.5–666.62–100.01–11–44–1265.5–6.410.4–23.5
Gas-oil ratio (m3/m3)50–14050–37590–2100-8–9795–12568.5–97.5
Table 2. Types of organic matter and rock pyrolysis parameters.
Kerogen Type Ro/%TOC/%S1/(mg/g)S2/(mg/g)S1 + S2/(mg/g)
I, II1minimum0.54.031.0317.5918.97
maximum1.012.810.078.5982.65
average0.86.414.5741.2845.85
Table 3. Classification schemes of shale reservoir space.
OriginPrimary PoreSecondary Pore
Location
PoreInorganic-mineral poreIntercrystalline (intergranular) poreIntergranular pore of felsic mineralIntergranular dissolved pore of felsic mineral
Intercrystalline pore of carbonate mineralIntercrystalline (dissolved) pore of carbonate mineral
Intercrystalline pore of pyriteIntercrystalline (dissolved) pore of pyrite
Intracrystalline (intragranular) poreIntracrystalline pore of clay mineralIntracrystalline (dissolved) pore of clay mineral
Intracrystalline pore of carbonate mineralIntracrystalline (dissolved) pore of carbonate mineral
Intragranular pore of felsic mineralIntragranular dissolved pore of felsic mineral
Organic poreInternal pore in organic matter
Marginal pore in organic matter
Boundary pore in organic matter
FractureStructural fracture
Bedding fracture
Shrinkage fracture
Dissolved fracture
Natural fluid pressure fracture
Disclaimer/Publisher’s Note: The statements, opinions and data contained in all publications are solely those of the individual author(s) and contributor(s) and not of MDPI and/or the editor(s). MDPI and/or the editor(s) disclaim responsibility for any injury to people or property resulting from any ideas, methods, instructions or products referred to in the content.

