Abstract
An autonomous ship refers to a ship that achieves autonomous operation in ship navigation, management, maintenance, cargo transportation and other aspects. Due to the uncertainty in the risks posed by autonomous ship navigation, its risk assessment attracts great attention from researchers. By analyzing the historical accident statistics, this paper gives a comprehensive analysis from the perspective of “Man-Ship-Environment-Management”. In addition, a quantitative evaluation method based on the Entropy–TOPSIS–Coupling coordination model is proposed, which presents a comprehensive assessment of the risks of autonomous ship navigation safety. Furthermore, scientific forecasts and suggestions for improvement are put forward according to the evaluation results.
1. Introduction
As the most important mode of transportation, the safety of maritime transportation has acquired extensive attention from society. To further ensure the safety of maritime cargo transportation, reduce the labor and operating costs, and promote the continuous growth of trade volume and economic benefits, the autonomous ship has emerged as the times require. However, the navigation risk of autonomous ships is an inevitable problem [1,2,3,4]. Therefore, the way to identify the navigation risks of autonomous ships and to take targeted measures to reduce the probability of traffic accidents and possible losses is of great significance for ensuring the navigation safety of autonomous ships and improving the navigation environment. Through the prediction of navigation risk and dealing with navigation hazards properly, the results of the risk evaluation will provide a reliable theoretical and practical support for a sustainable development of autonomous ships.
Currently, navigation risk assessment methods are mainly carried out on traditional manned ships, whereas autonomous ship risk assessment methods are rarely considered. In the risk assessment [5,6,7,8], the International Maritime Organization (IMO) introduced and applied methods and concepts of standardized Formal Safety Assessment (FSA) to the maritime community. Moreover, they requested that the member states actively carry out applied research in the field of ship safety.
In 2015, Zhao et al. [9] first summarized the evaluation methods for ship safety from the perspective of analysis tools and research approaches, then divided them into five categories: (1) Evaluation methods based on probability theory and mathematical statistics. E.g., Hu et al. [10] first introduced the probabilistic impact map into the safety assessment of offshore platforms and verified its applicability. However, this kind of method focuses on investigating the navigation safety status based on the accident occurrence, which leads to some difficulties in generating a comprehensive assessment. Moreover, the safety assessment obtained by this method remains in the post-evaluation stage because of the seldom consideration of system risk factors. (2) Evaluation methods based on logical reasoning, including fault tree analysis [11], Bayesian analysis [12] and other methods. This kind of evaluation can analyze the influence degree and correlation degree of various risk factors. Moreover, it is easy to find potential problems and it is conducive to formulating targeted safety improvement measures. However, the reasoning process is complex and the workload is large, while the evaluation accuracy strictly depends on the relationship between events. (3) Evaluation methods based on fuzzy theory. The comprehensive fuzzy evaluation system was first established by Wang et al. [13] in 2004. Furthermore, the gray theory analysis method was first proposed by Zhang et al. [14] in 2013 for the navigation safety assessment of ships in heavy wind and waves. However, this kind of method has some defects such as subjective intervention and limited sample data. (4) Evaluation methods based on neural networks. This kind of method can effectively solve the nonlinear mapping between evaluation objectives and factors. Moreover, it can overcome the impact of subjective factors. However, the evaluation process is invisible and the evaluation results are relatively simple, which cannot fully describe the security situation. (5) Evaluation methods based on Formal Safety Assessment (FSA) [5]. This kind of method is a systematic and standardized comprehensive evaluation method. According to the characteristics of the system, reasonable indicators and methods can be selected at different stages of the evaluation. Therefore, it has strong flexibility and compatibility.
On the basis of the conventional research on the navigation safety of manned ships, this paper mainly focuses on the characteristics of autonomous ships. First, analyzing factors compromising safety including perception ability, remote control ability, environmental risk factors and situation judgment management, a navigation risk evaluation index system is established based on a more comprehensive perspective of “Man-Ship-Environment-Management”. Second, the entropy weight method is used to calculate the navigation risk evaluation index weights. Subsequently, the Technique for Order Preference by Similarity to an Ideal Solution (TOPSIS) and the coupling coordination degree model are deployed to analyze the interaction between the index factors in two dimensions, so as to obtain the evaluation grade of autonomous ships’ navigation risk. Moreover, TOPSIS is a method of ranking according to the proximity between a limited number of evaluation objects and the idealized target. This proximity helps in evaluating the relative advantages and disadvantages of the existing objects. The coupling coordination degree model is used to analyze the coordinated development level of objects. Thus, the coupling degree refers to the interaction between two or more objects and the dynamic relationship between them to achieve coordinated development, which can reflect the degree of interdependence and mutual restriction between objects. Finally, scientific countermeasures and suggestions can be put forward according to the evaluation results. As there are not many autonomous ships in operation today, ordinary ship accidents have been considered as autonomous ship accidents in this paper.
3. Navigation Risk Assessment of Autonomous Ships Based on Entropy–TOPSIS–Coupling Coordination Model
3.1. Construction of Navigation Risk Assessment Index
Generally, the expert survey method [21], namely the Delphi method, is used to construct the navigation safety risk evaluation index system.
First, according to the expert opinion consultation, this paper analyzed traditional ships accident statistics from 2001 to 2021. Then, 609 traditional ship accident data were transformed into 262 accident data that match autonomous ships. In the specific research process, 10 experts were selected and two expert groups were established. The first group of experts includes the investigators of the maritime agency, the staff engaged in ship management, the staff engaged in the safety management of the classification society, the researchers of the Academy of Water Sciences, the captain of ocean transportation, etc. The selected experts have more than 10 years of work and management experience and have a deep understanding of traditional ship and modern intelligent ship navigation risk management. The second group of experts includes professors and associate professors of well-known maritime colleges, senior engineers of the Institute of Unmanned Ships, researchers of the Institute of Ship Management and senior engineers of the Institute of Ship Design. This paper first counts 609 maritime traffic accidents caused by ships, people, environment and management from 2001 to 2021 released by the China Maritime Safety Administration in a period of years, forming the original data of traditional ship navigation safety accidents. Then, expert group 1 analyze the specific risk factors causing these accidents from four aspects: navigation environment perception (ship), remote control center (person), environment and emergency management. Then, expert group 2 analyze the risk factors obtained by the first group again and then analogize and match the extracted risk factors with the autonomous ship to find out the risk factors that may cause the maritime traffic accidents of the autonomous ship in line with the characteristics of the autonomous ship. Finally, through the comparison of the historical ship accident data obtained by two groups of experts, 262 maritime traffic accidents in line with the characteristics of autonomous ships are indirectly obtained. It should be noted in particular that autonomous ships engaged in maritime transportation in the real sense are still under continuous research. In order to facilitate the research, only relevant risk factors can be extracted from historical data and relevant assumptions can be processed, just to verify the effectiveness of the model.
Then, the Delphi method [22] was applied to screen, simplify and synthesize the risk index. Specifically, the number of accidents caused by ship factors, shore-based remote control factors, environment factors and emergency management factors in each year are counted as . Here, j is the year (1 to n = 21) and i is the risk factors identified in Section 2 (1 to m = 4). Therefore, the risk factors index matrix can be defined as :
The relative occurrence of one type of accident in a given year compared to all accidents in the period of the same type is as follows:
3.2. Calculation of Navigation Risk Factors Index Weight
The entropy weight method [23,24] has the advantage of being able to find the inherent information in the risk factors index when calculating the weight of each indicator apart. At the same time, it can screen the evaluated indicators, and the calculated weights are relatively objective. Therefore, the entropy weight method is used to calculate the navigation risk factors index weight.
In this section, the weight of the risk factors in year is calculated. The smaller the entropy value is, the greater the index weight will be.
First, the risk factors index matrix is normalized. The normative matrix is as follows:
where and and are the maximum and minimum values of .
The information entropy value of risk factors is as follows:
When , . The index weight of each of the risk factors is calculated by the information entropy as follows:
3.3. Calculation of Navigation Risk Comprehensive Evaluation Index and Coupling Coordination Degree
In practical applications, it is usually necessary to comprehensively consider the risk factors of the overall safety system of the ship. The management and the control of ship accidents has shown a trend of changing the vertical single point data statistics to horizontal composite data comprehensive analysis. Therefore, this paper combines the horizontal and vertical dimensions to comprehensively evaluate the navigation risk of autonomous ships.
Concretely, the comprehensive risk evaluation index represents the relative navigation risk, which belongs to the vertical dimension evaluation of navigation risk. It can analyze the trend of the navigation risk over time by calculating the value of each risk factor of the autonomous ships. The coupling coordination degree model [25,26,27] belongs to the internal horizontal evaluation of navigation risk. It comprehensively analyzes the coupling strength and coordinated development level of various risks, which can reflect the internal association between these risk factors and is used to analyze the weak links of navigation.
3.3.1. Calculation of Navigation Risk Comprehensive Evaluation Index
TOPSIS is a sorting method that approximates the ideal solution [28,29,30,31,32,33] and it is widely used for the comparison and selection of multiple schemes and indicators. Basically, according to the distance between the optimal solution and the positive and negative ideal solutions, the priority is ranked based on the combination of these two distance measures.
First, the weighted matrix is calculated as follows:
Secondly, determine the optimal solution and the worst solution of the weighted value of risk factors :
Then, calculate the Euclidean distance between the weighted value of year j and the optimal solution and the worst solution as , , respectively:
Finally, the TOPSIS model is used to calculate the comprehensive evaluation index of the navigation risk of autonomous ships in the year j and rank them.
Here, .
3.3.2. Calculation of Coupling Coordination Degree
The coupling coordination degree model is used to analyze the coordinated development level of objects, involving the calculation of three index values, namely, the coupling degree , the comprehensive coordination index and the coupling coordination degree . Finally, the coupling coordination degree of each item is evaluated according to the value of .
First, calculate the coupling degree of accidents caused by multiple risk factors in the year j [28]:
Here, is the adjustment coefficient, indicating the number of coupling risk factors. is the product of the probability of dangerous accidents occurring in any pair of coupled subsystems. The sum under the division is over i; the sum over the division is over i and i′ both. This indicator is mainly used to evaluate the coupling degree between these risk factors. The greater the coupling degree, the more likely the accident will occur.
Secondly, calculate the comprehensive coordination index of the relative probability of accident in the year j:
This indicator reflects the orderly and disorderly development of autonomous ships’ navigation risks every year.
Finally, the coupling coordination degree of autonomous ships’ navigation risk in the year j is computed. This indicator is mainly used to evaluate the coupling degree and orderly development of autonomous ships’ navigation risks every year. The calculation formula is as follows:
The calculation process of the proposed autonomous ships risk assessment method is shown in Figure 1.
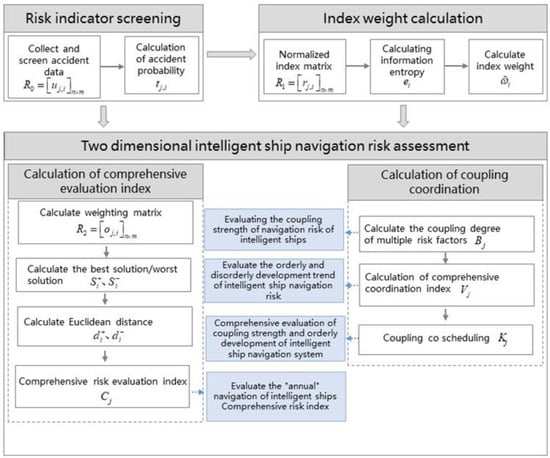
Figure 1.
Calculation process of the Entropy–TOPSIS–Coupling coordination model.
4. Experiments and Analysis
4.1. Analysis of the Initial Data
To verify the effectiveness of the proposed evaluation method, simulations were executed on historical navigation accidents statistic data.
First, accidents caused by Ship (P)–Man (remote control factors, R)–Environment (E)–Management (M) from 2001 to 2021 were collected as the initial data of traditional ship navigation accidents, as shown in Table 1 and Figure 2. Secondly, by consulting experts, we confirmed the specific risk factors from four main factors: ship factors (P), shore-based remote control factors (R), environment factors (E) and emergency management factors (M). Then, 609 traditional ship accident data were transformed into 262 accident data that match autonomous ships, as shown in Table 2 and Figure 3. Before 2010, ships still lacked autonomous auxiliary equipment. With the development of science and technology, more autonomous auxiliary equipment was used on traditional ships. We also know that, when these intelligent devices were first put into use, both the proficiency of the operators and the defects of the equipment itself were not mature, so the maritime traffic accidents caused by them also increased. With the continuous proficiency in operation and the improvement of some equipment defects in the process of use, the resulting maritime traffic accidents also decreased. That is to say, in the statistical data, there was a peak around 2010. By analogy, it can be predicted that the number of accidents that may occur in the initial stage of the development of smart ships will increase in the future and will peak at a certain time. With the continuous improvement and maturity of relevant technologies, the number of accidents will decline.

Table 1.
Initial statistics of traditional ship navigation accidents.
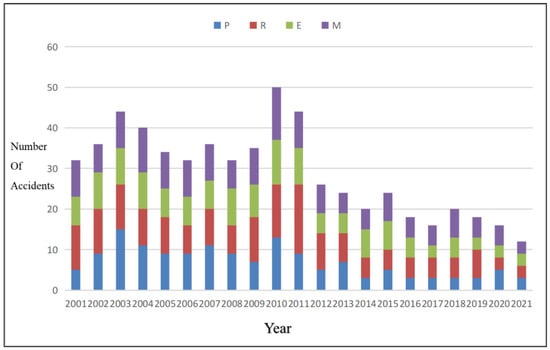
Figure 2.
Statistics of traditional ship accidents caused by corresponding risk factors.
Table 2.
Statistics of autonomous ship navigation accidents.

Figure 3.
Statistics of autonomous ship accidents caused by corresponding risk factors.
The following can be seen from the statistical results in Table 1 and Table 2: (1) From 2001 to 2021, the number of navigation accidents caused by man factors (R) was the largest, which is 169 in Table 1 and 74 in Table 2. It shows that, for both traditional ships and autonomous ships, the influence of human factors cannot be ignored; (2) The impact of environmental factors (E) on marine traffic did not decrease significantly with the development of science and technology, but increased in a certain period of time.
4.2. Analysis of the Vertical Evaluation Results
The comprehensive risk evaluation index reflects the degree of navigation safety, which belongs to the vertical evaluation dimension. The smaller the value is, the more unsafe the navigation is. As shown in Table 3 and Figure 4, the comprehensive risk evaluation index declines first, reaches a minimum and then shows an upward trend. Therefore, it can be predicted that the number of autonomous ship navigation accidents will increase at the initial stage, and there will be a peak at a certain period. With the continuous improvement of related technologies, the number of accidents will decline. Because the data screened by the research institute are highly related to the marine traffic accident data of autonomous ships, they can reflect one of the conditions of autonomous ships to a certain extent. The comprehensive risk assessment index reflects the size of navigation safety. The smaller the score is, the more unsafe the navigation is. As shown in the study, the comprehensive risk assessment index was the smallest in 2010 and 2011, indicating that more maritime traffic accidents occurred at that time, which is also consistent with the specific study. After 2011, the comprehensive risk assessment index increased, indicating that the number of maritime traffic accidents also decreased.
Table 3.
Ranking of the comprehensive risk evaluation index .
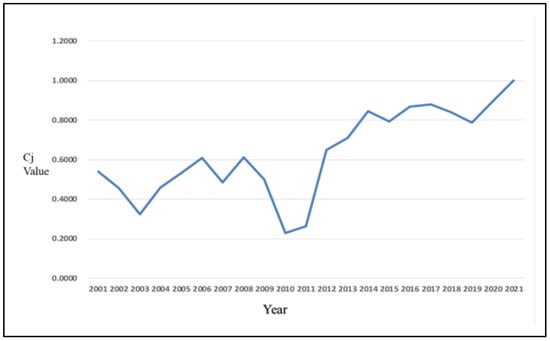
Figure 4.
Visualization of the comprehensive risk evaluation index .
4.3. Analysis of the Horizontal Evaluation Results
The coupling coordination degree is mainly used for the horizontal evaluation of navigation risks. According to the Equations (10)–(12), the results are shown in Table 4, Table 5, Table 6, Table 7 and Table 8, and the visualization results are shown in Figure 5, Figure 6 and Figure 7. The results show the following: (1) The coupling of two factors presents a weak coupling degree, while the coupling of three and four factors is generally in a strong coupling degree. In two-factor coupling, the coupling degree of E-M is the largest. Moreover, in three-factor coupling, the coupling degree of R-E-M is the largest. These two conditions are the most likely to cause navigation accidents. (2) Referring to the coupling coordination index between risks before 2010, it presents a large value, which represents a high degree of consistency between these risks in the development process and will increase the probability of accidents. After 2010, the degree of consistency between risks gradually decreased, while the risks gradually changed from orderly development to disorderly development, and the navigation became safer. (3) The coupling coordination degree of two factors is smaller than that of three factors. Moreover, the coupling coordination degree of three factors is smaller than that of four factors. (4) The coupling coordination degree related to ship factors is generally small, which indicates that, with the development of science and technology, the impact of scientific and technological risks will be much smaller. (5) Environment factors are important to increase the coupling coordination degree, which indicates that environment factors are still the weak link of autonomous ships’navigation safety in the future. Moreover, it is followed by emergency management factors, shore-based remote control factors and ship factors.
Table 4.
The coupling degree of two risk factors.
Table 5.
The coupling degree of three risk factors and four risk factors.
Table 6.
The comprehensive coordination index .
Table 7.
The coupling coordination degree of two risk-factors.
Table 8.
The coupling coordination degree of three risk factors and four risk factors.
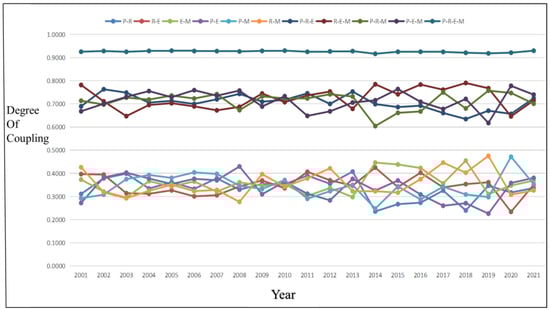
Figure 5.
Visualization of coupling degree calculation results.
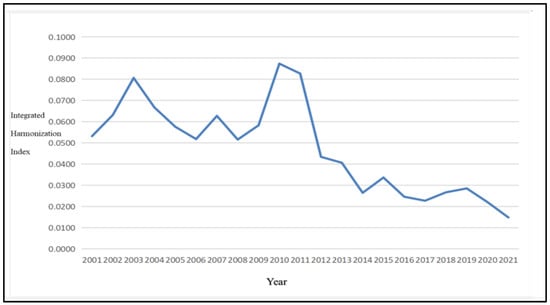
Figure 6.
Visualization of comprehensive coordination index calculation results.
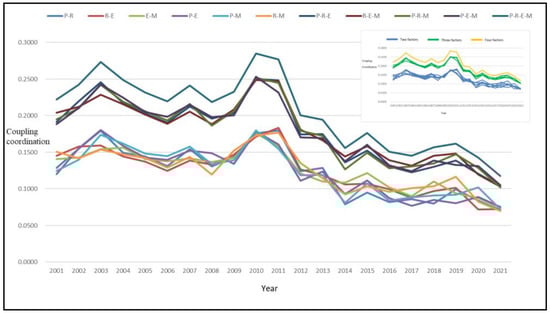
Figure 7.
Visualization of coupling coordination degree calculation results.
5. Discussion and Conclusions
A comprehensive risk assessment method for autonomous ship navigation based on an Entropy–TOPSIS–Coupling coordination model is proposed in this paper. The coupling of two factors presents a weak coupling degree, while the coupling of three and four factors generally generates a strong coupling degree. The two cases of E-M and R-E-M are the most likely to produce accidents under the coupling conditions of various multi-risk factors. The coupling coordination degree of two factors is smaller than that of three factors. Moreover, the coupling coordination degree of three factors is smaller than that of four factors, which conforms to the general law of the development of things. The coupling coordination degree related to ship factors is generally small, which indicates that, with the development of science and technology, the impact of scientific and technological risks will be smaller and smaller.
However, this paper still has some shortcomings and further research needs to be conducted. With the use of historical accident statistics of traditional manned ships to simulate autonomous ships, the evaluation results may not always conform with the actual situation. Further research should be mounted to verify the applicability of the presented method in specific actual scenarios. With a large number of sea trial data, the development of autonomous ships will gradually mature and form a high-quality autonomous shipping system.
Author Contributions
Data curation, Y.Z.; writing—original draft, W.Z. All authors have read and agreed to the published version of the manuscript.
Funding
This research was funded by the National Natural Science Foundation of China (52231014) and LiaoNing Revitalization Talents Program (XLYC1902071).
Institutional Review Board Statement
Not applicable.
Informed Consent Statement
Not applicable.
Data Availability Statement
Not applicable.
Conflicts of Interest
The authors declare no conflict of interest.
References
- Felski, A.; Karolina, Z. The ocean-going autonomous ship-challenges and threats. J. Mar. Sci. Technol. 2020, 8, 41. [Google Scholar] [CrossRef]
- Montewka, J.; Wróbel, K.; Heikkilä, E.; Valdez Banda, O.; Goerlandt, F.; Haugen, S. Challenges, solution proposals and research directions in safety and risk assessment of autonomous shipping. Probabilistic Saf. Assess. Manag. 2018, 14, 16–21. [Google Scholar]
- Bratić, K.; Pavić, I.; Vukša, S.; Stazi´c, L. Review of Autonomous and Remotely Controlled Ships in Maritime Sector. Trans. Marit. Sci. 2019, 8, 253–265. [Google Scholar] [CrossRef]
- Lee, M.C.; Nieh, C.Y.; Kuo, H.C.; Huang, J.C. An automatic collision avoidance and route generating algorithm for ships based on fifield model. J. Mar. Sci. Technol. 2019, 27, 101–113. [Google Scholar] [CrossRef]
- Zhou, X.Y.; Liu, Z.J.; Wang, F.W.; Wu, Z.L. A system-theoretic approach to safety and security co-analysis of autonomous ships. Ocean. Eng. 2021, 222, 108569. [Google Scholar] [CrossRef]
- Chen, W.J. Vessel Security and Management; Dalian Maritime University: Dalian, China, 1998. [Google Scholar]
- Wu, Z.L. Maritime Traffic Safety Assessment Method; Dalian Maritime University: Dalian, China, 1997. [Google Scholar]
- Liu, W.; Sun, L.; Chen, F.; Zhang, H.; Jin, Y. Risk Assessment and Control of Inland Ships Navigation Safety—A case study of shanghai inland waters. In Proceedings of the IEEE International Conference on Service Operations & Logistics & Informatics, Sydney, Australia, 24–27 July 2016. [Google Scholar] [CrossRef]
- Zhao, S.T.; Tang, Q.R. Review on Methods of Marine Traffic Safety. J. Guangzhou Marit. Inst. 2015, 23, 5–8. [Google Scholar]
- Hu, Y.C.; Huang, H.Y.; Yu, J.X. Research of risk assessment on ocean platforms based on probabilistic influence diagram. Shipbuild. China 1998, 3, 38–46. [Google Scholar]
- Wang, F.W.; Yin, Z.X.; Xu, Y.S.; Liu, S.H. Synthetic analysis of the safety assessment methods for ships navigation in heavy sea. J. Saf. Environ. 2021, 21, 475–482. [Google Scholar] [CrossRef]
- Endrina, N.; Rasero, J.C.; Konovessis, D. Risk analysis for RoPax vessels: A case of study for the Strait of Gibraltar. Ocean. Eng. 2018, 151, 141–151. [Google Scholar] [CrossRef]
- Wang, F.W.; Wu, Z.L.; Zheng, Z.Y. Safety evaluation of beginning voyage ship in heavy weather. J. Traffic Transp. Eng. 2004, 4, 104–107. [Google Scholar] [CrossRef]
- Zhang, J. Risk degree assessment of navigating ship on heavy sea based on grey relational analysis. Meteorol. Hydrol. Mar. Instrum. 2013, 30, 17–20. [Google Scholar] [CrossRef]
- Merrick, J.R.; Van Dorp, R. Speaking the truth in maritime risk assessment. Risk Anal. 2006, 26, 223–237. [Google Scholar] [CrossRef]
- Fan, C.; Wróbel, K.; Montewka, J.; Gil, M.; Wan, C.P.; Zhang, D. A framework to identify factors influencing navigational risk for Maritime Autonomous Surface Ships. Ocean. Eng. 2020, 202, 107188. [Google Scholar] [CrossRef]
- Zhang, M.; Zhang, D.; Yao, H.; Zhang, K. A probabilistic model of human error assessment for autonomous cargo ships focusing on human–autonomy collaboration. Saf. Sci. 2020, 130, 104838. [Google Scholar] [CrossRef]
- Krzysztof, W.; Jakub, M.; Pentti, K. Towards the development of a system-theoretic model for safety assessment of autonomous merchant vessels. Reliability Eng. Syst. Saf. 2018, 178, 209–224. [Google Scholar] [CrossRef]
- Zhang, X.X.; Zhang, Q.N.; Yang, J.; Cong, Z.; Luo, J.; Chen, H.W. Safety risk analysis of unmanned ships in inland rivers based on a fuzzy Bayesian network. J. Adv. Transp. 2019, 2019, 4057195. [Google Scholar] [CrossRef]
- Karahalios, H. The severity of shipboard communication failures in maritime emergencies: A risk management approach. Int. J. Disaster Risk Reduct. 2018, 28, 1–9. [Google Scholar] [CrossRef]
- Akyuz, E.; Celik, E. The role of human factor in maritime environment risk assessment: A practical application on Ballast Water Treatment (BWT) system in ship. Hum. Ecol. Risk Assess. Int. J. 2018, 24, 653–666. [Google Scholar] [CrossRef]
- Thieme, C.A.; Utne, I.B.; Haugen, S. Assessing Ship risk model applicability to marine autonomous surface ships. Ocean. Eng. 2018, 165, 140–154. [Google Scholar] [CrossRef]
- Yang, J.Y.J.; Zhang, L.Z.L. Fuzzy Comprehensive Evaluation Method on Water Environmental Quality based on Entropy Weight with Consideration of Toxicology of Evaluation Factors. Adv. Mater. Res. 2012, 356–360, 2383–2388. [Google Scholar] [CrossRef]
- Liu, C.G.; Chu, X.M.; Wu, W.X.; Li, S.L.; He, Z.B.; Zheng, M.; Zhou, H.M.; Li, Z.X. Human–machine cooperation research for navigation of maritime autonomous surface ships: A review and consideration. Ocean. Eng. 2022, 246, 110555. [Google Scholar] [CrossRef]
- Ramos, M.A.; Thieme, C.A.; Utne, I.B.; Mosleh, A. Human-system concurrent task analysis for maritime autonomous surface ship operation and safety. Reliab. Eng. Syst. Saf. 2020, 195, 106697. [Google Scholar] [CrossRef]
- Xue, J.; Chen, Z.J.; Papadimitriou, E.; Wu, C.Z.; Gelder, P.H.A.J.M. Influence of environmental factors on human-like decision-making for intelligent ship. Ocean. Eng. 2019, 186, 106060. [Google Scholar] [CrossRef]
- Chang, C.H.; Yu, Q.; Kontovas, C.A.; Yu, Q.; Yang, Z.L. Risk assessment of the operations of maritime autonomous surface ships. Reliab. Eng. Syst. Saf. 2021, 207, 107324. [Google Scholar] [CrossRef]
- Huang, W.C.; Shuai, B.; Sun, Y.; Li, M.; Pang, L. Evaluation of risk in railway dangerous goods transportation system by integrated entropy-TOPSIS-coupling coordination method. China Saf. Sci. J. 2018, 28, 134–138. [Google Scholar] [CrossRef]
- Hwang, C.L.; Yoon, K. Multiple Attribute Decision Marking: Methods and Applications; Springer-Verlag: New York, NY, USA, 1981. [Google Scholar]
- Chen, C. Extensions of the TOPSIS for group decision-making under fuzzy environment. Fuzzy Sets Syst. 2000, 114, 1–9. [Google Scholar] [CrossRef]
- Jin, Q.; Wu, Q.M. Application of TOPSIS Method in Continuous Scheme Multi-objective Decision Making. J. Hohai Univ. 1989, 1, 79–85. [Google Scholar]
- Braglia, M.; Frosolini, M.; Montanari, R. Fuzzy Topsis approach for failure mode, effects and criticality analysis. Qual. Reliab. Eng. Int. 2003, 19, 425–443. [Google Scholar] [CrossRef]
- Ramón-Canul, L.G.; Margarito-Carrizal, D.L.; Limón-Rivera, R.; Morales-Carrrera, U.A.; Rodriguez-Buenfil, I.M.; Ramírez-Sucre, M.O.; Cabal-Prieto, A.; Herrera-Corredor, J.A.; Ramírez-Rivera, E.D.J. Technique for order of preference by similarity to ideal solution (TOPSIS) method for the generation of external preference mapping using rapid sensometric techniques. J. Sci. Food Agric. 2021, 101, 3298–3307. [Google Scholar] [CrossRef]
Disclaimer/Publisher’s Note: The statements, opinions and data contained in all publications are solely those of the individual author(s) and contributor(s) and not of MDPI and/or the editor(s). MDPI and/or the editor(s) disclaim responsibility for any injury to people or property resulting from any ideas, methods, instructions or products referred to in the content. |
© 2023 by the authors. Licensee MDPI, Basel, Switzerland. This article is an open access article distributed under the terms and conditions of the Creative Commons Attribution (CC BY) license (https://creativecommons.org/licenses/by/4.0/).